
Electrochemical Co-Degradation of Acetaminophen and Bisphenol A in Aqueous Solutions: Degradation Competition and Pathways


Abstract
1. Introduction
2. Materials and Methods
2.1. Chemicals and Solutions
2.2. Chemical Analysis
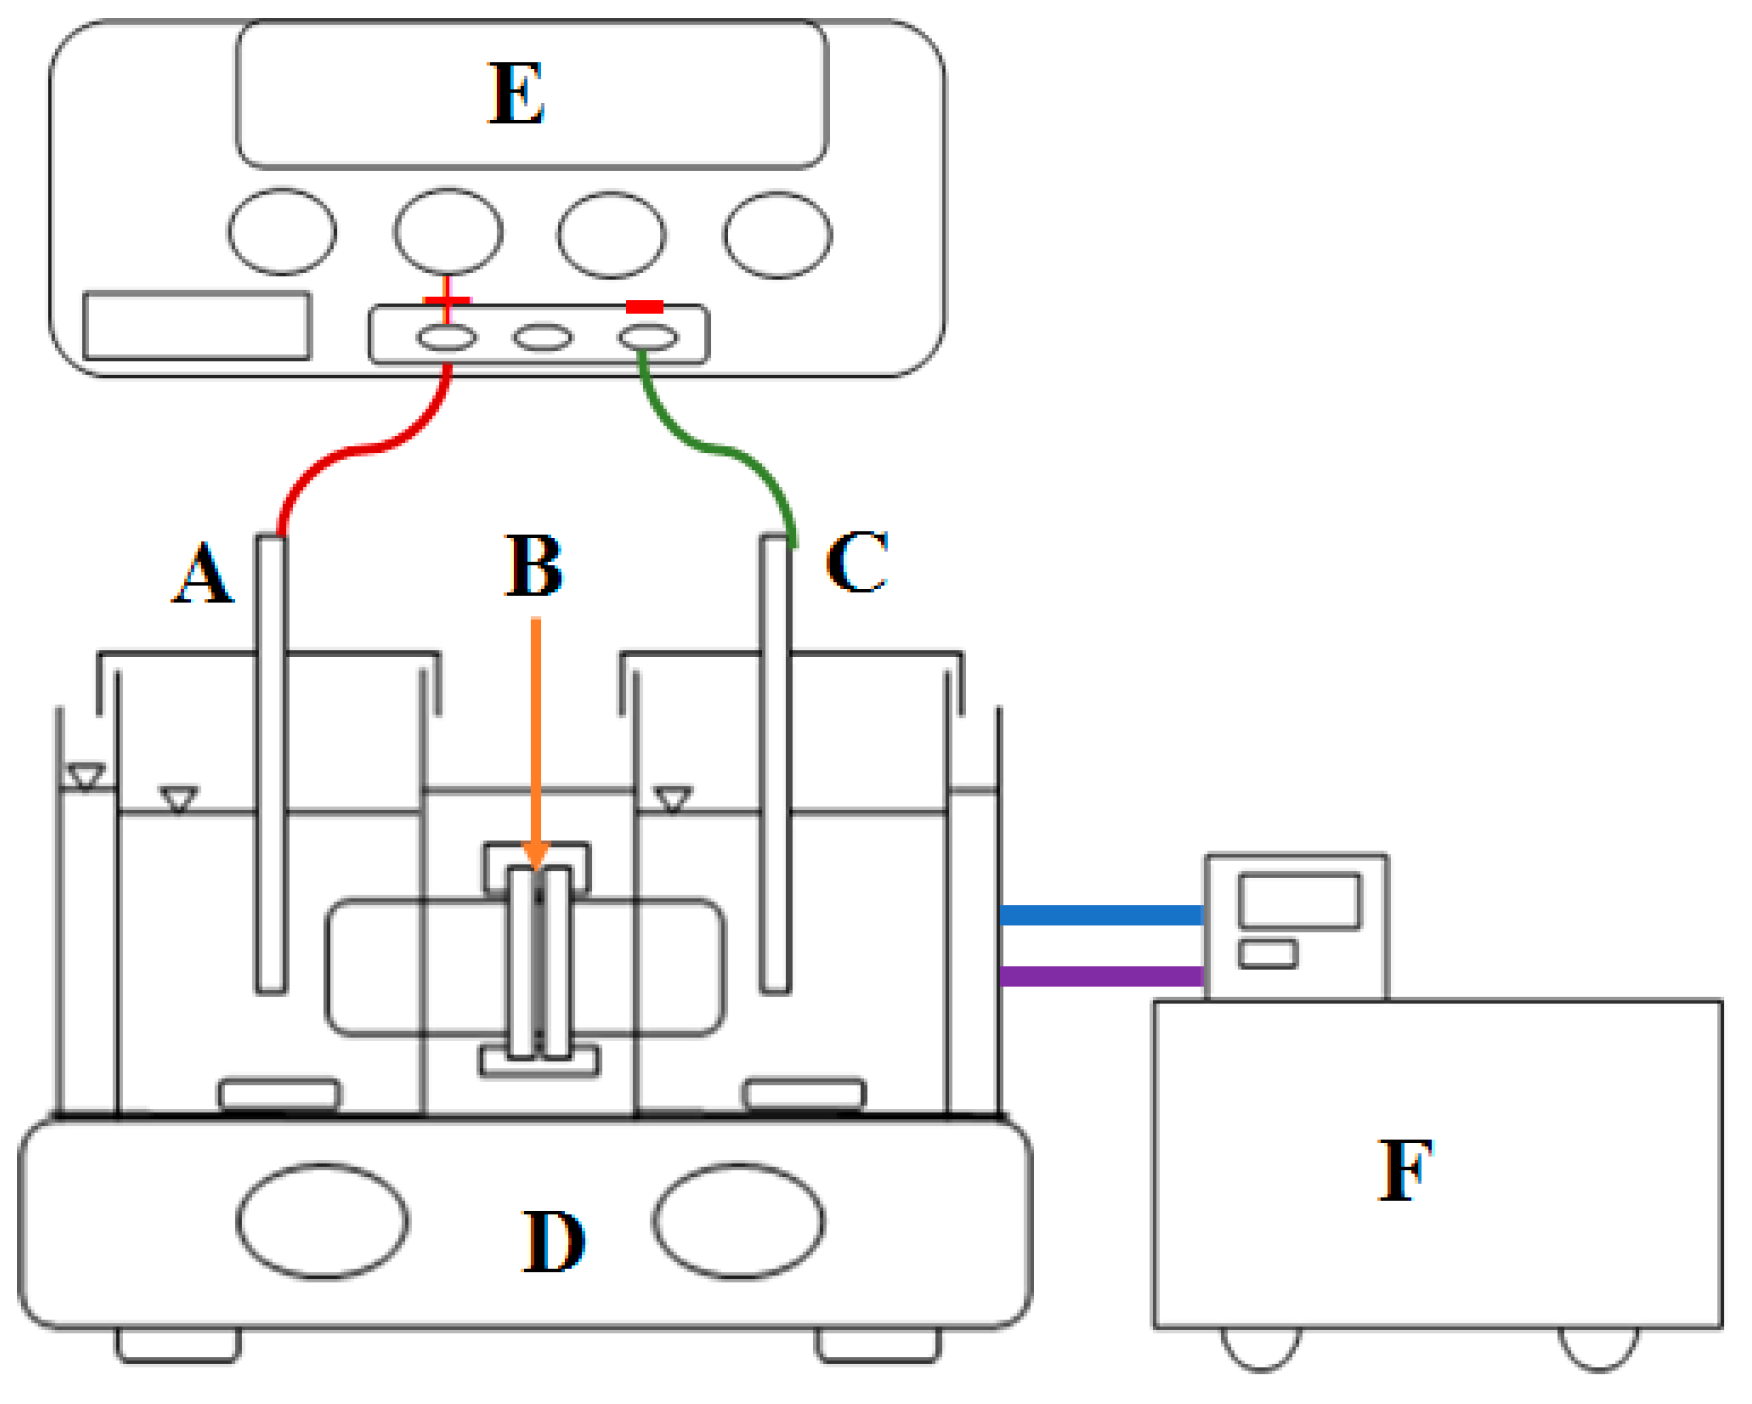
2.3. Electrochemical Analysis
2.4. Degradation Experiments
2.5. Degradation Efficiency, Mineralization Current Efficiency, and Pseudo-First-Order Rate Constant
3. Results and Discussion
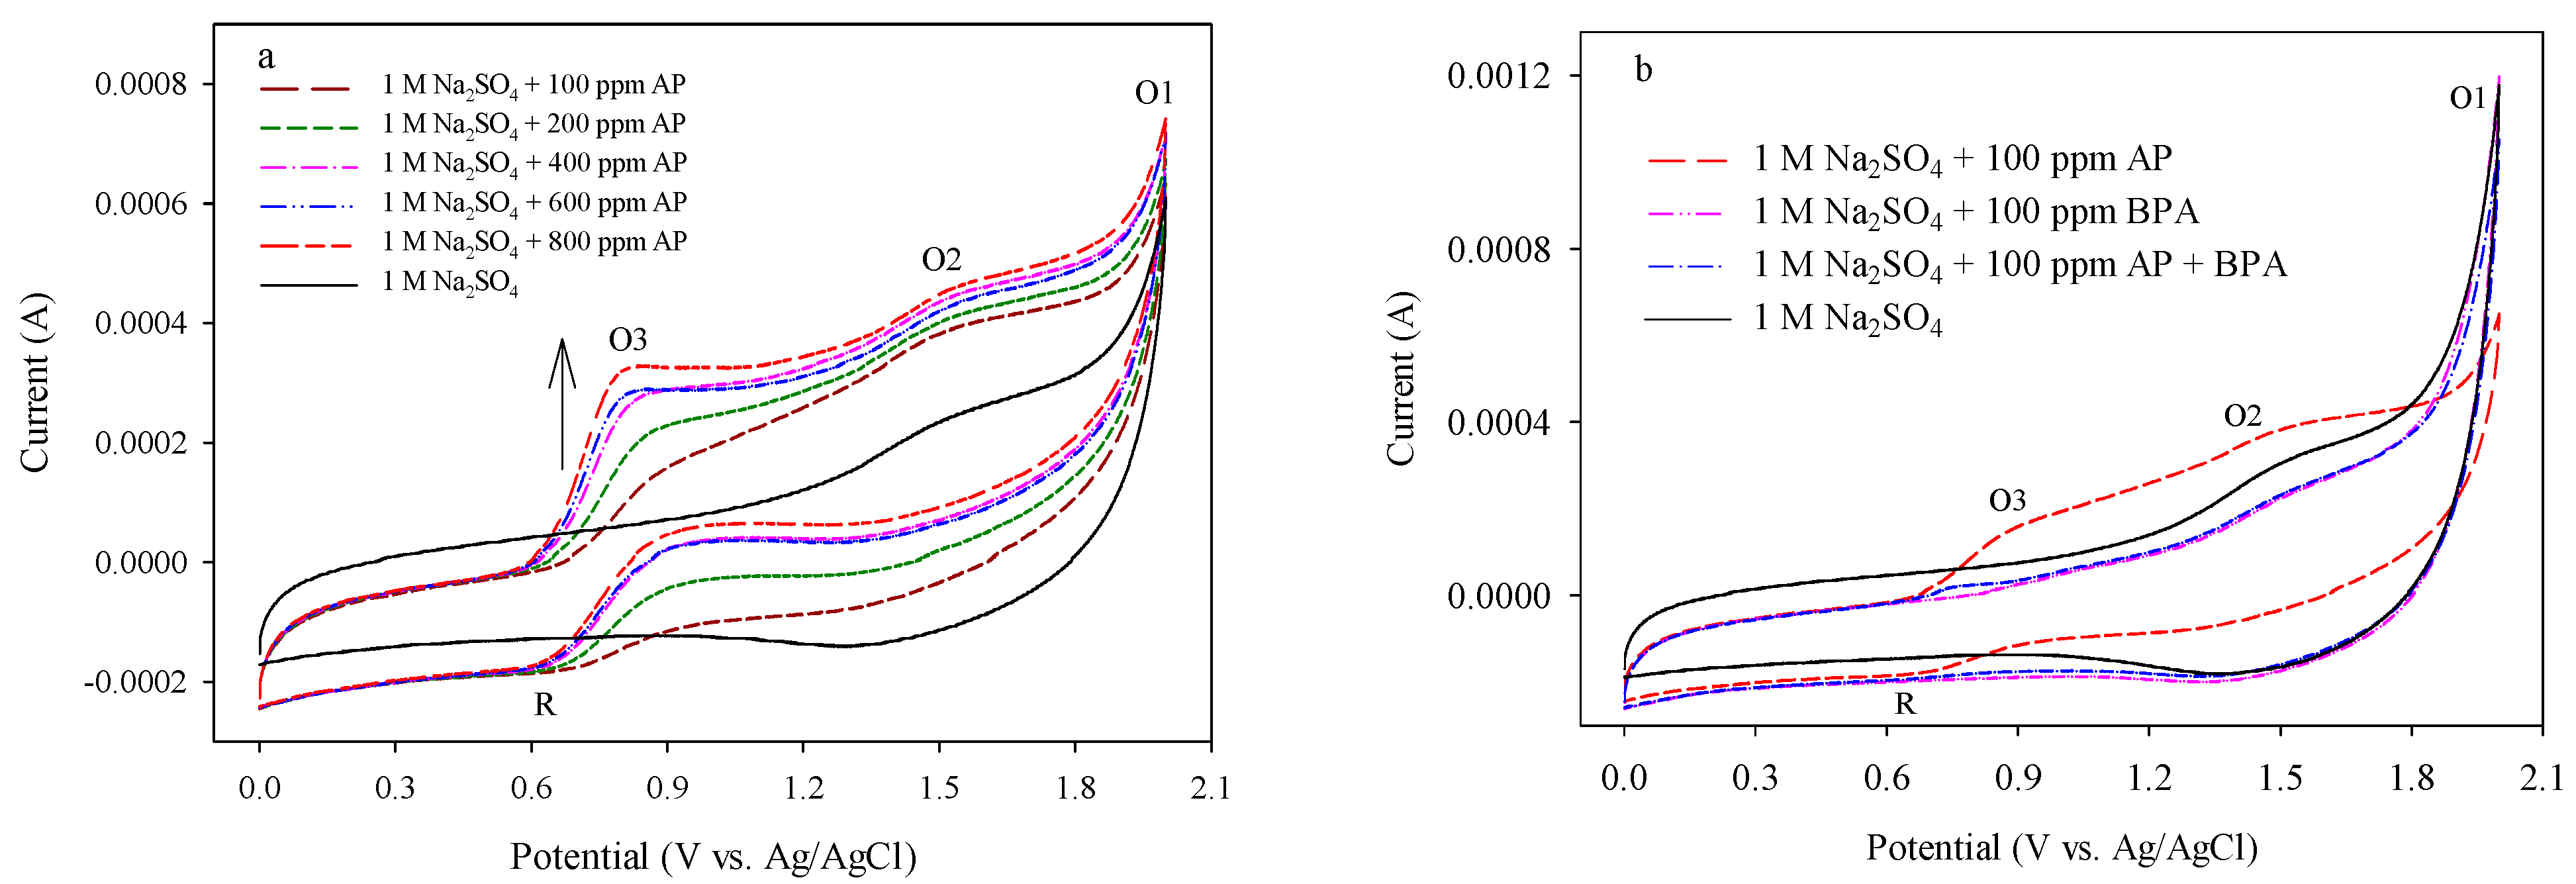
3.1. CV Analyses for Target Compounds
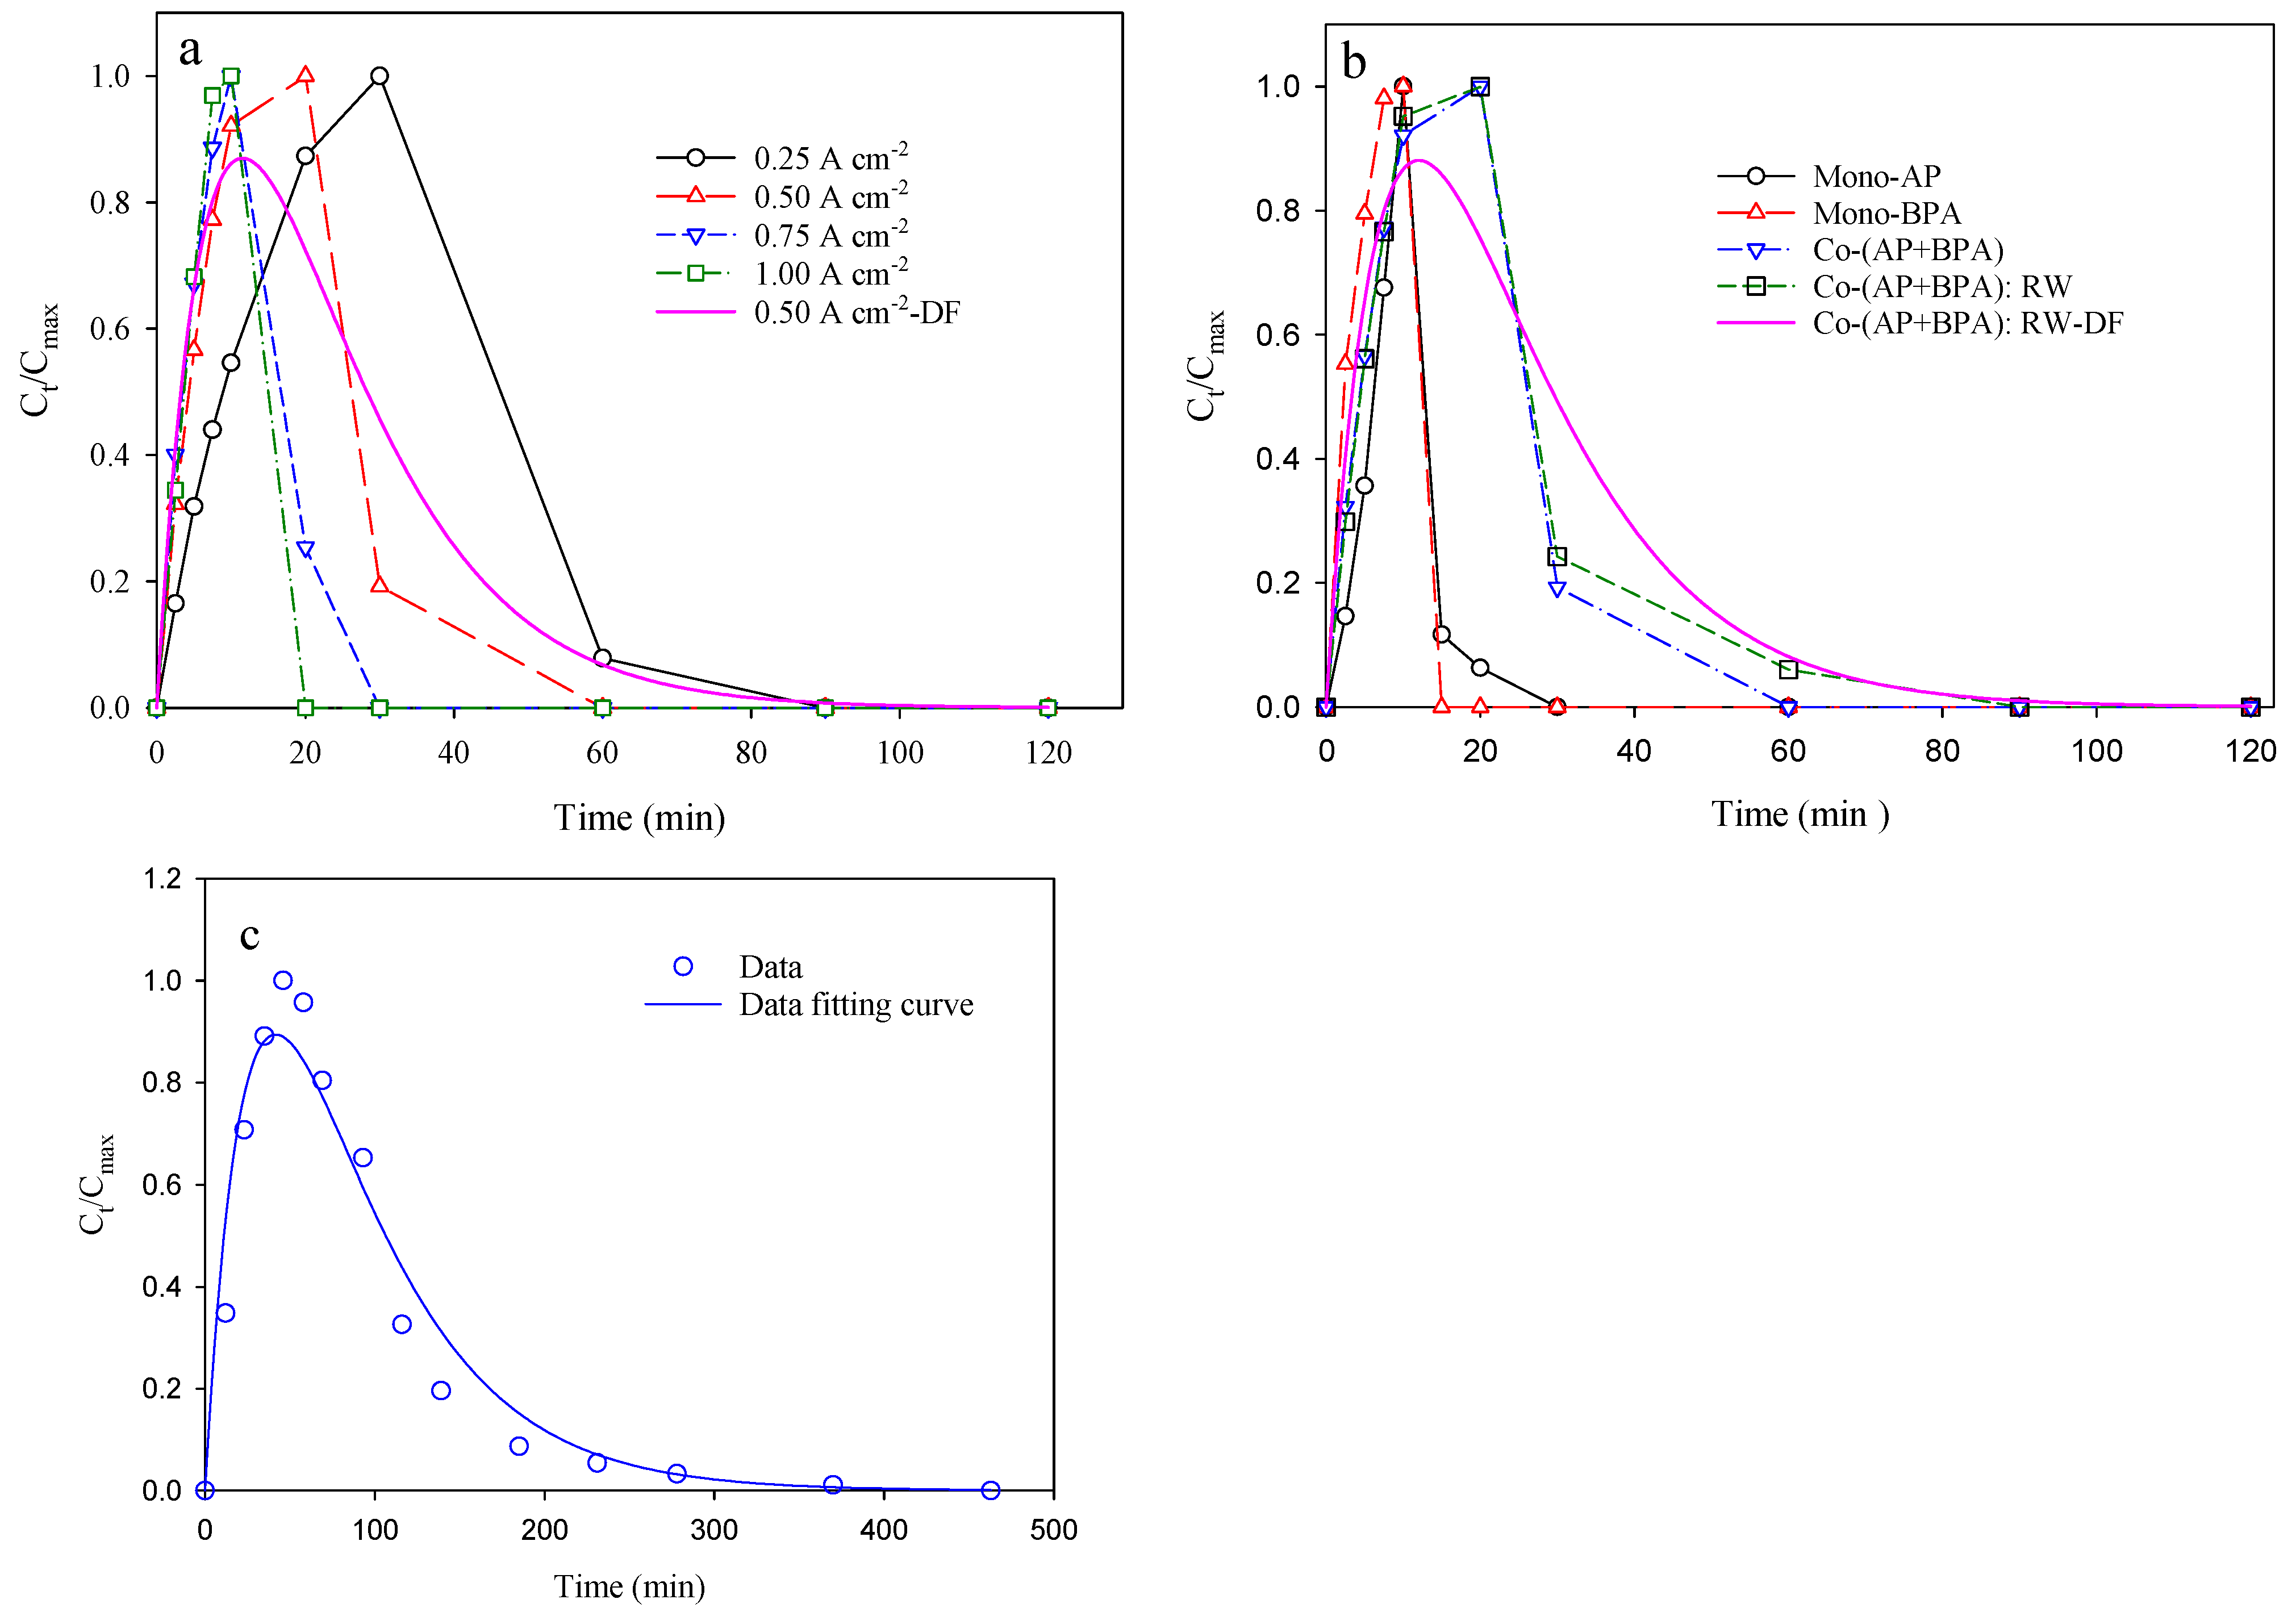
3.2. Effect of Current Density on Electrochemical Degradation of Target Compounds
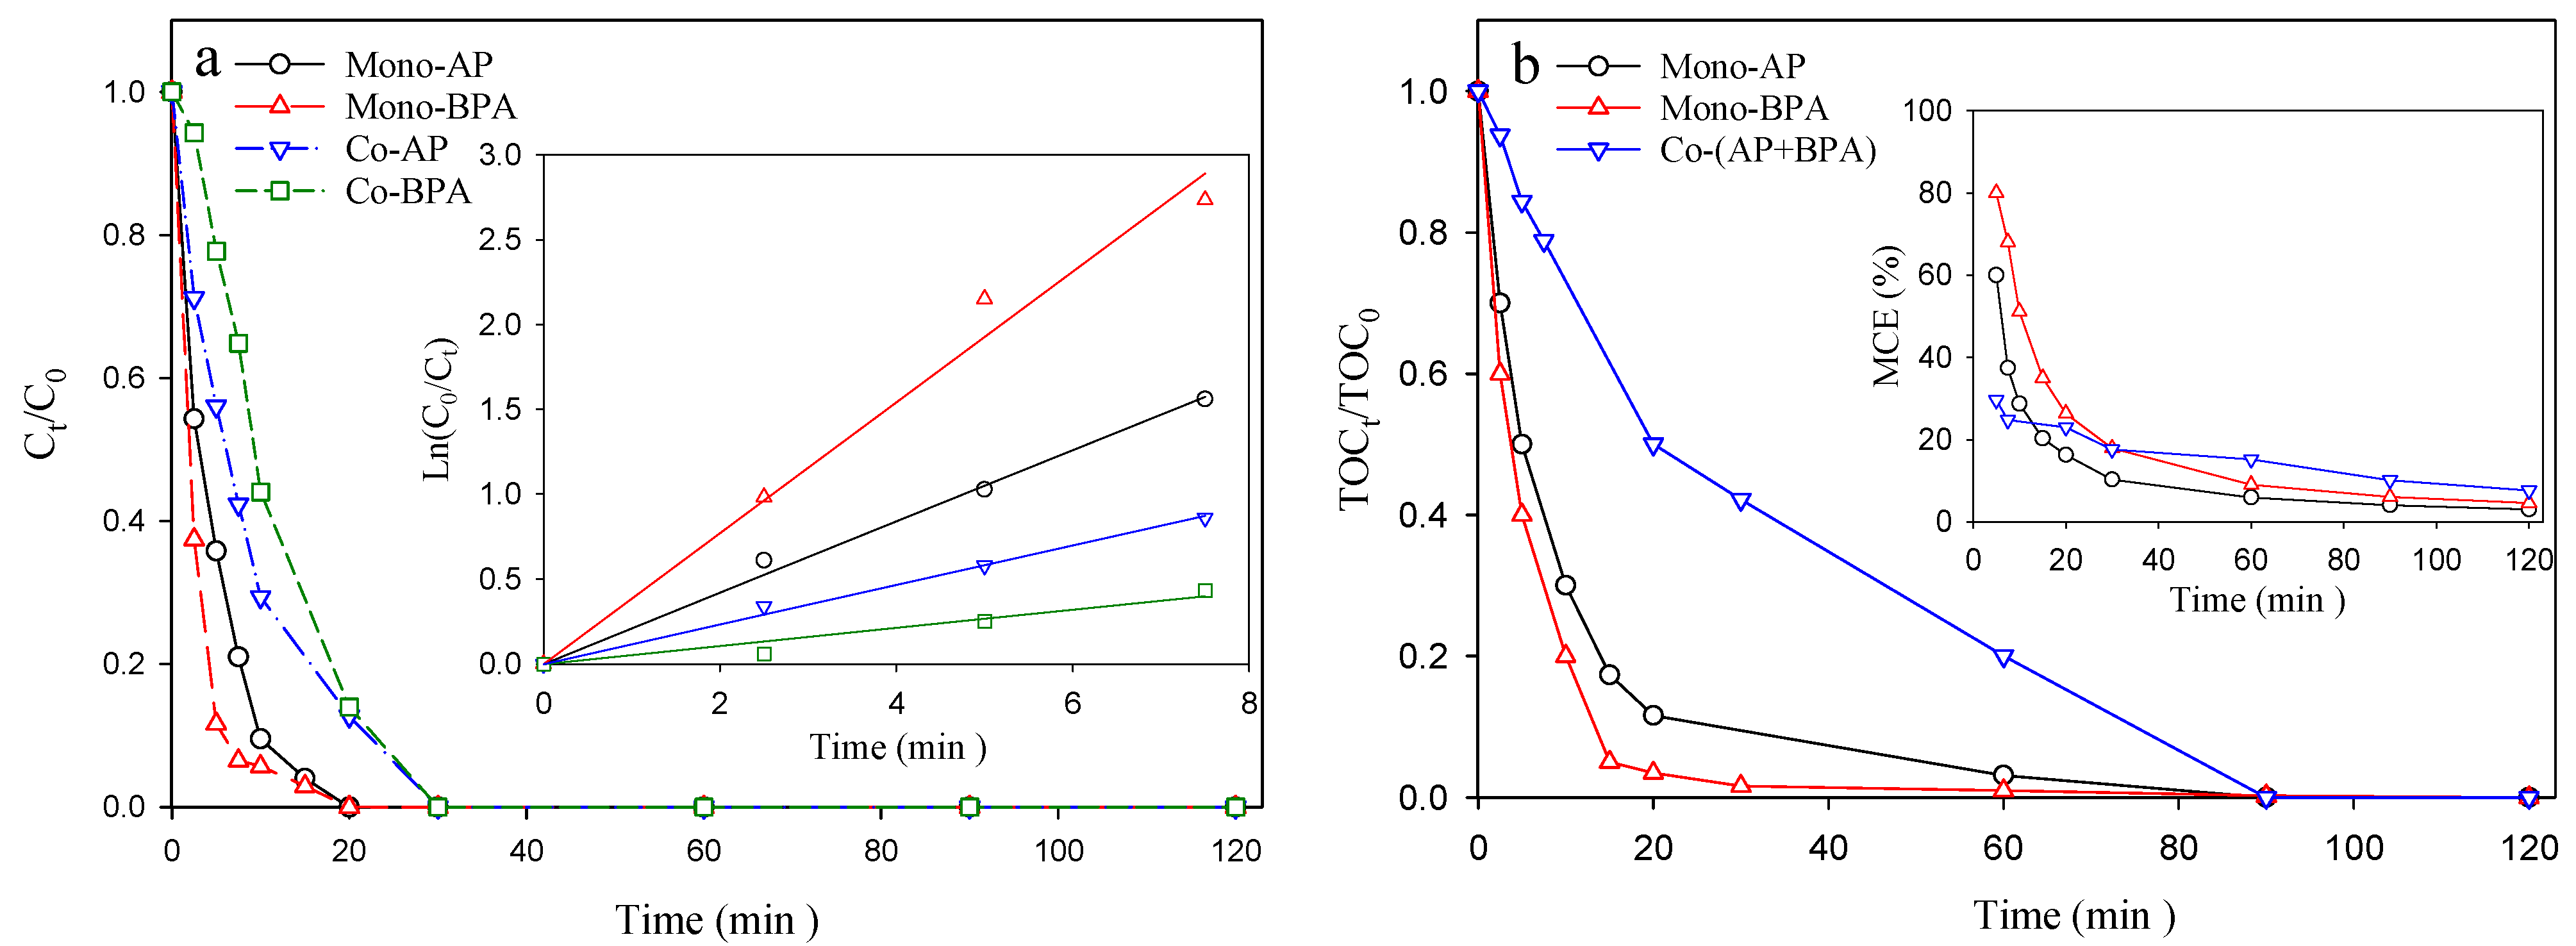
3.3. Mono- vs. Co-Degradation, Na2SO4 vs. River Water, and pBQ Concentration Variation
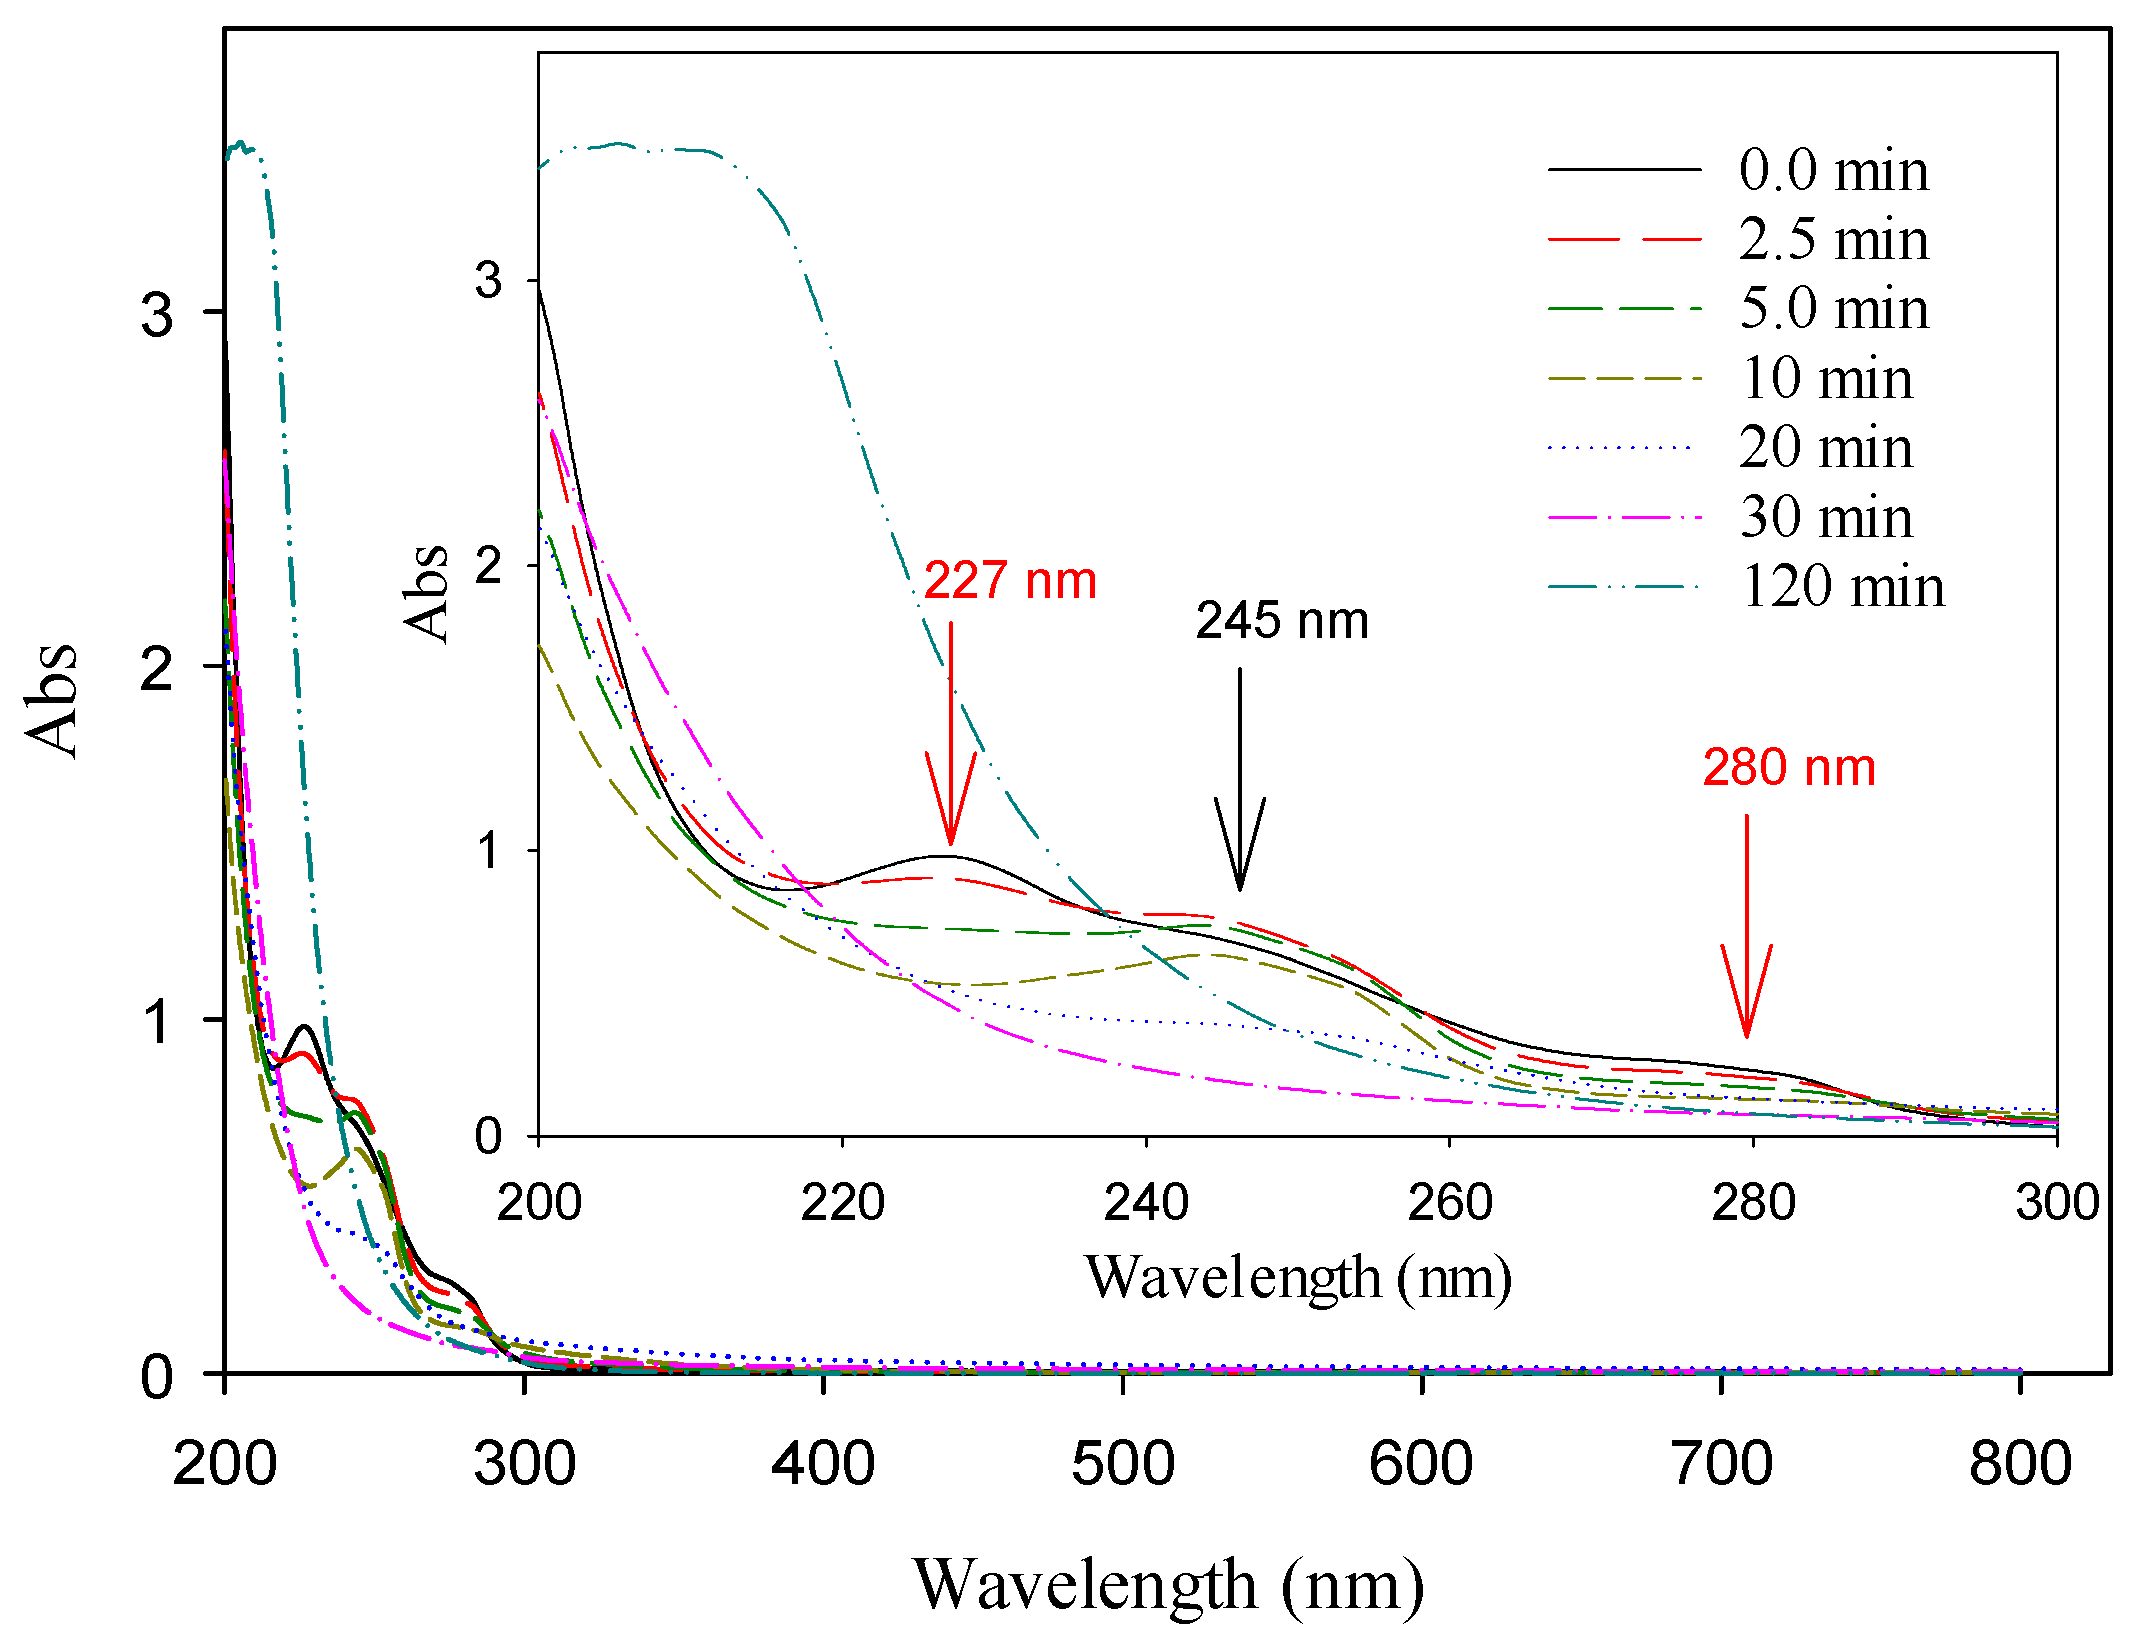
3.4. UV-Vis and EEM Analyses of Target Compounds in Electrolysis
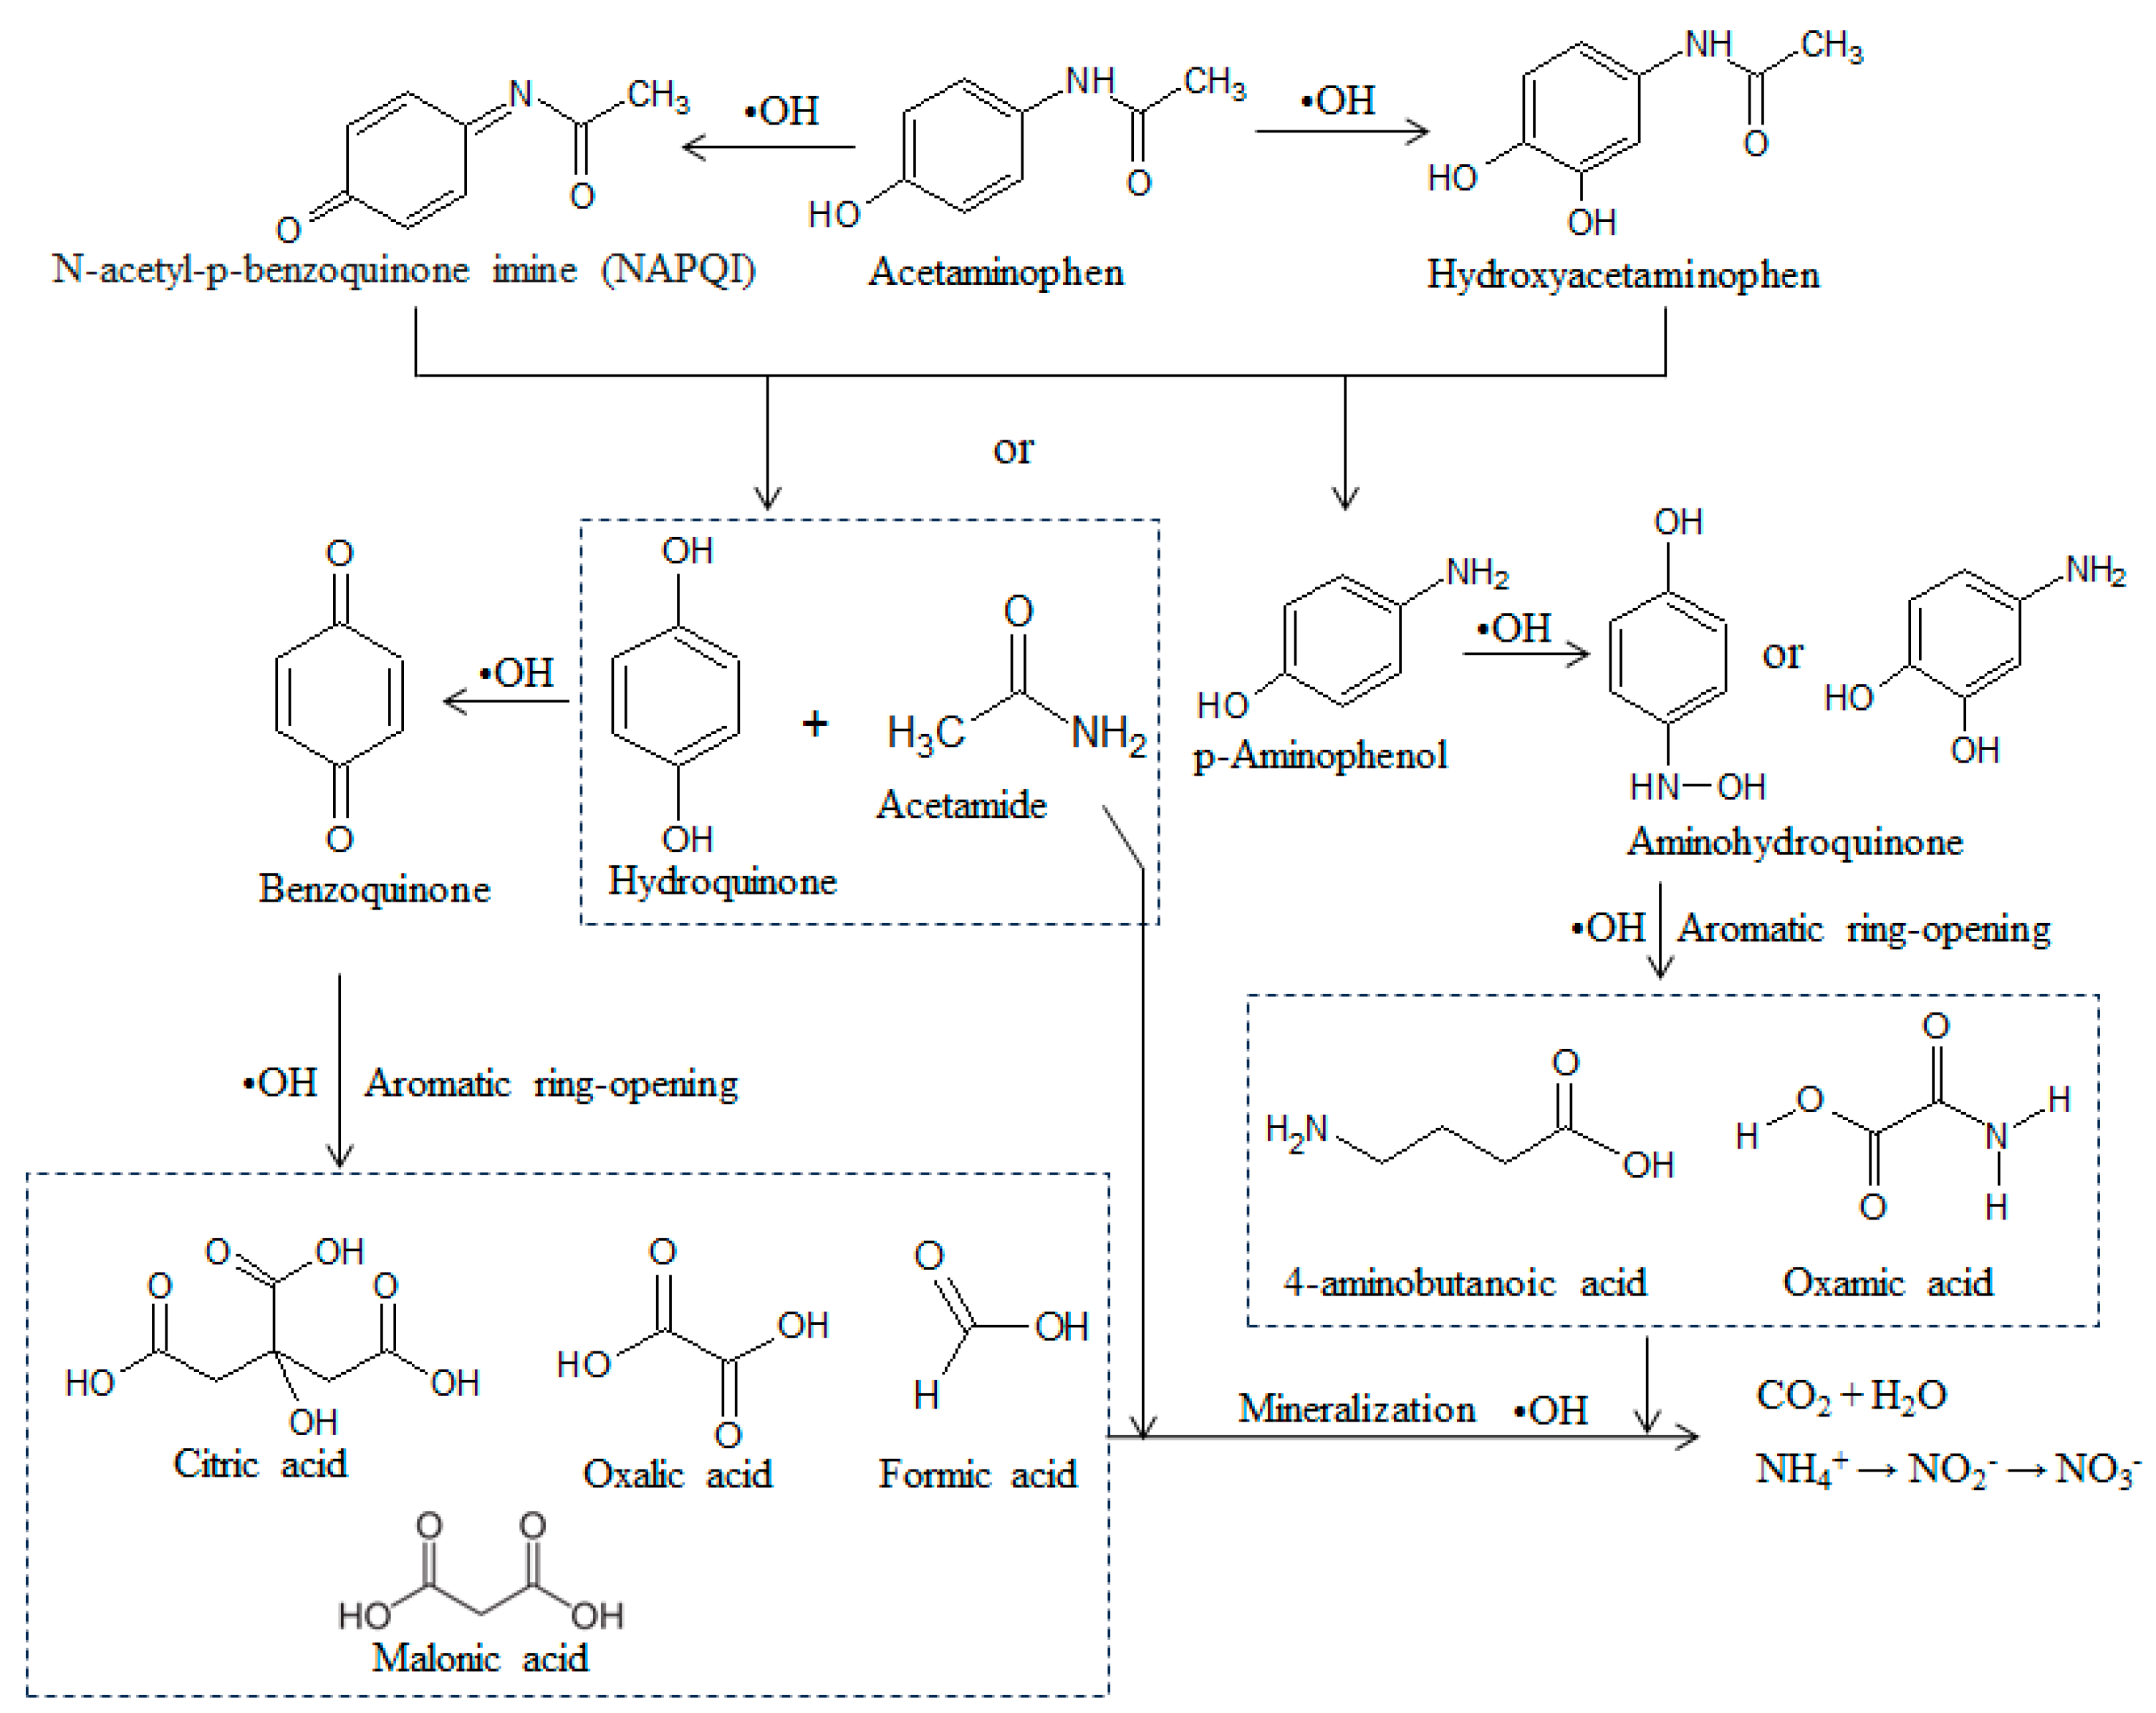
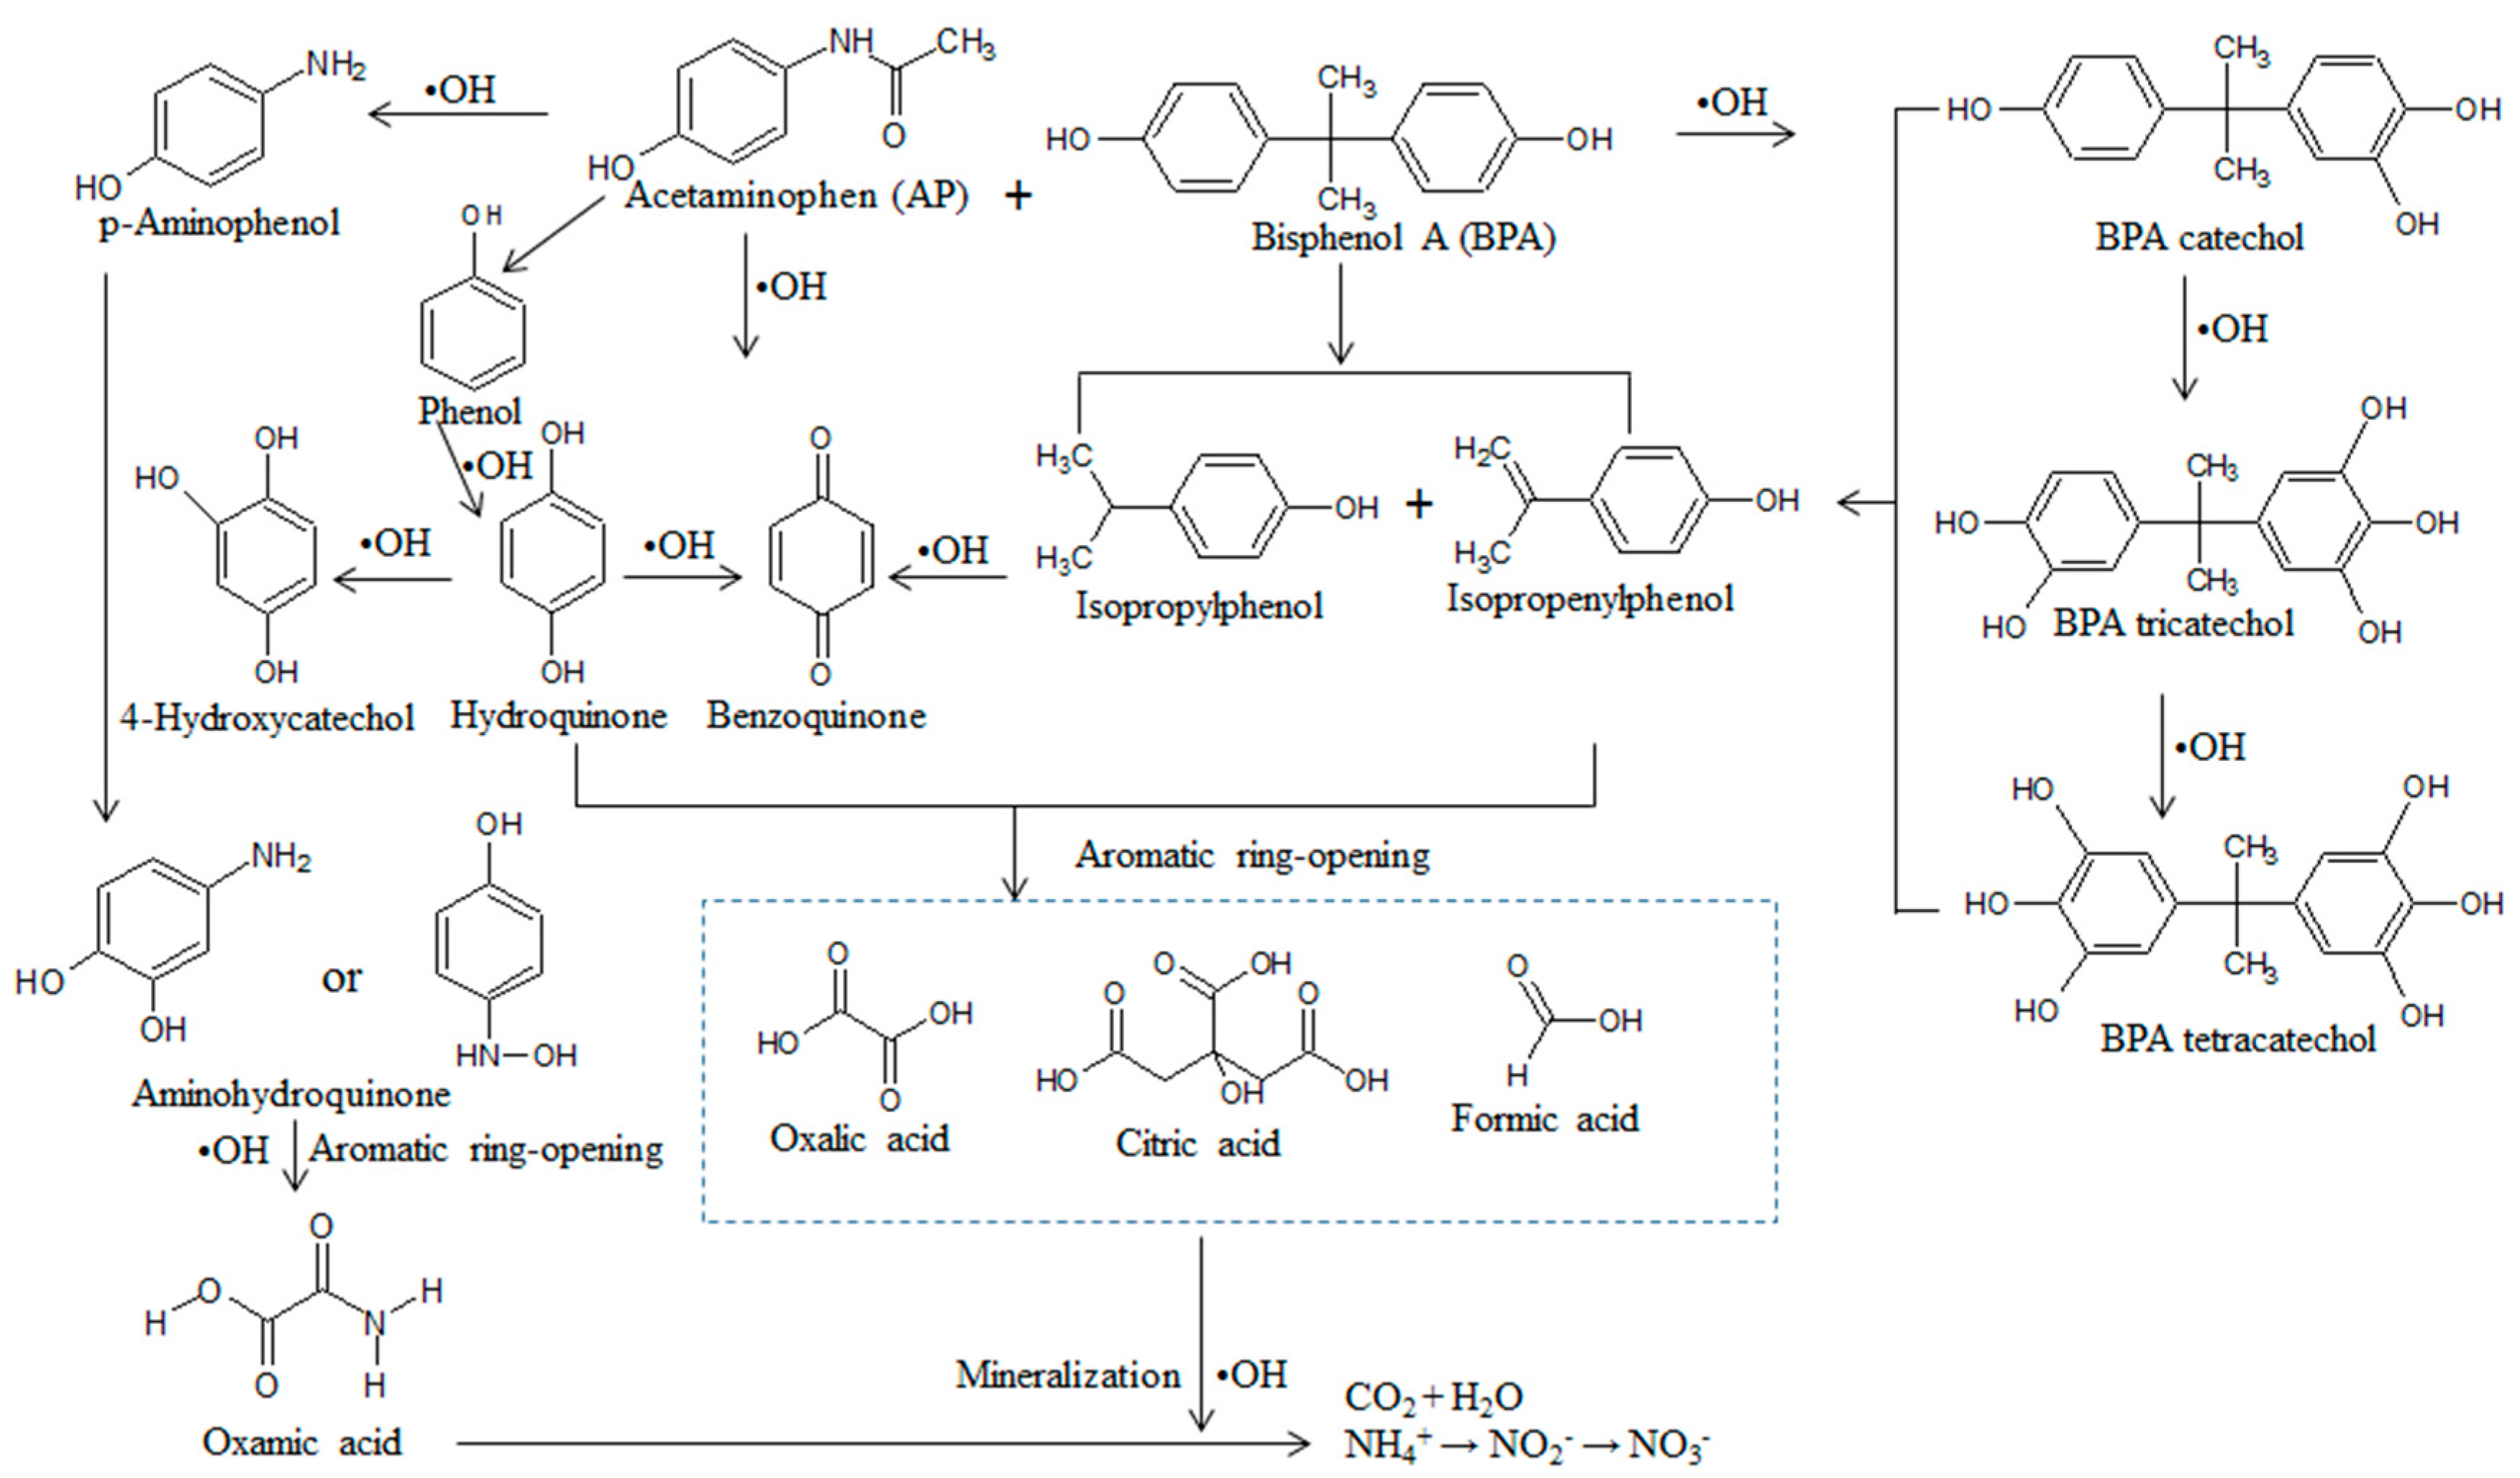
3.5. Pathways of Electrochemical Degradation of Target Compounds
4. Conclusions
Supplementary Materials
Author Contributions
Funding
Data Availability Statement
Acknowledgments
Conflicts of Interest
References
- Xiong, Y.X.; Shi, Q.Y.; Smith, A.; Schlenk, D.; Gan, J. Methylation and Demethylation of Emerging Contaminants Changed Bioaccumulation and Acute Toxicity in Daphnia magna. Environ. Sci. Technol. 2023, 57, 15213–15222. [Google Scholar] [CrossRef] [PubMed]
- Pacheco-Alvarez, M.; Benítez, R.P.; Rodríguez-Narvaez, O.M.; Brillas, E.; Peralta-Hernandez, J.M. A Critical Review on Paracetamol Removal from Different Aqueous Matrices by Fenton and Fenton-Based Processes, and Their Combined Methods. Chemosphere 2022, 303, 134883. [Google Scholar] [CrossRef]
- Bhandari, R.K.; Deem, S.L.; Holliday, D.K.; Jandegian, C.M.; Kassotis, C.D.; Nagel, S.C.; Tillitt, D.E.; vom Saal, F.S.; Rosenfeld, C.S. Effects of the Environmental Estrogenic Contaminants Bisphenol A and 17a-ethinyl Estradiol on Sexual Development and Adult Behaviors in Aquatic Wildlife Species. Gen. Comp. Endocrinol. 2015, 214, 195–219. [Google Scholar] [CrossRef] [PubMed]
- Mathieu-Denoncourt, J.; Wallace, S.J.; de Solla, S.R.; Langlois, V.S. Influence of Lipophilicity on the Toxicity of Bisphenol A and Phthalates to Aquatic Organisms. Bull. Environ. Contam. Toxicol. 2016, 97, 4–10. [Google Scholar] [CrossRef] [PubMed]
- Li, X.Y.; Shen, X.J.; Jiang, W.W.; Xi, Y.K.; Li, S. Comprehensive Review of Emerging Contaminants: Detection Technologies, Environmental Impact, and Management Strategies. Ecotoxicol. Environ. Saf. 2024, 278, 116420. [Google Scholar] [CrossRef] [PubMed]
- Fu, R.; Zhang, P.S.; Jiang, Y.X.; Sun, L.; Sun, X.H. Wastewater Treatment by Anodic Oxidation in Electrochemical Advanced Oxidation Process: Advance in Mechanism, Direct and Indirect Oxidation Detection Methods. Chemosphere 2023, 311, 136993. [Google Scholar] [CrossRef]
- Monteagudo, J.M.; Durán, A.; Latorre, J.; Expósito, A.J. Application of Activated Persulfate for Removal of Intermediates from Antipyrine Wastewater Degradation Refractory towards Hydroxyl Radical. J. Hazard. Mater. 2016, 306, 77–86. [Google Scholar] [CrossRef]
- Huang, K.L.; Chao, P.J.; Kuo, Y.M.; Chi, K.Y.; Cheng, H.M.; Wu, R.Z.; Huang, T.Y. Response Surface Methodology-Based Fabrication of Boron-Doped Diamond Electrodes for Electrochemical Degradation of Guaifenesin in Aqueous Solutions. J. Taiwan Inst. Chem. Eng. 2021, 123, 124–133. [Google Scholar] [CrossRef]
- Cui, Y.H.; Lib, X.Y.; Chen, G.H. Electrochemical Degradation of Bisphenol A on Different Anodes. Water Res. 2009, 43, 1968–1976. [Google Scholar] [CrossRef]
- Chen, T.S.; Huang, K.L. Electrochemical Detection and Degradation of Acetaminophen in Aqueous Solutions. Int. J. Electrochem. Sci. 2012, 7, 6877–6892. [Google Scholar] [CrossRef]
- Huang, K.L.; Tang, T.Y. Electrochemical Degradation of Acetaminophen in the Absence/Presence of Ce(IV). Int. J. Electrochem. Sci. 2018, 13, 12391–12403. [Google Scholar] [CrossRef]
- Huang, K.L.; Chu, Y.C.; Chen, H.R.; Kuo, Y.M. Electrochemical Degradation of Bisphenol A in Water with/without Ce(IV) Addition. Int. J. Electrochem. Sci. 2017, 12, 12098–12111. [Google Scholar] [CrossRef]
- Serna-Galvis, E.A.; Ramírez, J.E.; Palma-Goyes, R.E.; Torres-Palma, R.A. Indirect Electrochemical Degradation of Acetaminophen: Process Performance, Pollutant Transformation, and Matrix Effects Evaluation. Rev. Fac. Ing. 2023, 106, 113–123. [Google Scholar] [CrossRef]
- Murugananthan, M.; Yoshihara, S.; Rakumab, T.; Shirakashi, T. Mineralization of Bisphenol A (BPA) by Anodic Oxidation with Boron-Doped Diamond (BDD) Electrode. J. Hazard. Mater. 2008, 154, 213–220. [Google Scholar] [CrossRef] [PubMed]
- Zhao, J.; Zhu, C.; Lu, J.; Hu, C.; Peng, S.; Chen, T. Electro-catalytic Degradation of Bisphenol A with Modified Co3O4/β-PbO2/Ti electrode. Electrochim. Acta 2014, 118, 169–175. [Google Scholar] [CrossRef]
- de Luna, M.D.G.; Veciana, M.L.; Su, C.-C.; Lu, M.-C. Acetaminophen Degradation by Electro-Fenton and Photoelectro-Fenton Using a Double Cathode Electrochemical Cell. J. Hazard. Mater. 2012, 217–218, 200–207. [Google Scholar] [CrossRef]
- Wang, L.Y.; Liu, Y.; Pang, D.; Song, H.O.; Zhang, S.P. Simultaneous Electrochemical Degradation of Tetracycline and Metronidazole Through a High-Efficiency and Low-Energy-Consumption Advanced Oxidation Process. Chemosphere 2022, 292, 133469. [Google Scholar] [CrossRef]
- Punturat, V.; Huang, K.L. Degradation Pathways and Organic Matter Transformation of Acesulfame Potassium Electro-oxidation in Real Water Matrices. J. Taiwan Inst. Chem. Eng. 2017, 80, 222–230. [Google Scholar] [CrossRef]
- Punturat, V.; Huang, K.L. Degradation of Acesulfame in Aqueous Solutions by Electro-oxidation. J. Taiwan Inst. Chem. Eng. 2016, 63, 286–294. [Google Scholar] [CrossRef]
- Nematollahi, D.; Shayani-Jam, H.; Alimoradi, M.; Niroomand, S. Electrochemical Oxidation of Acetaminophen in Aqueous Solutions: Kinetic Evaluation of Hydrolysis, Hydroxylation and Dimerization Processes. Electrochim. Acta 2009, 54, 7407–7415. [Google Scholar] [CrossRef]
- He, J.J.; Yu, H.W.; Fugetsu, B.; Tanaka, S.; Sun, L. Electrochemical Removal of Bisphenol A Using a CNT-covered Polyester Yarn Electrode. Sep. Purif. Technol. 2013, 110, 81–85. [Google Scholar] [CrossRef]
- He, Y.P.; Lin, H.B.; Guo, Z.C.; Zhang, W.L.; Li, H.D.; Huang, W.M. Recent Developments and Advances in Boron-Doped Diamond Electrodes for Electrochemical Oxidation of Organic Pollutants. Sep. Purif. Technol. 2019, 212, 802–821. [Google Scholar] [CrossRef]
- Chaplin, B.P.; Wyle, I.; Zeng, H.; Carlisle, J.A.; Farrell, J. Characterization of the performance and failure mechanisms of boron-doped ultrananocrystalline diamond electrodes. J. Appl. Electrochem. 2011, 41, 1329–1340. [Google Scholar] [CrossRef]
- Brosler, P.; Girão, A.V.; Silva, R.F.; Tedim, J.; Oliveira, F.J. In-house vs. Commercial Boron-doped Diamond Electrodes for Electrochemical Degradation of Water Pollutants: A Critical Review. Front. Mater. 2023, 10, 1020649. [Google Scholar] [CrossRef]
- Chen, X.M.; Chen, G.H.; Gao, F.R.; Yue, P.L. High Performance Ti/BDD Electrodes for Pollutant Oxidation. Environ. Sci. Technol. 2003, 37, 5021–5026. [Google Scholar] [CrossRef]
- Cousins, I.T.; Staples, C.A.; Klecka, G.M.; Mackay, D. A Multimedia Assessment of the Environmental Fate of Bisphenol A. Hum. Ecol. Risk Assess. 2002, 8, 1107–1135. [Google Scholar] [CrossRef]
- Harris, M.F.; Logan, J.L. Determination of log Kow Values for Four Drugs. J. Chem. Educ. 2014, 91, 915–918. [Google Scholar] [CrossRef]
- Mendes, F.S.; Gonçalves, A.D.A.; Guiomar, F.I.S.; Martins, R.N.; Ramalho, J.P.P.; Martins, L.F.G. On the Diffusion of Carbamazepine, Acetaminophen and Atenolol in Water: An Experimental and Theoretical Approach. Fluid Phase Equilibria 2024, 580, 114056. [Google Scholar] [CrossRef]
- Niesner, R.; Heintz, A. Diffusion Coefficients of Aromatics in Aqueous Solution. J. Chem. Eng. Data 2000, 45, 1121–1124. [Google Scholar] [CrossRef]
- Chakraborty, A.; Bera, B.; Priyadarshani, D.; Leuaa, P.; Choudhury, D.; Neergat, M. Electrochemical Estimation of Active Site Density on a Metal-Free Carbon-Based Catalyst. RSC Adv. 2019, 9, 466–475. [Google Scholar] [CrossRef]
- Zhang, L.P.; An, Y.Y.; Wang, W.W.; Yuan, H.X.; Li, H.T.; Gao, Y.Q. Efficient and Stability Electrochemical Degradation of Bisphenol A on Ti/TiO2-NTA/PbO2-Nd Anode: Mechanistic Analysis. J. Water Process Eng. 2024, 65, 105887. [Google Scholar] [CrossRef]
- Agrahari, S.; Singh, A.K.; Gautam, R.K.; Tiwari, I. Electrochemical Oxidation and Sensing of Para Benzoquinone Using a Novel SPE Based Disposable Sensor. Chemosphere 2023, 342, 140078. [Google Scholar] [CrossRef] [PubMed]
- do Vale-Júnior, E.; dos Santos, A.J.; da Silva, D.R.; Fajardo, A.S.; Martínez-Huitle, C.A. Electrochemical Technologies for Detecting and Degrading Benzoquinone Using Diamond Films. ChemElectroChem 2019, 6, 4383–4390. [Google Scholar] [CrossRef]
- Zhang, Y.; Liu, Y.; Wu, Y.F.; Niu, Y.R.; Jiang, J.X.; Guan, H.Y. Double Exponential Decay Empirical Model for Indoor Building Materials TVOC Emissions. Earth Environ. Sci. 2020, 446, 032043. [Google Scholar] [CrossRef]
- Moctezuma, E.; Leyva, E.; Aguilar, C.A.; Luna, R.A.; Montalvo, C. Photocatalytic Degradation of Paracetamol: Intermediates and Total Reaction Mechanism. J. Hazard. Mater. 2012, 243, 130–138. [Google Scholar] [CrossRef]
- Bilal, M.; Jaffrezic, A.; Dudal, Y.; Le Guillou, C.; Menasseri, S.; Walter, C. Discrimination of Farm Waste Contamination by Fluorescence Spectroscopy Coupled with Multivariate Analysis during a Biodegradation Study. J. Agric. Food Chem. 2010, 58, 3093–3100. [Google Scholar] [CrossRef]
- Brillas, E.; Sires, I.; Oturan, M.A. Electro-Fenton Process and Related Electrochemical Technologies Based on Fenton’s Reaction Chemistry. Chem. Rev. 2009, 109, 6570–6631. [Google Scholar] [CrossRef]
- Wu, W.Y.; Huang, Z.H.; Lima, T.T. A Comparative Study on Electrochemical Oxidation of Bisphenol A by Boron-Doped Diamond Anode and Modified SnO2-Sb Anodes: Influencing Parameters and Reaction Pathways. J. Environ. Chem. Eng. 2016, 4, 2807–2815. [Google Scholar] [CrossRef]


| k | k1 | m | |||||||
|---|---|---|---|---|---|---|---|---|---|
| 1.0 M Na2SO4 Solution | RW | ||||||||
| CD | 0.25 | 0.50 | 0.75 | 1.00 | 0.50 * | 0.50 | |||
| AP | 1.23 | 1.94 | 2.96 | 3.39 | 3.50 | 1.34 | 1.21 | 0.76 | |
| BPA | 0.675 | 0.887 | 1.63 | 1.81 | 6.43 | 0.700 | 0.63 | 0.76 | |
| TOC | 0.408 | 0.575 | 0.623 | 0.810 | 1.89 | 2.96 | 0.392 | ||
| K2 | k3 | ||||
|---|---|---|---|---|---|
| 1 M SS | RW | 0.1 M SS * | 1 M SS | RW | 0.1 M SS * |
| 1.38 × 10⁻³ | 1.38 × 10⁻³ | 2.87 × 10⁻⁴ | 1.42 × 10⁻³ | 1.40 × 10⁻³ | 5.42 × 10⁻⁴ |
| This study | This study | [9] | This study | This study | [9] |
| Compound | Formula | Structure | m/z | RT (min) |
|---|---|---|---|---|
| Acetaminophen (AP) | C8H9NO2 |  | 152.15 | 4.71 |
| N-acetyl-p-benzoquinone imine (NAPQI) | C8H7NO2 | 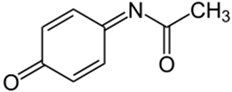 | 150.13 | 4.75 |
| Hydroxyacetaminophen | C8H9O3 | 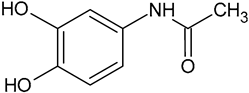 | 168.18 | 4.68 |
| Aminohydroquinone | C6H7NO2 | 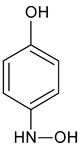  | 126.31 | 4.68 |
| Benzoquinone | C6H4O2 |  | 109.29 | 14.13 |
| Hydroquinone | C6H6O2 | 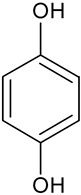 | 111.04 | 10.52 |
| Acetamide | C2H5NO | 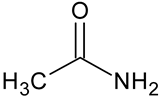 | 60.10 | 10.52 |
| p-Aminophenol | C6H7NO | 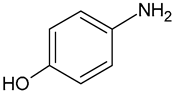 | 109.94 | 21.46 |
| 4-aminobutanoic acid | C4H9NO2 | 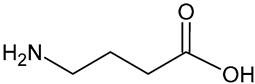 | 104.23 | 10.85 |
| Malonic acid | C3H4O4 | 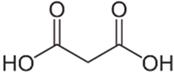 | 104.76 | 1.46 |
| Oxalic acid | C2H2O4 |  | 90.93 | 4.75 |
| Citric acid | C6H8O7 | 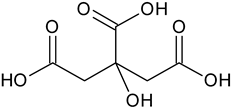 | 192.70 | 4.70 |
| Oxamic acid | C2H3NO3 | 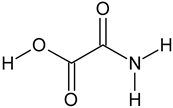 | 90.04 | 21.34 |
| Formic acid # | HCOOH |  | – | – |
| Compound | Formula | Structure | m/z | RT (min) |
|---|---|---|---|---|
| Bisphenol A (BPA) | C15H16O2 | 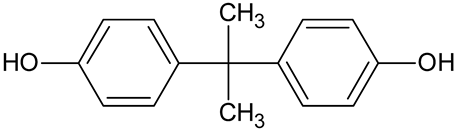 | 229.14 | 14.97 |
| BPA tricatechol | C15H16O5 | 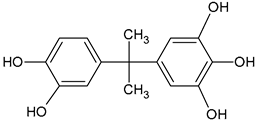 | 277.04 | 15.64 |
| BPA catechol | C15H16O3 | 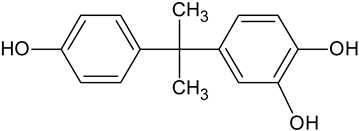 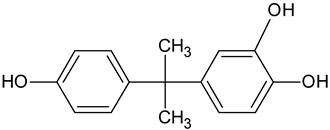 | 245.10 | 14.08 |
| p-hydroxybenzophenone | C13H10O2 | 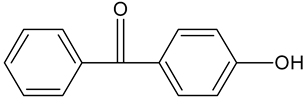 | 198.98 | 12.11 |
| Hydroquinone * | C6H6O2 | 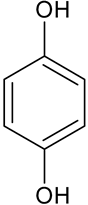 | 108.89 | 26.47 |
| Benzoquinone * | C6H4O2 | 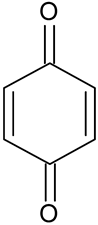 | 107.25 | 9.66 |
| Isopropylphenol | C9H12O | 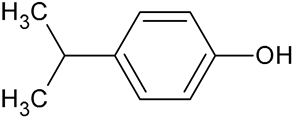 | 137.09 | 16.17 |
| Isopropenylphenol | C9H10O |  | 135.20 | 16.17 |
| Tricarballylic acid | C6H8O6 | 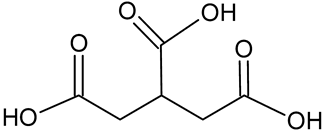 | 176.93 | 15.96 |
| Acetic acid | CH3COOH | 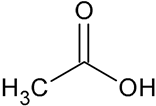 | 61.19 | 1.62 |
| Tartaric acid * | C4H6O6 | 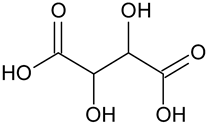 | 148.73 | 5.69 |
| Oxalic acid | C2H2O4 | 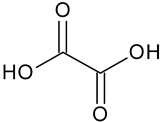 | 91.17 | 12.07 |
| Citric acid | C6H6O7 |  | 193.01 | 1.29 |
| Formic acid # | HCOOH | 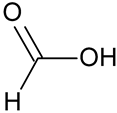 | – | – |
| Malic acid # | C4H6O5 | 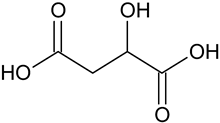 | – | – |
| Compound | Formula | Structure | m/z | RT (min) |
|---|---|---|---|---|
| Acetaminophen | C8H9NO2 | 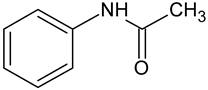 | 152.15 | 4.83 |
| Bisphenol A | C15H16O2 | 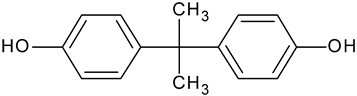 | 229.08 | 4.97 |
| BPA tetracatechol | C15H16O6 | 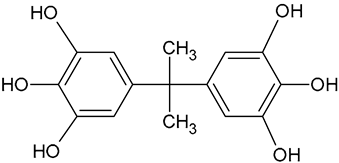 | 293.01 | 11.98 |
| BPA tricatechol | C15H16O5 | 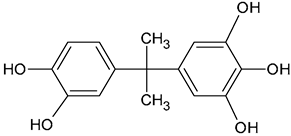 | 277.02 | 13.01 |
| BPA catechol | C15H16O3 | 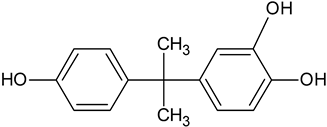 | 245.14 | 14.02 |
| Isopropylphenol | C9H12O |  | 137.19 | 13.03 |
| Isopropenylphenol | C9H10O | 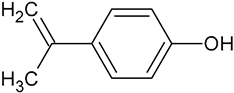 | 135.40 | 13.03 |
| 4-Hydroxycatechol | C6H6O3 | 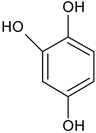 | 127.25 | 10.56 |
| Aminohydroquinone | C6H7NO2 | 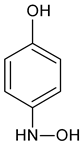 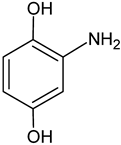 | 126.19 | 8.91 |
| Hydroquinone | C6H6O2 |  | 110.97 | 10.56 |
| p-Aminophenol | C6H7NO | 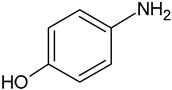 | 109.93 | 13.00 |
| Benzoquinone | C6H4O2 | 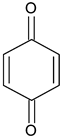 | 109.09 | 15.96 |
| Phenol | C6H6O |  | 95.20 | 16.08 |
| Oxalic acid | C2H2O4 | 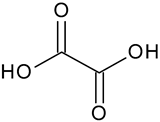 | 91.13 | 12.10 |
| Citric acid | C6H6O7 |  | 192.95 | 11.42 |
| Oxamic acid | C2H3NO3 | 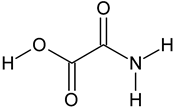 | 90.12 | 14.77 |
| Formic acid # | HCOOH | 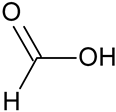 | – | – |
Disclaimer/Publisher’s Note: The statements, opinions and data contained in all publications are solely those of the individual author(s) and contributor(s) and not of MDPI and/or the editor(s). MDPI and/or the editor(s) disclaim responsibility for any injury to people or property resulting from any ideas, methods, instructions or products referred to in the content. |
© 2024 by the authors. Licensee MDPI, Basel, Switzerland. This article is an open access article distributed under the terms and conditions of the Creative Commons Attribution (CC BY) license (https://creativecommons.org/licenses/by/4.0/).
Share and Cite
Huang, K.-L.; Hung, J.-C.; Kuo, Y.-M. Electrochemical Co-Degradation of Acetaminophen and Bisphenol A in Aqueous Solutions: Degradation Competition and Pathways. Processes 2024, 12, 2641. https://doi.org/10.3390/pr12122641
Huang K-L, Hung J-C, Kuo Y-M. Electrochemical Co-Degradation of Acetaminophen and Bisphenol A in Aqueous Solutions: Degradation Competition and Pathways. Processes. 2024; 12(12):2641. https://doi.org/10.3390/pr12122641
Chicago/Turabian StyleHuang, Kuo-Lin, Jui-Chiung Hung, and Yi-Ming Kuo. 2024. "Electrochemical Co-Degradation of Acetaminophen and Bisphenol A in Aqueous Solutions: Degradation Competition and Pathways" Processes 12, no. 12: 2641. https://doi.org/10.3390/pr12122641
APA StyleHuang, K.-L., Hung, J.-C., & Kuo, Y.-M. (2024). Electrochemical Co-Degradation of Acetaminophen and Bisphenol A in Aqueous Solutions: Degradation Competition and Pathways. Processes, 12(12), 2641. https://doi.org/10.3390/pr12122641