Abstract
This paper introduces an optimized deep neural network (DNN) framework for an efficient gas detection system applicable across various settings. The proposed optimized DNN model addresses key issues in conventional machine learning (ML), including slow computation times, convergence issues, and poor adaptability to new data, which can result in increased prediction errors and reduced reliability. The proposed framework methodology comprises four phases: data collection, pre-processing, offline DNN training optimization, and online model testing and deployment. The training datasets are collected from seven classes of liquid beverages and environmental air samples using integrated gas sensor devices and an edge intelligence environment. The proposed DNN algorithm is trained on high-performance computing systems by fine-tuning multiple hyperparameter optimization techniques, resulting in an optimized DNN. This well-trained DNN model is validated using unseen new testing datasets in high-performance computing systems. Experimental results demonstrate that the optimized DNN can accurately recognize different beverages, achieving an impressive detection accuracy rate of 98.29%. The findings indicate that the proposed system significantly enhances gas identification capabilities and effectively addresses the slow computation and performance issues associated with traditional ML methods. This work highlights the potential of optimized DNNs to provide reliable and efficient contactless detection solutions across various industries, enhancing real-time gas detection applications.
1. Introduction
In recent years, the demand for machine learning (ML) and deep learning (DL) models has significantly increased, particularly in advanced technologies such as mobile devices, the Internet of things (IoT), the artificial Intelligence of things (AIoT), and the internet of everything (IoE) [1,2,3]. This rapid increase has highlighted the urgent need for DL models to enable artificial intelligence (AI), artificial superintelligence (ASI), and data analytics-based solutions in edge intelligence (EI) environments [3,4,5,6]. The convergence of AI, ASI, and AIoT with the EI environment has opened new frontiers to real-time processing and decision-making in different verticals such as healthcare, automotive, smart cities, transportation, and industrial automation.
AI technologies integration with the EI environment offers unique advantages in data processing, data analysis, and the training of models, especially in IoT-based applications [4,5,6]. In an EI environment, data are collected locally and processed on edge devices, which lowers latency and bandwidth usage by decreasing reliance on centralized cloud servers. This approach enables real-time, context-aware data analysis and provides high-quality data for more accurate model training. In IoT applications, intelligent gadget systems utilize the EI environment to enhance response times while preserving data privacy and efficiently managing resources. The method is well suited for rapid and precise decision-making in smart cities, healthcare, and industrial automation.
Conventional neural networks encounter challenges when deployed on small-edge devices and embedded systems because of their high resource demands. As a result, optimization and compression are crucial for their effective implementation [7]. Recent studies highlight the extensive use of ML and DL across a wide range of applications, including food and beverage classification [8,9,10], anomaly detection [11,12], Internet of Medical Things (IoMT) [13,14], gas classification techniques [15,16], and various sensing applications [17,18,19]. A crucial aspect of DL is optimization during regression or classification tasks, which significantly influences both performance and computational efficiency in regression and classification tasks [7,20,21,22,23].
Implementing efficient optimization and compression strategies can substantially decrease memory usage and computational delays, all while preserving model performance. This is particularly crucial for deploying models on resource-constrained devices, such as mobile phones and edge computing platforms. As models are optimized for size, it is equally crucial to improve their performance, ensuring that smaller, more efficient models can still tackle complex tasks effectively. The edge-IoT ecosystem offers a substantial potential for intelligent decision-making at the network’s edge [24,25,26]. However, integrating ML and DL into resource-constrained embedded devices presents significant challenges. Recent studies have explored paradigms such as tiny machine learning (TinyML) [27,28,29,30,31] and tiny deep learning (TinyDL) [32], which aim to optimize models and integrate TinyML into low-cost, low-power intelligent devices like smartphones and IoT-edge systems. These efforts are crucial for enabling the development, deployment, and inference of AI models directly in the EI environment, making them suitable for resource-limited smart devices.
Moreover, in recent years, several ML and DL techniques [31,32,33,34] have been developed on the edge impulse platform to address critical issues in real-time processing. This edge impulse platform is designed to create and deploy ML models on edge devices; these are powered by powerful features and tools, which include the intelligent creation of applications with real-time data analysis and data collection, real-time data pre-processing, model training running directly on devices, microcontrollers, sensors, among other low-power devices [33,34]. These techniques make the platform a suitable solution to overcome traditional cloud-based AI approaches by reducing latency, enhancing privacy and data security, and reducing dependency on continuous network connectivity [33,34]. Moreover, the edge impulse platform supports building and deploying ML models for various applications, including IoT devices, wearables, and industrial monitoring [31,32,33,34]. However, conventional ML approaches face major issues, including long computational times that hinder real-time applications, convergence issues, which retard attaining optimal performances, and poor adaptability to new or varied data, which increases the prediction errors and decreases the reliability of the methods. To address these issues, model optimization emerges as an up-and-coming solution, offering the potential to significantly improve the performance and efficiency of ML models.
This study proposes and demonstrates deep neural network (DNN) optimization for efficient gas detection systems. The primary goal of the proposed optimized model is to enhance adaptability, learnability, and prediction accuracy in these systems. The DNN is trained on a high-performance personal computer and tested using new unseen testing datasets. This approach addresses the limitations of traditional ML methods, such as slow computation, increasing error, and performance issues.
The proposed framework offers practical solutions across various applications. For instance, it can be installed in vehicles to detect alcohol and other substances in the air, thereby identifying drunk drivers and improving road safety. The framework automatically detects gas emissions from beverages in the food and beverage industry, enhancing quality control and operational efficiency without human intervention. By using the high-performance capabilities of edge computing, this optimized DNN framework ensures high accuracy and speed, making it a transformative solution for efficient monitoring and decision-making across diverse fields. The key contributions of this paper are outlined as follows:
- This paper introduces a novel and robust optimized DL framework for efficient gas detection in various applications, including identifying intoxicated drivers in transportation and classifying gases in beverages in industrial applications without human intervention;
- The proposed DNN algorithm is implemented, trained, and optimized on a high-performance personal computer system equipped with graphics processing unit (GPU) computing. To validate the performance, the optimized model is tested on a high-performance personal computer system using new, unseen testing datasets;
- The proposed optimized DNN model system is designed with a modular architecture that allows for easy integration with various gas sensors and edge device platforms. This scalable design supports a range of applications, including detecting intoxicated drivers in transportation and classifying gases in beverages in industrial settings, all without human intervention;
- The proposed system demonstrates the contactless detection capability of the proposed system and eliminates the need for physical contact with the beverage, reducing the risk of contamination and increasing the system’s reliability and durability while also reducing maintenance costs and downtime.
The rest of the paper is organized as follows. Section 2 details the optimized DNN-enabled edge intelligence gas detection conceptual framework, along with a subsection of the proposed DNN algorithm overall system structure and training procedure for gas detection applications. Section 3 outlines the methodology in depth in the data collection and pre-processing and proposed model training procedures. Section 4 presents the results and discussion by including the performance evaluation metrics of the proposed DNN. Finally, Section 5 presents the conclusion part of the research work.
2. Optimized DNN-Enabled Edge Intelligence Gas Detection Experimental Framework
Figure 1 illustrates the overall system structure and training procedure for optimizing the proposed DNN algorithm across various gas detection applications. This framework is designed for efficient implementation on high-performance platforms, allowing for high adaptability across different gas detection applications, including classifying gases in beverages within industries and identifying intoxicated drivers in transportation settings. Moreover, the system’s robust architecture supports scalability for emerging applications in environmental monitoring and safety compliance.
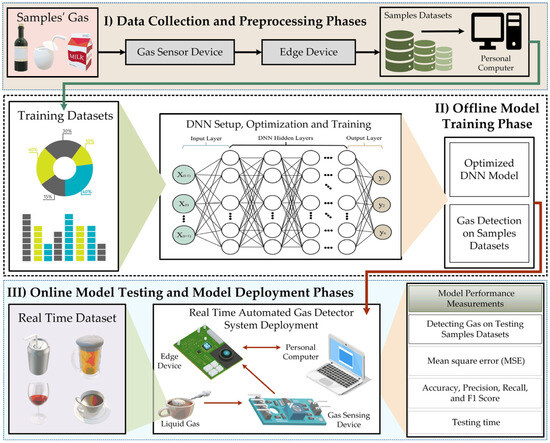
Figure 1.
The proposed DNN-enabled edge intelligence gas detection experimental framework.
The proposed experimental framework architecture consists of three detailed phases: data collection phase, offline model training phase, and online model testing and deployment phases. As shown in Figure 1, the data collection phase involves capturing data from various liquids and environmental air using gas sensors, edge devices environment, and computer systems. This integrated setup ensures accurate data acquisition and management, laying a strong foundation for effective analysis, model training, and development. In this study, the edge devices environment is essential for data collection by integrating with gas sensors through Python code, which enables data gathering and pre-processing. These devices act as data forwarders, facilitating direct data capture from sensors or enabling uploads in multiple formats. Such features are essential for real-time processing and analysis at the source, significantly reducing the time required for conventional data processing. In this data collection and pre-processing phase, gas measurements from various liquid samples, including environmental air, are collected using gas sensor devices, edge devices environment, and personal computer systems. The collected raw data undergoes pre-processing, which includes cleaning, normalization, and transformation. This step is crucial for preparing the data for subsequent model training, as it enhances the quality and consistency of the input data, making them suitable for analysis.
The proposed DNN algorithm is implemented and trained in the second offline model training phase using a high-performance personal computer system equipped with GPU-based computing. During model training, the pre-processed datasets are input into a high-performance personal computer system with GPU computing. The DNN model architecture is implemented and trained using advanced techniques, including hyperparameter optimization and cross-validation. These methods are used to improve the model’s accuracy and reliability. The DNN structure includes a flexible hidden layer configuration, enabling the addition of multiple hidden layers until the optimal model is achieved. This iterative approach ensures that the model is finely tuned for effective performance in real-world scenarios.
As shown in Figure 1, once the model has been trained and validated on a high-performance personal computer system with GPU-based computing, its performance is evaluated using a new, unseen dataset in the high-performance personal computer system. The model’s performance on high-performance personal computer systems is measured and evaluated using accuracy, precision, recall, and F1-score metrics to determine its effectiveness for future real-time applications. The framework’s modular design allows for scalability and flexibility, making it adaptable to various real-time gas detection applications across different environments to identify intoxicated drivers in transportation and other industries. This comprehensive approach enhances the system’s performance and facilitates integration into diverse operational contexts, ensuring effective gas monitoring and safety management. The next sub-section explains the overall system structure and the training procedure to optimize the proposed DNN method.
2.1. The Proposed DNN Algorithm Overall System Structure, Optimization, and Training Procedure for Gas Detection Applications
Figure 2 demonstrates the overall system structure and training procedure for optimizing the proposed DNN algorithm for various gas detection applications. As shown in the figure, the overall system structure and training procedure for the proposed DNN algorithm comprises four distinct phases: data collection, data pre-processing, offline DNN training, and online model testing and deployment phases for the automated gas detection system. The data collection phase starts with capturing data from seven distinct classes, which include selected liquids and environmental air, using integrated devices such as gas sensor devices, edge devices environment, and personal computer systems. This comprehensive approach ensures accurate data collection and management, providing a solid foundation for effective analysis model training and development.
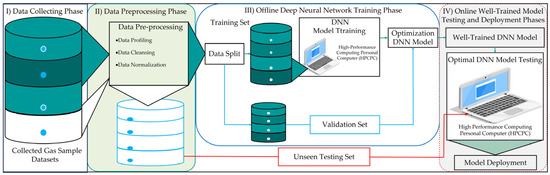
Figure 2.
Overall system structure and training procedure of the proposed DNN-enabled EI gas detection system.
Once the datasets are collected, the pre-processing phase begins. This stage involves data profiling, cleansing, normalization, and preparing the training sets. As shown in Figure 2, both the training and unseen testing sets undergo data profiling, data cleansing, and normalization processes. Following these steps, the dataset is split, with the larger portion designated as the training set for the proposed model. The unseen testing sets are then used to evaluate and confirm a well-trained model.
As illustrated in Figure 2, the offline training phase of the DNN is carried out on a high-performance personal computer equipped with GPU-based computing capabilities. During this process, the data are carefully split into training and validation sets, with a 70/30 ratio, as shown in the Figure. This phase involves iteratively training the DNN until the optimal model is achieved. The training process continues by adjusting several model optimization parameters and validating its performance until it meets the desired accuracy and efficiency criteria.
As demonstrated in Figure 2, once the optimal model is obtained, it moves to the final phase: online model testing and deployment. The online model testing and deployment phase involves testing the well-trained model using new unseen datasets which are not included during the offline training phase. In this online testing phase, the performance of the proposed optimized DNN model is evaluated using a new, unseen dataset on high-performance personal computer systems. This ensures the model can generalize well to the new unseen data and perform accurately in real-world scenarios. Furthermore, the model’s performance is monitored and evaluated in high-performance personal computer systems using accuracy, precision, recall, and F1-score evaluation metrics to assess its effectiveness in real-time applications.
3. Methodology
3.1. Overview
The initial phase of the methodology for the optimized DNN algorithm-based gas detection system involves collecting and pre-processing a comprehensive dataset of various liquids, including environmental air. These datasets serve as the foundation for training DNNs using supervised learning techniques. During the training, the DNNs learn to recognize patterns and features associated with different gases in liquids and environmental air, which are crucial for accurate detection. Once trained, this DNN model can be tested using unseen new testing data. This well-trained, optimized DNN model plays a vital role in different liquids and environmental air gas detection systems by meticulously collecting and analyzing datasets related to various liquids and environmental air gases, including metrics such as carbonation levels, gas concentrations, and liquid-type indicators. This data collection provides a robust foundation for the platform’s advanced analytical functions, utilizing DL for intelligent system development. The real-time monitoring facilitated by this approach allows for swift responses to potential issues, enhancing operational efficiency and ensuring consistent product quality in liquid and gas detection processes. In the subsequent subsection, the detailed data collection and pre-processing are presented.
3.2. Data Collection and Pre-Processing
Data collection is a critical component for all DL-based studies, as it directly impacts the performance of the models by ensuring high-quality and diverse datasets. In this study, the data collection process employs several hardware devices integrated into an experimental setup designed to structure the system and collect gas datasets from various liquid and environmental air samples. This data collection system utilizes core components, including edge device environment and gas sensor devices. The gas sensor device provides robust, reliable multi-gas detection with independent sensors, ensuring high sensitivity, stability, and easy deployment. The gas sensor device is compatible with the edge device environment and micro python, featuring a microcontroller with wireless connectivity and supporting both Bluetooth and Wi-Fi, making it well-suited for IoT applications.
The gas sensor devices provide reliable detection of various gases in liquids and air. When the gas sensor device is integrated with the edge device environment, the system can capture real-time gas-sensing data from connected samples. This integration supports raw data collection, enabling real-time analysis, pre-processing, and the creation of training sets for ML model training. It streamlines data collection, ensuring efficient preparation for DL applications and enhancing the system’s functionality for accurate, reliable data acquisition.
In this paper, by integrating the gas sensor device with the edge device environment, the devices started capturing raw data gas emissions from various liquid samples, including air, vodka, vinegar, peach tea, cola, coffee, and beer. During the data collection process, the gas data are collected using the above-mentioned samples for both training and testing the proposed gas detection model. Specifically, 525 samples are collected for the training set, and some portions of samples are also collected for the testing set from seven different unique classes of gases. Each gas sample is recorded continuously for 100 s and subsequently divided into 1 s segments, which enhances the granularity of the data used for training and testing the models. Once the seven different unique classes of gas data are collected, pre-processing techniques are applied to create a well-prepared dataset for training the classification models. Pre-processing is a crucial step in the data analysis pipeline that ensures the accuracy and reliability of the results. It involves improving data quality, removing inconsistencies, and formatting the data so that they can be easily used by data analysts and DL algorithms. The unique classes of gas datasets are organized based on input features and the target values for each type of feature class. The datasets generated by this framework are sent to a high-performance personal computer standalone machine for further data pre-processing and proposed model training.
Normalization is an important pre-processing step in DL. It helps the model converge faster during training by avoiding large weight updates and prevents the saturation of activation functions that can occur when input values are too large. Additionally, normalization makes the model more robust to changes in the input distribution, improving its generalization performance. Normalization scales the input features to a standard range, enhancing the efficiency of the model fitting process. Specifically, min–max normalization is used to scale the data, effectively reducing the loss function and speeding up gradient descent to find the optimal solution. This systematic approach ensures that the data are in the best possible condition for training the DL models. The data are normalized using the min–max normalization method, as demonstrated in Equation (1) [35].
where is the normalized dataset feature, is the original dataset feature, is the minimum value in the x feature, and is the maximum value in the x features. This min max scaler is the most common normalization technique. Using the min–max scaler standardization technique, all feature values are changed between 0 and 1. Accordingly, after the data are pre-processed and normalized steps are completed, these 525 gas sample datasets with 400 input features are sent to the proposed method to train the DNN algorithm. The overall operating principle of the DNN algorithm is explained below.
3.3. Deep Neural Network (DNN) Structure
A DNN is a type of artificial neural network distinguished by its numerous hidden layers and complexity. It is a subset of DL, a branch of ML focused on perception and feature extraction. Unlike traditional ML methods that require pre-processed data, DL works with raw data, reducing the need for extensive pre-processing.
DL hierarchical structure allows for the learning of multiple features from data, driving significant progress in the field. Advances in algorithms, the availability of large datasets, and improvements in hardware have all contributed to the rapid development of DL techniques. One of the most promising aspects of DL is that modern classification models, such as DNNs, can learn feature representations directly from raw data, which has proven highly effective with sufficient training data.
At the core of a DNN are its multiple nonlinear layers. Each layer takes the output from the previous one, applies a nonlinear transformation, and passes it to the next layer, resulting in the final output. This sophisticated mathematical modeling enables DNNs to learn intricate patterns and representations from input data, making them highly effective in various applications, including computer vision, natural language processing, and speech recognition. The power of DNNs lies in their ability to extract and learn complex features from raw data without requiring extensive manual feature engineering, a significant limitation of traditional machine-learning approaches. Through several parameter optimizations, DNNs achieve high sensitivity and precision, making them well-suited for gas detection. This optimization enables DNNs to capture subtle changes in sensor signals, allowing for accurate detection of low gas concentrations in real time and enhancing their effectiveness across varied environments.
In this study, the proposed DNN algorithm has been implemented using the TensorFlow framework, Python 3.9 packages, and the Keras library. This setup provided the necessary computational power to efficiently train and evaluate the DL model, effectively handling the complex calculations involved in the DNN architecture. The DNN architecture for liquid gas detection is designed to identify and classify various liquid gases, including environmental air, through a multi-layered approach. The network starts with an input layer that receives raw gas sensor data from gas sensors embedded in different liquids.
As illustrated in Figure 3, the proposed method employs a five-layer neural network built with the TensorFlow framework, Python 3.9 packages, and the Keras library. The DNN comprises a total of five layers: one input layer, three hidden layers, and one output layer. The number of neurons in the input layers is 400 neurons; the first hidden layer has 824 neurons, the second hidden layer has 512 neurons, the third hidden layer has 256 neurons, and the output layer consists of 7 neurons, as shown in Figure 3. The tanh activation function and other optimal parameters are applied to the hidden layers. Categorical cross-entropy is selected as the loss function for this multi-class classification task. Both tanh and ReLU activation functions are used in conjunction with the categorical cross-entropy loss function in the final layer.
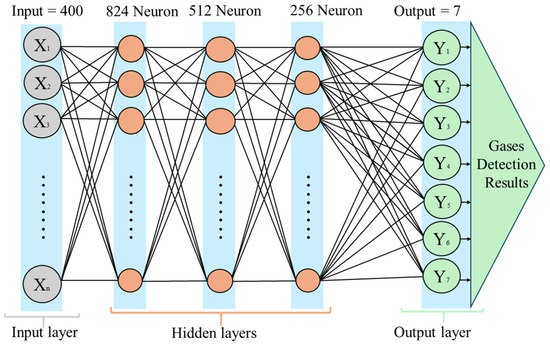
Figure 3.
The proposed deep neural network architecture.
The DNN architecture is designed to detect gases such as oxygen, nitrogen, and carbon dioxide commonly found in beverages of the collected samples. It processes sensor data to classify these gases accurately, with potential modifications to detect additional gases like volatile organic compounds (VOCs). The network is trained on a dataset of labeled gas readings, which allows it to perform real-time gas detection in applications like manufacturing or quality control. This approach offers high accuracy, simultaneous detection of multiple gases, and adaptability to different types of beverages, ensuring product quality and safety.
3.4. Hyperparameters Tuning and DNN Algorithm Offline Training to Select Optimal Parameters
Hyperparameters play a crucial role in DL algorithms, as they specify the training details and have a direct impact on the model’s output. The selection of appropriate hyperparameters is a critical step during the development and optimization of DNN algorithms, significantly influencing the model’s performance and its ability to generalize to unseen data.
In this study, the optimization of the DNN algorithm is applied to find the best values for hyperparameters while maintaining higher accuracy and minimal loss values. During the offline training process, the hyperparameters are carefully adjusted through repetitive training. The DNN algorithm is run multiple times with different combinations of hyperparameters, and the performance is evaluated on a validation dataset to find the optimal set that minimizes the loss function and maximizes accuracy. The hyperparameter variables tuned in this study include activation functions, optimizers, learning rate, batch size, epoch size, number of layers, number of neurons per layer, and regularization techniques. Carefully tuning these hyperparameters is essential for optimizing the training process and achieving the best possible results. By adjusting these variables, the researchers aim to develop a well-performing DNN model that can accurately classify data and generalize effectively to new, unseen samples.
Moreover, to validate and achieve better performance in the proposed model, cross-validation methods are crucial, involving partitioning data into training and validation sets and implementing during the training algorithm. These cross-validation techniques ensure robust performance across different data subsets by preventing overfitting and guaranteeing that the selected hyperparameters are not specific to a particular subset but can be generalized to the entire dataset. Additionally, cross-validation enhances the model’s ability to generalize to unseen data by exposing it to a wider range of data variations, allowing the model to learn more robust and generalizable features. Furthermore, hyperparameter selection is critical for DNN development, requiring careful tuning and evaluation to optimize performance and generalization, and cross-validation methods are essential to prevent overfitting and enhance the model’s robustness. The training results section thoroughly explores the detailed hyperparameter tuning of the proposed DNN algorithm, which is demonstrated in the following section with optimal classification accuracy and loss minimization.
Figure 4 demonstrates that the rectified linear unit (ReLU) and hyperbolic tangent (tanh) activation functions consistently outperform alternative options such as softplus, sigmoid, and softmax across various performance metrics. These superior performances are attributed to several inherent advantages of ReLU and tanh that align well with the requirements of classification algorithms. ReLU is highly favored for its computational efficiency and simplicity, which enable it to induce sparsity by activating only a subset of neurons, thereby optimizing computational resources. Additionally, ReLU effectively addresses the vanishing gradient problem common in DNNs, leading to faster convergence during training. In contrast, tanh provides zero-centered outputs that facilitate quicker convergence and improved model training by minimizing bias shifts within network layers. These distinct characteristics collectively establish ReLU and tanh as preferred choices for enhancing model performance and generalization in classification tasks [17,19,36]. The decreasing loss values, as shown in Figure 4 as the number of epochs increases for tanh and ReLU, further underscore their efficacy within the proposed DNN algorithm, where they serve as crucial activation functions. The combination of the tanh and ReLU activation functions in the DNN model accelerates the convergence of both training and validation losses during its training. In particular, Tanh normalizes the output in a specific range, which may stabilize and speed up the learning process of the model. ReLU introduces non-linearity and reduces the vanishing gradient problem; therefore, the model can learn more complicated patterns, which further accelerates the convergence. These activation functions together try to optimize the training process and, as a result, make the training of the model quite efficient and effective.
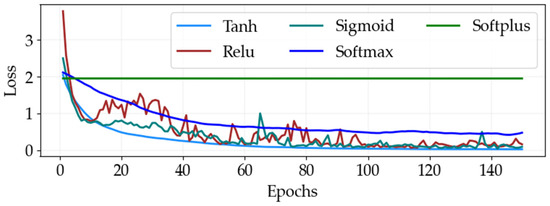
Figure 4.
DNN training loss performance comparison for optimal activation functions at various epoch sizes.
Selecting the appropriate learning rate range for the proposed DNN algorithm involved a systematic and iterative process. During model training, the learning rate was repeatedly tuned while closely monitoring the loss and accuracy values. This approach allowed for identifying critical points where the loss decreased, and the accuracy increased sharply, ensuring the chosen learning rate range would enable efficient convergence, balancing rapid learning and stable performance.
Figure 5 visually demonstrates this selection process, offering valuable insights into the optimal learning rate. The Figure indicates that the optimal learning rate is 0.0001, achieving an accuracy of 99.37% and a minimum loss value of 0.01. This careful and detailed approach to determining the learning rate is crucial for the proposed DNN algorithm, as the learning rate significantly impacts the model’s performance and convergence. By analyzing the relationship between the learning rate, loss, and accuracy, the proposed DNN algorithm is optimized for the given task and dataset, leading to improved results and enhanced model capabilities.
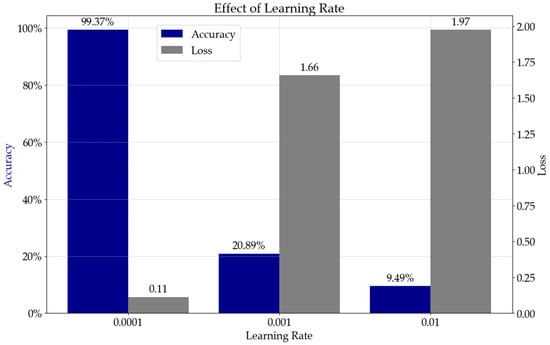
Figure 5.
DNN training accuracy and loss performance for optimal learning rate selection.
Optimizing the model through hyperparameter selection, particularly the choice of optimizer, plays a critical role in minimizing detection errors during training and enhancing the overall classification accuracy. Adaptive optimizers like AdaGrad, AdaDelta, RMSProp, and Adam are preferred over traditional Stochastic Gradient Descent (SGD) for their ability to handle sparse gradients and dynamic objectives more effectively. Among these, Adam stands out as a favored choice due to its amalgamation of AdaGrad’s and RMSProp’s strengths, requiring minimal hyperparameter tuning while consistently delivering superior performance across standard benchmarks. Figure 6 showcases the comparative performance of these optimizers in terms of loss, illustrating that models trained with the Adam optimizer excel in detecting gases in liquids compared to those trained with SGD, RMSProp, and Adamax. Adam’s notable advantage lies in its faster convergence rate, which is crucial for efficient model training. Moreover, the Adam optimizer has proven to be highly effective in enhancing performance and lowering RMSE values [17,19].
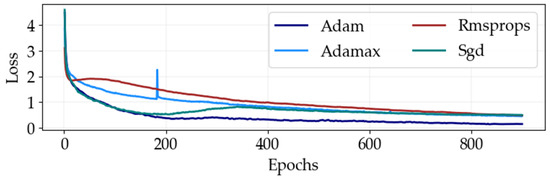
Figure 6.
DNN training loss performance comparison for optimal optimizers at different epoch sizes.
The Adam optimizer consistently outperforms other optimization methods, such as SGD, RMSProp, and Adamax, when training classification algorithms, demonstrating superior accuracy across numerous epochs. It consistently achieves high accuracy levels, typically ranging from 99% to 100% on standard benchmarks. In contrast, SGD, RMSProp, and Adamax also show strong performance, achieving accuracies between 95% and 98% in specific DNN architectures. However, Adam stands out for its consistent and significant improvements in accuracy over successive training epochs. Figure 7 graphically represents the accuracy performance of the DNN algorithm across various training iterations, clearly indicating that the model approaches near-perfect validation accuracy during hyperparameter tuning with the Adam optimizer.
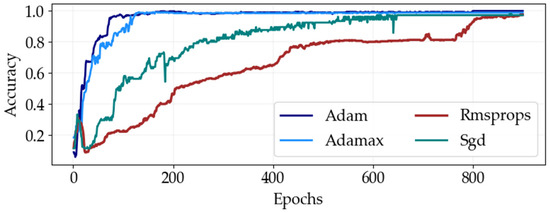
Figure 7.
DNN training accuracy performance comparison for optimal optimizers at different epoch sizes.
The selection of an optimizer should align with the dataset characteristics and specific model requirements, but Adam is often favored as an optimal starting point due to its robust performance and versatility across different scenarios, consistently delivering high accuracy in training classification models.
The optimal hyperparameters for the proposed system, identified after iterative tuning, are presented in Table 1. The table above presents the optimal hyperparameter settings identified for the proposed DNN model. As illustrated in the table above, pairing adaptive optimizers like Adam with activation functions such as ReLU or tanh effectively mitigates the vanishing gradient problem, establishing a robust framework for training effective classification algorithms. Moreover, in this study, the DNN model is also trained with specific hyperparameters: a batch size of 300, five DNN layers, 900 epochs, and a learning rate of 0.0001 alongside the optimizer and activation functions to ensure optimal performance and accuracy in gas detection applications.

Table 1.
Optimal hyperparameter selections for the proposed DNN model.
4. Results and Discussion
4.1. Results of the Proposed DNN
The key results of the proposed optimized DNN-based liquid gas detection and classification are presented in this section. In the fine-tuning process of the proposed model, the trajectory of training accuracy typically increases sharply, while the trajectory of training loss typically declines sharply as epochs increase. As training progresses, both accuracy and loss tend to stabilize with a more gradual adjustment. Meanwhile, validation accuracy and loss initially improve or decrease, reaching an optimal point, but subsequently begin to decrease and increase, respectively. This trend suggests the onset of overfitting, where the model starts to memorize the training data rather than generalize from it. After iterative fine-tuning of various hyperparameters, a well-trained model was achieved. The final model experiments utilized the selected tuned hyperparameters detailed in Table 1 from the previous section, which consistently produced the best results during training.
To evaluate the performance of the proposed optimized DNN classifiers model, accuracy and loss graphs are plotted on both train and validation data, as shown in Figure 8 and Figure 9 consecutively. These graphs provide valuable insights into the model’s performance and the relationship between the input data and output targets. The accuracy metric measures how often the model predicts correctly, while the loss metric quantifies the difference between the actual and prediction outputs. Lower loss and higher accuracy indicate accurate predictions and effective learning of data patterns. The accuracy and loss metrics help as crucial indicators of the model’s effectiveness in solving the given problem and guide further optimization and fine-tuning of the optimized DNN classifiers. As illustrated in Figure 8, the proposed optimized DNN model training and validation loss curves steadily decrease as epochs increase. As demonstrated in the Figure, losses start decreasing after about 75 epochs, indicating initial learning and improvement. Around 300 epochs, the training and validation losses converge and begin to stabilize as the model’s improvement rate decreases. Around 900 epochs, the losses stabilize, indicating the model has reached its peak performance. This observation is vital for understanding the learning process and determining the optimal training time.
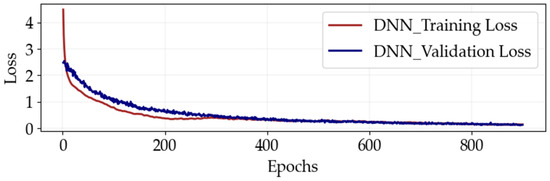
Figure 8.
The proposed optimized DNN model training and validation loss performance at different epoch sizes.
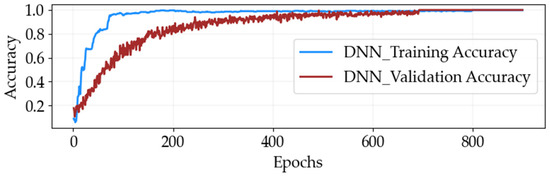
Figure 9.
The proposed optimized DNN model training and validation accuracy performance at different epoch sizes.
Figure 9 illustrates the performance of the proposed optimized DNN model, showing both the training and validation accuracy for a comprehensive view of its progress throughout the training process. Training and validation accuracy illustration consistently increases over 50 epochs, indicating successful learning. However, these metrics do not immediately stabilize, and between 200 and 800 epochs, noticeable fluctuations are observed as the model fine-tunes its parameters and minimizes prediction errors. Around 800 epochs, the fluctuations begin to decrease, and both accuracies stabilize, indicating that the model has successfully learned the underlying data patterns. At 900 epochs, the model reaches an optimal accuracy of 100% on both the training and validation sets, demonstrating its robustness and strong ability to generalize from the training data. This progression underscores the importance of extended training and careful monitoring to avoid overfitting or underfitting, ultimately demonstrating the model’s capability to achieve peak performance with sufficient training.
4.2. Performance Evaluation Metrics of the Proposed DNN
After training the models, the next step is to evaluate their effectiveness using various performance metrics on validation and unseen test datasets. In this study, the well-trained DNN model has been assessed with metrics such as mean squared error (MSE), mean absolute error (MAE), root mean squared error (RMSE), accuracy, precision, recall, and F1-score. These metrics show an all-inclusive evaluation of the model’s performance, including error rates, classification accuracy, and the balance between precision and recall. By calculating these metrics on the test datasets, the effectiveness of the well-trained model in real-world scenarios can be determined, enabling informed decisions about their deployment and further optimization.
In the context of DL models for classification applications, selecting appropriate performance evaluation metrics is essential. Metrics such as MSE, MAE, RMSE, accuracy, precision, recall, and F1-score indicate a quantitative evaluation of the proposed optimized DNN model’s accuracy by comparing predicted outputs to actual values. MSE measures the average squared difference between prediction and actual values, MAE calculates the average absolute difference, and RMSE provides the square root of the average squared differences, indicating a comprehensive evaluation of predictive accuracy. The computation of these metrics is detailed in Equations (2)–(4), formalizing the process for systematic and precise evaluation. These metrics are crucial for evaluating the model’s effectiveness in classification tasks, allowing informed decisions about future deployment and further optimization [17,19,35].
where the number of test data values is specified by r, xi means the actual liquid gas measured collected gases using gas sensor device and edge device environment, and is the estimated value of the classified liquid gas output by the optimized DNN model.
Figure 10 shows the performance of the proposed DNN model using key metrics such as MAE, RMSE, and testing time with varying numbers of hidden neurons.
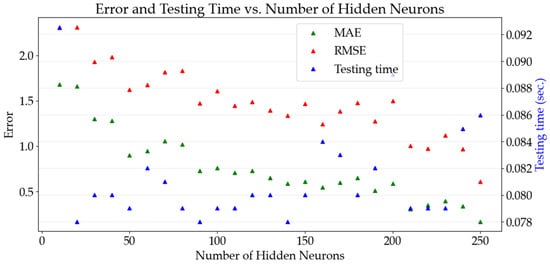
Figure 10.
Performance evaluation of proposed DNN model MAE, RMSE, and testing time at different hidden neurons.
As the number of neurons increases to 150, the errors decrease, but they are not stabilized immediately. After reaching 250 neurons, the errors become small and optimal. Testing time gradually increases with more neurons. The optimal configuration includes 824, 512, and 256 neurons, a batch size of 300, and 900 epochs using the Adam optimizer. This setup achieves an MAE of 0.11, an RMSE of 0.53, and minimal testing time, demonstrating the model’s effectiveness in balancing performance and efficiency.
The other performance evaluation metrics of the proposed DNN model-based gas detection system include accuracy, precision, recall, and F1-score derived from the confusion matrix results. DNN model-based gas detection system considers seven classes to determine accuracy, precision, recall, and F1-score. These fundamental metrics are essential for calculating higher-level performance measures, providing a comprehensive evaluation of the model’s classification capabilities. Furthermore, these key performance evaluation metrics, accuracy, precision, recall, and F1-score, are calculated and defined using sub-indices such as true positive (TP), true negative (TN), false positive (FP), and false negative (FN). These sub-indices also allow for a comprehensive evaluation of the model’s classification performance. Accordingly, accuracy is defined as the ratio of correctly identified liquid gas samples in a specific class to the total number of samples in that class. It provides an overall measure of how often the model makes correct predictions. Mathematically, it is expressed by Equation (5) [36,37].
The second performance evaluation metric, Precision, is calculated by dividing the number of true positive results for liquid gas samples by the total number of positive predictions, including false positives. This metric evaluates the accuracy of the model’s positive prediction results. Mathematically, it is expressed by Equation (6) [36,37].
The third performance evaluation metric, recall, is calculated by dividing the number of true positive results in the liquid gas samples by the total number of actual positives, including those that were not correctly identified. This metric evaluates the model’s ability to detect all relevant instances within the liquid gas samples dataset. Mathematically, it is expressed by Equation (7) [36,37].
The fourth performance evaluation metric, the F1-score, is the harmonic mean of precision and recall, offering a balanced measure that accounts for both metrics. This metric is especially useful for evaluating detection performance, particularly in cases of uneven class distribution, providing a nuanced assessment of the model’s effectiveness in the liquid gas samples dataset. Mathematically, it is expressed by Equation (8) [36,37].
where all sub-indices metrics included above mentioned from Equations (5)–(8) are defined and calculated using true positive (TP), true negative (TN), false positive (FP), and false negative (FN) indices. TP represents the correctly categorized liquid gas samples for each class, while FP denotes the number of samples misclassified into all other classes except the correct one. FN is the number of samples misclassified into the relevant class, and TN represents the correctly classified samples in all other classes except the correct one.
To calculate the values of these sub-indices metrics and to evaluate the various liquid gas classification methods used in this study, a confusion matrix was utilized to obtain the training and testing results of the proposed DNN model. The confusion matrix is a visualization tool used in supervised learning to summarize classification results for each liquid gas sample type, displaying predicted and actual values and showing individual results for each class. These techniques provide a thorough evaluation of each classifier’s ability to predict the correct liquid types. Figure 11 demonstrates the confusion matrix obtained during the training of the proposed DNN model. Correct classifications are represented by the diagonal values of the confusion matrix, while the off-diagonal values indicate misclassifications. The X-axis indicates the predicted seven liquid gas sample classes, and the Y-axis indicates the actual seven liquid gas sample classes.
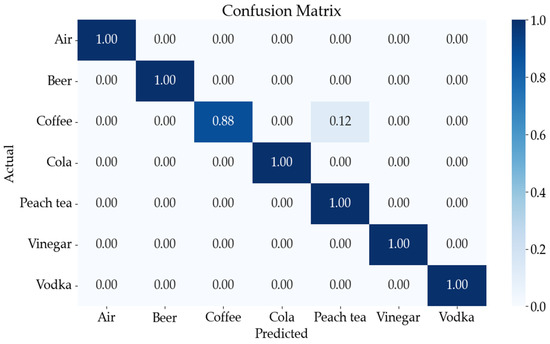
Figure 11.
Performance evaluation of the proposed DNN model in terms of the confusion matrix for the seven-class classification.
Furthermore, the Figure illustrates that the DNN classifier accurately classifies seven classes, with separate accuracies for each class detailed in the confusion matrix. The classes are air, beer, coffee, cola, peach tea, vinegar, and vodka, along with false positive and false negative background detection results. The confusion matrix and classification results for the DNN model demonstrate exceptional performance in distinguishing between these seven classes, achieving individual accuracies of 100% for air, 100% for beer, 88% for coffee, 100% for cola, 100% for peach tea, 100% for vinegar, and 100% for vodka.
After computing the aforementioned sub-indices metrics (TP, FP, TN, and FN), Equations (5)–(8) were used to calculate accuracy, precision, recall, and F1-score to evaluate the performance of the proposed DNN model for each of the seven liquid gas sample classes. The results are presented in Table 2.
Table 2.
Evaluation of DNN Classifier performance results in terms of confusion matrix and classification on the liquid gas dataset.
These detailed accuracy metrics, derived from the confusion matrix shown in Figure 10, are displayed in Table 2. This table provides a comprehensive evaluation of the performance of each classifier, including precision, recall, and F1-score. The DNN classifier achieved an average precision value of 98.47% across all liquid types, with 98.29% accuracy being the highest result. The confusion matrix shows the classification results for each liquid type, including air, beer, coffee, cola, peach tea, vinegar, and vodka. The classification report presents the precision, recall, and F1-score for each liquid type, allowing researchers to identify the strengths and weaknesses of the classifier for specific liquid types. The weighted average precision, weighted average recall, and weighted average F1-score for the DNN classifier are 98.47%, 98.29%, and 98.29%, respectively. Based on these exceptional results, the proposed DNN model demonstrates outstanding performance in distinguishing between the seven liquid classes. This information is crucial for selecting the most appropriate method for liquid classification in various applications, such as quality control, process monitoring, and product identification.
Previously, several shallow learning methods have been proposed for various classification tasks, including support vector machines (SVM) [32,37], extreme gradient boosting (XGBoost) [37], k-nearest neighbors (KNN) [37], and random forest (RF) [37]. As shown in Table 3, the optimized DNN classifier demonstrates superior performance, achieving high accuracy in classifying seven classes. In comparison, the earlier shallow learning methods performed less effectively than the optimized DNN model, primarily due to their limited adaptability and lower learning capacity.
Table 3.
Comparison of the proposed optimized DNN method and previously studied approach.
Moreover, as shown in Table 4, the performance of the proposed optimized DNN model is compared with recent DL techniques reported in studies, including long short-term memory (LSTM) [32], convolutional neural networks (CNNs) [38,39,40], and recurrent neural networks (RNN) [41]. This comparison emphasizes the strengths of the optimized DNN classifier, which outperforms previously reported DL methods in classification accuracy.
Table 4.
Comparison of the proposed optimized DNN method and previously studied approach.
As depicted in Figure 12, the performance of the classifiers was visualized using a principal component analysis (PCA)-based feature explorer graph alongside confusion matrices and classification results. This interactive visualization offers critical insights into how well the DNN classifier discerns between various liquid types using gas detection techniques. Each liquid class, air, beer, coffee, cola, peach tea, vinegar, and vodka, is visually differentiated by distinct colors, facilitating the identification of clusters and patterns within the data. The feature explorer graph for the DNN classifier reveals clear separations between clusters representing different liquid classes, indicating the model’s ability to effectively extract discriminative features.
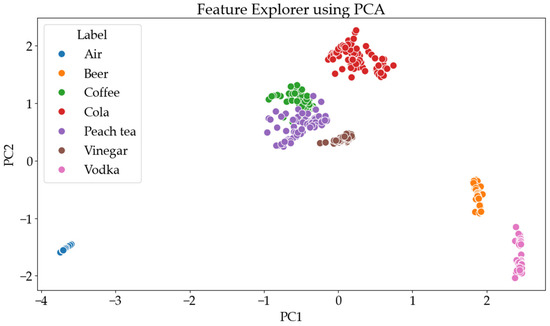
Figure 12.
Performance evaluation of the proposed DNN model in terms of the Feature explorer using PCA graph.
The well-defined and closely grouped clusters for each class indicate high confidence in classification, with minimal errors observed for the two classes. This robust separation in the feature explorer graph indicates that the proposed DNN model achieves high accuracy with faster training and inference times. By enabling a deeper comprehension of classifier performance, this visualization highlights areas of strength and potential improvement, complementing insights from confusion matrices and classification results.
Overall, the feature explorer graph demonstrated that the proposed model is a powerful tool for analyzing the performance of the DNN classifier, confirming its ability to effectively distinguish between the different liquid types and offering valuable guidance for further model optimization and deployment.
5. Conclusions
In conclusion, this study presents a robust, optimized, deep learning-enabled framework for efficient gas detection across various applications. The proposed optimized deep neural network (DNN) model effectively addresses the issues in conventional machine learning (ML), such as slow computation times, convergence issues, and poor adaptability to new data, which can result in increased prediction errors and reduced reliability. The methodology encompasses a comprehensive approach, including data collection, pre-processing, offline training, and online testing, ensuring high accuracy and reliability in gas identification.
The experimental results demonstrate the system’s capability to achieve a remarkable accuracy rate of 98.29% in recognizing different gases, showcasing its potential for applications in automated retail, hospitality, environmental monitoring, and quality control. The integration of optimized DNNs with edge intelligence not only enhances gas recognition speed and accuracy but also eliminates the need for direct human intervention, thereby reducing risks of contamination and maintenance costs.
Overall, this study highlights the transformative potential of the deep learning approach for efficient gas detection, paving the way for innovative solutions that can operate efficiently in dynamic industrial settings. Future work may focus on further optimizing the model and exploring additional applications, reinforcing the significance of this technology in enhancing safety and operational efficiency across various sectors.
Author Contributions
Conceptualization, A.M.D., Y.-J.L., C.-K.Y. and P.-C.P.; methodology, A.M.D., Y.-J.L., J.-H.S., C.-K.Y. and P.-C.P.; software and data preparation, A.M.D., Y.-J.L. and J.-H.S.; model validation, A.M.D. and Y.-J.L.; formal analysis, A.M.D., Y.-J.L., J.-H.S., C.-K.Y. and P.-C.P.; investigation, A.M.D., Y.-J.L., J.-H.S., C.-K.Y. and P.-C.P.; data and experimental setup configuration collection, A.M.D., Y.-J.L. and J.-H.S.; writing—original draft preparation, A.M.D. and Y.-J.L., M.A.B.; writing—review and editing, C.-K.Y., M.A.B. and P.-C.P. All authors have read and agreed to the published version of the manuscript.
Funding
This work was supported by the National Science and Technology Council, Taiwan, under Grant NSTC 112-2221-E-027-076-MY2.
Data Availability Statement
Dataset available on request from the authors.
Conflicts of Interest
The authors declare no conflicts of interest.
References
- Bzai, J.; Alam, F.; Dhafer, A.; Bojović, M.; Altowaijri, S.M.; Niazi, I.K.; Mehmood, R. Machine Learning-Enabled Internet of Things (IoT): Data, Applications, and Industry Perspective. Electronics 2022, 11, 2676. [Google Scholar] [CrossRef]
- Lakshmanna, K.; Kaluri, R.; Gundluru, N.; Alzamil, Z.S.; Rajput, D.S.; Khan, A.A.; Haq, M.A.; Alhussen, A. A Review on Deep Learning Techniques for IoT Data. Electronics 2022, 11, 1604. [Google Scholar] [CrossRef]
- Alajlan, N.N.; Ibrahim, D.M. TinyML: Enabling of Inference Deep Learning Models on Ultra-Low-Power IoT Edge Devices for AI Applications. Micromachines 2022, 13, 851. [Google Scholar] [CrossRef] [PubMed]
- Lee, H.; Lee, N.; Lee, S. A Method of Deep Learning Model Optimization for Image Classification on Edge Device. Sensors 2022, 22, 7344. [Google Scholar] [CrossRef] [PubMed]
- Shah, S.K.; Tariq, Z.; Lee, J.; Lee, Y. Event-Driven Deep Learning for Edge Intelligence (EDL-EI). Sensors 2021, 21, 6023. [Google Scholar] [CrossRef]
- Grzesik, P.; Mrozek, D. Combining Machine Learning and Edge Computing: Opportunities, Challenges, Platforms, Frameworks, and Use Cases. Electronics 2024, 13, 640. [Google Scholar] [CrossRef]
- Li, Z.; Li, H.; Meng, L. Model Compression for Deep Neural Networks: A Survey. Computers 2023, 12, 60. [Google Scholar] [CrossRef]
- Potărniche, I.-A.; Saroși, C.; Terebeș, R.M.; Szolga, L.; Gălătuș, R. Classification of Food Additives Using UV Spectroscopy and One-Dimensional Convolutional Neural Network. Sensors 2023, 23, 7517. [Google Scholar] [CrossRef]
- Mezgec, S.; Koroušić Seljak, B. NutriNet: A Deep Learning Food and Drink Image Recognition System for Dietary Assessment. Nutrients 2017, 9, 657. [Google Scholar] [CrossRef]
- Hafiz, R.; Haque, M.R.; Rakshit, A.; Uddin, M.S. Image-based soft drink type classification and dietary assessment system using deep convolutional neural network with transfer learning. J. King Saud Univ.—Comput. Inf. Sci. 2022, 34, 1775–1784. [Google Scholar] [CrossRef]
- Ahmad, Z.; Shahid Khan, A.; Nisar, K.; Haider, I.; Hassan, R.; Haque, M.R.; Tarmizi, S.; Rodrigues, J.J.P.C. Anomaly Detection Using Deep Neural Network for IoT Architecture. Appl. Sci. 2021, 11, 7050. [Google Scholar] [CrossRef]
- Khan, A.S.; Ahmad, Z.; Abdullah, J.; Ahmad, F. A Spectrogram Image-Based Network Anomaly Detection System Using Deep Convolutional Neural Network. IEEE Access 2021, 9, 87079–87093. [Google Scholar] [CrossRef]
- Almaiah, M.A.; Ali, A.; Hajjej, F.; Pasha, M.F.; Alohali, M.A. A Lightweight Hybrid M Privacy Preserving Model for FC-Based Industrial Internet of Medical Things. Sensors 2022, 22, 2112. [Google Scholar] [CrossRef]
- Site, A.; Nurmi, J.; Lohan, E.S. Machine-Learning-Based Diabetes Prediction Using Multisensor Data. IEEE Sens. J. 2023, 23, 28370–28377. [Google Scholar] [CrossRef]
- Wang, S.-H.; Chou, T.-I.; Chiu, S.-W.; Tang, K.-T. Using a Hybrid Deep Neural Network for Gas Classification. IEEE Sens. J. 2021, 21, 6401–6407. [Google Scholar] [CrossRef]
- Oh, J.; Hwang, H.; Nam, Y.; Lee, M.-I.; Lee, M.-J.; Ku, W.; Song, H.-W.; Pouri, S.S.; Lee, J.-O.; An, K.-S.; et al. Machine Learning-Assisted Gas-Specific Fingerprint Detection/Classification Strategy Based on Mutually Interactive Features of Semiconductor Gas Sensor Arrays. Electronics 2022, 11, 3884. [Google Scholar] [CrossRef]
- Tefera, M.A.; Manie, Y.C.; Yao, C.-K.; Fan, T.-P.; Peng, P.-C. Meta-Learning for Boosting the Sensing Quality and Utility of FSO-Based Multichannel FBG Sensor System. IEEE Sens. J. 2023, 23, 31506–31512. [Google Scholar] [CrossRef]
- Dejband, E.; Tan, T.-H.; Yao, C.-K.; Chang, E.-M.; Peng, P.-C. Enhancing Multichannel Fiber Optic Sensing Systems with IFFT-DNN for Remote Water Level Monitoring. Sensors 2024, 24, 4903. [Google Scholar] [CrossRef]
- Dehnaw, A.M.; Manie, Y.C.; Du, L.-Y.; Yao, C.-K.; Li, Y.-L.; Hayle, S.T.; Peng, P.-C. Bidirectional Free Space Optics Communication for Long-Distance Sensor System. J. Light. Technol. 2023, 41, 5870–5878. [Google Scholar] [CrossRef]
- Mehmood, F.; Ahmad, S.; Whangbo, T.K. An Efficient Optimization Technique for Training Deep Neural Networks. Mathematics 2023, 11, 1360. [Google Scholar] [CrossRef]
- Chen, C.-H.; Lai, J.-P.; Chang, Y.-M.; Lai, C.-J.; Pai, P.-F. A Study of Optimization in Deep Neural Networks for Regression. Electronics 2023, 12, 3071. [Google Scholar] [CrossRef]
- Mattoo, F.A.; Nawaz, T.; Saleem, M.M.; Khan, U.S.; Hamza, A. Deep Learning Based Multiresponse Optimization Methodology for Dual-Axis MEMS Accelerometer. Micromachines 2023, 14, 817. [Google Scholar] [CrossRef] [PubMed]
- El Kafhali, S.; Tayebi, M.; Sulimani, H. An Optimized Deep Learning Approach for Detecting Fraudulent Transactions. Information 2024, 15, 227. [Google Scholar] [CrossRef]
- Ray, P.P.; Dash, D.; De, D. Edge computing for Internet of Things: A survey, e-healthcare case study and future direction. J. Netw. Comput. Appl. 2019, 140, 1–22. [Google Scholar] [CrossRef]
- Ooko, S.O.; Mukanyiligira, D.; Munyampundu, J.P.; Nsenga, J. Edge AI-based Respiratory Disease Recognition from Exhaled Breath Signatures. In Proceedings of the 2021 IEEE Jordan International Joint Conference on Electrical Engineering and Information Technology (JEEIT), Amman, Jordan, 16–17 November 2021; pp. 89–94. [Google Scholar]
- Faliagka, E.; Skarmintzos, V.; Panagiotou, C.; Syrimpeis, V.; Antonopoulos, C.P.; Voros, N. Leveraging Edge Computing ML Model Implementation and IoT Paradigm towards Reliable Postoperative Rehabilitation Monitoring. Electronics 2023, 12, 3375. [Google Scholar] [CrossRef]
- Lin, J.; Zhu, L.; Chen, W.-M.; Wang, W.-C.; Han, S. Tiny machine learning: Progress and futures. IEEE Circuits Syst. Mag. 2023, 23, 8–34. [Google Scholar] [CrossRef]
- Rajapakse, V.; Karunanayake, I.; Ahmed, N. Intelligence at the extreme edge: A survey on reformable TinyML. ACM Comput. Surv. 2023, 55, 1–30. [Google Scholar] [CrossRef]
- Schizas, N.; Karras, A.; Karras, C.; Sioutas, S. TinyML for Ultra-Low Power AI and Large Scale IoT Deployments: A Systematic Review. Future Internet 2022, 14, 363. [Google Scholar] [CrossRef]
- Shamim, M.Z.M. TinyML model for classifying hazardous volatile organic compounds using low-power embedded edge sensors: Perfecting factory 5.0 using edge AI. IEEE Sens. Lett. 2022, 6, 2022. [Google Scholar] [CrossRef]
- Hayajneh, A.M.; Hafeez, M.; Zaidi, S.A.R.; McLernon, D. TinyML Empowered Transfer Learning on the Edge. IEEE Open J. Commun. Soc. 2024, 5, 1656–1672. [Google Scholar] [CrossRef]
- Lamaakal, I.; Ouahbi, I.; El Makkaoui, K.; Maleh, Y.; Pławiak, P.; Alblehai, F. A TinyDL Model for Gesture-Based Air Handwriting Arabic Numbers and Simple Arabic Letters Recognition. IEEE Access 2024, 12, 76589–76605. [Google Scholar] [CrossRef]
- Wang, F.; Zhang, M.; Wang, X.; Ma, X.; Liu, J. Deep learning for edge computing applications: A state-of-theart survey. IEEE Access 2020, 8, 58322–58336. [Google Scholar] [CrossRef]
- Mihigo, I.N.; Zennaro, M.; Uwitonze, A.; Rwigema, J.; Rovai, M. On-Device IoT-Based Predictive Maintenance Analytics Model: Comparing TinyLSTM and TinyModel from Edge Impulse. Sensors 2022, 22, 5174. [Google Scholar] [CrossRef]
- Dehnaw, A.M.; Manie, Y.C.; Du, L.-Y.; Yao, C.-K.; Jiang, J.-W.; Liu, B.-X.; Peng, P.-C. Integrated Sensor-Optics Communication System Using Bidirectional Fiber and FSO Channels and Hybrid Deep Learning Techniques. Sensors 2023, 23, 8434. [Google Scholar] [CrossRef] [PubMed]
- Subramanian, M.; Shanmugavadivel, K.; Nandhini, P.S. On fine-tuning deep learning models using transfer learning and hyper-parameters optimization for disease identification in maize leaves. Neural Comput. Appl. 2022, 34, 13951–13968. [Google Scholar] [CrossRef]
- Hafsa, N.; Rushd, S.; Yousuf, H. Comparative Performance of Machine-Learning and Deep-Learning Algorithms in Predicting Gas–Liquid Flow Regimes. Processes 2023, 11, 177. [Google Scholar] [CrossRef]
- Rana, A.; Dhiman, Y.; Anand, R. Cough Detection System using TinyML. In Proceedings of the 2022 International Conference on Computing, Communication and Power Technology (IC3P), Visakhapatnam, India, 7–8 January 2022; pp. 119–122. [Google Scholar]
- Trivedi, K.; Shroff, H. Identification of Deadliest Mosquitoes Using Wing Beats Sound Classification on Tiny Embedded System Using Machine Learning and Edge Impulse Platform. In Proceedings of the 2021 ITU Kaleidoscope: Connecting Physical and Virtual Worlds (ITU K), Geneva, Switzerland, 6–10 December 2021; pp. 1–6. [Google Scholar]
- Rahman, S.; Khan, Y.A.; Pratap Singh, Y.; Ali, S.A.; Wajid, M. TinyML based Classification of Fetal Heart Rate using Mother’s Abdominal ECG Signal. In Proceedings of the 2022 5th International Conference on Multimedia, Signal Processing and Communication Technologies (IMPACT), Aligarh, India, 26–27 November 2022; pp. 1–5. [Google Scholar]
- Diab, M.S.; Rodriguez-Villegas, E. Performance Evaluation of Embedded Image Classification Models Using Edge Impulse for Application on Medical Images. In Proceedings of the 2022 44th Annual International Conference of the IEEE Engineering in Medicine & Biology Society (EMBC), Glasgow, Scotland, UK, 11–15 July 2022; pp. 2639–2642. [Google Scholar]
Disclaimer/Publisher’s Note: The statements, opinions and data contained in all publications are solely those of the individual author(s) and contributor(s) and not of MDPI and/or the editor(s). MDPI and/or the editor(s) disclaim responsibility for any injury to people or property resulting from any ideas, methods, instructions or products referred to in the content. |
© 2024 by the authors. Licensee MDPI, Basel, Switzerland. This article is an open access article distributed under the terms and conditions of the Creative Commons Attribution (CC BY) license (https://creativecommons.org/licenses/by/4.0/).