Abstract
The purpose of this study is to estimate the effect of roughness layer thickness on the heat transfer and drag coefficients of ellipsoidal particles. Using an OpenFOAM-based particle-resolved direct numerical simulation (PR-DNS) method, we calculated the drag coefficient and Nusselt number for an isolated axisymmetric nonspherical particle with a rough surface in a uniform flow. The PR-DNS results indicate that the drag coefficient varies linearly with the effective roughness at different angles, which can be expressed as . The changes in k are consistent with the Happel and Brenner equation. Furthermore, the influence of roughness on the heat transfer efficiency factor can be represented by . The models for the drag coefficient and Nusselt number are valid within the ranges , and , thereby extending the applicability of the equations developed for smooth particles. These newly developed correlations for the drag coefficient and Nusselt number can be utilized for non-isothermal flows of particle mixtures containing materials with various rough-surfaced ellipsoids.
1. Introduction
Heat transfer and dynamics between particles and fluids are essential phenomena in chemical processes and are widely observed in various types of equipment such as pulverizers, chemical reactors, and fluidized beds [1,2]. The numerical simulation and modeling of particle dynamics and heat transfer phenomena have garnered considerable interest from researchers worldwide. Typically, research on the interaction between particles and fluids is conducted using Eulerian and Lagrangian frameworks [3]. The Eulerian framework is based on the assumption of a continuous medium and is applied to the numerical simulation of highly concentrated particle flows [4]. Conversely, the Lagrangian framework solves for individual particles or particle clusters, and it is now widely employed for different scales of numerical simulations, ranging from microscopic to macroscopic levels [5,6]. The adequate representation of particle body forces is crucial for accurately representing interactions between the solid and liquid phases. Consequently, modeling particle drag and heat transfer coefficients is a major challenge.
The modeling of particle drag forces is generally characterized by the modification of particle drag coefficients [7]. Over the past century, the study of spherical particle drag coefficients has facilitated the accurate expression of spherical particle drag forces across a broad range of particle Reynolds numbers [8]. In large-scale numerical simulations of two-phase flows, particles are often simplified to spherical shapes [9]. However, in practice, most particles are either regular nonspherical or irregular nonspherical [10]. As such, the increasing demand for accuracy in numerical simulations necessitates new requirements for modeling the drag coefficients of irregular particles. The modeling of drag coefficients for irregular particles significantly differs from that of spherical particles, primarily due to the effect of the particle incidence angle on the particle drag coefficient [11]. For irregular particles, a change in the particle incidence angle results in a significant change in the particle drag coefficient. To account for this, it is often necessary to incorporate a directional factor into the expression for the particle drag coefficient or to directly modify the expression. The direct correction of the particle drag coefficient is primarily achieved by associating the drag coefficient with the sine of the incidence angle at and , expressed as [2]. Separate corrections have been proposed for the drag coefficient models for particles at and °. In this context, numerous drag coefficient models for regular nonspherical particles have been proposed [10,12], with the accuracy of the proposed drag coefficient equations within 20%. However, these studies have predominantly employed nonspherical particles with smooth surfaces [2,10,12]. Despite the confirmed significant effect of roughness on the drag coefficient of particles, there is limited research on the drag coefficient of particles with non-smooth surfaces.
Research on surface roughness is prevalent in various fields, including chemistry, materials science, environmental science, and construction, and it constitutes a significant subject within these disciplines. In the 19th century, Darcy identified roughness as a crucial parameter in fluid dynamics, based on an extensive study of pipe roughness [13]. Since then, the impact of roughness has garnered considerable interest from researchers and continues to do so today. For ease of measurement and computation, roughness is primarily represented in engineering applications and research using the average roughness factor, [14]. Depending on the scale of the surface structure, it can be classified into three categories, from smallest to largest: surface roughness, surface corrugation, and shape defects [13]. The actual surface is the result of an organic combination of these three structures [15]. Fractal theory has been demonstrated to be an effective strategy to accurately model the distribution patterns of particle surface structures [16]. However, researchers have often replaced surface structures with blocks of periodic distributions [17]. Previous studies on particle surface roughness have indicated that an increase in particle surface roughness leads to a larger particle drag coefficient [18]. As the Reynolds number increases, the change in particle roughness has a more significant effect on the particle drag coefficient due to the thinning of the particle boundary layer [14].
The convective heat transfer efficiency of the particles is expressed using the Nusselt number, which is the ratio of the thermal conductivity of the fluid layer to the convective heat transfer resistance. The higher the Nusselt number, the more significant the convective heat transfer [17]. Similar to the drag coefficient, the variation in the Nusselt number for elliptical particles follows a sinusoidal square scale [2]. However, Chen et al. [2] conducted a detailed study of elliptical particles and found that the sine square scale does not always hold for elliptical particles. The scale is a factor of variation related to the aspect ratio of elliptical particles. At the same time, this factor is negatively correlated with the aspect ratio. On this basis, his proposed expression for the Nusselt number achieves a prediction error of 5% or less with good prediction accuracy. Furthermore, Dierich [14] found from a study of cylindrical particles with regular concave and convex surfaces that changes in particle surface roughness lead to changes in particle convective heat transfer efficiency and proposed that the convective heat transfer efficiency factor of particles is correlated with of the surface roughness of the particles. The work of Dierich [14], however, was mainly conducted based on a two-dimensional model, which was incapable of comprehensively assessing the correlation between the heat transfer efficiency and variation in roughness for particles with different particle incidence angles and aspect ratios. In addition, relatively little research has been performed on the Nusselt number of irregular particles compared with the extensive research on the drag coefficient.
This study estimates the impact of roughness layer thickness on the heat transfer and drag coefficients of ellipsoidal particles using the particle-resolved direct numerical simulation (PR-DNS) technique. By examining the effects of variations in aspect ratio, roughness, and incidence angle, models were developed to clarify the relationship between the particle drag coefficient and the heat transfer efficiency factor, integrating these variables. Section 3.1 addresses the reliability of these methods. Section 3.2 explores the impact of rough surfaces on the drag coefficient of ellipsoidal particles. Section 3.3 investigates the influence of rough surfaces on the Nusselt number of ellipsoidal particles. This format is intended for publication in a scholarly journal. This structure is designed for inclusion in a scholarly journal article.The PR-DNS results reveal that the drag coefficient linearly correlates with the effective roughness at various angles, which can be expressed as , with variability in k consistent with the Happel and Brenner equation. Furthermore, roughness impacts the heat transfer efficiency factor, quantified as . These findings enhance the understanding of the complex relationship between the drag coefficient and the Nusselt number, broadening the models’ applicability. Such relationships are valuable in sub-grid models for simulating particle flows in industrial applications like chemical reactors or coal gasification furnaces, enabling more accurate predictions.
2. Conservation Equations and Simulation Methods
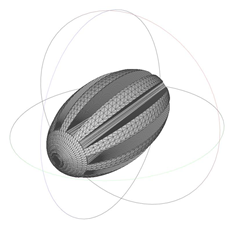
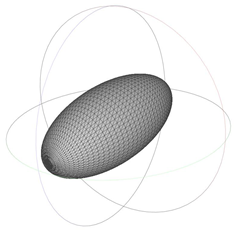
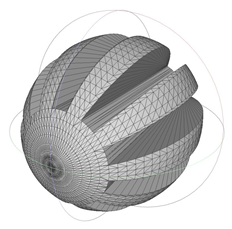
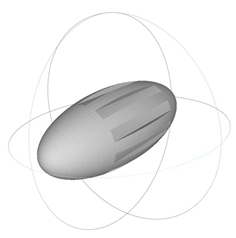
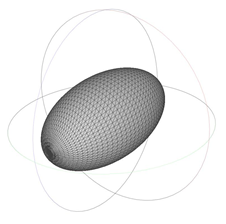
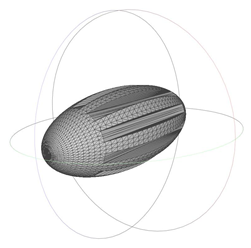
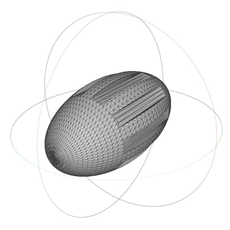
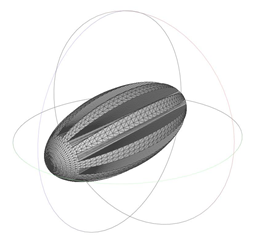
Based on the OpenFOAM-based buoyantBoussinesqPimpleFoam solver, numerical simulations of particles containing rough surfaces were carried out to study the effect of particle rough surfaces on the particle drag and Nusselt number, and to establish a mathematical model of particle drag and Nusselt number for particles containing particle roughness. The ellipsoidal particles used in this study were calculated using Equation (1), and the aspect ratio was calculated as [2]. The major axis of the particle was set to 200 m, and the aspect ratio of the particles was changed by changing the size of the minor axis of the particle. As shown in Table 1, models of smooth-surface ellipsoidal particles with different aspect ratios were obtained by varying the particle short axis. To investigate the effect of particle roughness on the particle drag coefficient and Nusselt number, the particle roughness is represented using periodic blocks distributed over the particle surface, and several particles with different rough surfaces, as shown in Table 1, are considered. In the table, refers to the volume equivalent diameter of the particles, and represents the characteristic parameter of particle surface roughness. The particle roughness was described using the characteristic parameter , where is the height of the irregular surface and D is the characteristic size [13,14]. The particle roughness in this study ranges from to [14]. A schematic of the particle section is shown in Figure 1. In this study, the properties of the fluid are assumed to be independent of temperature while ignoring the effects of the thermal effect on the fluid’s viscosity and buoyancy. The aspect ratio is an important parameter commonly used to characterize the shape of ellipsoidal and cylindrical particles and is therefore used to characterize the cylindrical particles under study. Particle models were obtained using 3D modelling software. Particles from Table 1 were individually placed in the positions shown in Figure 2 for analysis. To avoid the influence of the wall on the particle calculation, the size of the flow-field region was determined to be using the volume equivalent diameter, and the distances of the particles from the inlet and outlet of the flow-field region were and , respectively. The mesh partitioning library snappyHexMesh was used to mesh the fluid domain, generating a mixed mesh of hexahedral meshes with a total mesh size of 1.5 million. The Reynolds number of the particles used in this study ranged from 10 to 200, and the Prandtl number was assumed to be a constant value of 0.744 [2,19]. The Prandtl number is calculated using Equation (2).
where x, y, and z are the coordinate positions of a point on the surface of the ellipsoid and a, b, and c are the axis lengths of the ellipsoid.
where , , and are the Prandtl number, specific heat capacity, dynamic viscosity, and thermal conductivity.

Table 1.
Description of the regular nonspherical particles considered in this study and their geometrical properties.
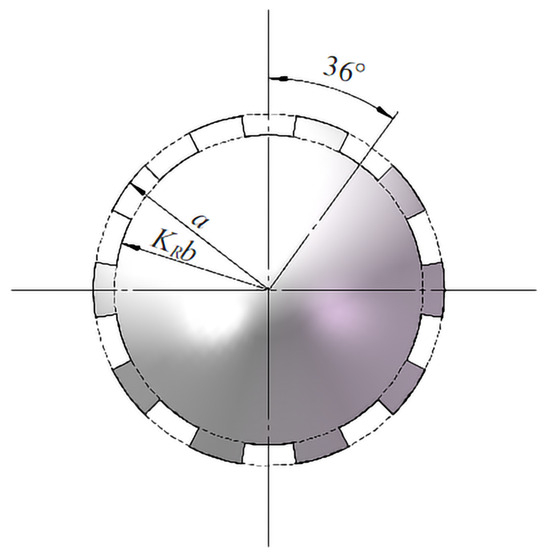
Figure 1.
Enlarged x-directional view of the particle under study, with the roughness parameter .
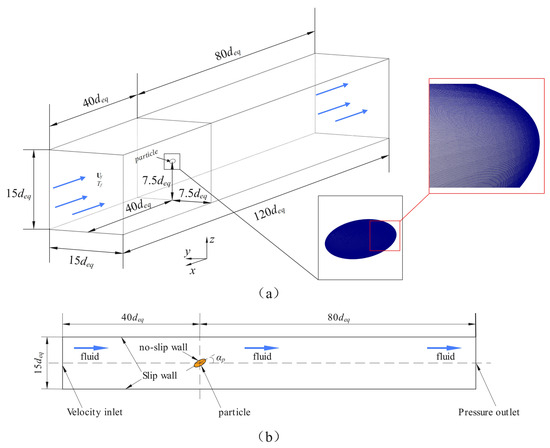
Figure 2.
Schematic representation of the computational domain (a,b).
To ensure the accuracy of the calculated results, the experimentally obtained data were compared to those obtained by Happel and Brenner, Chen et al. [2], Richter et al. [20], Ke et al. [21], and Ouchene et al. [12]. The equations used in the literature are listed in Table 2.
Table 2.
Description of the regular nonspherical particles considered in this study and their geometrical properties.
The drag force of a particle is calculated based on the area of the particle by local positive and tangential stresses on the particle, as shown in Equation (3) [23]. The drag coefficient and particle Reynolds number are calculated as shown in Equations (4) and (5) [24,25].
where is the particle drag force, ; p is the normal stress, ; is the fluid viscosity, · ; is the fluid velocity, /; is the unit vector normal to the particle surface; s is the particle surface, m2; is the particle drag coefficient; is the fluid density, /; is the inlet fluid velocity, /; and is the volume equivalent diameter, .
The particle volume equivalent diameter is expressed as:
The drag and Nusselt coefficients of the particles can be expressed as follows:
Particle roughness is defined in the form of the equation shown below.
In addition to the study of the particle drag coefficient to characterize the heat transfer pattern between the particle and fluid, the Nusselt number was used to characterize the heat transfer properties of the particle. As shown in Equation (10), the Nusselt number can be expressed as the product of the area fraction of the temperature over a gradient and the product of the ratio of the volume equivalent diameter of the particle to the difference in temperature and the product of the area of the particle [2,14].
To assess the effect of particle roughness on particle heat transfer efficiency, the particle heat transfer efficiency factor is expressed in the form of Equation (11) [26].
To guarantee the convergence of the computational results, dimensionless times were employed to determine the computational times for the numerical simulations under different conditions. The dimensionless time is determined using the equation , which guarantees a result of 1600. The Gauss linearUpwind model was utilized to guarantee the accuracy of the results and the stability of the numerical algorithm.
3. Results and Discussion
3.1. Validation of Results
The choice of fluid domain size has been demonstrated by several researchers. Song et al. [27] used a 200 diameter Plexiglas tube to measure the drag coefficient of a 10 diameter spherical particle with an average relative error of % compared to Chen et al. [2] measurements. Based on the LBM, Chen et al. [2] used a fluid domain of to calculate the drag coefficient of ellipsoidal particles. The results of the calculations by Chen et al. [2] were compared with those of Richter et al. [22], Sanjeevi et al. [28], and Ke et al. [21], and the maximum relative error was within 10%. In a study of the particle drag coefficients based on the cell model, Wei et al. [29] found that the ratio of the particle volume to the unit cell volume could be used to estimate the size of the calculated domain. When the ratio was % or lower, the presence of the boundary had a negligible effect on the particles. Therefore, in this study, a calculation domain of was used to calculate the particle drag coefficient and Nusselt number. At the same time, the formula was used to calculate the computation time for different particles and ensure that is the same value for each case. Figure 3a shows the drag coefficients of the particles for , 2, and . It can be observed that the particle drag coefficients reached a steady state within the chosen dimensionless time range. The convergence curve of the Nusselt number shown in Figure 3b indicates that the Nusselt number reached a steady state at . The particle drag coefficients and Nusselt numbers were calculated for particles with , 2, and and smooth surfaces, respectively, at different Reynolds numbers. The results were compared with those of Chen, as shown in Figure 4. It can be seen from Figure 4 that the particle drag coefficient increased with increasing particle Reynolds number, and the Nusselt number decreased with increasing particle Reynolds number. The numerical simulation results were in general agreement with the results of the classical literature. The average relative errors of the drag coefficient and Nusselt number were calculated for particle incidence angles of 0° and 90° with values of %, %, %, and %, respectively. Based on the PR-DNS method, Castang et al. [10] calculated the drag coefficients for several ellipsoidal particles and compared the results with those obtained by Ouchene [12], Zastawny [30], and Sanjeevi et al. [28]. It was found that for and , the values of ° and ° were 3.84 and 5.32, respectively, and the results were similar to those obtained by Sanjeevi et al. [28] The results of Castang et al. [10] are more accurate because they used a larger computational domain and finer grid in the same way as Ouchene et al. [12]. It was also demonstrated that the results obtained by Ouchene and Zastawny et al. [30] were on the lower side. The relative errors between the calculated values in this study and those reported by Castang et al. were % and %, respectively. This demonstrates that the results calculated in this study have a high degree of confidence. The values of ° and °, obtained in this study for and , were also compared with the calculated results of Castang et al. and it was found that the relative errors were % and %, respectively. Figure 5 plots the results of this study against those calculated by Castang et al. [10], Sanjeevi [28], Ouchene [12], and Zastawny [30]. It can be observed that for , , and °, the calculated results for the particle drag coefficients are closer to those of Castang et al. [10] and Sanjeevi [28]. Hölzer and Sommerfeld [31] calculated ° and ° for and , and the relative errors with the results of this study were % and %, respectively. This also proves that the results of this study have a high degree of confidence. This result also proves that the calculation domain of can obtain relatively accurate calculation results in the range of Reynolds numbers selected in this study. In summary, this study shows that relatively accurate results can be obtained using OpenFOAM-based buoyantBoussinesqPimpleFoam for the calculation of particle drag coefficients and Nusselt numbers.
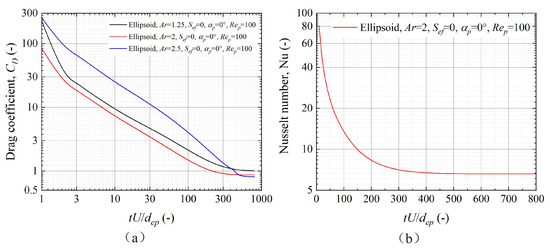
Figure 3.
Time evolution of the drag coefficient (a) and Nusselt number (b) for ellipsoidal particles.
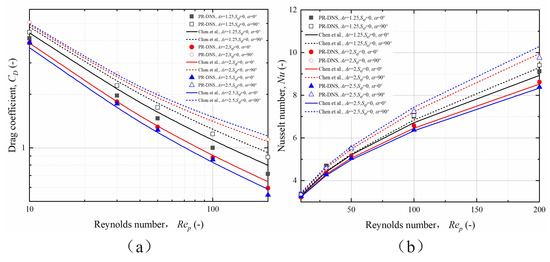
Figure 4.
Numerical simulation results of particle drag coefficients and Nusselt number versus classical results. (a) Particle drag coefficient; (b) particle Nusselt number [2].
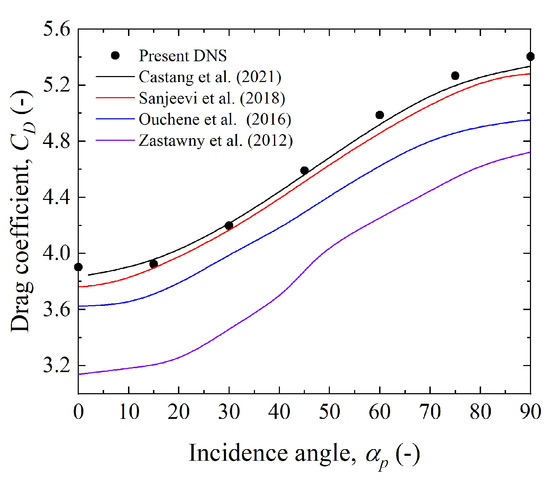
Figure 5.
Comparison of the calculated ellipsoidal particle drag coefficients using and with the results reported in the literature by Castang et al. [10], Sanjeevi et al. [28], Ouchene et al. [12], and Zastawny et al. [30] to verify the accuracy of the PR-DNS calculations.
As illustrated in Figure 6a, the airflow velocity distribution at different Reynolds numbers for an aspect ratio highlights a pronounced symmetry in the flow field within the studied Reynolds number range. This symmetry suggests a stable aerodynamic behavior around the particle. Additionally, the diagram shows the acceleration of the fluid both in the vicinity of the particle and in the trailing wake, indicating dynamic interactions that affect flow characteristics. Figure 6b details the changes in the dimensionless temperature ratio surrounding the particle across varying Reynolds numbers. It is evident from the data that an increase in flow velocity significantly enhances thermal convection, which in turn augments the temperature gradient at the surface of the particle tracer. The temperature profile within the flow field also retains a symmetric pattern, aligning with the aerodynamic data and suggesting a consistent thermal response under varying flow conditions. These observations are not only indicative of the complex interplay between thermal and fluid dynamics around the particle but also validate the consistency of thermal convection mechanisms across different operational regimes. Such detailed analyses of the thermal and flow symmetry under varying conditions provide a deeper insight into the thermal management and optimization strategies in particle-laden flows. These results corroborate earlier findings by Chen et al. [2] and Dierich [14], enhancing the reliability and depth of the current study.
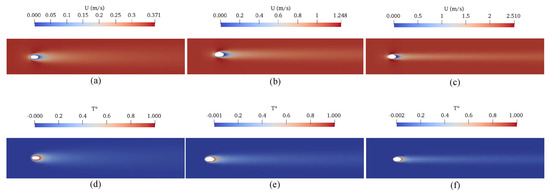
Figure 6.
Contour plots of fluid velocity and the isotherms for different values: (a) the fluid velocity for and ; (b) the fluid velocity for and ; (c) the fluid velocity for and ; (d) the isotherms for and ; (e) the isotherms for and ; (f) the isotherms for and .
3.2. Effect of Ellipsoidal Particle Roughness on the Drag Coefficient
Figure 7 shows the relationship between the particle drag coefficient and particle surface roughness for the 0° and 90° particle incidence angles. For , 2, and , the drag coefficients of the particles were greater at ° than at °. In addition, the effect of changing the incidence angle on the drag coefficient was more pronounced for larger aspect ratios. The main reason for this is that the windward area of the particles has a significant effect on the particle drag coefficient and the change in the windward area is more pronounced at larger aspect ratios. Meanwhile, the variation in the particle drag coefficient with the incidence angle was more significant for larger Reynolds numbers. The reason for this phenomenon is that as the particle Reynolds number increases, the pressure drag makes a stronger contribution to the particle drag, which is more obviously determined by the windward area. The particle drag coefficient increased with increasing particle surface roughness for , 2, and . As the Reynolds number increases, the rate of change of the particle drag coefficient with particle roughness increases. This is because when the particle Reynolds number increases, the particle boundary layer tends to be thinner, which leads to a shift in roughness that is more likely to produce a remarkable difference in the particle traction coefficient. The increase in the drag coefficient with the particle angle is calculated using the equation °. It can be demonstrated that the maximum increase in the particle drag coefficient with the incidence angle increases from 1.19 to 2.33 as the particle aspect ratio increases, which follows the results obtained from the available classical literature.
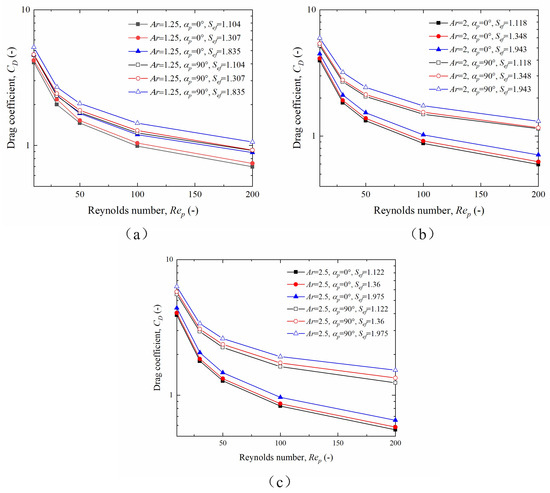
Figure 7.
Variation in the drag coefficient with Reynolds number for particles of different roughness for (a) Ar = 1.25, (b) Ar = 2, and (c) Ar = 2.5.
Figure 8 shows the variation in the particle drag coefficient with particle angle for , 2, and . It can be seen that the trend in the drag coefficient for particles with different roughness conditions is the same as that in the drag coefficient for smooth particles. When the aspect ratio and Reynolds number are kept constant, the drag coefficient of particles gradually increases with the increase in particle angle. As the roughness increases, the drag coefficient of the particles also increases. Comparing the results for different aspect ratios, it can be seen that as the aspect ratio increases, the drag coefficient decreases for incidence angles less than 15° and increases for incidence angles greater than 15°. This result is consistent with the findings of Chen et al. [2]. Meanwhile, consistently with results of Chen et al. [2], the threshold incidence angle at which the trend in particle drag coefficient versus aspect ratio shifts as the Reynolds number increases is raised to approximately 30°. Further, by calculating the increase in drag coefficient with the angle of incidence, the rate of change in the drag coefficient increases as the particle incidence angle grows. This phenomenon suggests that the orientation of the grooves on the particle surface affects the increase in the particle drag coefficient. When the grooves on the particle surface are coherent with the direction of fluid flow, the rate of change in the particle drag coefficient is slight. Conversely, the rate of change in the particle drag coefficient increases for particles with surface grooves perpendicular to the direction of fluid flow. Simultaneously, comparing the variation in particle drag coefficient at different Reynolds numbers for the same aspect ratio, it is evident that the increase in drag coefficient is greater at larger Reynolds numbers than at smaller Reynolds numbers. The explanation for the phenomenon can be attributed to variations in the boundary layer. Comparing the profiles of the drag coefficients of particles with different aspect ratios, it is apparent that the impact of roughness on the amount of drag coefficient evolution is more noticeable for particles with larger aspect ratios.
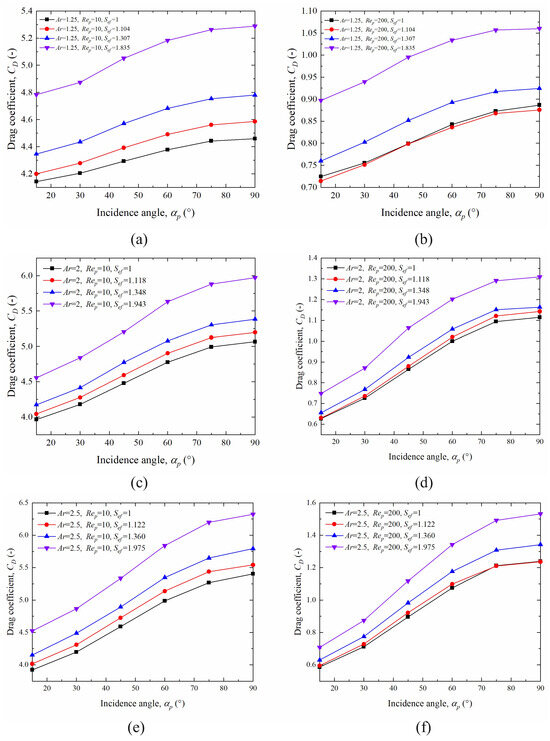
Figure 8.
Relationship between particle drag coefficient and particle incidence angle for different aspect ratios and Reynolds numbers: (a) particle drag coefficient for and ; (b) particle drag coefficient for and ; (c) particle drag coefficient for and ; (d) particle drag coefficient for and ; (e) particle drag coefficient for and ; (f) particle traction coefficient for and .
Using previous data, the particle drag coefficients were measured as a function of the particle roughness for , 2, and and °, 15°, 30°, 45°, 60°, 75°, and 90°. The relationship between the particle drag coefficients and particle roughness parameters was statistically investigated. Figure 9 shows the relationship between the particle drag coefficient and the particle roughness factor for . It can be observed that the particle drag coefficient increases with increasing roughness factor, and the resulting change follows a linear pattern. The R2 values of the fitted results were calculated and were all greater than 0.99 with a good fit. The results were subjected to ANOVA, and the p-values were calculated and were all less than 0.05. Therefore, the fit based on the linear function of the drag coefficients of the particles under different roughness conditions had a high degree of confidence. The linear relationship between the particle drag coefficient and roughness is shown in Equation (12). The curve is shown in Figure 10. As shown in Figure 9 and Table 2, the slope of Equation (12) increases progressively as the particle incidence angle increases. Establishing a relationship between the k-values at different incidence angles and the k-values for conditions with incidence angles of 0° and 90° results in Equation (13). The drag coefficient of smooth particles is expressed in the form of Equation (14). Therefore, the relationship between the particle drag coefficient and particle roughness can be expressed as Equation (15).
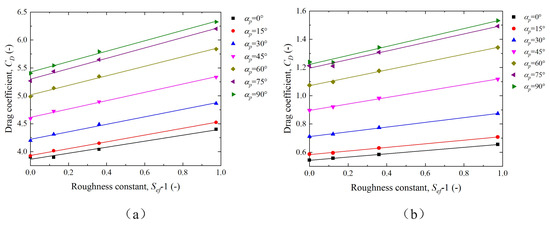
Figure 9.
Relationship between particle drag coefficient and roughness factor for (a) = 10 and (b) = 200 for .
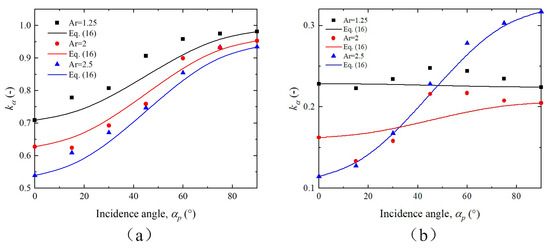
Figure 10.
vs. incidence angle for particle Reynolds numbers of (a) = 10 and (b) = 200 for different particle aspect ratios.
A comparison of the calculated results of particle drag coefficients as a function of the angle of incidence for three aspect ratios and different Reynolds numbers with those predicted in the classical literature is shown in Figure 11. It can be observed that the PR-DNS calculations have good confidence in the range of values for the parameters studied. As can be seen in Figure 11a, Chen et al. [2] and Ke et al. [21] show similar trends to the results calculated in this study with an error of approximately 7%, whereas the results of Richter et al. [20] and Ouchene et al. [12] are relatively steeper and thus lead to the under- and over-prediction of the particle drag coefficients for smaller and larger incidence angles, respectively. At Ar = 1.25, the Happel and Brenner model based on spherical particle correction is similar to the results obtained in this study, thus demonstrating that the results have good confidence and that the trends obtained by Chen et al. [2], Ke et al. [21], and this study are more realistic. As shown in Figure 11b, the results obtained in this study follow a similar trend to those obtained by Chen et al. [2]. However, when Ar = 2, the results of the Richter et al. [20] and Chen et al. [2] models are similar in both trend and value to those of the present study, demonstrating that the results of the present study are more reliable. However, it is worth noting that Richter et al.’s [20] is a spherocylinder model for Ar = 5; therefore, although the results obtained in this study are similar to those of Richter et al. [20], this result provides weaker support for the credibility of the results of this study. Combined with the results of Ar = 2.5, it can be seen that the results of this study are a better fit for those presented by Chen et al. [2]. However, the model proposed by Ke et al. [21] provides a high prediction of the drag coefficient for increasing particle aspect ratios. The results of the Happel and Brenner model and numerical simulations are both in error, suggesting that the model is not suitable for larger aspect ratios, especially at larger Reynolds numbers, and that the model differs significantly from the actual situation. Overall, the results obtained in this study are within the interval of the literature results and are similar to those of Chen et al. [2]. This demonstrates that relatively accurate results can be obtained for the prediction of particle drag coefficients with rough surfaces, based on the Chen et al. [2] model.
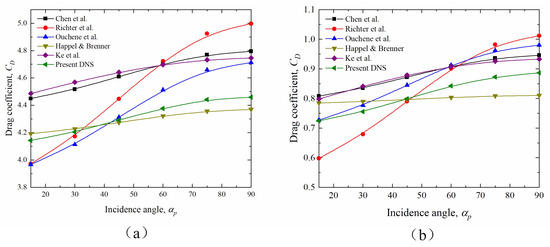
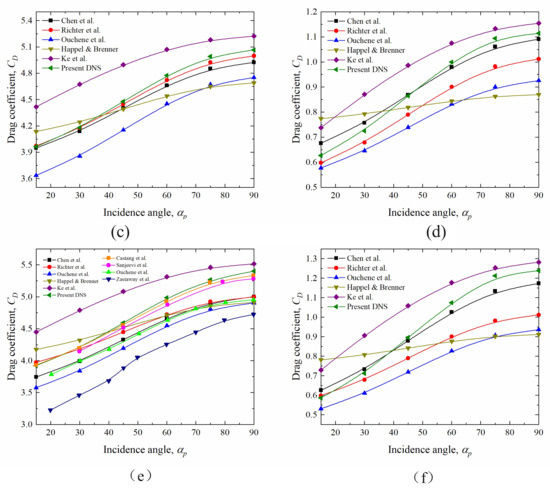
Figure 11.
Comparison of PR-DNS calculation results with results in the literature: (a) and ; (b) and ; (c) and ; (d) and ; (e) and ; (f) and [2,10,12,21,22,28,30].
This study builds on the previous content to establish a correlation between the particle drag coefficient and the particle drag coefficient of smooth particles for different roughness values (Equation (16)). A model to characterize the drag coefficient of particles with rough surfaces was obtained by combining the equation for the drag coefficient of smooth particles constructed by Chen et al. [2], which are shown as Equations (16)–(18). The data obtained in this study were fitted using this equation, and the results are shown in Figure 12. Chen’s formula is based on the Clift and Gauvin formula, with some restrictions on the parameters to reduce the degrees of freedom of the fit, and provides good results in the range studied [32]. However, as a formula to describe the drag coefficient of ellipsoidal particles, it does not establish a direct link with the standard spherical particle drag coefficient formula. Ideally, the ellipsoidal particle drag formula should degenerate to the spherical particle drag formula when the aspect ratio is taken as 1 [12]. Therefore, comparing the results of Chen’s equation for Ar = 1 with the Turton and Levenspiel spherical particle drag equation, it can be seen that Chen’s results differ with respect to the spherical particle drag coefficient by % and %, respectively. Thus, Chen’s equation appears to be slightly overestimated when the particle drag coefficient is calculated. A correction to this equation gives Equations (17) and (18), respectively. Chen’s equation and a comparison of the newly corrected equation with the numerical simulation results in this study are shown in Figure 13. It can be seen that Chen’s results are highly relative to the numerical simulation results, and the deviation between the newly corrected model and the numerical simulation results may be due to the fitting error as well as the calculation error of the numerical simulation. The corrected drag coefficient model was applied to the calculation of particle drag coefficients for , , and . It is worth mentioning that the term in the drag coefficient equation only has a significant effect on the calculation of the drag coefficient when the Reynolds number of the particles is large. When the Reynolds number was equal to 200, the weight of this term in the drag coefficient was only %. Therefore, in the range of Reynolds numbers considered in this study, the removal of this term did not have a significant effect on the results. However, the presence of this term allows for a better extension of the formula and is more adaptable for future use in predicting particle drag coefficients in high Reynolds number sections.
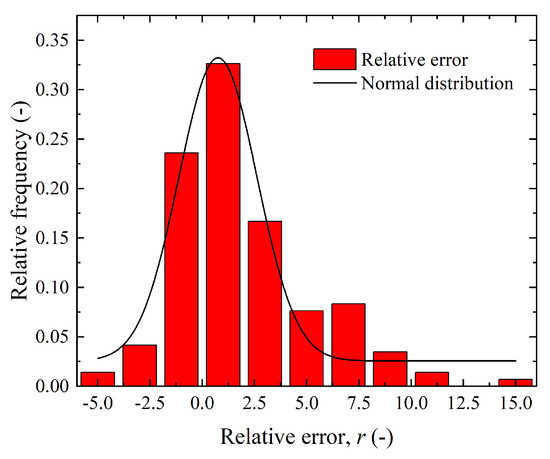
Figure 12.
The relative frequency distribution of the relative errors was calculated based on the predictions of the new corrected drag coefficient model and the PR-DNS results.
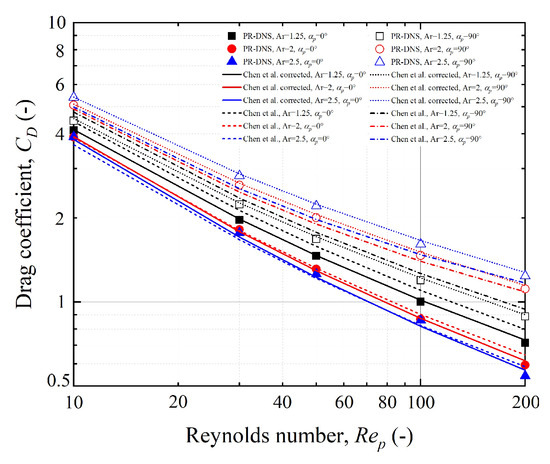
Figure 13.
Comparison of smooth surface particle drag coefficient correction model calculation results with Chen model calculation results and PR-DNS numerical simulation results [2].
3.3. Effect of Ellipsoidal Particle Roughness on the Nusselt Coefficient
The heat transfer efficiency factor proposed by Bhattacharyya and Singh was used by Dierich to describe the effect of roughness on heat transfer efficiency [14,26]. It is expressed as the ratio of the Nusselt number of smooth particles to the Nusselt number of rough particles and is denoted by . When was greater than 1, the heat transfer was enhanced. Dierich’s study of cylindrical particles found a power relationship between and the roughness of the particles, which can be expressed as . An ANOVA study of the relationship between the heat transfer efficiency factor and the roughness constant of the particles at different Reynolds numbers found that the heat transfer efficiency factor of the particles was independent of the Reynolds number, which is consistent with the results of Dierich’s study on cylindrical particles. Therefore, the average heat transfer efficiency factor was calculated for ellipsoidal particles with different roughness values, which is expressed by the formula , where n is the total Reynolds number and is the heat transfer efficiency factor of the particles when the Reynolds number is i. The curves for , , , , , and are shown in Figure 14. It can be observed that the heat transfer efficiency factor gradually decreases with increasing particle roughness for the same aspect ratio. The reason for this is that the presence of the grooves causes a decrease in the airflow rate inside the grooves, which acts as adiabatic, thus leading to a decrease in the heat transfer efficiency. At the same time, the relationship between the heat transfer efficiency factor and the roughness index is the same for particles with different aspect ratios. This result indicates that the aspect ratio does not affect . Similar to cylindrical particles, is related to the roughness of the particles in a power relationship, but the value tends to be . Figure 15 shows the results of fitting to this equation. This indicates that accurately predicts the results obtained from the numerical simulation. Using the relative error of the results for each roughness was calculated separately, and the maximum error was %. The average relative error of the results was also calculated using and was found to be %.
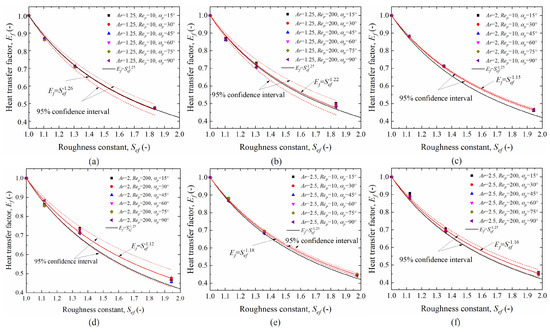
Figure 14.
Relationship between particle roughness constant and heat transfer factor: (a) and ; (b) and ; (c) and ; (d) and ; (e) and ; (f) and .
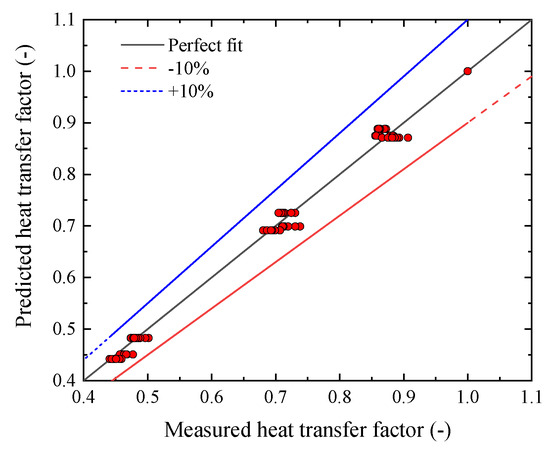
Figure 15.
Comparison between measured heat transfer factor and predicted heat transfer factor with different-shape particles calculated by using .
Based on the Happel and Brenner equation and Chen’s results, Nusselt number correction equations that can predict particles with rough surfaces were obtained, as shown in Equations (19)–(21). A comparison of the predicted results from Equation (19) was performed. The numerical simulation results for different incidence angles are shown in Figure 16. Within the studied range, it was evident that the equations could achieve good prediction accuracy. The maximum relative error was % and the average relative error was %. This formula can better capture the variation in the Nusselt number under different conditions. In particular, when the particle aspect ratio was 1.25, and the Reynolds number was 200, a small decrease in the Nusselt number with an increase in the incident angle could be better predicted. Because the Richter equation was proposed for particles with an aspect ratio of 5, it failed to compensate for the impact of the aspect ratio on the Nusselt number. The results of the PR-DNS simulations were predicted using Chen’s and Ke’s formulas as submodels of Equation (19); the results are shown in Figure 16. It can be observed that Chen’s, Ke’s, and the newly corrected formulas are all relatively accurate in predicting the trend of Nesselt for particles of different roughness and aspect ratios at different Reynolds numbers with respect to the angle of incidence. However, because Ke’s formula predicts the Nusselt number for smooth particles at Reynolds numbers higher than the actual value, it does not provide a relatively satisfactory prediction for Nusselt numbers with rough surfaces. The calculated values are lower. Further calculations of the relative error between the PR-DNS calculated and predicted values yielded average relative errors of %, %, and % for Chen’s, Ke’s, and the newly corrected formulas, respectively. As shown in Equation (19), the sine of the angle is expressed as a coefficient related to the aspect ratio, and the fitting results in Figure 16 also show good fitting accuracy. However, the introduction of this parameter also leads to a further increase in the complexity of the equation. The need to introduce this parameter is discussed next. In Happel and Brenner’s definition, this term is denoted. This form has high accuracy in characterizing the Nusselt number of a prolate ellipsoid [1]. Chen et al. [2] found that for ellipsoidal particles, the exponential term of the sine term changes significantly with the aspect ratio, with the value dropping by % as is changed from 1.25 to 2.5. Figure 16 shows that when is changed to in Equation (22), the error in the prediction of the Nusselt number by the formula increases slightly, with an average relative error of % between the predicted and calculated values. This indicates that the variation pattern of the Nusselt number with rough-surface particles is close to that of. However, did not lead to a significant improvement in error within the parameters of this study. Therefore, it is reasonable to express the sine term in Equation (22) as either or when the Reynolds number is . Therefore, based on the results of this study, it is concluded that when predicting the Nusselt number for particles with rough surfaces, whether m needs to take the value of the variation associated with Ar needs to be verified by more accurate and more adequate numerical simulation results. In addition, based on a previous study and Dierich’s study, Dierich expressed the efficiency index for cylindrical particles as and this study obtained similar results for by examining three ellipsoidal particles. However, because Dierich’s results were based on a two-dimensional model, there may have been an oversimplification. In addition, when using aspect ratios to characterize cylindrical particles, if Ar=1, the cylindrical shape remains cylindrical, whereas ellipsoidal particles degenerate into spherical shapes. When characterized by sphericity, the sphericity of the cylindrical particles was 0.87. Therefore, the cylindrical particles did not degenerate into spherical particles with an aspect ratio of 1. The discrepancy in the heat transfer efficiency metrics was due to the difference in the particle form properties. Therefore, the Nusselt number equation obtained in this study cannot be used to predict cylindrical particles. As shown in Figure 11, the Nusselt number is related to the particle aspect ratio, Reynolds number, and roughness. As the particle aspect ratio increased, the degree of response of the particle Nusselt number to the angle of incidence increased. In particular, the response of the Nusselt number to the angle of incidence was greater for larger Reynolds numbers. As roughness increased, the particle Nusselt number decreased. The decrease in airflow velocity over parts of the particle surface owing to increased roughness is the main reason for the decrease in the particle Nusselt number.
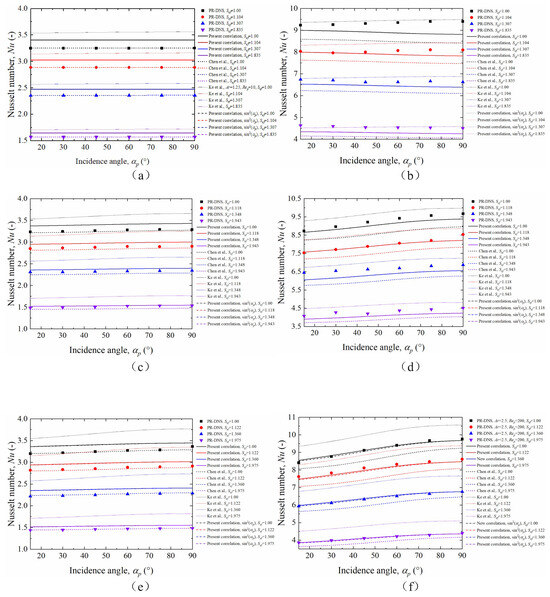
Figure 16.
Comparison (a–f) between measured heat transfer factor and predicted heat transfer factor with different-shape particles calculated by using [2,21].
This study explores the variations in drag coefficients and Nusselt numbers for particles with twelve different aspect ratios, particle roughnesses, and volume equivalent diameter under various roughness conditions. However, it is important to note that the results are based on simplified models of particle rough surfaces, and real-world particle surfaces are considerably more complex. Additionally, the range of parameters used in this study is limited. Therefore, the applicability of the proposed models needs to be further validated with a broader set of samples. Also, it is essential to validate and further optimize the models using particles with complex surfaces obtained through three-dimensional geometric reconstruction techniques or fractal algorithms [14,33].
4. Conclusions
In this research, the OpenFOAM-based buoyantBoussinesqPimpleFoam solver was utilized to evaluate the particle drag coefficients and Nusselt numbers for ellipsoids with rough surfaces with to 200 and . The influence of the roughness layer thickness on the flow and heat transfer was systematically explored. The drag coefficient and Nusselt number correlations developed in this study are applicable to non-isothermal granular flows involving a mixture of materials with rough-surface ellipsoids and multiple-rough-surface ellipsoids. The following conclusions can be drawn based on the numerical data and discussion:
1. The particle drag coefficient increases as the particle roughness increases. As the Reynolds number of the particles increased, the coefficient of drag progressively increased. The variation in the drag coefficient at different angles conforms to a linear function and can be expressed as . In addition, k in the equation gradually increases with increasing angle, and the trend follows the Happel and Brenner formula. k values evolved in the form of . The k value showed a negative correlation with the aspect ratio, and the range of variation of the k value gradually decreased as the aspect ratio increased. The drag correlation for ellipsoids is presented in this article, and the equation is valid for ellipsoidal particles (, , and ). A comparison between the PR-DNS data in the literature and the proposed drag correlation predictions for ellipsoids shows that the drag correlation can accurately predict the drag coefficients of ellipsoids with different aspect ratios.
2. The variations in the heat transfer efficiency factor and Nusselt number with the particle roughness were investigated. It can be seen that the roughness has a significant effect on the heat transfer efficiency factor. As the particle roughness increased, the local airflow velocity decreased, and thus the heat transfer efficiency factor decreased. There is also a large effect on the Nusselt number with an increase in particle roughness, leading to a rapid decrease in the particle Nusselt number. Similar to cylindrical particles, the relationship between the heat transfer efficiency factor and particle roughness for ellipsoidal particles can be expressed as . The heat transfer efficiency factor is independent of the aspect ratio. Both the heat transfer efficiency and Nusselt number gradually increased with an increasing angle. Similar to Chen’s study, the sine term in Equation (19) is not constant and conforms to a functional relationship. Additionally, based on the Happel and Brenner formula, this article presents a Nusselt correlation equation (, , and ) that is valid for ellipsoidal shapes. This method can be extended to cylindrical particles. A comparison between the PR-DNS data in the literature and the proposed Nusselt correlation predictions for ellipsoids shows that the Nusselt correlation can accurately predict the Nusselt coefficients for ellipsoids with different aspect ratios.
Author Contributions
Conceptualization, F.Z.; methodology, H.L. and F.Z.; software, H.L.; validation, H.L., F.Z. and H.H.; formal analysis, Z.L., F.Z. and Y.H.; resources, F.Z. and Y.H.; data curation, F.Z. and H.H.; writing—original draft preparation, H.L.; writing—review and editing, F.Z. and H.L.; visualization, J.Y. and C.Y.; project administration, F.Z.; funding acquisition, H.L. All authors have read and agreed to the published version of the manuscript.
Funding
This research was funded by the Silk Road Economic Belt Innovation-Driven Development Pilot Zone and Wuchangshi National Independent Innovation Demonstration Zone Science and Technology Development Plan Project (2022LQ01006).
Data Availability Statement
The original contributions presented in the study are included in the article, further inquiries can be directed to the corresponding author.
Acknowledgments
We express our heartfelt gratitude for their support of the Silk Road Economic Belt Innovation-Driven Development Pilot Zone and the Wuchangshi National Independent Innovation Demonstration Zone Science and Technology Development Plan Project. The authors would like to thank the anonymous reviewers for their comments and the editor for handling the manuscript. Additionally, we are grateful to He Yaqun of China University of Mining and Technology for his valuable suggestions on the content of the article.
Conflicts of Interest
Authors Heng Luo, Zhendong Liu, Jianxi Yan and Chicheng Yang were employed by the company Xinjiang Xianghe New Material Technology Co., Ltd. The remaining authors declare that the research was conducted in the absence of any commercial or financial relationships that could be construed as a potential conflict of interest.
Nomenclature
| Symbols: | |
| aspect ratio, - | |
| a, b and c | axis lengths of the ellipsoid, |
| specific heat capacity, /( · ) | |
| drag coefficient, - | |
| drag coefficient of a particle at , - | |
| drag coefficient of smooth particles, - | |
| drag coefficient of spherical particles, - | |
| volume equivalent diameter, | |
| heat transfer efficiency factor, - | |
| correction factor, - | |
| correction factor, - | |
| k | correction factor, - |
| thermal conductivity, /( · ) | |
| roughness coefficient, - | |
| correction factor, - | |
| Nusselt number, - | |
| surface-averaged Nusselt number for the particle with zero roughness, - | |
| p | normal stress, |
| Prandtl number, - | |
| average roughness factor, - | |
| particle Reynolds number, - | |
| roughness coefficient, - | |
| particle surface area, m2 | |
| geometric surface area of the particle without roughness, μm2 | |
| geometric surface area of the particle with roughness, μm2 | |
| T | temperature, |
| cylinder surface temperature, | |
| free stream temperature, | |
| undisturbed temperature of the fluid, | |
| computation time, - | |
| particle drag force, | |
| unit vector normal to the particle surface, - | |
| fluid velocity, / | |
| inlet fluid velocity, / | |
| volume of the particle, μm3 | |
| x, y and z | coordinate positions of a point on the surface of the ellipsoid, μm |
| Greek Symbols: | |
| incidence angle, ° | |
| dynamic viscosity, | |
| fluid density, / |
References
- Vijayan, A.; Joy, B.; Annabattula, R.K. Fluid Flow Assisted Mixing of Binary Granular Beds Using CFD-DEM. Powder Technol. 2021, 383, 183–197. [Google Scholar] [CrossRef]
- Chen, Y.; Jiang, P.; Xiong, T.; Wei, W.; Fang, Z.; Fang, Z.; Wang, B. Drag and Heat Transfer Coefficients for Axisymmetric Nonspherical Particles: A LBM Study. Chem. Eng. J. 2021, 424, 130391. [Google Scholar] [CrossRef]
- Santos, D.S.; Faia, P.M.; Garcia, F.a.P.; Rasteiro, M.G. Experimental and Simulated Studies of Oil/Water Fully Dispersed Flow in a Horizontal Pipe. J. Fluids Eng. Trans. ASME 2019, 141, 111301. [Google Scholar] [CrossRef]
- Upadhyay, M.; Park, H.C.; Choi, H.S. Multiphase Fluid Dynamics Coupled Fast Pyrolysis of Biomass in a Rectangular Bubbling Fluidized Bed Reactor: Process Intensification. Chem. Eng. Process.-Process Intensif. 2018, 128, 180–187. [Google Scholar] [CrossRef]
- Medina-Pedraza, C.; de Lasa, H. Hybrid Particle Cluster CPFD Simulation in the Acceleration and Stabilized Sections of a Downflow Circulating Fluidized Bed. Ind. Eng. Chem. Res. 2020, 59, 20325–20336. [Google Scholar] [CrossRef]
- Song, F.; Li, F.; Wang, W.; Li, J. A Sub-Grid EMMS Drag for Multiphase Particle-in-Cell Simulation of Fluidization. Powder Technol. 2018, 327, 420–429. [Google Scholar] [CrossRef]
- Wang, C.; Wang, F.; Chen, W.; He, Q.; Chen, X.; Zhang, Z. A Dynamic Particle Scale-Driven Interphase Force Model for Water-Sand Two-Phase Flow in Hydraulic Machinery and Systems. Int. J. Heat Fluid Flow 2022, 95, 108974. [Google Scholar] [CrossRef]
- Peng, C.; Meng, X.; Deng, J.; Wu, J. Theoretical Modeling of the Drag Reduction Influenced by Film Boiling Heat Transfer on a Spherical Body. Int. Commun. Heat Mass Transf. 2022, 134, 106028. [Google Scholar] [CrossRef]
- Knoll, M.; Gerhardter, H.; Prieler, R.; Muehlboeck, M.; Tomazic, P.; Hochenauer, C. Particle Classification and Drag Coefficients of Irregularly-Shaped Combustion Residues with Various Size and Shape. Powder Technol. 2019, 345, 405–414. [Google Scholar] [CrossRef]
- Castang, C.; Lain, S.; Sommerfeld, M. Pressure Center Determination for Regularly Shaped Non-Spherical Particles at Intermediate Reynolds Number Range. Int. J. Multiph. Flow 2021, 137, 103565. [Google Scholar] [CrossRef]
- Castang, C.; Lain, S.; Garcia, D.; Sommerfeld, M. Aerodynamic Coefficients of Irregular Non-Spherical Particles at Intermediate Reynolds Numbers. Powder Technol. 2022, 402, 117341. [Google Scholar] [CrossRef]
- Ouchene, R.; Khalij, M.; Arcen, B.; Taniere, A. A New Set of Correlations of Drag, Lift and Torque Coefficients for Non-Spherical Particles and Large Reynolds Numbers. Powder Technol. 2016, 303, 33–43. [Google Scholar] [CrossRef]
- Taylor, J.B.; Carrano, A.L.; Kandlikar, S.G. Characterization of the Effect of Surface Roughness and Texture on Fluid Flow—Past, Present, and Future. Int. J. Therm. Sci. 2006, 45, 962–968. [Google Scholar] [CrossRef]
- Dierich, F.; Nikrityuk, P.A. A Numerical Study of the Impact of Surface Roughness on Heat and Fluid Flow Past a Cylindrical Particle. Int. J. Therm. Sci. 2013, 65, 92–103. [Google Scholar] [CrossRef]
- Ma, R.; Alame, K.; Mahesh, K. Direct Numerical Simulation of Turbulent Channel Flow over Random Rough Surfaces. J. Fluid Mech. 2021, 908, A40. [Google Scholar] [CrossRef]
- Tang, P.; Chan, H.K.; Raper, J.A. Prediction of Aerodynamic Diameter of Particles with Rough Surfaces. Powder Technol. 2004, 147, 64–78. [Google Scholar] [CrossRef]
- Dierich, F.; Nikrityuk, P.A. A Numerical Study of the Influence of Surface Roughness on the Convective Heat Transfer in a Gas Flow. CMES-Comput. Model. Eng. Sci. 2010, 64, 251–266. [Google Scholar]
- Nikku, M.; Jalali, P.; Ritvanen, J.; Hyppanen, T. Characterization Method of Average Gas-Solid Drag for Regular and Irregular Particle Groups. Powder Technol. 2014, 253, 284–294. [Google Scholar] [CrossRef]
- Zhang, H.; Xiong, B.; An, X.; Ke, C.; Chen, J. Numerical prediction on the drag force and heat transfer of non-spherical particles in supercritical water. Powder Technol. 2020, 361, 414–423. [Google Scholar] [CrossRef]
- Richter, A.; Nikrityuk, P.A. New correlations for heat and fluid flow past ellipsoidal and cubic particles at different angles of attack. Powder Technol. 2013, 249, 463–474. [Google Scholar] [CrossRef]
- Ke, C.; Shu, S.; Zhang, H.; Yuan, H.; Yang, D. On the drag coefficient and averaged Nusselt number of an ellipsoidal particle in a fluid. Powder Technol. 2018, 325, 134–144. [Google Scholar] [CrossRef]
- Richter, A.; Nikrityuk, P.A. Drag forces and heat transfer coefficients for spherical, cuboidal and ellipsoidal particles in cross flow at sub-critical Reynolds numbers. Int. J. Heat Mass Transf. 2012, 55, 1343–1354. [Google Scholar] [CrossRef]
- Fu, J.; Chen, S.; Chen, P.; Wen, C. Particle-resolved simulation on viscous flow past random and ordered arrays of hot ellipsoidal particles. Int. J. Multiph. Flow 2021, 142, 103736. [Google Scholar] [CrossRef]
- Roostaee, A.; Vaezi, M. Developing a standard platform to predict the drag coefficient of irregular shape particles. Powder Technol. 2022, 395, 314–337. [Google Scholar] [CrossRef]
- Wang, H.; Zhang, B.; Li, X.; Xiao, Y.; Yang, C. Modeling total drag force exerted on particles in dense swarm from experimental measurements using an inline image-based method. Chem. Eng. J. 2022, 431, 133485. [Google Scholar] [CrossRef]
- Bhattacharyya, S.; Singh, A.K. Augmentation of heat transfer from a solid cylinder wrapped with a porous layer. Int. J. Heat Mass Transf. 2009, 52, 1991–2001. [Google Scholar] [CrossRef]
- Song, X.; Xu, Z.; Li, G.; Pang, Z.; Zhu, Z. A new model for predicting drag coefficient and settling velocity of spherical and non-spherical particle in Newtonian fluid. Powder Technol. 2017, 321, 242–250. [Google Scholar] [CrossRef]
- Sanjeevi, S.K.; Kuipers, J.A.M.; Padding, J.T. Drag, lift and torque correlations for non-spherical particles from Stokes limit to high Reynolds numbers. Int. J. Multiph. Flow 2018, 106, 325–337. [Google Scholar] [CrossRef]
- Wei, L.; Li, D.; Chen, Z.; Sun, M.; Zhu, X. Numerical simulation of force and seperation on plusing airflow. J. China Univ. Min. Technol. 2017, 46, 162–176. [Google Scholar]
- Zastawny, M.; Mallouppas, G.; Zhao, F.; van Wachem, B. Derivation of drag and lift force and torque coefficients for non-spherical particles in flows. Int. J. Multiph. Flow 2012, 39, 227–239. [Google Scholar] [CrossRef]
- Hölzer, A.; Sommerfeld, M. New simple correlation formula for the drag coefficient of non-spherical particles. Powder Technol. 2008, 184, 361–365. [Google Scholar] [CrossRef]
- Haider, A.; Levenspiel, O. Drag coefficient and terminal velocity of spherical and nonspherical particles. Powder Technol. 1989, 58, 63–70. [Google Scholar] [CrossRef]
- Zhang, F.; He, Y.; Xie, W.; Wei, N.; Li, J.; Wang, S.; Wang, J. Drag Coefficients for Elongated/Flattened Irregular Particles Based on Particle-Resolved Direct Numerical Simulation. Powder Technol. 2023, 418, 118290. [Google Scholar] [CrossRef]

Disclaimer/Publisher’s Note: The statements, opinions and data contained in all publications are solely those of the individual author(s) and contributor(s) and not of MDPI and/or the editor(s). MDPI and/or the editor(s) disclaim responsibility for any injury to people or property resulting from any ideas, methods, instructions or products referred to in the content. |
© 2024 by the authors. Licensee MDPI, Basel, Switzerland. This article is an open access article distributed under the terms and conditions of the Creative Commons Attribution (CC BY) license (https://creativecommons.org/licenses/by/4.0/).