Abstract
The pressing issue of global warming, coupled with the increasing depletion of fossil fuels, highlights the necessity for sustainable energy solutions. In this context, hydrogen stands out as a viable option, possessing the capacity to revolutionize critical industries, including fuel cells, internal combustion engines, and gas turbines. An effective approach to enhancing numerous chemical and technological processes in liquid and steam–gas mixtures is the establishment of cavitation mixing zones for the reacting components. These zones are produced in specialized reactors that operate on the principles of hydrodynamic effects applied to the reaction medium. The study focused on the design of the cavitation-jet chamber utilizing the k– Turbulence Model and Particle Tracing Model. As a result, the influence of the inlet velocity on cavitation formation and the uniformity of mixing was investigated. Ripley’s K-function was used to analyze the results of particle distribution. The influence of the screw on flow turbulence and the uniformity of particles was evaluated. Analysis through the K-function indicated a decrease in uniformity at lower velocities, with noticeable turbulization of the flow occurring at high velocities, which facilitated better mixing. In contrast, without the screw, the flow exhibited a high longitudinal velocity and minimal transverse velocity, limiting particle dispersion to the radius of the nozzle and resulting in inefficient mixing. It was found that the inclusion of the screw not only enhanced particle distribution but also maintained the size of the cavitation zones, thereby improving the overall efficiency of the design.
1. Introduction
The urgent challenge of global warming, along with the growing scarcity of fossil fuels, underscores the need for sustainable energy alternatives. Among these, hydrogen emerges as a promising candidate, with the potential to transform key sectors such as fuel cells, combustion engines, and gas turbines [1,2,3]. Low-carbon hydrogen offers a feasible alternative to natural gas across a range of applications, including residential heating, industrial processes, and emergency power generation. Additionally, it serves not only as a fuel but also as a crucial raw material for energy-intensive industries [4].
The processes of formation of multicomponent gas, steam-gas, and steam–gas–liquid mixtures during the mixing of these flows with different thermodynamic parameters are of great importance in engineering and technology. One of the effective methods of intensifying many chemical-technological processes in liquids and steam–gas mixtures is the creation of zones of cavitation mixing of reacting components, which are generated in special reactors based on the principle of acoustic or hydrodynamic action on the reaction medium. The operation of hydrodynamic cavitation devices relies on locally reducing the pressure in the liquid flow to the level of saturated vapor pressure and increasing its velocity to or beyond transonic values using specially designed structures placed directly in the flow path (e.g., constriction and expansion channels, cones, gratings, etc.). The steam-gas bubbles formed in the flow, with subsequent acceleration, combine to form a cavern. Upon entering a region of high pressure (diffuser), the cavern collapses, and the energy released during this process is sufficient to excite, ionize, and dissociate water molecules and non-polar gases, including substances with high vapor pressure inside the cavitation cavern [5,6,7].
Hydrodynamic cavitation devices are of particular interest for operations such as mixing, dispersion, and mass and heat exchange processes. The main focus for improving these devices is on enhancing the depth of mixing and the conditions for dispersing gaseous reagents with different densities and polarities during chemical transformations, particularly in processes like steam reforming of methane [8,9].
Despite the long history of studying cavitation processes, including on specialized experimental stands (cavitation tubes), it can be stated that this phenomenon remains insufficiently explored to date [10,11]. This is due to the high velocities of the processes, as well as the extremely small size and short duration of the existence of typical cavitation caverns. Consequently, even with the current level of computer technology, direct calculations that account for the influence of complexity (multiple factors) on the cavitation mixing of vapor-gas-liquid flows are practically unrealistic. Mostly the integral parameters of quasi-stationary cavitation zones are accessible to direct numerical methods [12,13].
In the proposed study, a mathematical model for the formation of a high-speed two-phase flow of a vapor–gas–liquid mixture created by coaxially connecting two types of sources for generating cavitation flows, namely, a Venturi tube with a cylindrical swirler and a Laval nozzle is considered. This is designed to enhance the mixing conditions of the vapor–gas mixture (H2O–CH4 and facilitate the dispersion of low-polar methane gas in a large volume of polar water vapor molecules. This configuration represents a system in which the formation of a high-speed flow is accompanied by its turbulization and the formation of a dispersion of the vapor–gas–liquid mixture, as well as the conversion of excess kinetic energy into potential energy, which should result in the release of a significant amount of heat.
2. Geometry of the Domain
During the research, the design of the cavitation-jet chamber (CJC) was studied, consisting of seven key elements, as shown in Figure 1. The CJC serves as the primary zone for chemical transformations and heat and mass transfer processes in the vapor–gas–liquid mixture that occur within the cavitation-jet reactor:
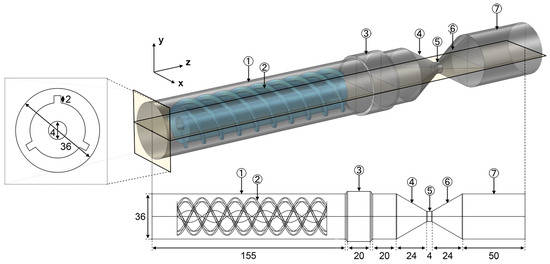
Figure 1.
Geometricalproperties of the CJC (all dimensions are given in millimeters), where ➀—main tube, ➁—screw activator, ➂—expanding region, ➃—confuser, ➄—nozzle, ➅—diffuser and ➆—outlet tube.
- The inlet, main tube—a cylindrical section through which, at the initial stage (pre-cavitation phase), a liquid flow and particles enter the system at a specific velocity and pressure, driven by a centrifugal pump.
- The screw activator—a helix-shaped body with a cylindrical through-hole at the center, positioned along the axis of the vapor-liquid mixture flow in the main tube (during the early phase of cavitation development). Its primary function is to facilitate the mixing of the vapor-liquid flow in the main tube with the gas flow introduced through the hole, which has a significantly smaller diameter than the main tube. The spiral shape of the screw induces turbulent vortices, enhancing the mixing of the various components in the flow.
- The expanding region—the transition zone between the main tube and the confuser. Its structural function is to connect the main tube to the confuser.
- The confuser—a truncated cone with a radius that decreases in the direction of the flow. This element is utilized to accelerate the flow by narrowing the cross-section. By employing the Venturi tube principle, the design not only increases the flow rate but also facilitates the capture of the introduced methane.
- The nozzle—a cylindrical tube with a significantly smaller radius compared to the main tube. In this zone, the flow velocity reaches its maximum value. The reduction in radius causes a further increase in flow velocity, which is crucial for maintaining the high kinetic energy of the flow.
- The diffuser—a truncated cone with an increasing radius in the direction of the flow. This element is essential for reducing the flow velocity before exiting the system. The expansion of the cross-section helps to increase the pressure and decrease the velocity, thereby reducing flow turbulence and stabilizing its parameters prior to exit.
- The outlet tube—a cylindrical body through which the mixed flow, having undergone vortexing as a result of passing through the elements of the CJC, is directed into the receiver of the cavitation-jet reactor.
Previously, the authors separately considered regions 4–7 without utilizing a screw to determine the geometric properties, specifically the angles of constriction of the confuser and expansion of the diffuser, as well as their influence on the creation of a cavitation zone and the distribution of aerosol methane particles in water vapor [14]. The optimization of the constriction angle of the confuser aimed at increasing the flow velocity, which enhances the capture of methane molecules by creating zones of local pressure reduction where cavitation can occur. In these zones, there was an intensive dispersion of methane molecules and their distribution in a volume of water vapor exceeding their own volume.
The diffuser’s expansion angle, in turn, was tuned to gradually reduce the flow velocity, reducing the likelihood of revortexing while promoting a more uniform distribution of methane aerosols in the flow.
This paper examines the effect of flow velocity on the formation of a vapor-gas aerosol H2O–CH4 using a screw. The screw plays a crucial role in enhancing flow vortices, which contribute to more intensive flow mixing. The spiral shape of the screw generates turbulent vortices that ensure the uniform distribution of methane molecules in the resulting aerosol vapor-gas flow. These vortices increase the contact surface between methane and water vapor, facilitating the formation of a more stable aerosol mixture. The flow rate in this zone increases, which also influences cavitation processes by creating local zones with reduced pressure, where additional spraying of methane molecules into the vapor-liquid medium can occur.
3. Mathematical Model
The modeling of the process is conducted in two stages.
The first stage involves the determination of the distribution of flow velocity and pressure in the considered region using the k– model for turbulent flows [15]. This model accounts for turbulent effects, such as vortexing occurring within the structure, and allows for the description of flow behavior, including velocity and pressure, in different zones of the studied area:
where, —fluid density [kg/m3], —velocity vector [m/s], p—pressure [Pa], —fluid dynamic viscosity [Pa · s], k—turbulent kinetic energy [m2/s2], —specific turbulence dissipation rate [1/s].
The main question of the study is to determine the dependence of the distribution of methane molecules (dispersed phase) in water vapor (dispersed medium) of the aerosol based on the input flow velocity. Therefore, various modes with input flow velocity () values ranging from 0.1 to 20 m/s were considered (Figure 2):

Figure 2.
Geometric location of boundary conditions for the model.
In this case, the boundary condition for pressure is set at the output (Figure 2):
On the remaining boundaries, including the surface of the screw, the no-slip condition was established (Figure 2):
The initial approximation of the problem, under steady flow conditions, is as follows:
In the second stage, the distribution of methane molecules in water vapor is determined using the Particle Tracing Model [16,17]. This model tracks the trajectories of aerosol particles in a flow, enabling the determination of their distribution in different areas of the CJC structure, including the effects of vortices created by the screw and cavitation zones. The model incorporates factors such as Brownian motion, gravity, particle collisions, and drag force:
where —aerosol particle velocity vector [m/s], —mass of particle [kg], —flow velocity by solving Equations in stage one [m/s], t—time [s], —Boltzmann constant [J/K], T—temperature [K], —particle radius [m], —gravitational acceleration vector [m/s2], —density of particle [kg/m3], —spring constant [N/m], —equilibrium distance between particles [m], —drag coefficient, A—cross sectional area [m2].
A total of 500 particles, each with a density of 0.657 kg/m3 and a diameter of 0.0017 mm, were injected through the inlet boundary, with the corresponding boundary and initial conditions for the Particle Tracing Model as follows:
with being the particle velocity vector that is achieved when the particle hits the wall [m/s] and describing the number of particles.
Thus, by numerically solving Equations (1)–(11), the direction of flow in the elementary volumes of the computational domain is determined. Based on the velocity and pressure fields obtained in the first stage, the coordinates of the particles are then calculated, enabling the tracing of their movement and distribution in the flow while accounting for the various forces acting upon them.
4. Determination of the Uniformity of Aerosol Particles
The uniformity of particles can be quantitatively determined using Ripley’s K-function [18]. This function facilitates the analysis of the distribution of dispersed phase particles in a dispersed medium and allows us to identify their spatial patterns.
The Ripley’s K(r) function is utilized to estimate the average number of particles located within a given radius r of another particle. This enables the determination of how uniformly the particles are distributed in the computational domain:
where, S—surface of the domain, where particles are located [m2], —distance between the i-th and j-th particles in [m], —the indicator function that equals to 1 when a particle is within the designated radius r [m], and equals to 0 otherwise.
Based on the Ripley function, it is possible to determine the degree of clustering or dispersion of particles. The change in the number of particles has to be proportional over some degree to the change in area determined by radius r, which is called a uniform distribution. If K(r) exceeds the expected value for a random distribution; this indicates the formation of local groups of particles, a phenomenon referred to as particle clustering. Conversely, a value below the expected level indicates dispersion, suggesting an unevenly large distance between particles (Figure 3).
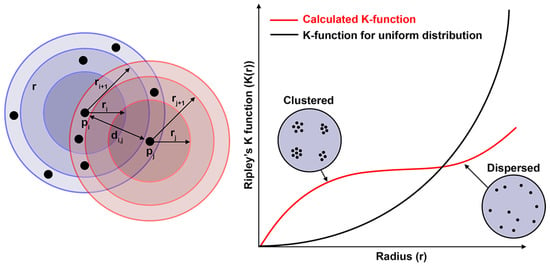
Figure 3.
The idea behind the K-function is to determine the uniformity of particle distribution.
5. Results and Discussions
As a result of the research, various values of the flow velocity of the steam–gas mixture at the inlet boundary () ranging from 0.1 to 20 m/s were analyzed. The numerical solution of the mathematical model was conducted using the Comsol Multiphysics 6.2 software. The points were counted using a specialized program developed by the authors of the article. The distribution of pressure and velocity for an inlet velocity of 1 m/s in the cross-section of the structure is presented in Figure 4 and Figure 5, respectively.

Figure 4.
Pressure distribution [bar] in the structure at an inlet flow velocity of 1 m/s.

Figure 5.
Velocity field [m/s] in the structure at an inlet flow velocity of 1 m/s.
Mandatory conditions for the formation of hydrogen include the creation of cavitation zones and a uniform distribution of methane molecules in the volume of water vapor, which indicates a high degree of mixing. Cavitation is enhanced by a decrease in pressure in the flow at points of narrowing or a reduction in the cross-section of the flow channels of the vapor–liquid mixture, leading to the formation of zones with pressure below the saturated vapor pressure. In these zones, the liquid partially transitions into a gaseous state, and individual liquid particles separate, forming bubbles of the vapor–gas mixture H2O–CH4. The critical value of the flow velocity () at which cavitation is achieved is determined by the following formula:
when pressure of saturated vapor is equal to 3169 Pa at standard temperature of 298.15 K.
The change in the cavitation zone velocity at the inlet is in the range of 1 to 5 m/s, as shown in Figure 6.

Figure 6.
Change in cavitation zone depending on the input velocity values within the range of 1–5 m/s.
As shown in Figure 6, with increasing flow velocity, cavitation zones expand, which directly impacts the intensity of cavitation processes and the distribution of particles in the flow. Figure 7 illustrates the change in the volumes of cavitation zones depending on the input flow velocity, with values ranging from 0.1 to 20 m/s, where the maximum volume approaches that of the outlet tube and diffuser.
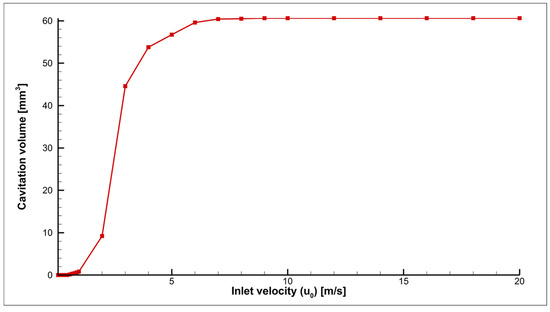
Figure 7.
Change in the volume of the cavitation zone depending on the input flow velocity for values of 0.1–20 m/s.
Thus, from the above, it can be concluded that an increase in the velocity at the inlet results in a decrease in pressure within the nozzle, which, in turn, promotes the formation of a cavitation zone in accordance with Bernoulli’s law. However, despite this, the acceleration of the flow also leads to a decrease in the spraying of aerosol particles, negatively affecting the mixing process.
The solution to this problem is the utilization of a screw, which converts the axial velocity of the flow along the pipe into a transverse velocity. This conversion enhances the spraying of particles, thereby improving the mixing process. Simultaneously, the use of a screw leads to a slight reduction in cavitation zones, allowing for a balance between the efficiency of mixing and the formation of cavitation zones.
The effect of the screw on particle spraying was analyzed by comparing the distributions of velocity fields, streamlines, and particle trajectories in modes both without and with the use of a screw. Figure 8 and Figure 9 demonstrate the changes in flow velocity components (, ) for both modes along two selected lines for the same inlet velocity value of m/s. The arrangement of the cutlines was chosen such that one line presents the data along the axial line (Figure 9), where the maximum axial velocity is achieved, while the second line illustrates the effect of the screw (Figure 9), resulting in the transformation of axial velocity into radial velocity.
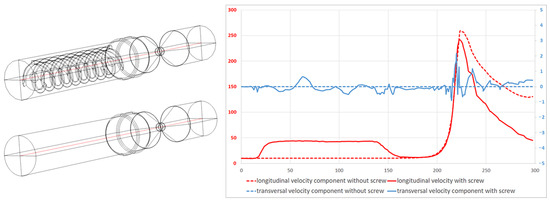
Figure 8.
Comparison of the longitudinal () and transverse () components of velocity along the centerline of the computational domain, in modes with and without a screw at an input velocity of m/s.
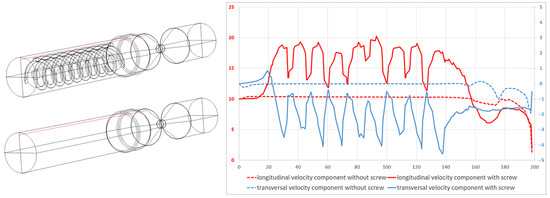
Figure 9.
Comparison of the longitudinal () and transverse () components of velocity along a cutline passing in the near-wall zone of the computational domain, in modes with and without a screw at an input velocity of m/s.
As seen in Figure 8, the flow velocity increases along the centerline between z values from 30 to 160 mm. This acceleration is due to the presence of a hole in the center of the screw, which allows the flow to accelerate. The maximum velocity is reached in the nozzle area, after which the longitudinal velocity decreases. However, in the mode without a screw, the drop in velocity is less pronounced, as there is no transformation of longitudinal velocity into transverse velocity in this case.
As shown in Figure 9, in accordance with the law of conservation of energy, along the line between the wall of the computational region and the screw, the longitudinal and transverse speeds exhibit oscillations. Where the longitudinal speed decreases, an increase in the transverse speed is observed, and vice versa.
Figure 10 presents the distribution of the velocity field and the streamlines in the outlet tube for both modes, with and without a screw.
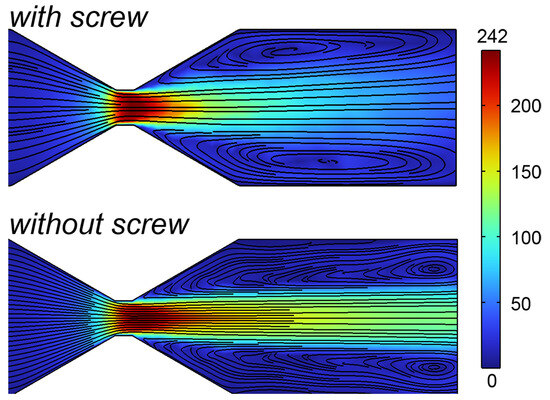
Figure 10.
Distribution of the velocity field and streamlines in modes without a screw on the outlet tube at an input velocity of m/s.
Figure 11 demonstrates the velocity field and only transversal velocity components distribution to demonstrate the effect of the screw on transverse flow characteristics and mix improvements. The velocity field corresponds to the probable spatial particle distribution. Transversal velocity component distribution demonstrates the tendency of particles to rotate in the outlet pipe under the influence of the screw.
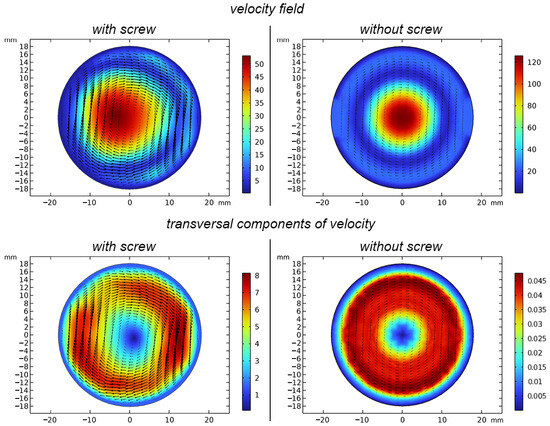
Figure 11.
Distribution of the velocity field, transversal components of velocity and velocity vectors (arrows) in modes without a screw on the outlet tube at an input velocity of m/s.
Figure 10 and Figure 11 show that in both cases—with and without a screw—vortices are formed in the outlet tube between the central flow and the walls of the diffuser and outlet tube, which limits the spraying of aerosol particles. However, in the screw mode, the longitudinal vortex zone is significantly smaller, allowing the flow to expand closer to the outlet boundary (Figure 10). Additionally, the increase in transverse velocity components contributes to more intense dispersion of particles due to centrifugal force (Figure 11). The transversal shift can be observed occurring due to the screw geometry, with transversal velocities being significantly lower for cases without the screw. This phenomenon leads to enhanced dispersion of particles and a reduction in their clustering.
Figure 12 and Figure 13 illustrate, as examples, the dynamics of particle motion under the influence of the flow at an input velocity of m/s for both modes, with and without a screw.
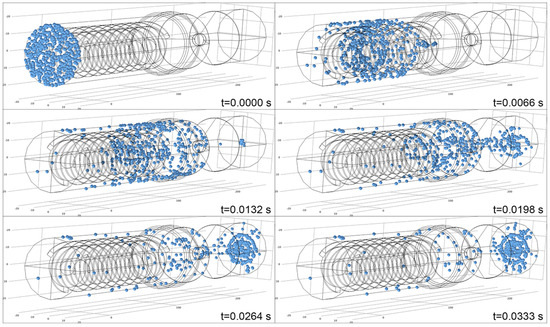
Figure 12.
Dynamics of particle motion in a mode with screw feeder at an input flow velocity of m/s.
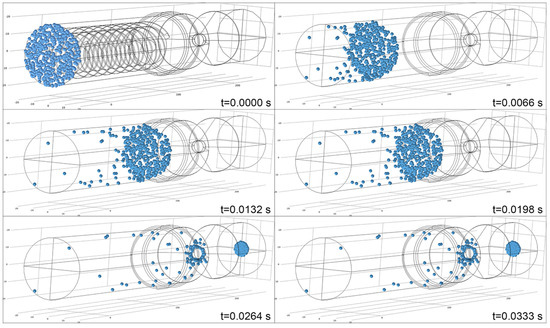
Figure 13.
Dynamics of particle motion in a mode without screw feeder at an input flow velocity of m/s.
Since the freezing boundary condition for the particle tracing equation is set at the exit boundary, particle dispersion is evaluated at this point. This approach allows for a comparison of results across different input velocity values, ensuring the analysis covers the passage of the same distance. The time required for the particles to reach the exit boundary varies depending on the flow velocity, providing information into how flow velocity influences particle behavior and dispersion.
Figure 14 shows the distribution of particles for different values of the input velocity ()—1, 10, and 20 m/s—in the modes with and without a screw.
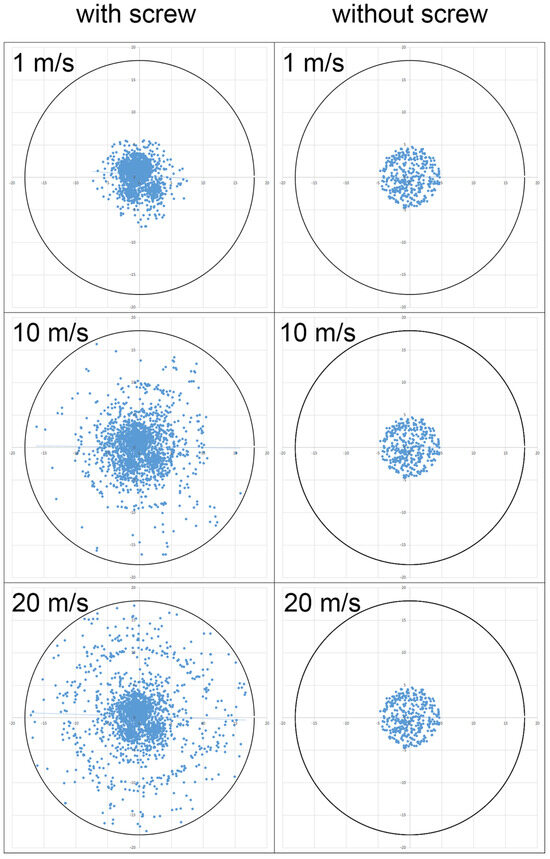
Figure 14.
Particle arrangement for different input velocities and modes.
As shown in Figure 14, the dispersion of particles in the mode without a screw is minimal, with the spray radius equal to the radius of the nozzle. This outcome is attributed to the nearly zero values of the transverse velocity component. In contrast, in the mode with a screw, the dispersion of particles increases due to the influence of centrifugal force. Additionally, as the longitudinal velocity increases, the transverse velocity also rises due to the redirection of the flow, further enhancing particle dispersion.
Figure 15 and Figure 16 show the results of particle distribution obtained based on the analysis using Ripley’s K function.
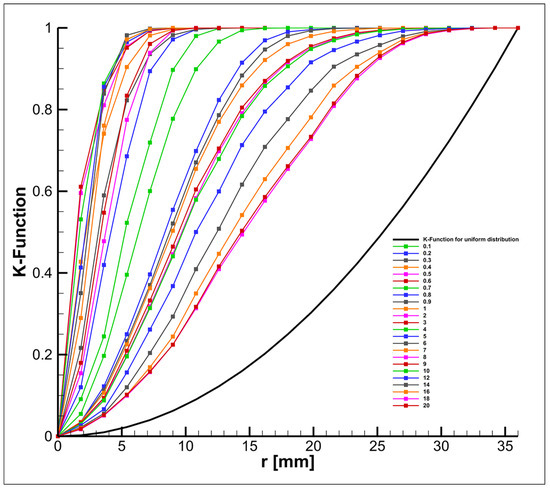
Figure 15.
Change in Ripley’s function depending on the input velocity for the screw mode.
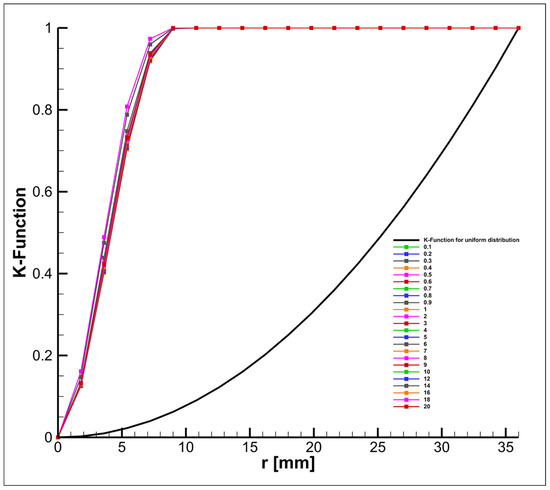
Figure 16.
Change in Ripley’s function depending on the input velocity for the mode without a screw.
The curves presented in Figure 15 and Figure 16 confirm the conclusion that the screw significantly enhances mixing efficiency. As a result, at higher inlet velocities, the particle distribution approaches the K-function values characteristic of a uniform distribution. A more precise quantitative analysis of particle homogeneity can be performed by calculating the difference in the integrals of the K-function between the uniform distribution and the particle distribution at various inlet velocity values, as shown in Figure 17. Moreover, the lower the proximity value, the closer the obtained K-function value is to that of the uniform distribution.
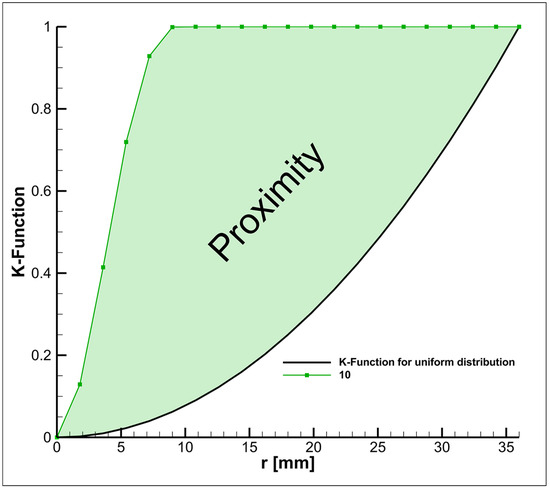
Figure 17.
An example of calculating the proximity of particles based on the Ripley K function, in the case where m/s for the mode without using a screw.
Figure 18 and Figure 19 show the proximity values for different input speeds for the auger and screwless modes, respectively.
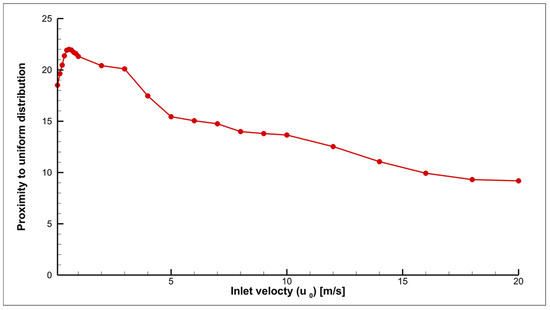
Figure 18.
Change in the proximity of the distribution of points depending on the input flow velocity for the mode using a screw.
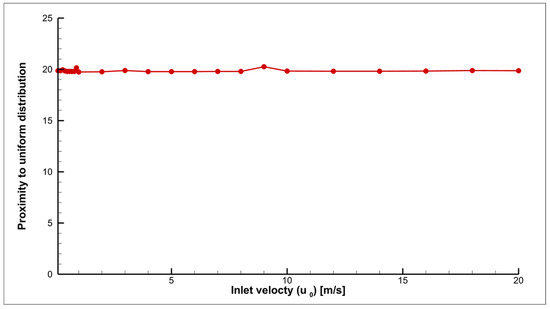
Figure 19.
Change in the proximity of the distribution of points depending on the input flow velocity for the mode without a screw.
As seen in Figure 18, within the inlet velocity range from 0.1 to 0.7 m/s, there is a decrease in the uniformity of particle distribution at the inlet boundary (moving away from values typical of a uniform distribution). Subsequently, there is a convergence towards values corresponding to a uniform distribution. This is explained by the fact that at a velocity of 0.7 m/s, noticeable flow turbulence begins due to the influence of the screw. As the flow velocity continues to increase, turbulence intensifies, which leads to a better mixing of particles. Figure 19 shows that the uniformity of particles remains virtually unchanged, as turbulence occurs only in the region of the outlet pipe (Figure 10), forming a narrow flow. As a result, particles remain within the radius of the nozzle.
Thus, as a result of the conducted research, it was determined that with an increase in the input flow velocity and the use of a screw, both the longitudinal and transverse velocity components increase. This, in turn, should enhance the centrifugal force, promoting greater particle scattering, which positively influences their uniform distribution at the outlet. Simultaneously, the dimensions of the cavitation zones remain almost unchanged, preserving the structure’s efficiency. In the absence of a screw, due to the small values of the transverse velocity component, the longitudinal component primarily affects the particles. Consequently, particle scattering remains virtually unchanged and is confined to the nozzle radius, regardless of the increase in input velocity.
6. Conclusions
The presented mathematical model, which utilizes models of turbulent hydrodynamics, demonstrates that the presence of turbulence centers in liquid, vapor-liquid, and vapor-gas flows, exemplified by the screw, serves as an effective mechanical device that enhances the mixing of methane-water vapor aerosol components.
The conducted studies revealed the screw’s significant influence on particle distribution within the flow at varying input velocities. It was found that utilizing the screw enhances particle mixing efficiency by converting longitudinal velocity into transverse velocity. This transformation increases centrifugal force, promoting greater particle dispersion and leading to improved uniformity in particle distribution, particularly at higher input velocities.
Analysis based on the K-function indicated that at low velocities (from 0.1 to 0.7 m/s), uniformity decreases; however, upon reaching 0.7 m/s, flow turbulence begins to develop, which enhances particle mixing. Further increases in flow velocity lead to a positive impact on the uniformity of particle distribution at the outlet.
In the absence of the screw, the flow retains a high longitudinal velocity while the transverse component remains negligible, limiting particle dispersion to the radius of the nozzle and resulting in less effective mixing. Conversely, the inclusion of the screw not only improves particle distribution but also maintains the size of cavitation zones at nearly constant levels, thereby increasing the overall efficiency of the design. This configuration also allows the self-organization of the energy state of the system according to the principle of cluster distribution of the dispersed phase (methane) within the dispersed medium (water vapor).
The primary mechanical factors influencing the liquid, vapor-liquid, and vapor-gas environment are pressure p and velocity , which are generated at the inlet and vary as they pass through the structural elements of the cavitation-jet chamber. This mathematical model can be employed to predict the mechanisms of hydrogen formation in the vapor–gas mixture of H2O–CH4, as the energy released during the collapse of cavitation bubbles is sufficient to initiate the dissociation of both methane and water molecules [19,20].
Future research will focus on optimizing the geometric parameters of the screw to enhance flow homogeneity. Specifically, further study is necessary to investigate the length of the screw and the main pipe, the number of screw blades, their radius, and the parameters of the outlet pipe, including both its radius and length. These characteristics will be correlated with various input flow velocities to achieve adequate particle dispersion resulting from the effects of centrifugal force. Additionally, investigations into flow behavior at supersonic speeds are also planned. The prototype has been constructed, and empirical data are expected to be obtained for comparison with the results of mathematical modeling.
Author Contributions
Conceptualization, G.M. and N.S.; methodology, N.S. and M.K.; software, N.S. and D.A.; validation, M.K., D.A., A.R. and M.T.; formal analysis, M.T.; investigation, G.M.; resources, G.M., A.R., Y.Z. and I.D.; data curation, Y.Z.; writing—original draft preparation, G.M., D.A., N.S.; writing—review and editing, D.A.; visualization, N.S.; supervision, G.M.; project administration, G.M.; funding acquisition, G.M. All authors have read and agreed to the published version of the manuscript.
Funding
This research was funded by the Science Committee of the Ministry of Science and Higher Education of the Republic of Kazakhstan, grant number BR18574073.
Data Availability Statement
Data is contained within the article.
Conflicts of Interest
The authors declare no conflicts of interest.
References
- Abuzreda, A. The use of Green Nano Hydrogen as Fuel and its Effect. Adv. Environ. Waste Manag. Recycl. 2022, 5, 320–351. [Google Scholar]
- Abdin, Z.; Zafaranloo, A.; Rafiee, A.; Mérida, W.; Lipiński, W.; Khalilpour, K.R. Hydrogen as an energy vector. Renew. Sustain. Energy Rev. 2020, 120, 109620. [Google Scholar] [CrossRef]
- Zhang, H.; Wang, W.; Li, X.; Han, L.; Yan, M.; Zhong, Y.; Tu, X. Plasma activation of methane for hydrogen production in a N2 rotating gliding arc warm plasma: A chemical kinetics study. Chem. Eng. J. 2018, 345, 67–78. [Google Scholar] [CrossRef]
- Herraiz, L.; Lucquiaud, M.; Chalmers, H.; Gibbins, J. Sequential Combustion in Steam Methane Reformers for Hydrogen and Power Production With CCUS in Decarbonized Industrial Clusters. Front. Energy Res. 2020, 8. [Google Scholar] [CrossRef]
- Radzyuk, A.Y.; Istyagina, E.B.; Kulagina, L.V.; Zhuikov, A.V. Current state of using cavitation technologies (brief overview) [Sovremennoye sostoyaniye ispol’zovaniya kavitatsionnykh tekhnologiy (kratkiy obzor)]. Bull. Tomsk. Politech. Univ. 2022, 333, 209–218. (In Russian) [Google Scholar]
- Spiridonov, E.K.; Bityutskikh, S.Y. Simulation Model and Characteristics of the Cavitation Mixer with Hydrodynamic Grid. Procedia Eng. 2016, 150, 210–214. [Google Scholar] [CrossRef][Green Version]
- Panov, V.A.; Abramov, A.G.; Ugrymov, A.V. Direct Plasma Chemical Conversion of Methane to Methanol (a review) [Pryamaya plazmokhimicheskaya konversiya metana v metanol (obzor)]. Uspehi Prikladnoi Fiziki 2022, 10, 534–575. (In Russian) [Google Scholar]
- Meng, C.; Meng, M.; Sun, X.; Gu, C.; Zou, H.; Li, X. Rapid Degradation of Chlortetracycline Using Hydrodynamic Cavitation with Hydrogen Peroxide. Int. J. Environ. Res. Public Health 2022, 19, 4167. [Google Scholar] [CrossRef] [PubMed]
- Song, L.; Wei, Y.; Deng, C.; Yang, J.; Sui, H.; Guo, F.; Meng, L.; Zhao, X.; Wei, S.; Sun, D.; et al. A Novel Method Based on Hydrodynamic Cavitation for Improving Nitric Oxide Removal Performance of NaClO2. Int. J. Environ. Res. Public Health 2023, 20, 3684. [Google Scholar] [CrossRef] [PubMed]
- De Felice, G.; Li, S.; Gallucci, F.; Pourali, N.; Rebrov, E. On design of plasma jet reactor for non-oxidative methane conversion. React. Chem. Eng. 2023, 8, 1125–1133. [Google Scholar] [CrossRef] [PubMed]
- Zangirov, E.I.; Kalimullin, R.R.; Svistunov, A.V.; Khakimov, R.F. Identification of heating working fluid in vortex heat-generator [Identifikatsiya protsessa nagreva rabochey zhidkosti v vikhrevom teplogeneratore]. Bull. Ufa State Aviat. Tech. Univ. 2013, 17, 95–102. (In Russian) [Google Scholar]
- Suslick, K.S.; Flannigan, D.J. Inside a collapsing bubble: Sonoluminescence and the conditions during cavitation. Annu. Rev. Phys. Chem. 2008, 59, 659–683. [Google Scholar] [CrossRef] [PubMed]
- Zhang, G.; Yang, X.; Li, Y.; Gu, F. Numerical investigation on the cavitating wake flow around a cylinder based on proper orthogonal decomposition. Front. Energy Res. 2023, 11, 1340063. [Google Scholar] [CrossRef]
- Mamytbekov, G.; Shayakhmetov, N.; Aizhulov, D.; Kurmanseiit, M.; Tungatarova, M. Transport of Steam-Gas Mixture in Hydrodynamic Devices: A Numerical Study of Steam Reforming of Methane. Processes 2023, 11, 2991. [Google Scholar] [CrossRef]
- Wilcox, D.C. Turbulence Modeling for CFD; DCW Industries: La Cafiada, CA, USA, 2006; pp. 255–256. [Google Scholar]
- Kim, M.; Zydney, A.L. Effect of electrostatic, hydrodynamic, and Brownian forces on particle trajectories and sieving in normal flow filtration. J. Colloid Interface Sci. 2004, 269, 425–431. [Google Scholar] [CrossRef] [PubMed]
- Tian, L.; Ahmadi, G. Particle deposition in turbulent duct flows—Comparisons of different model predictions. J. Aerosol Sci. 2007, 38, 377–397. [Google Scholar] [CrossRef]
- Dixon, P.M. Ripley’s K function. In Encyclopedia of Environmetrics; John Wiley and Sons: Chinchester, UK, 2002; Volume 3, pp. 1796–1803. [Google Scholar]
- Dehane, A.; Merouani, S. Microscopic Analysis of Hydrogen Production from Methane Sono-Pyrolysis. Energies 2023, 16, 443. [Google Scholar] [CrossRef]
- Merouani, S.; Hamdaoui, O.; Rezgui, Y.; Guemini, M. Computer simulation of chemical reactions occurring in collapsing acoustical bubble: Dependence of free radicals production on operational conditions. Res. Chem. Intermed. 2013, 41, 881–897. [Google Scholar] [CrossRef]
Disclaimer/Publisher’s Note: The statements, opinions and data contained in all publications are solely those of the individual author(s) and contributor(s) and not of MDPI and/or the editor(s). MDPI and/or the editor(s) disclaim responsibility for any injury to people or property resulting from any ideas, methods, instructions or products referred to in the content. |
© 2024 by the authors. Licensee MDPI, Basel, Switzerland. This article is an open access article distributed under the terms and conditions of the Creative Commons Attribution (CC BY) license (https://creativecommons.org/licenses/by/4.0/).