Article

Maleic Anhydride-Modified Water Hyacinth for Adsorption of Methylene Blue and Methyl Violet

Guangxi Key Laboratory of Optical and Electronic Materials and Devices, College of Materials Science and Engineering, Guilin University of Technology, Guilin 541004, China
*
Author to whom correspondence should be addressed.
Processes 2024, 12(10), 2290; https://doi.org/10.3390/pr12102290
Submission received: 25 June 2024 / Revised: 23 September 2024 / Accepted: 24 September 2024 / Published: 19 October 2024
(This article belongs to the Special Issue Energy and Water Treatment Processes)

Abstract

:
Removal of toxic pollutants is of the greatest concerns facing wastewater treatment. In this study, a chemical modification method was used to prepare the maleic anhydride-modified water hyacinth (MA-EC) for the removal of methylene blue (MB) and methyl violet (MV) from water. The maleic anhydride-modified water hyacinth biosorbent was characterized and adsorption experiments were conducted. The prepared MA-EC demonstrated considerable adsorptive efficiency toward MV and MB. It was confirmed that the maximum adsorptive capacities were 1373.58 and 434.70 mg/g for MV and MB, respectively. The adsorptive data were also fitted using Langmuir and Freundlich isotherms, and the results showed that the Langmuir isotherm adsorption model could better describe the adsorptive process. Adsorption–desorption cycling experiments demonstrated that the MA-EC adsorbent had good reusability, with adsorptive capacities of 538.88 mg/g for MV and 215.56 mg/g for MB after four cycles of desorption–adsorption.

1. Introduction

Organic dyes are widely used in various industries [1,2]. Synthetic dyes are extensively utilized across the textile and dyeing [3]. About 7 million tons of dyes are produced worldwide each [4] however, it is hard to remove them once they enter the water system [5]. MB and MV are characteristic cationic dyes and have excellent water solubility and color stability [6,7]. They are widely applied in manufacturing, such as for paper, textiles, printing and so on. MB and MV in water will cause the color of the water to become heavier, affecting the natural landscape and the transparency of the water. They pose a threat to aquatic life and destroy the ecological balance [8]. At present, wastewater treatment methods for the removal of dyes include the coagulation method [9], photocatalysis [10], activated sludge method [11], biofilm method, anaerobic digestion method [12], and adsorption method, etc. The adsorption method is the most widely used procedure because it is easy to implement, less expensive, and does not lead to the formation of toxic byproducts [13].
In recent years, biomass materials and agricultural waste have been widely used as raw materials for the production of adsorbents due to their low cost [14]. Some examples include citrus peel [15] waste, cucumber peel [16] waste, fallen leaves [17], rubber tree bark [18], soybean waste [19], etc. They have been used to remove dyes and heavy metal ions from the aquatic environment. Abd-Elhamid et al. [20] used sugarcane bagasse as a raw material and modified it with graphene oxide (GO) and sodium polyacrylate (PAA) to achieve a maximum adsorption capacity of 543.28 mg/g for MB dye. However, the preparative process of the adsorbent is relatively complex and time-consuming. Pengfei Yang et al. [21] modified eucalyptus wood with succinic anhydride to obtain an adsorbent with a maximum adsorption capacity of 380.40 mg/g for MB. Hua Lin et al. [22] used yellow passion fruit peel as an adsorbent, with maximum adsorption capacities of 324.70 and 485.40 mg/g for MB and MV dyes, respectively.
Water hyacinth was introduced to China several decades ago [23,24]. Water hyacinth forms a dense floating mat layer on the surface of the water body, which prevents the entry of oxygen and sunlight underwater, thereby destroying biodiversity [25]. Furthermore, the proliferation of water hyacinth has been associated with a surge in the local populations of mosquitoes and snails, which may subsequently elevate the incidence of vector-borne diseases, including malaria and dengue fever. This biomass is notable for its high nitrogen content, which, when combined with cow dung, makes it an effective substrate for biogas production [26]. Moreover, its substantial biomass yield, robust tolerance to pollutants, and its capacity for heavy metal and nutrient absorption render it an ideal candidate for application in wastewater treatment systems. The cationic dye methylene blue was widely studied for its removal from aqueous solutions by the water hyacinth. Low et al. [27], in laboratory investigations, studied the potential of biomass from nonliving, dried roots of the water hyacinth to remove two basic dyes, methylene blue and Victoria blue from aqueous solutions. Saltabaş et al. [28] studied the biosorption capacity of water hyacinth roots on the cationic dyes methylene blue and malachite green. The results show that equilibrium fitted well with the Langmuir model and the biosorption capacity value for malachite green was 42.55 mg/g and methylene blue was 44.64 mg/g at 313 K. In addition, due to its superior reproductive ability, it becomes cheap and reduces the cost. Studies have shown that acid–alkali-treated water hyacinth can remove pollutants more effectively than untreated plant material. Tsaniatri et al. [29] studied the adsorption of Pb2+ by nitric acid-modified water hyacinth. The results showed that 1 M (D) nitric acid-modified water hyacinth cellulose adsorbent had the best adsorption effect on Pb2+, and the adsorption capacity was 8.6403 mg/g. Kumar et al. [30] studied the development of chemically modified dried water hyacinth (DWHR) as an adsorbent for the synthesis of chromium (VI) in aqueous solutions. The study was dedicated to harnessing the power of surface-modified water hyacinth for the adsorption of ecologically detrimental dyes. By incorporating maleic anhydride (MA), the research has developed an affordable and efficient adsorbent that not only boasts a swift adsorption time but also exhibits superior adsorptive characteristics.

2. Materials and Methods

2.1. Materials

In this study, Eichhornia crassipes specimens were sourced from the pond at Guilin Kuiguang Middle School. Reagents including maleic anhydride, methyl violet, methylene blue, and N, N-dimethylformamide were purchased from adamas reagent Co., Ltd., Shanghai, China. Analytically pure hydrochloric acid, sodium hydroxide, anhydrous ethanol, acetone, and sodium bicarbonate were obtained from Xilong Chemical Co., Ltd., Shantou, China.

2.2. Preparation of EC

Water hyacinth was used as a raw material and the middle sack-shaped or spindle-shaped part was kept. The soil and other impurities on the surface of the water hyacinth were cleaned with tap water, followed wash twice with ultra-pure water, and then dried in the oven at 60 °C for 24 h. Then the dried water hyacinth was put into the grinder and filtered through a 100-purpose filter to obtain particles with a particle size of less than 500 μm (EC).

2.3. Preparation of MA-EC

Firstly, 3 g of water hyacinth was put into a mixture of 50 mL of acetone and 50 mL of ethanol. Then it was stirred at room temperature for 6 h and the pretreatment material (P-EC) was obtained. A total of 1.0 g maleic anhydride and 0.5 g P-EC were added to 50 mL N, N-dimethylformamide (DMF), and stirred in a 60 °C water bath for 4 h. Next they were filtered and washed until neutral, and dried in the oven at 60 °C. Finally, the maleic anhydride-modified water hyacinth powder (MA-EC) was obtained.

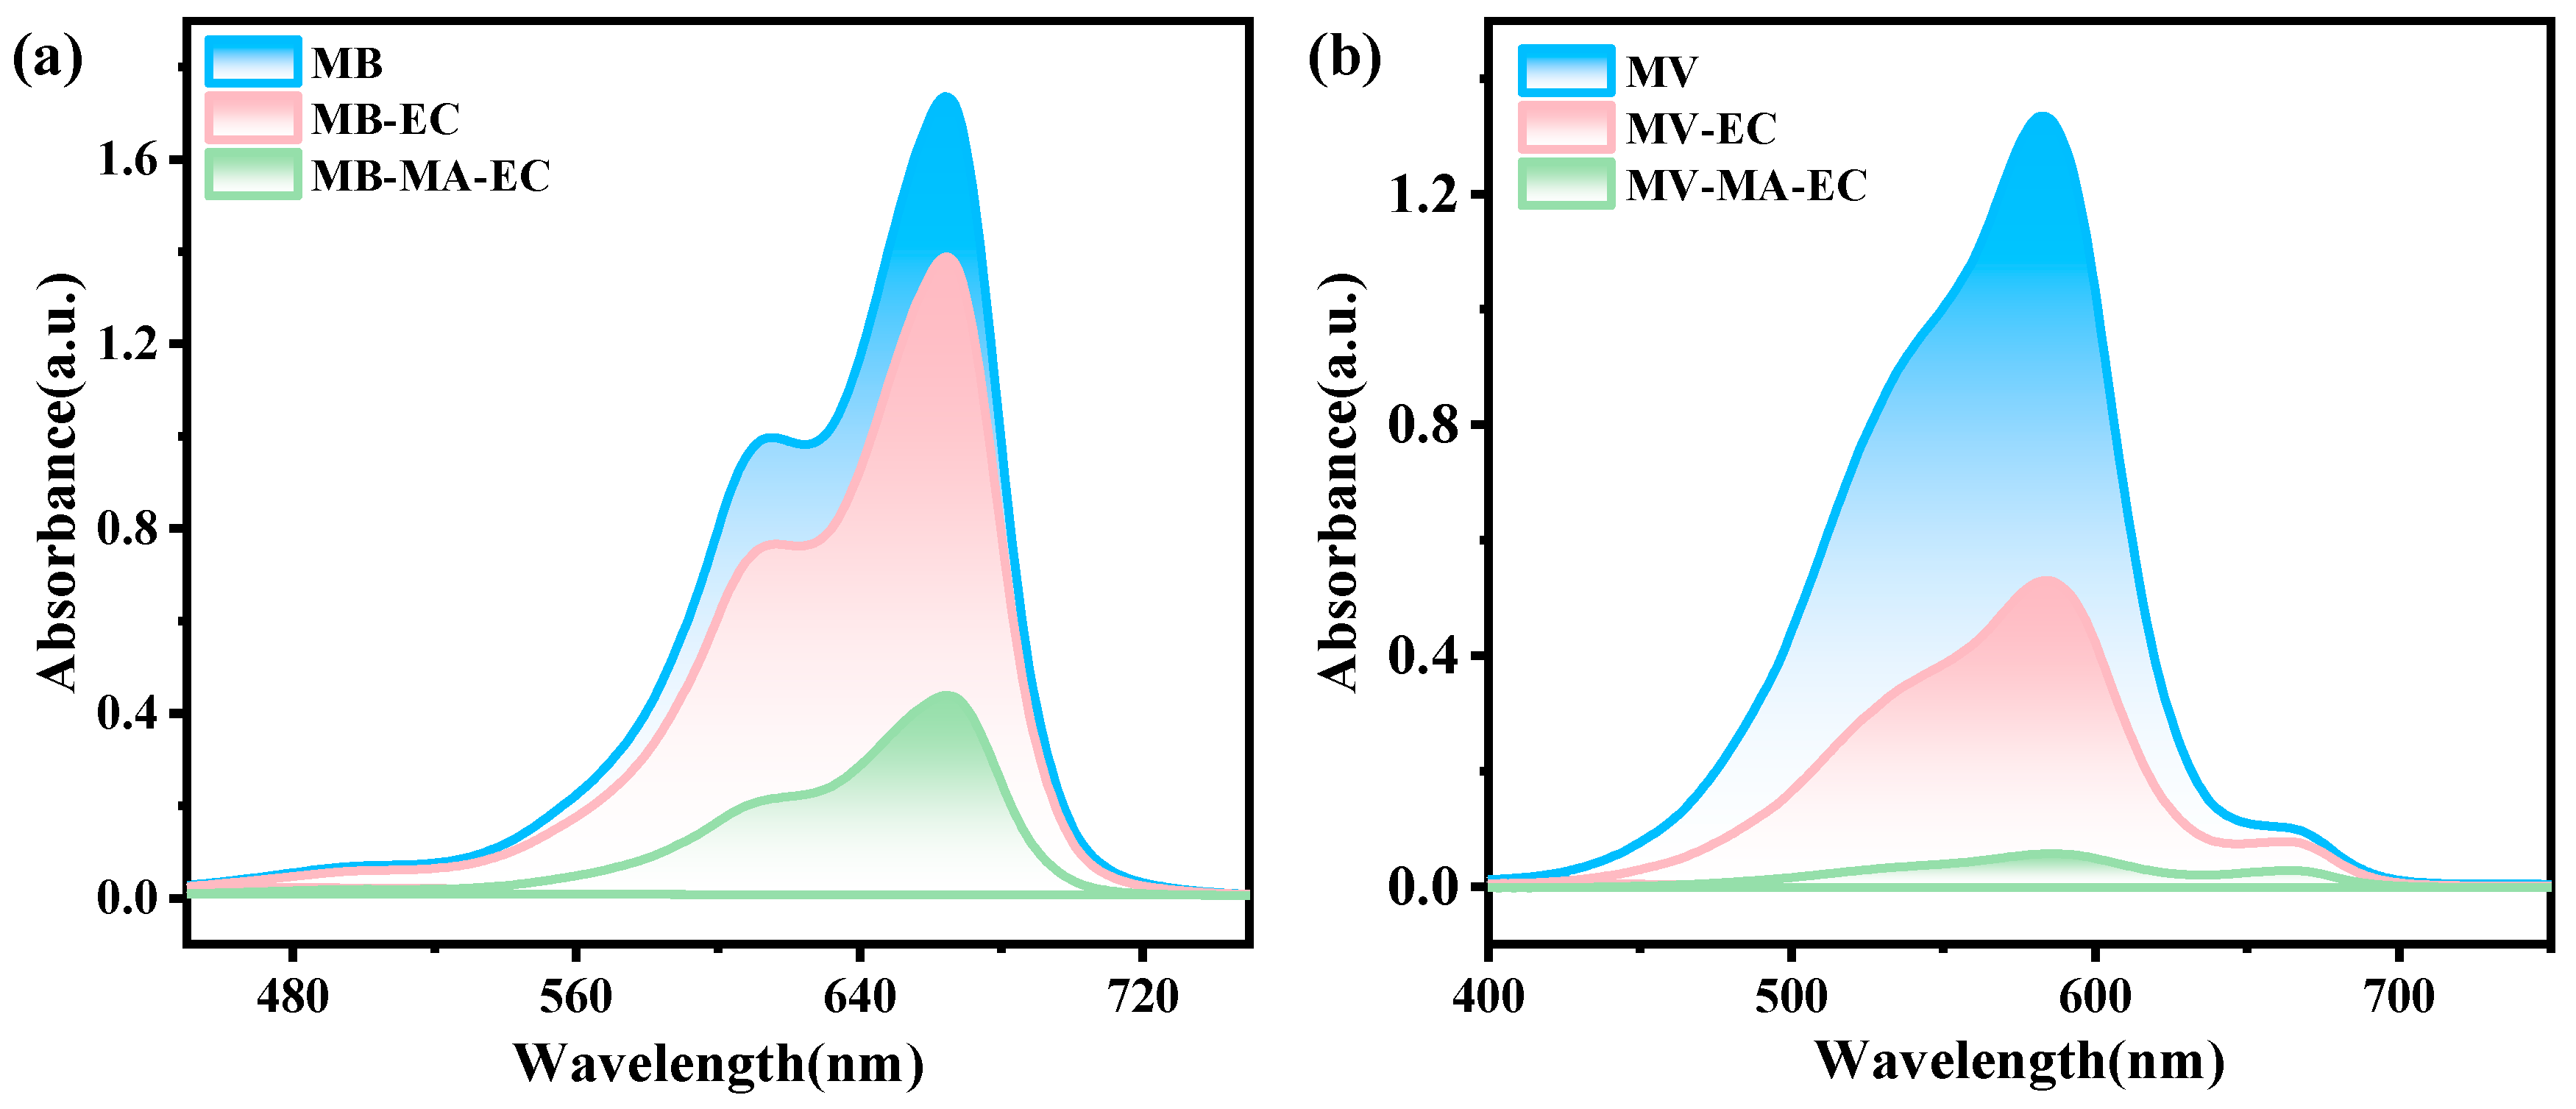
2.4. Adsorption Test

The preparation of MA-EC was dispersed into a solution of a certain concentration, and a standard curve was plotted by measuring the absorbance against the concentration. At 25 °C, the effects of different pH values, adsorption time, and initial dye concentration on the adsorption performance of MB and MV by MA-EC were examined. Equations (1) and (2) were used to calculate adsorption capacity at time and equilibrium adsorption capacity respectively [31]:
Q t = C 0 - C t m V
Q e = C 0 - C e m V
where C0 is the initial concentration of the dye in the solution (mg/L), Ce is the equilibrium concentration of the dye in the solution (mg/L), Ct is the concentration of the dye at time t (mg/L), V is solution volume (L), and m is the mass of the adsorbent (mg).
In this paper, nonlinear pseudo-first order (NLPFO) (Equation (3)) and nonlinear pseudo-second order (NLPSO) (Equation (4)) equations were used for dynamic experiments. In addition, the Langmuir nonlinear isotherm model (NLLM) (Equation (5)) and the Freundlich nonlinear isotherm model (NLFM) (Equation (6)) were used for the isotherm model [32].
Q t = Q e ( 1 - exp - k 1 t )
Q t = k 2 Q e 2 t 1 + k 2 Q e t
where k1 (1/min) is the PFO rate constant, k2 (g/mg/min) is the PSO rate constant, Qt and Qe (mg/g) are the adsorbed mass of dye per unit mass of sorbent at time t and equilibrium, respectively.
Q e = Q m K L C e 1 + K L C e
Q e = K F C e 1 / n
where Ce is the dye concentration at equilibrium, Qm and KL (L/mg) represent the maximum adsorption capacity. KF (L/g) is the Freundlich constant, while n (arbitrary) is the Freundlich heterogeneity factor related to the adsorption capacity.

2.5. Characterizations

The physicochemical properties of MA-EC were studied via various characterization techniques. An infrared spectrometer Nicolet6700-NXR (Thermo Fisher Scientific Company, Guangzhou, China) was used for FTIR analysis. A tableting method was used to mix and press the MA-EC and potassium bromide. The scanning range was 4000 to 400 cm−1. A Zeiss Gemini300 scanning electron microscope was used to analyze the MA-EC. The specific surface area was measured using a TriStar II3020 specific surface area and pore size analyzer (Micromeritics Corporation, Shanghai, China). The absorbance of the solution after adsorption was tested with a Lambda 365 UV-Vis Spectrophotometer (PerkinElmer, Boston, MA, USA). The materials were characterized via XRD with X’Pert PRO (PANalytical Company, Eindhoven, The Nederland) and XPS with ESCALAB 250Xi (Thermo Fisher Scientific Company, Guangzhou, China). Thermogravimetric analysis was performed using STA 449 F5 (NETZSCH Scientific Instruments Trading Ltd., Shanghai, China).

3. Results and Discussion

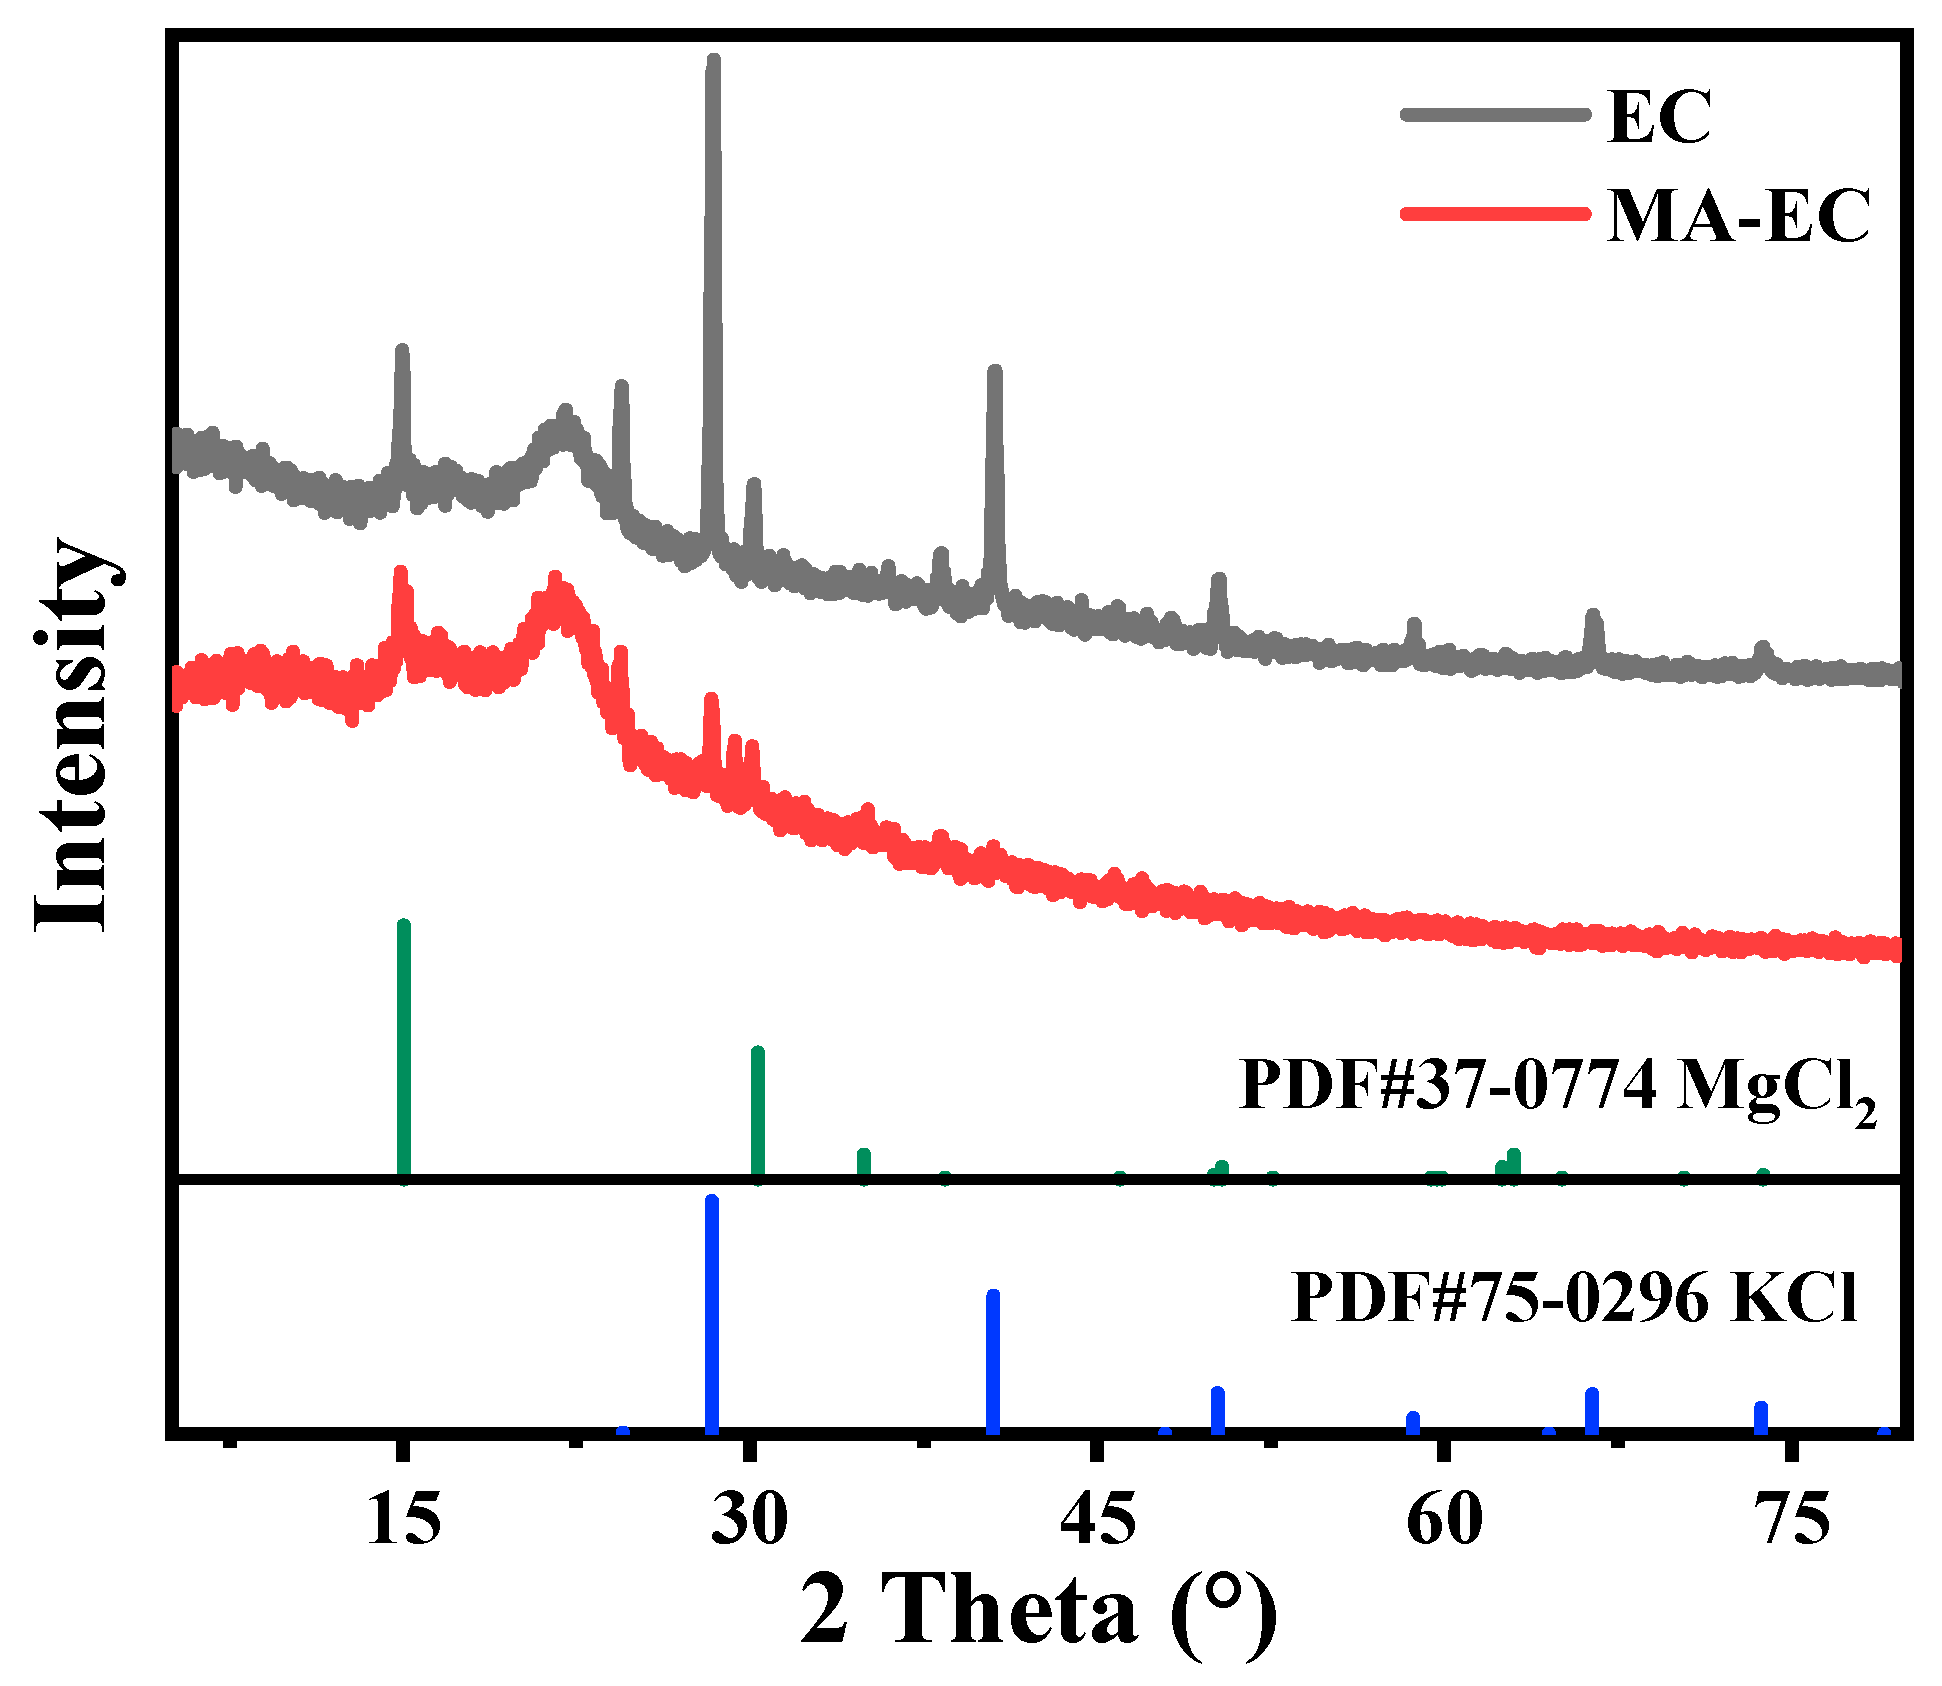
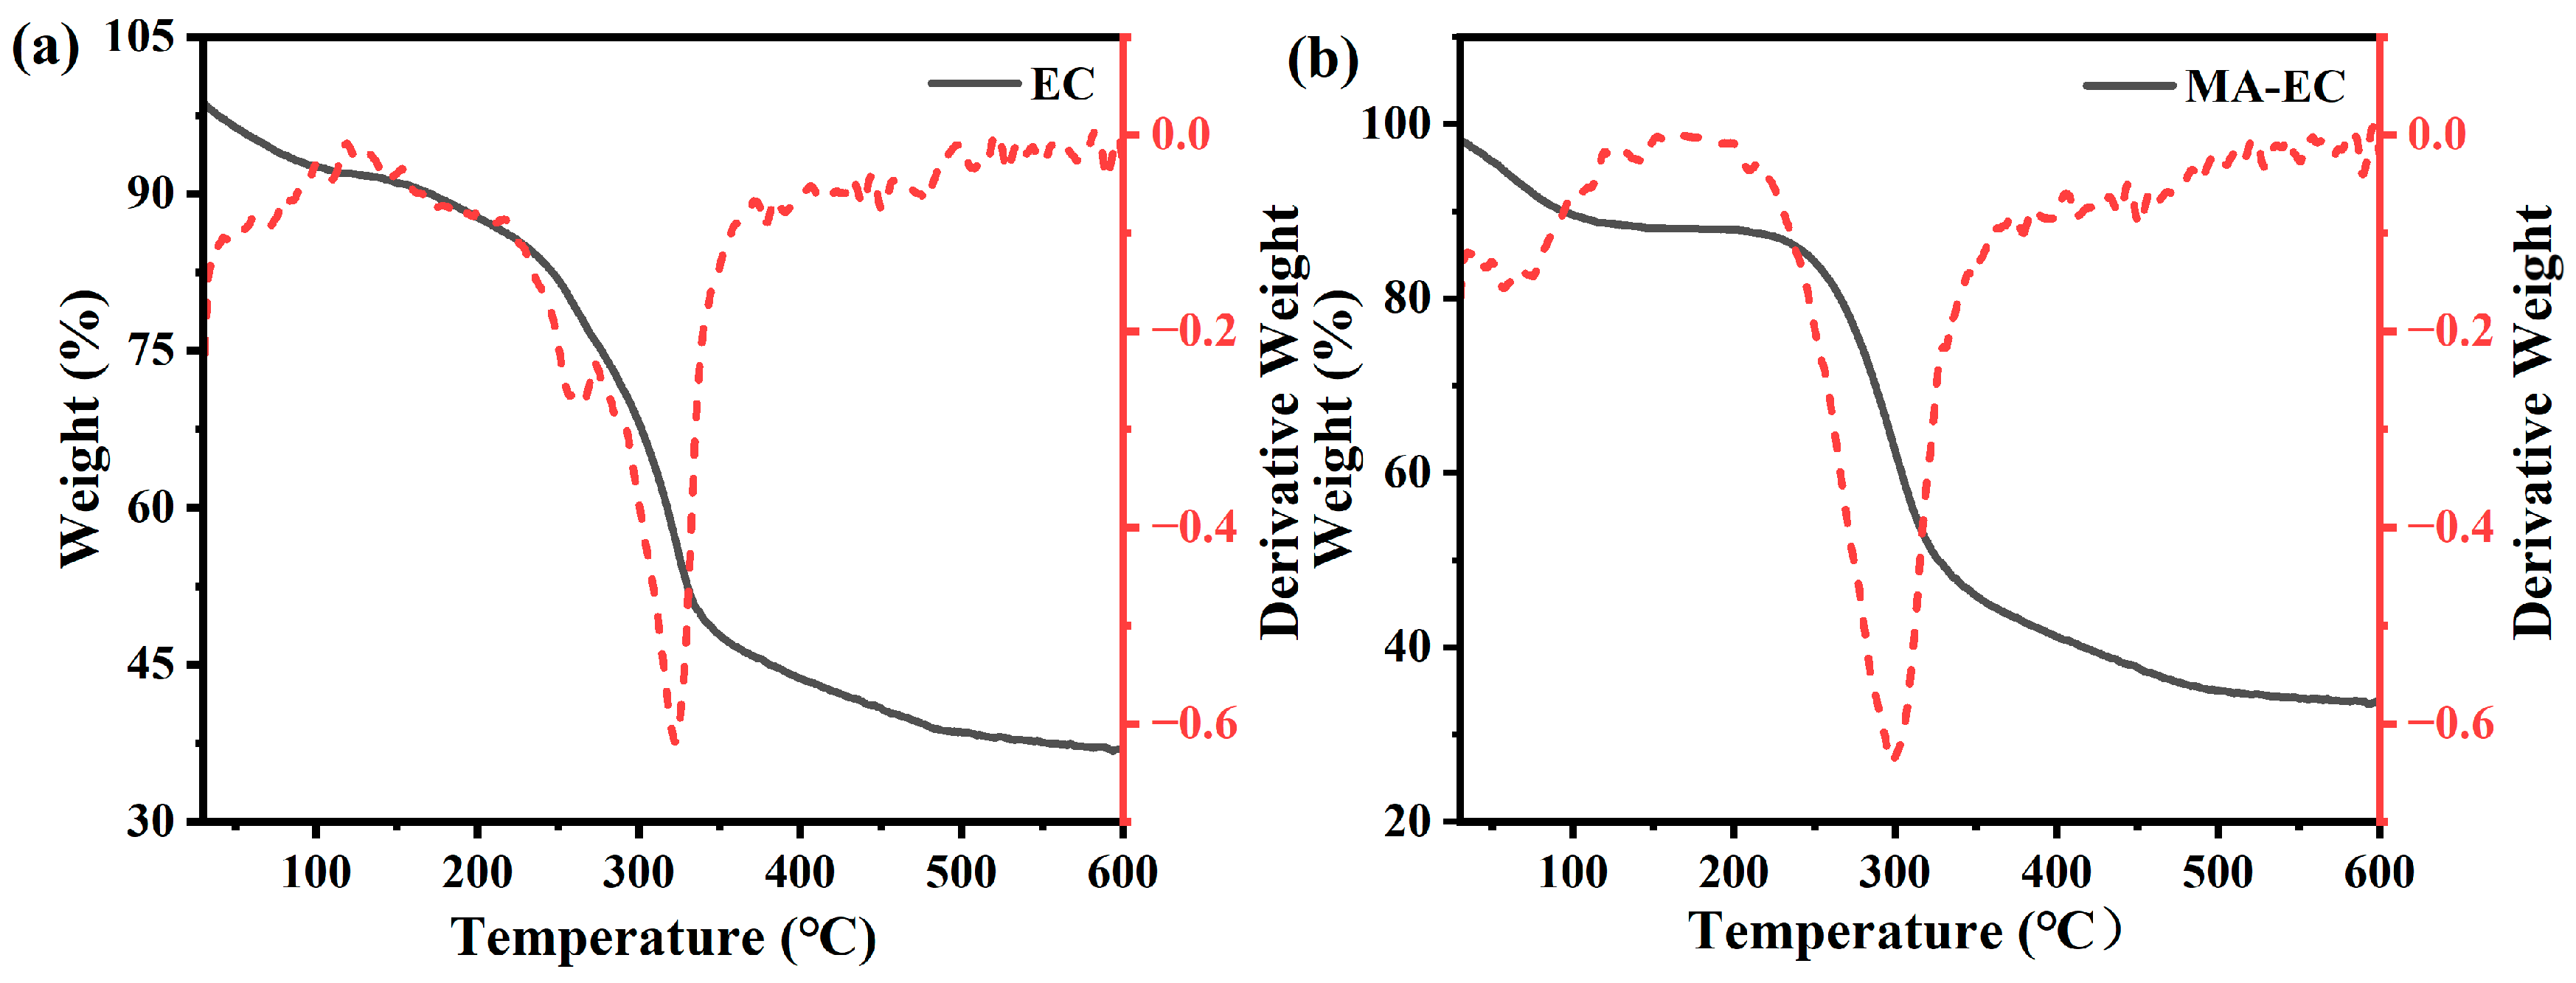
3.1. Characterization of MA-EC and EC

To further understand the morphology and structure of the material, SEM (Scanning Electron Microscopy) characterization was performed on MA-EC, as shown in Figure 1. It can be observed from the Figure 1a,c that both MA-EC and EC exhibited an irregular blocky shape. In addition, Figure 1b shows that the EC surface was rough and wrinkled, while Figure 1d shows that the MA-EC surface was smoother than the EC surface. This was likely due to the change that occurred with the introduction of maleic anhydride.
The SEM characterization provides valuable insights into the microstructure and surface features of the materials. The comparison between the untreated EC and the treated MA-EC highlights the effects of the chemical modification process. The smoother surface of the MA-EC could be indicative of a more uniform distribution of the modifying agent, which might also influence the adsorption properties of the material. The differences in surface texture could be related to changes in the crystalline structure or the formation of a more ordered arrangement of the polymer chains resulting from the interaction with maleic anhydride. This kind of detailed analysis is crucial for understanding how the material properties can be tailored for specific applications, such as the adsorption of dyes from aqueous solutions.
From Figure 2, it can be inferred that the specific surface area of the adsorbent after modification with maleic anhydride was lower than that before modification. The specific surface area of EC was 1.41 m2/g, while the specific surface area of MA-EC was 1.07 m2/g. This reduction in specific surface area may be due to the filling of surface pores on the EC during the chemical modification process. This was also confirmed via the SEM characterization, which showed that the surface of MA-EC was indeed smoother than that of EC.
The decline in specific surface area after modification suggested that the introduction of maleic anhydride could have led to a reduction in the porosity of the material [33]. The chemical modification might have caused some of the pores to be filled or blocked, which would result in a decline in the overall surface area available for adsorption. The smoother appearance of the MA-EC surface, as observed in the SEM images, supports this hypothesis.
It is important to note that while the specific surface area is a key factor in adsorption capacity, it is not the only one. The chemical nature of the surface, the size and distribution of the pores, and the interactions between the adsorbent and the adsorbate also play significant roles. Therefore, even with a lower specific surface area, the modified adsorbent may still exhibit improved adsorption performance for certain pollutants due to the changes in surface chemistry brought about by the modification with maleic anhydride.
Based on the analysis of Figure 3, the absorption peak at 3429 cm−1 was likely due to the stretching vibration of the hydroxyl group in the water molecules. The absorption peak at 2927 cm−1 corresponded to the bending vibration of the C–H bonds in –CH2 and –CH3 groups [34]. The peak at 1634 cm−1 was attributed to the absorption of water within cellulose, and the peak at 1048 cm−1 corresponded to the vibration of the C–O–C glycosidic ring backbone in cellulose [35]. After modification, an absorption peak due to the stretching vibration of the carbonyl group (C=O) in carboxylic and ester groups can be observed at 1733 cm−1, which was a result of the introduction of carboxylic groups via the modification with maleic anhydride.
Figure 4 displays the X-ray diffraction (XRD) patterns of MA-EC and EC. During the modification process with maleic anhydride, the original crystalline structure of EC was disrupted. The natural cellulose was characterized by two strong and typical diffraction peaks at 14.9° and 22.7°, which were indicative of its crystalline structure. Analysis of the peaks at other angles using Jade software (version: advantage 5.9931) revealed the presence of compounds such as magnesium and potassium in EC. These findings are consistent with the water hyacinth’s strong enrichment capabilities, which include a robust adsorption capacity for heavy metal ions and substances like phosphorus.
Furthermore, it was observed from Figure 4 that the diffraction peaks of MA-EC after modification were significantly reduced, with only the characteristic peaks of cellulose remaining prominent. This indicates that the modification with maleic anhydride led to a decrease in the overall crystallinity of the material, which may be due to the interaction between the maleic anhydride and the clay or cellulose components [36], altering their arrangement and potentially reducing the size of the crystalline domains.
The reduction in the number of diffraction peaks after modification could have implications for the material adsorption properties. While a decrease in crystallinity might typically suggest a reduction in the material’s structural order, it can also lead to the creation of more amorphous regions that might provide additional surface area or altered chemical environments for adsorption. The modified MA-EC may thus exhibit different adsorption characteristics compared to the unmodified EC, which could be advantageous for specific applications, such as the adsorption of dyes or heavy metal ions from aqueous solutions.
Next, we analyzed the C 1s spectra in the XPS of the two adsorbents: EC and MA-EC. As shown in Figure 5, the three peaks in the C 1s spectra at 284.8, 286.8, and 289.4 eV corresponded to the C–C, C–O–C, and O–C=O groups [37], respectively. After modification, the proportion of the O–C=O group increased from 10.17% to 14.94%, which proved that carboxyl group grafting was successful. This was consistent with the existence of C–O–C and C=O stretching vibration peaks in the infrared spectrogram analysis.
Figure 6a presents the thermogravimetric curve for EC. Between the temperatures of 30–100 °C, there was a 7.39% reduction in the mass of EC, which was primarily due to the presence of moisture within the material. EC began to decompose rapidly at approximately 240 °C, and by the time the temperature reached 600 °C, the residual mass was approximately 36.85%. The derivative thermogravimetric (DTG) curve indicated that the maximum rate of mass loss for EC occurred at 322 °C. Figure 6b illustrates the thermogravimetric curve for MA-EC. The mass loss of MA-EC was 10.40% in the range of 25 to 100 °C, and this part of the loss was mainly due to the moisture contained in MA-EC. At about 200 to 350 °C, MA-EC began to decompose rapidly, and the quality decreased rapidly. After 400 °C, the rate of decline decreased. At the end of 600 °C, the residue of MA-EC was 30.05%. The residual carbon rate of the modified adsorbent was reduced.
Figure 7 presents the zeta potential test for MA-EC and EC. In the solution, different pH values can affect the charge on the surface of the adsorbent, which in turn could impact the adsorption process and thus influence the adsorption results [38]. Therefore, by testing the potential of the solution at various pH values, one can observe the surface properties of the adsorbent. With the increased in pH values, the electronegativity of MA-EC in water became increasingly stronger. This may be caused by the presence of carboxyl groups on the surface of MA-EC [39]. The electronegativity of the modified adsorbent in the aqueous solution was enhanced, which may be related to the introduction of the carboxyl group. However, the electronegativity of the unmodified adsorbent (EC) increased with the increase in pH value in the aqueous solution, but it was slightly unstable during the period.
To demonstrate the impact of chemical modification on adsorption performance, we utilized UV spectroscopy to analyze the adsorption spectra of MV and MB before and after modification. The results are illustrated in Figure 8. Figure 8a shows the UV spectra of the adsorbent’s adsorption of MB before and after modification, while Figure 8b presents the UV spectra for MV under the same conditions. The results indicate that, with identical concentrations and amounts of adsorbent, the absorbance of the dyes was significantly lower after modification. This suggests that more dye was adsorbed, indirectly confirming the success of the modification process.

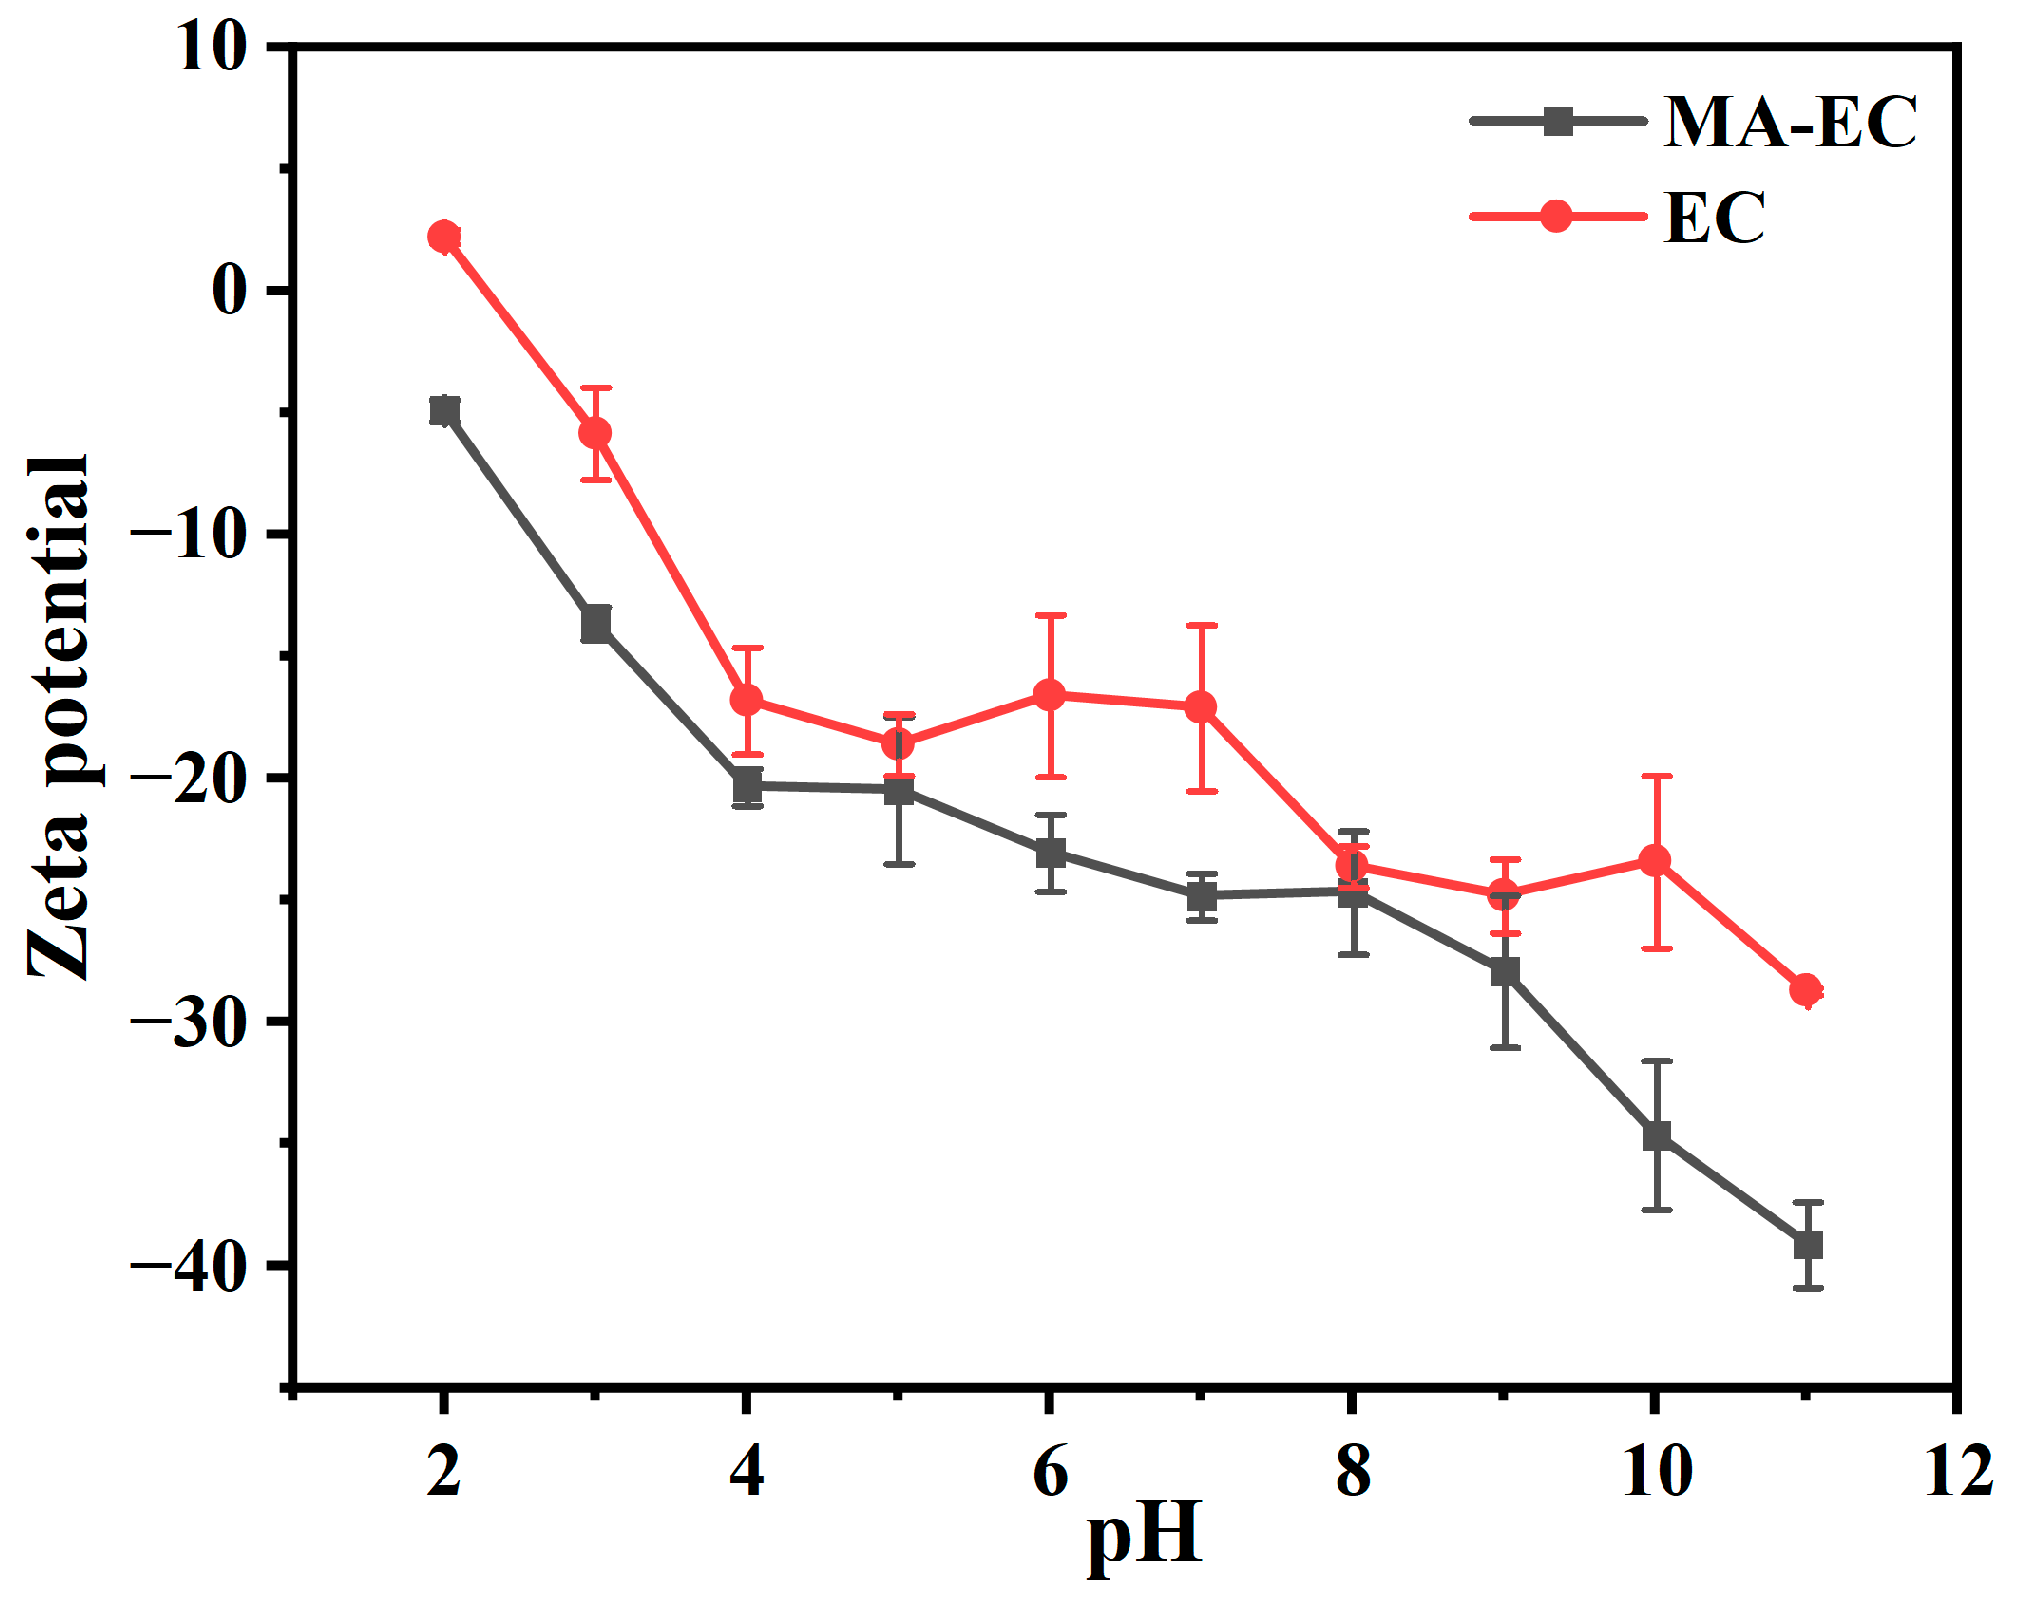
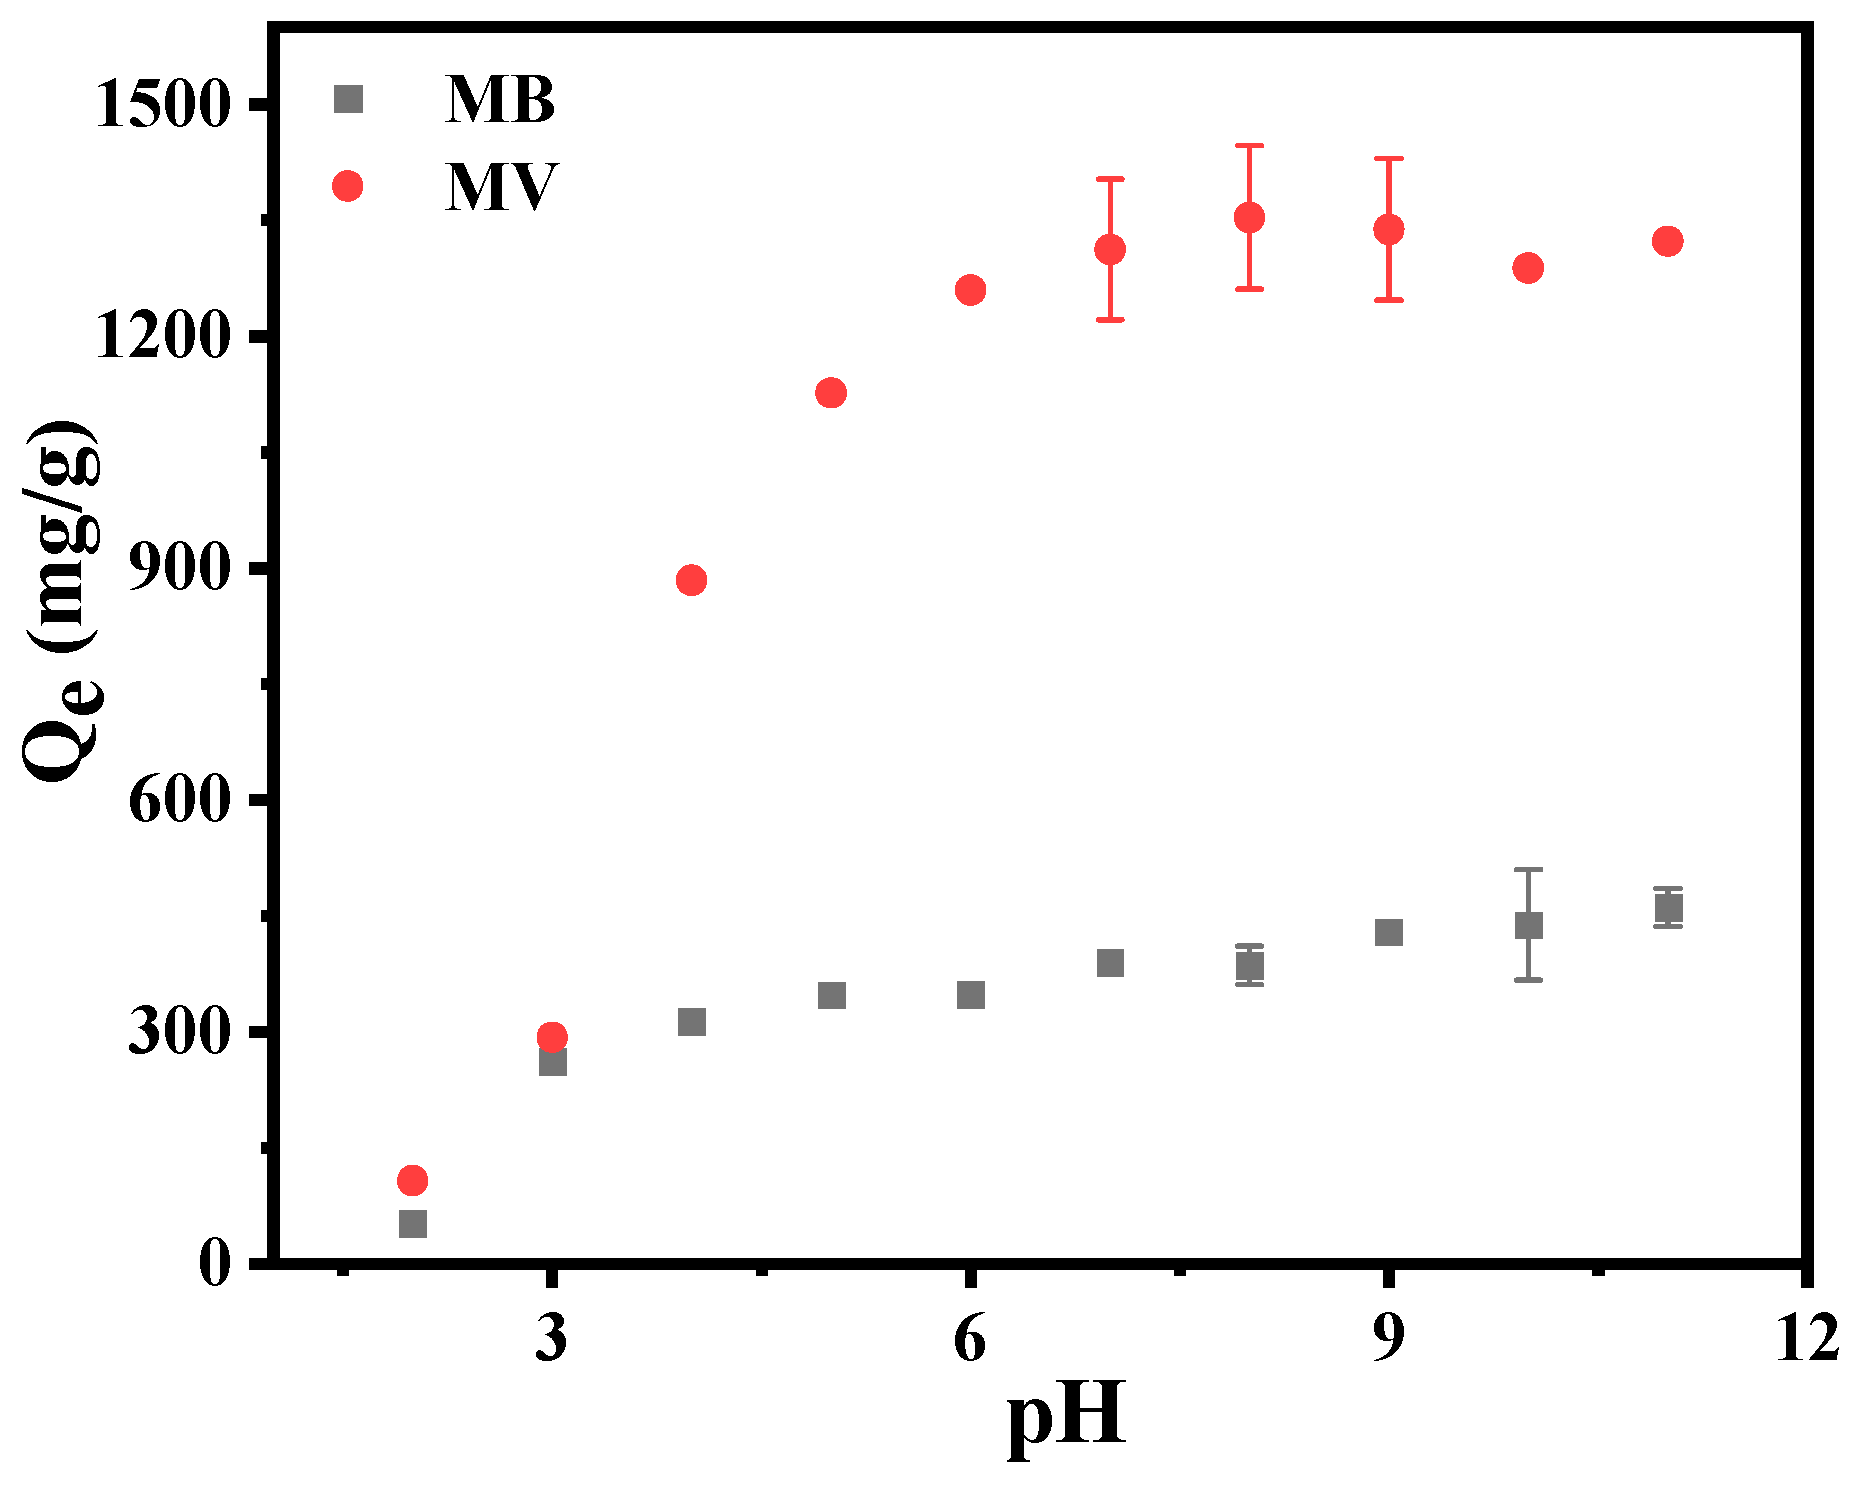
3.2. Influence of pH Value on Adsorption Properties of MA-EC

The pH value is an important factor affecting the adsorption efficiency of the material. The pH of the solution was adjusted using NaOH or HCl, and the mixture was then placed in a constant temperature shaker for agitation. In this experiment, MV and MB dyes with a concentration of 1000 mg/L were used, and the adsorption capacity of MA-EC for MV and MB at different pH values was determined via Formula 2. The adsorption time was 2 h. From Figure 9, it can be observed that the results indicated the adsorption capacity increased with the increased pH value. The small adsorption capacity at low pH values may be due to the protonation of the carboxyl groups on the surface of MA-EC under more acidic conditions, which reduced the attraction for dye molecules [40]. The results were consistent with the zeta potential analysis.

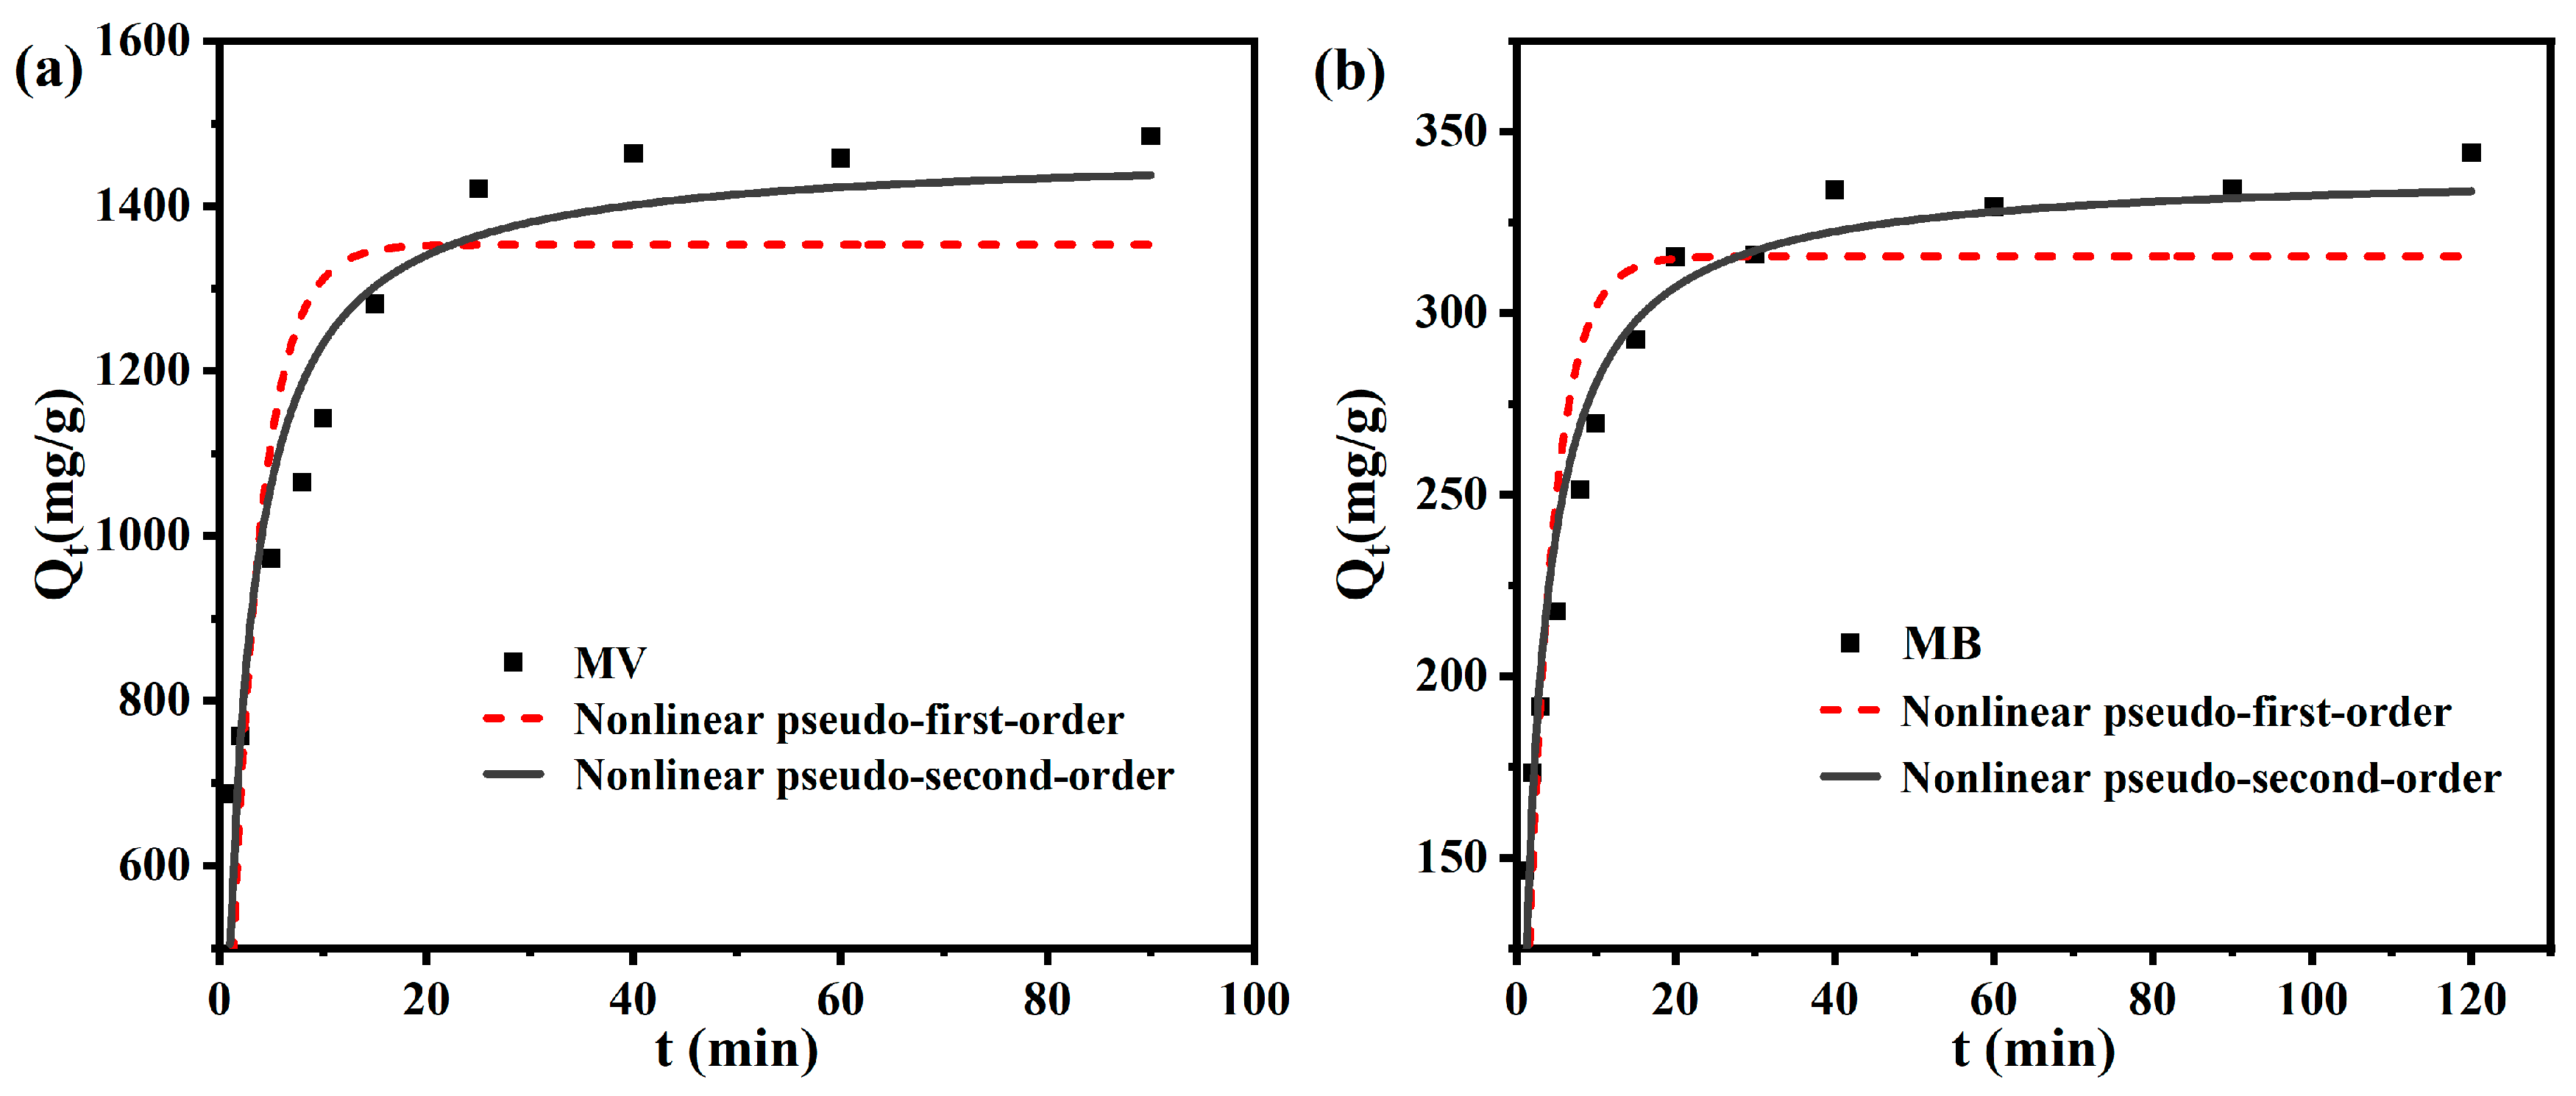
3.3. Adsorption Kinetics

In this experiment, we selected MV dye with a concentration of 1000 mg/L and MB dye with a concentration of 500 mg/L, and added 25 mg MA-EC. The adsorption capacity at the target time was calculated according to Formula 1. As can be seen from Figure 10, the adsorption capacity of MA-EC increased sharply within the first 20 min and reached an equilibrium state around 30 min.
This was due to the presence of carboxyl groups in MA-EC, which carried a negative charge and quickly bound with the positively charged cationic dyes. The rapid adsorption efficiency could bring significant benefits to the actual production process. In order to further study the adsorption mechanism, the linear kinetic equation may mislead the results, so the nonlinear pseudo-first order kinetic model (NLPFO) (Equation (3)) and nonlinear pseudo-second order kinetic model (NLPSO) (Equation (4)) were used to fit and analyze the data, as shown in Figure 10.
From Table 1, it can be concluded that the correlation coefficient (R2) values for NLPFO were lower than those for NLPSO (0.89 for MV and 0.95 for MB), indicating that the adsorption process of MA-EC was more in line with the nonlinear pseudo-second order kinetic model. In addition, the calculated Qe-cal values from the kinetic models were essentially consistent with the experimental Qe-exp results. It can be inferred that the adsorption process was predominantly chemical adsorption.

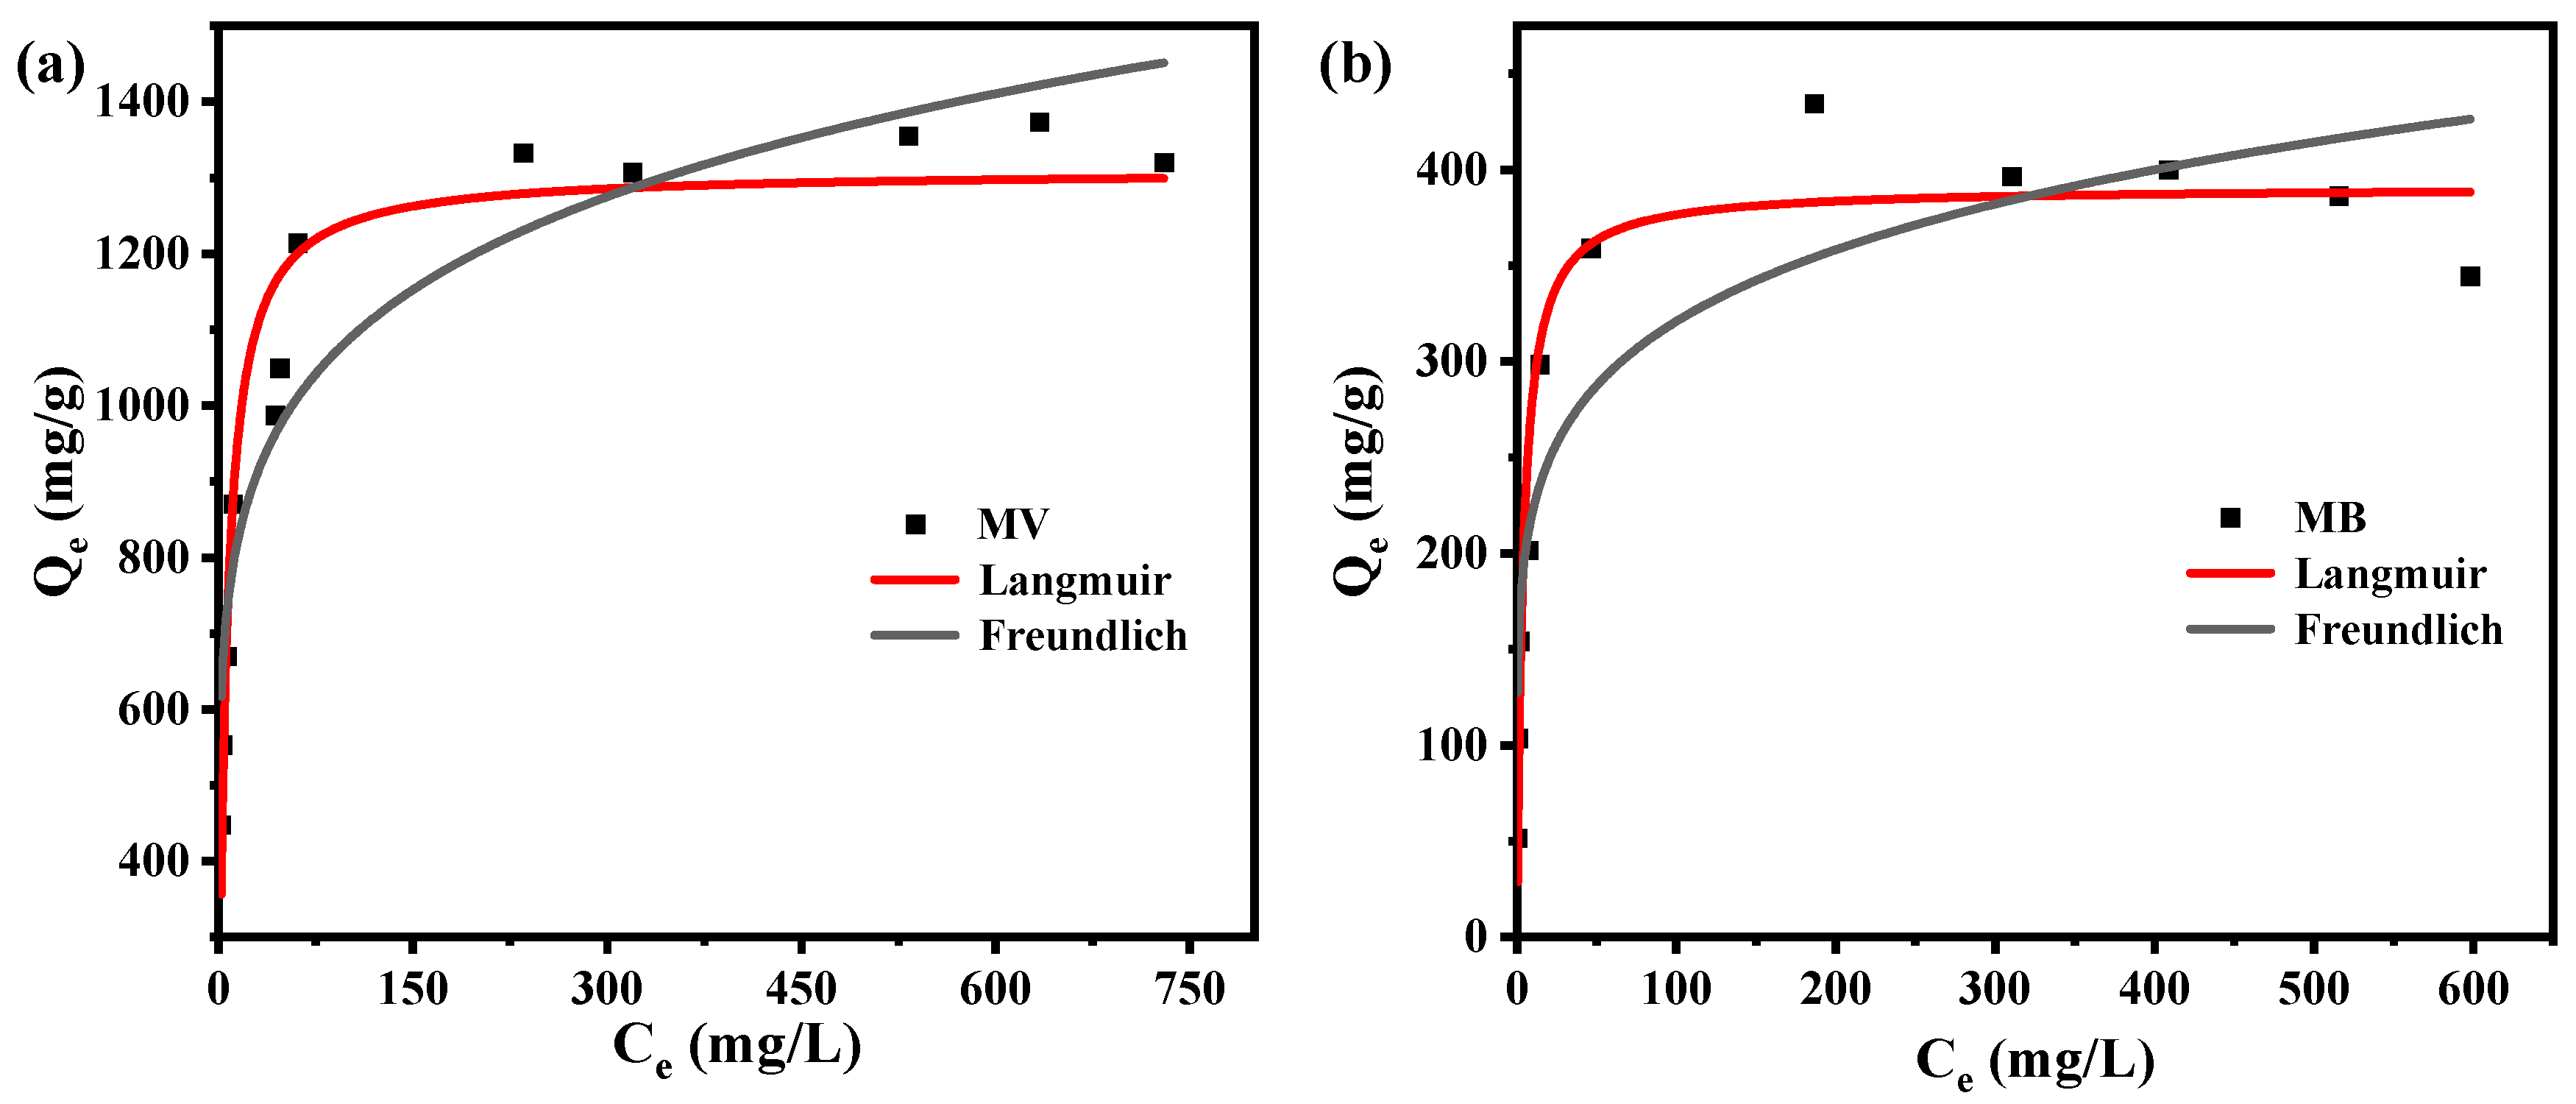
3.4. Adsorption Isotherms

To explore the effect of different concentrations on the adsorption performance of MA-EC, a series of dye solutions with concentrations ranging from 300 to 1500 mg/L were prepared. They were adsorbed at 25 °C for two hours and their absorbance was measured to determine their adsorption capacity. As can be seen from Figure 11, with the increase in the initial concentration of the dye, the adsorption capacity of MA-EC for MV and MB first increased and then tended to stabilize. This may be because as the concentration increased, the adsorption sites on the adsorbent were gradually occupied until they reached saturation [41].
Langmuir isotherm (Equation (5)) and Freundlich isotherm (Equation (6)) equations were used to fit experimental data, and the fitted results are shown in Table 2. As can be seen from Table 2, among the two isotherm model fittings, the Langmuir model had the highest degree of fit, with correlation coefficients R2 of 0.9316 for MV and 0.9355 for MB, respectively. It can be concluded that the adsorption process of MA-EC was more in line with the Langmuir adsorption isotherm model. The results show that the adsorbent surface was uniform and the adsorption process was a single molecular layer. It is worth mentioning that an n value ranging between 0 and 10 indicates the favorable adsorption process [42]. The experimental results show that both adsorption processes were favorable.

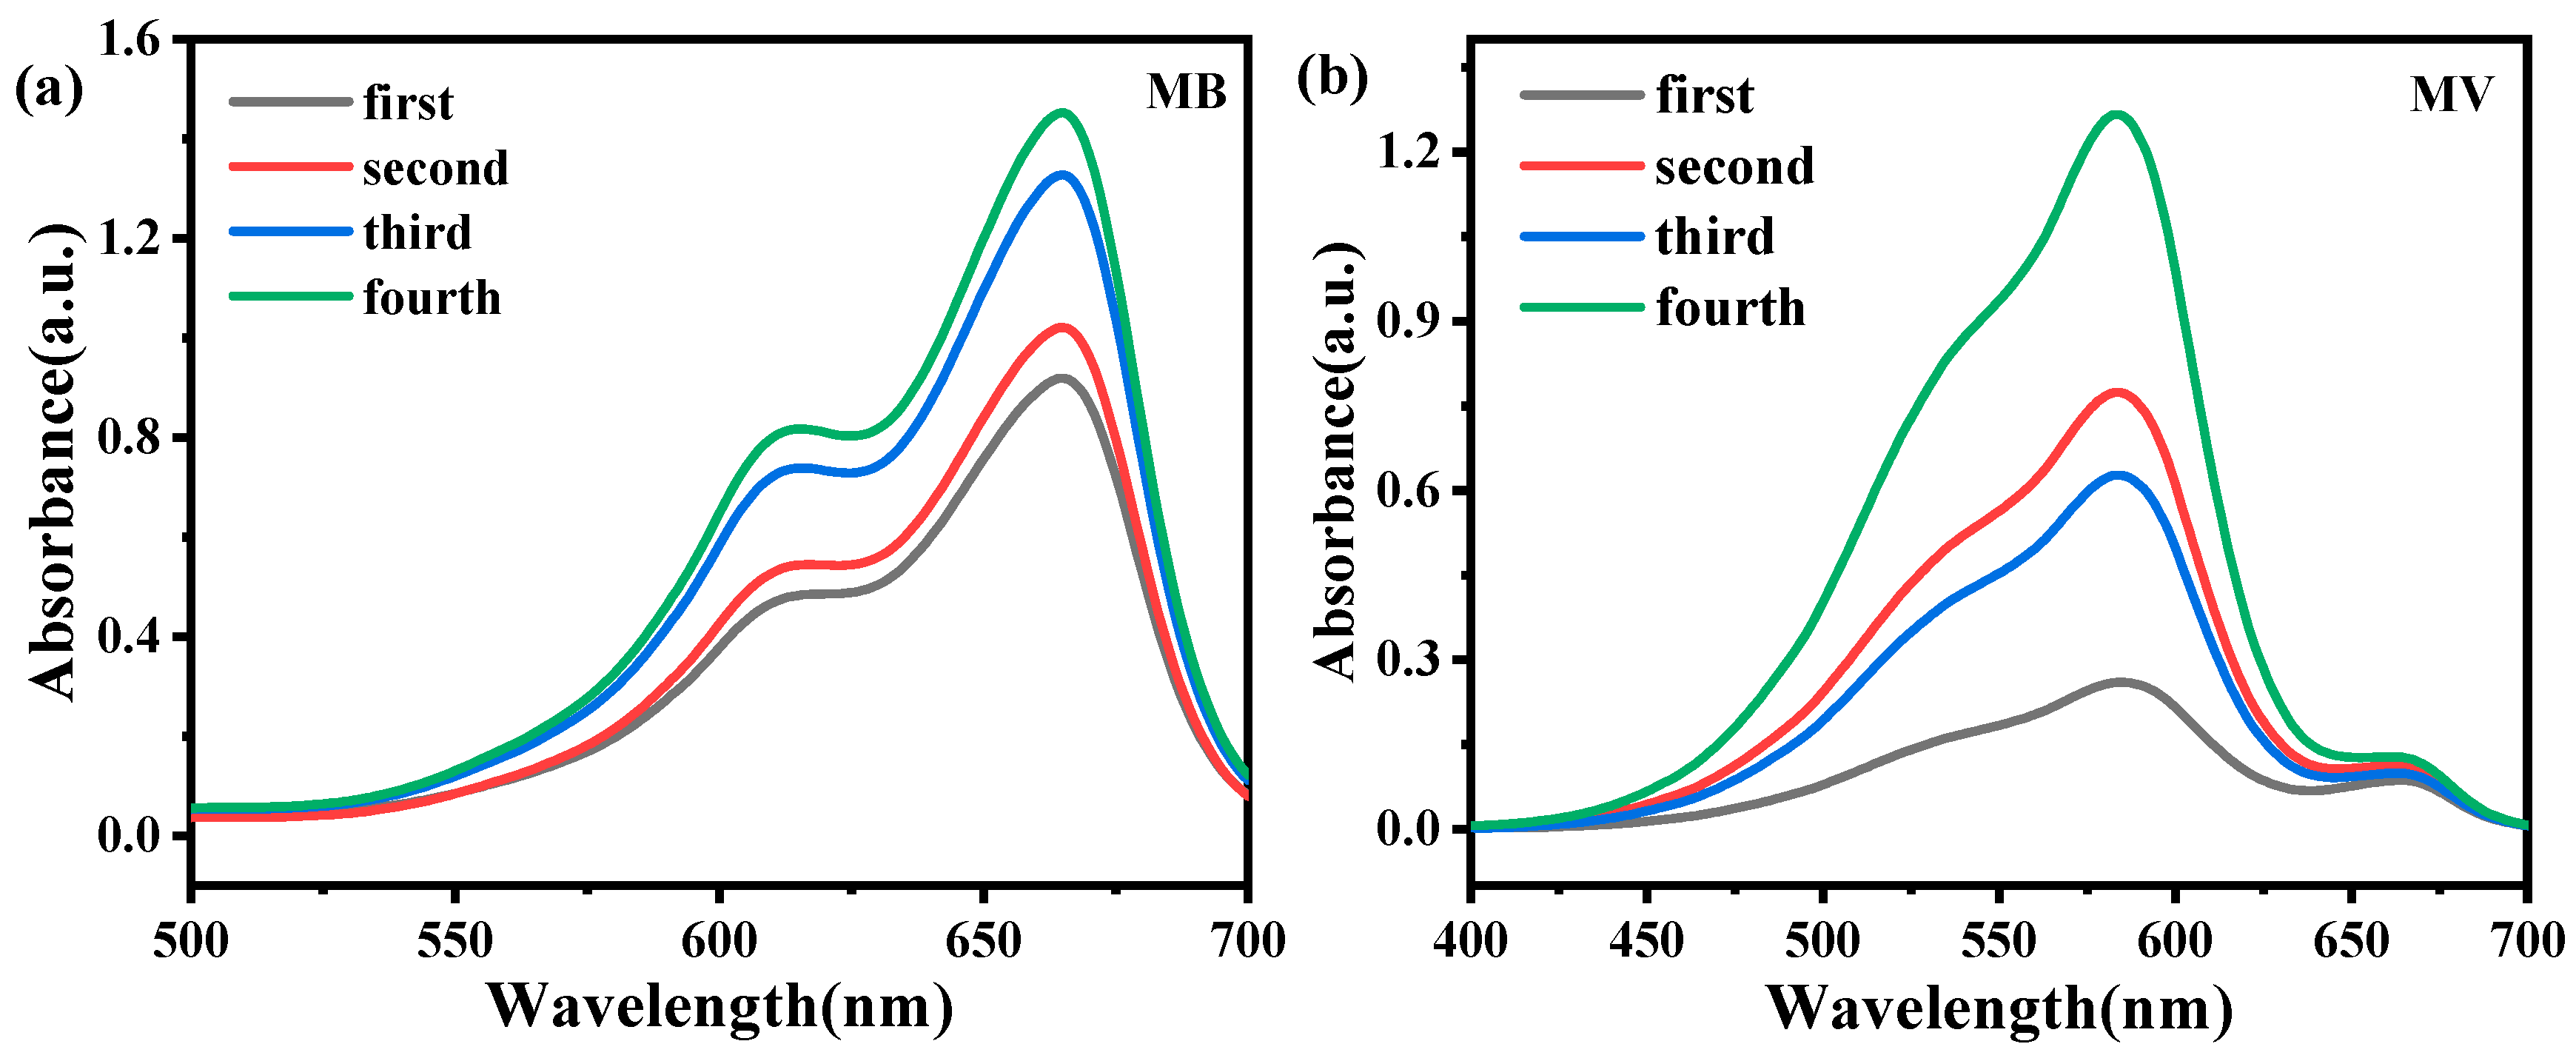
3.5. Cyclic Adsorption Experiment

The recycling and reuse of adsorption materials could effectively reduce costs in practical application production. The recycling adsorption capacity of MA-EC for MV and MB was tested via adsorption–desorption experiments. For the desorption of adsorbent after adsorbing dye, we used 5% dilute hydrochloric acid for the desorption treatment, and then reused it after drying. In our experimental investigation of the influence of varying pH levels on the adsorption capacity of MA-EC, it was discerned that the material exhibited reduced adsorptive strength under acidic conditions. Consequently, after the adsorption phase, MA-EC was immersed in a 5% dilute hydrochloric acid solution to facilitate desorption. Once the desorption was complete, the material was dried and repurposed for subsequent cycles of MV and MB adsorption. The initial concentration of MV used in this experiment was 1000 mg/L, the initial concentration of MB was 350 mg/L, and the dosage of adsorbent was 10mg. The results are shown in Figure 12. From Figure 12, it can be seen that the adsorption efficiency of MA-EC decreased with the increase in the number of adsorption–desorption cycles.
After four cycles, the adsorption capacity for MB did not show a significant decrease, with an adsorption capacity of 215.56 mg/g during the fourth adsorption. The recycling adsorptive efficiency of MA-EC for MV was slightly worse compared to MB, but after the fourth adsorption–desorption cycle, the adsorbent still had an adsorption capacity of 438.88 mg/g for MV. Figure 13a shows the ultraviolet spectrum after MB desorption by the adsorbent, and Figure 13b shows the ultraviolet spectrum after MV desorption by the adsorbent. It can be seen from the figure that two dyes were adsorbed, and the absorbance gradually increased with the increase in desorption times, indicating that the adsorption capacity of the adsorbent decreased after analysis.

3.6. Performance Evaluation of Biomass

The results of adsorption of MV and MB by MA-EC were compared with other biomass adsorbents. It was found that the adsorption performance of MA-EC was better and the adsorption capacity was higher than most adsorption materials. The results are shown in Table 3.

4. Conclusions

In this study, water hyacinth stems were pretreated and modified with maleic anhydride to obtain an adsorption material (MA-EC). A series of characterizations were conducted on the water hyacinth stem powder before and after modification using various instruments. The adsorption capacity of MA-EC for MV and MB was studied. Adsorption experiments indicated that MA-EC had good adsorption effects on both MV and MB, with particularly significant adsorption effects on MV. Under conditions of 25 °C temperature and pH = 8, the adsorption capacity of MA-EC for MV reached 1309.12 mg/g, and 390.80 mg/g for MB. Moreover, MA-EC can rapidly adsorb cationic dyes, achieving adsorption equilibrium within half an hour. The adsorption mechanism was the combination of the negatively charged groups on the surface of MA-EC with the positively charged groups of the cationic dyes, realizing dye adsorption through electrostatic force. Adsorption–desorption cycling experiments indicated that the MA-EC adsorbent had good reusability, with an adsorption capacity of 538.88 mg/g for MV and 215.56 mg/g for MB after four cycles of desorption–adsorption.

Author Contributions

Conceptualization, Y.L.; methodology, Y.L. and L.S.; validation, J.X.; formal analysis, X.W.; investigation, L.S.; writing—original draft preparation, L.S. All authors have read and agreed to the published version of the manuscript.

Funding

This work was financially supported by the Open Project Program of Guangxi Key Laboratory of Optical and Electronic Materials and Devices (22AA-10).

Data Availability Statement

Data is contained within the article.

Conflicts of Interest

The authors declare no conflict of interest.

References

  1. Lu, L.; Na, C. Gibbsian interpretation of Langmuir, Freundlich and Temkin isotherms for adsorption in solution. Philos. Mag. Lett. 2022, 102, 239–253. [Google Scholar] [CrossRef]
  2. Al-Tohamy, R.; Ali, S.S.; Li, F.; Okasha, K.M.; Mahmoud, Y.A.G.; Elsamahy, T.; Jiao, H.; Fu, Y.; Sun, J. A Critical Review on the Treatment of Dye-containing Wastewater: Ecotoxicological and Health Concerns of Textile Dyes and Possible Remediation Approaches for Environmental Safety. Ecotoxicol. Environ. Saf. 2022, 231, 113160. [Google Scholar] [CrossRef] [PubMed]
  3. Adane, T.; Adugna, A.T.; Alemayehu, E. Textile industry effluent treatment techniques. J. Chem. 2021, 2021, 5314404. [Google Scholar] [CrossRef]
  4. Xie, Y.; Du, G.; Pang, J.; Kong, L.; Lu, L. One-step preparation of magnetic N-doped sodium alginate-based porous carbon and efficient adsorption of bisphenol A. Environ. Sci. Pollut. 2023, 30, 99842–99854. [Google Scholar] [CrossRef]
  5. Garg, A.; Chopra, L. Dye Waste: A Significant Environmental Hazard. Mater. Today 2022, 48, 1310–1315. [Google Scholar] [CrossRef]
  6. Zhao, J.; Dang, Z.; Muddassir, M.; Raza, S.; Zhong, A.; Wang, X.; Jin, J. A new Cd (II)-based coordination polymer for efficient photocatalytic removal of organic dyes. Molecules 2023, 28, 6848. [Google Scholar] [CrossRef]
  7. Fındık, S. Sono-assisted Adsorption of Methyl Violet 2B Using a Magnetic Kaolin/TiO2/γ-Fe2O3 Nano Composite. Water Air Soil Pollut. 2024, 235, 514. [Google Scholar] [CrossRef]
  8. Zhang, X.; Zhang, Q.; Zheng, T.; Tang, T.; Liu, H.; Liu, G.; Zhu, H. Fabrication of Composite Material Based on MOFs and its Adsorption Properties for Methylene Blue Dyes. Chin. J. Mater. Res. 2021, 35, 866–872. [Google Scholar]
  9. Li, P.; Zhang, J.; Yu, Y.; Jia, W.; Zhao, S. A Collaborative Coagulation Strategy for Algae-laden and Dye-containing Water Treatment. J. Clean. Prod. 2024, 442, 141146. [Google Scholar] [CrossRef]
  10. Radia, D.; Fouzia, T.; Rachida, R.; Wahib, N.M.; Bentahar, F. Photocatalysis Process to Treat Polluted Water by Azo Dye Cibacron Brilliant Yellow 3G-P. Water Sci. Technol. 2022, 86, 1774–1789. [Google Scholar] [CrossRef]
  11. Li, H.; Shi, Y.; Wang, Y.; Zhao, X. A Research on the Strengthening Effect of Sludge Charcoal on Activated Sludge Process in Sewage Treatment. Environ. Sci. Pollut. Res. 2024, 31, 5289–5303. [Google Scholar] [CrossRef] [PubMed]
  12. Mpongwana, N.; Rathilal, S. Exploiting Biofilm Characteristics to Enhance Biological Nutrient Removal in Wastewater Treatment Plants. Appl. Sci. 2022, 12, 7561. [Google Scholar] [CrossRef]
  13. Gao, Y.; Zeng, J.; Zhu, S.; Liu, Q. Co-modification of Lignocellulosic Biomass by Maleic Anhydride and Ferric Hydroxide for the Highly Efficient Biosorption of Methylene Blue. New J. Chem. 2021, 45, 19678–19690. [Google Scholar] [CrossRef]
  14. Barik, A.; Rajhans, G.; Sen, S.K.; Raut, S. Agricultural Bio-wastes: A Potent Sustainable Adsorbent for Contaminant Removal. In Handbook of Solid Waste Management; Springer Nature: Singapore, 2022; pp. 571–591. [Google Scholar] [CrossRef]
  15. Januário, E.F.D.; Vidovix, T.B.; Araujo, L.A.D.; Bergamasco Beltran, L.; Bergamasco, R.; Vieira, A.M.S. Investigation of Citrus Reticulata Peels as an Efficient and Low-cost Adsorbent for the Removal of Safranin Orange Dye. Environ. Technol. 2022, 43, 4315–4329. [Google Scholar] [CrossRef]
  16. Kapoor, R.T.; Sivamani, S. Biosorption Behavior of Acid Orange 7 Dye onto Cucumis Sativus Peel Biochar and its Effect on Growth of Triticum Aestivum. Environ. Prog. Sustain. Energy 2023, 42, e14106. [Google Scholar] [CrossRef]
  17. Park, J.H.; Wang, J.J.; Xiao, R.; Wang, M.; Lee, Y.H.; Kang, S.W.; Seo, D.C. Characteristics of Adsorption Behavior of Potentially Toxic Metals by Biochar Derived from Fallen Leaves (Platanus) and its Mechanism. Sustain. Chem. Pharm. 2022, 29, 100776. [Google Scholar] [CrossRef]
  18. Sebastian, A.; Nangia, A.; Prasad, M.N.V. Cadmium and Sodium Adsorption Properties of Magnetite Nanoparticles Synthesized from Hevea Brasiliensis Muell. Arg. Bark: Relevance in Amelioration of Metal Stress in Rice. J. Hazard. Mater. 2019, 371, 261–272. [Google Scholar] [CrossRef]
  19. Batool, A.; Valiyaveettil, S. Chemical Transformation of Soya Waste into Stable Adsorbent for Enhanced Removal of Methylene Blue and Neutral Red from Water. J. Environ. Chem. Eng. 2021, 9, 104902. [Google Scholar] [CrossRef]
  20. Abd-Elhamid, A.I.; Ali, H.H.; Nayl, A.A. Modification of Sugarcane Bagasse as a Novel Lignocellulosic Biomass Adsorbent Nanocomposite to Improve Adsorption of Methylene Blue. Cellulose 2023, 30, 5239–5258. [Google Scholar] [CrossRef]
  21. Yang, P.; Lu, Y.; Zhang, H.; Li, R.; Hu, X.; Shahab, A.; Elnaggar, A.Y.; Alrefaei, A.F.; AlmutairiI, M.H.; Ali, E. Effective Removal of Methylene Blue and Crystal Violet by Low-cost Biomass Derived from Eucalyptus: Characterization, Experiments, and Mechanism Investigation. Environ. Technol. 2024, 33, 103459. [Google Scholar] [CrossRef]
  22. Lin, H.; Chen, K.; Du, L.; Gao, P.; Zheng, J.; Liu, Y.; Ma, L. Efficient and Selective Adsorption of Methylene Blue and Methyl Violet Dyes by Yellow Passion Fruit Peel. Environ. Technol. 2021, 43, 3519–3530. [Google Scholar] [CrossRef] [PubMed]
  23. Chu, J.J.; Ding, Y.; Zhuang, Q.J. Invasion and Control of Water Hyacinth (Eichhornia crassipes) in China. J. Zhejiang Univ. Sci. B 2006, 7, 623–626. [Google Scholar] [CrossRef] [PubMed]
  24. Lu, J.; Wu, J.; Fu, Z.; Zhu, L. Water Hyacinth in China: A Sustainability Science-based Management Framework. Environ. Manag. 2007, 40, 823–830. [Google Scholar] [CrossRef] [PubMed]
  25. Harun, I.; Pushiri, H.; Amirul-Aiman, A.J.; Zulkeflee, Z. Invasive Water Hyacinth: Ecology, Impacts and Prospects for the Rural Economy. Plants 2021, 10, 1613. [Google Scholar] [CrossRef]
  26. Bhattacharya, A.; Kumar, P. Water hyacinth as a potential biofuel crop. J. Agric. Food Chem. 2010, 9, 112–122. [Google Scholar] [CrossRef]
  27. Low, K.S.; Lee, C.K.; Tan, K.K. Biosorption of basic dyes by water hyacinth roots. Bioresour. Technol. 1995, 52, 79–83. [Google Scholar] [CrossRef]
  28. Saltabaş, Ö.; Teker, M.; Konuk, Z. Biosorption of cationic dyes from aqueous solution by water hyacinth roots. Glob. Nest J. 2012, 14, 24–31. [Google Scholar] [CrossRef]
  29. Tsaniatri, D.A.; Hargono, H. Adsorption of Pb(II) from aqueous solution by acid-modified water hyacinth cellulose. IOP Conf. Ser. Mater. Sci. Eng. 2021, 1053, 012010. [Google Scholar] [CrossRef]
  30. Kumar, P.; Chauhan, M.S. Adsorption of chromium (VI) from the synthetic aqueous solution using chemically modified dried water hyacinth roots. J. Environ. Chem. Eng. 2019, 7, 103218. [Google Scholar] [CrossRef]
  31. Sevim, F.; Lacin, O.; Ediz, E.F.; Demir, F. Adsorption Capacity, Isotherm, Kinetic, and Thermodynamic Studies on Adsorption Behavior of Malachite Green onto Natural Red Clay. Environ. Prog. Sustain. Energy 2021, 40, e13471. [Google Scholar] [CrossRef]
  32. Elamin, M.R.; Abdulkhair, B.Y.; Algethami, F.K.; Khezami, L. Linear and nonlinear investigations for the adsorption of paracetamol and metformin from water on acid-treated clay. Sci. Rep. 2021, 11, 13606. [Google Scholar] [CrossRef] [PubMed]
  33. Bátori, V.; Jabbari, M.; Srivastava, R.K.; Åkesson, D.; Lennartsson, P.R.; Zamani, A.; Taherzadeh, M.J. Synthesis and Characterization of Maleic Anhydride-grafted Orange Waste for Potential Use in Biocomposites. Bioresources 2018, 13, 4986–4997. [Google Scholar] [CrossRef]
  34. El-Naggar, N.E.A.; Hussein, M.H.; Shaaban-Dessuuki, S.A.; Dalal, S.R. Production, Extraction and Characterization of Chlorella Vulgaris Soluble Polysaccharides and their Applications in AgNPs Biosynthesis and Biostimulation of Plant Growth. Sci. Rep. 2020, 10, 3011. [Google Scholar] [CrossRef] [PubMed]
  35. Trilokesh, C.; Uppuluri, K.B. Isolation and Characterization of Cellulose Nanocrystals from Jackfruit Peel. Sci. Rep. 2019, 9, 16709. [Google Scholar] [CrossRef]
  36. Yu, J.X.; Chi, R.A.; He, Z.Y.; Qi, Y.F. Adsorption performances of cationic dyes from aqueous solution on pyromellitic dianhydride modified sugarcane bagasse. Sep. Sci. Technol. 2011, 46, 452–459. [Google Scholar] [CrossRef]
  37. Aziz, T.; Farid, A.; Haq, F.; Kiran, M.; Ullah, A.; Zhang, K.; Li, C.; Sun, H.; Ullah, R.; Ali, A.; et al. A review on the Modification of Cellulose and its Applications. Polymers 2022, 14, 3206. [Google Scholar] [CrossRef]
  38. Li, J.; Huang, Q.; Peng, Z. Adsorption of methylene blue by an antibacterial bio-sorbents from ligninsulfonate and tannin. J. Environ. Chem. Eng. 2024, 12, 111807. [Google Scholar] [CrossRef]
  39. Kang, L.; Mucci, M.; Lürling, M. Influence of Temperature and pH on Phosphate Removal Efficiency of Different Sorbents Used in Lake Restoration. Sci. Total Environ. 2022, 812, 151489. [Google Scholar] [CrossRef]
  40. Silva, F.; Nascimento, L.; Brito, M.; da Silva, K.; Paschoal Jr, W.; Fujiyama, R. Biosorption of Methylene Blue Dye Using Natural Biosorbents Made from Weeds. Materials 2019, 12, 2486. [Google Scholar] [CrossRef]
  41. Sorour, F.H.; Aboeleneen, N.M.; Abd El-Monem, N.M.; Ammar, Y.A.; Mansour, R.A. Removal of Malachite Green from Wastewater Using Date Seeds as Natural Adsorbent; Isotherms, Kinetics, Thermodynamic, and Batch Adsorption Process Design. Int. J. Phytoremediat. 2024, 26, 1321–1335. [Google Scholar] [CrossRef]
  42. Vasudevan, S.; Lakshmi, J.; Sozhan, G. Optimization of the process parameters for the removal of phosphate from drinking water by electrocoagulation. Desalination Water Treat. 2009, 12, 407–414. [Google Scholar] [CrossRef]
  43. You, X.; Zhou, R.; Zhu, Y.; Bu, D.; Cheng, D. Adsorption of dyes methyl violet and malachite green from aqueous solution on multi-step modified rice husk powder in single and binary systems: Characterization, adsorption behavior and physical interpretations. J. Environ. Chem. Eng. 2022, 430, 128445. [Google Scholar] [CrossRef] [PubMed]
  44. Kua, T.L.; Kooh, M.R.R.; Dahri, M.K.; Zaidi, N.A.H.M.; Lu, Y.; Lim, L.B.L. Aquatic plant, Ipomoea aquatica, as a potential low-cost adsorbent for the effective removal of toxic methyl violet 2B dye. Appl. Water Sci. 2020, 10, 243. [Google Scholar] [CrossRef]
  45. Salomón, Y.L.D.O.; Georgin, J.; Franco, D.S.; Netto, M.S.; Grassi, P.; Piccilli, D.G.; Dotto, G.L. Powdered biosorbent from pecan pericarp (Carya illinoensis) as an efficient material to uptake methyl violet 2B from effluents in batch and column operations. Adv. Powder Technol. 2020, 31, 2843–2852. [Google Scholar] [CrossRef]
  46. Torezan, L.; Bortoluz, J.; Guerra, N.B.; Ferrarini, F.; Bonetto, L.R.; da Silva Teixeira, C.; Carli, L.N. Magnetic chitosan microspheres for the removal of methyl violet 2B from aqueous solutions. J. Dispers. Sci. Technol. 2023, 44, 1170–1182. [Google Scholar] [CrossRef]
  47. Wu, T.; Yang, G.; Cao, J.; Xu, Z.; Jiang, X. Activation and adsorption mechanisms of methylene blue removal by porous biochar adsorbent derived from eggshell membrane. Chem. Eng. Res. Des. 2022, 188, 330–341. [Google Scholar] [CrossRef]
  48. Sen, T.K. Adsorptive removal of dye (methylene blue) organic pollutant from water by pine tree leaf biomass adsorbent. Processes 2023, 11, 1877. [Google Scholar] [CrossRef]
  49. Wei, W.; Shang, N.; Zhang, X.; Liu, W.; Zhang, T.; Wu, M. A green 3-step combined modification for the preparation of biomass sorbent from waste chestnut thorns shell to efficient removal of methylene blue. Bioresour. Technol. 2022, 360, 127593. [Google Scholar] [CrossRef]
  50. Yan, J.; Lan, G.; Qiu, H.; Chen, C.; Liu, Y.; Du, G.; Zhang, J. Adsorption of heavy metals and methylene blue from aqueous solution with citric acid modified peach stone. Sep. Sci. Technol. 2018, 53, 1678–1688. [Google Scholar] [CrossRef]
Figure 1. (a,b) EC SEM images and (c,d) MA-EC SEM images.
Processes 12 02290 g001
Figure 2. N2 adsorption–desorption isotherm.
Processes 12 02290 g002
Figure 3. EC and MA-EC infrared spectra.
Processes 12 02290 g003
Figure 4. XRD patterns of EC and MA-EC.
Processes 12 02290 g004
Figure 5. The high-resolution C 1s spectra of EC and MA-EC in XPS.
Processes 12 02290 g005
Figure 6. Thermogravimetric curves of (a) EC and (b) MA-EC.
Processes 12 02290 g006
Figure 7. Zeta potential curve of MA-EC and EC.
Processes 12 02290 g007
Figure 8. UV spectra of EC and MA-EC adsorbing (a) MB and (b) MV.
Processes 12 02290 g008
Figure 9. Adsorption capacity of MA-EC for MV and MB at different pH values.
Processes 12 02290 g009
Figure 10. (a) The effect of time on adsorption of MV and kinetic simulation; (b) the effect of time on adsorption of MB and kinetic simulation.
Processes 12 02290 g010
Figure 11. The adsorption capacity of MV (a) and MB (b) adsorbed by MA-EC at different concentrations and the fitting of the Langmuir model and Freundlich model.
Processes 12 02290 g011
Figure 12. The adsorption capacity and adsorption efficiency of MV and MB by MA-EC after four adsorption–desorption cycles.
Processes 12 02290 g012
Figure 13. (a,b) The adsorption capacity of MA-EC for MV and MB after four adsorption–desorption cycles.
Processes 12 02290 g013
Table 1. Related parameters of adsorption kinetics.
Kinetic ModelParameterMVMB
Qe-exp (mg/g)1484.60344.21
Nonlinear pseudo-first orderQe-cal (mg/g)1353.33315.659
k1 (1/min)0.350.31
R20.670.80
Nonlinear pseudo-second orderQe-cal (mg/g)1467.83339.39
k2 (g/mg/min)0.00040.0014
R20.890.95
Table 2. Adsorption isotherm parameters of MA-EC.
Isotherm ModelParameterMVMB
Freundlich: Qe = KF Ce1/nKF (mg/g)554.83154.54
bF6.856.30
R20.88600.8299
Langmuir: Qe = Qm KL Ce/(1 + KL Ce)Qm (mg/g)1309.12390.89
KL (L/mg)0.180.26
R20.93160.9355
Table 3. Comparison of adsorption capacity of MA-EC and other biomass adsorbents.
Adsorbing MaterialDyeQmax (mg/g)References
Multi-step modified rice huskMV530.94[43]
Ipomoea aquaticaMV267.90[44]
Carya illinoensisMV642.00[45]
Magnetic chitosan microspheresMV128.84[46]
MA-ECMV1360.73This work
Eggshell membraneMB110.38[47]
Pine Tree LeafMB36.88[48]
Chestnut thorn shellMB305.81[49]
Citric acid-modified peach stoneMB178.25[50]
MA-ECMB370.37This work
Disclaimer/Publisher’s Note: The statements, opinions and data contained in all publications are solely those of the individual author(s) and contributor(s) and not of MDPI and/or the editor(s). MDPI and/or the editor(s) disclaim responsibility for any injury to people or property resulting from any ideas, methods, instructions or products referred to in the content.

