Article

Determination of Hafnium in Zirconium by Spectrophotometry

1
Zhongyuan Critical Metals Laboratory, Zhengzhou University, Science Road 100, Zhengzhou 450001, China
2
School of Material Science and Engineering, Zhengzhou University, Science Road 100, Zhengzhou 450001, China
*
Authors to whom correspondence should be addressed.
Processes 2024, 12(10), 2286; https://doi.org/10.3390/pr12102286
Submission received: 18 September 2024 / Revised: 10 October 2024 / Accepted: 17 October 2024 / Published: 18 October 2024
(This article belongs to the Section Chemical Processes and Systems)

Abstract

:
Zirconium and hafnium have opposite nuclear properties and are used very differently in the nuclear industry. However, hafnium is a common metal impurity in zirconium, and the chemical properties of the two are very similar except for nuclear properties, and it is difficult to separate and detect them. At present, the detection of hafnium content in zirconium is usually achieved by using an inductively coupled plasma (ICP) spectrometer, but ICP equipment is expensive, and the detection cost is high. Therefore, it is necessary to develop a simple and low-cost method for the determination of hafnium content in zirconium. Based on this, this paper takes the spectrophotometric method as a starting point. Through a series of experiments on the influence of pH and concentrations of the color-developing agent xylenol orange sodium salt on the absorbance of zirconium and hafnium ions, the appropriate variables are selected to detect the content of hafnium in zirconium. Finally, according to the measured absorbance and total ion concentration, by comparing the working curve of zirconium and hafnium ions, the content of hafnium in zirconium is calculated based on the lever principle.

1. Introduction

In general, zirconium and hafnium coexist in nature. Due to its low thermal neutron capture cross-section, excellent corrosion resistance and excellent mechanical properties, zirconium has become an ideal structural material for nuclear reactors and nuclear fuel cladding materials [1]. In contrast to zirconium, hafnium, due to its high neutron capture cross-section, acts as a thermal neutron absorber for nuclear reactors, controlling the reactor reaction rate. Moreover, zirconium and hafnium belong to the same subgroup of elements and have similar outer electron junctions. Because of the lanthanide shrinkage effect, the electronic structure and physical and chemical properties of zirconium and hafnium are very similar, so it is very difficult to detect the content of hafnium in zirconium. In addition, the content of hafnium in zirconium materials used in nuclear reactors is required to be less than 0.01% [2], so the detection of the content of hafnium in zirconium is of great significance [3,4].
At present, although there are many studies on the chemical determination of the total amount and component of zirconium and hafnium, there are few accurate, simple, stable and pollution-free methods. In recent years, the methods for determining the content of hafnium in zirconium are gravimetry, complexometric titration, inductively coupled plasma mass spectrometry (ICP-MS) and X-ray fluorescence spectrometry (XRF) [4,5,6,7,8]. The procedure for the gravimetric method is complicated; the analysis time is long and the reagent is toxic. The complex determination method often produces systematic error, which is lower than the actual value. ICP-MS and XRF equipment is expensive [9]. At the same time, xylenol orange, chemically identified as 3, 3′-dimethyl-2, 2′-dihydroxy-5, 5′-bitoluidine-4, 4′-disulphonic acid disodium salt, is widely employed in analytical chemistry for its capacity to create colored complexes with specific metal ions, notably those within the lanthanide series. This property has made it a valuable tool in spectrophotometric analysis, allowing for the sensitive and accurate determination of lanthanides in various samples.
Research has demonstrated that the application of xylenol orange facilitates the development of a spectrophotometric method for detecting non-chelated europium ions in solution, as well as their removal from solutions containing the Eu-diethyltriamine pentaacetic acid (Eu-DTPA) peptide conjugate [10]. Subsequent investigations compared the efficacy of Empore chelating discs and Chelex 100 resin in selectively eliminating non-chelated europium ions from Eu-DTPA peptide conjugates, revealing that both methodologies effectively and selectively remove contaminated metal ions [11]. Furthermore, alizarin orange serves as an indicator for identifying free metal ions present within metal complexes during the preparation, purification, and characterization of lanthanide complexes utilized in magnetic resonance imaging (MRI) contrast agents [12]. In studies examining the recombination kinetics of DTPA with lanthanides in acidic aqueous environments, dye probe molecules such as alizarin orange were employed for exploration [13]. Collectively, these studies underscore the versatility and effectiveness of alizarin orange in detecting and addressing issues related to lanthanides, particularly europium ions. Based on the above analysis, this paper proposes a method for measuring the content of hafnium in zirconium by spectrophotometry [14,15,16]. The method calculates the content of hafnium in zirconium via the lever principle by detecting the light absorption intensity of the red complex formed by sodium xylenol orange salt and zirconium and hafnium ions in an acidic environment [15,17,18,19,20,21,22]. The method has the advantages of simple operation, low cost, high accuracy and easy popularization [23].

2. Experimental

2.1. Materials

The initial materials are zirconium standard solution with a mass concentration of 1 mg/mL, hafnium standard solution with a mass concentration of 1 mg/mL, solid sodium xylenol orange salt (AR), hydrochloric acid (AR) and ascorbic acid (AR), and no further purification is required. They were all purchased from Shanghai McLean Biochemical Technology Co., Ltd., Shanghai, China. The corresponding concentration of the above materials is configured as follows: 1 mL of zirconium standard solution was measured in a volumetric bottle of 100 mL, and the concentration of zirconium ion solution is 0.01 mg/mL. The hafnium ion solution with a concentration of 0.01 mg/mL was prepared by the same method. Then, 0.20 g of sodium xylenol orange was weighed and placed in a volumetric bottle, with the addition of deionized water to increase the volume to 100 mL to obtain 2 g/L sodium xylenol orange salt solution (indicator); 1 g of ascorbic acid was weighed to obtain 10 mg/mL of ascorbic acid solution by following the above steps.

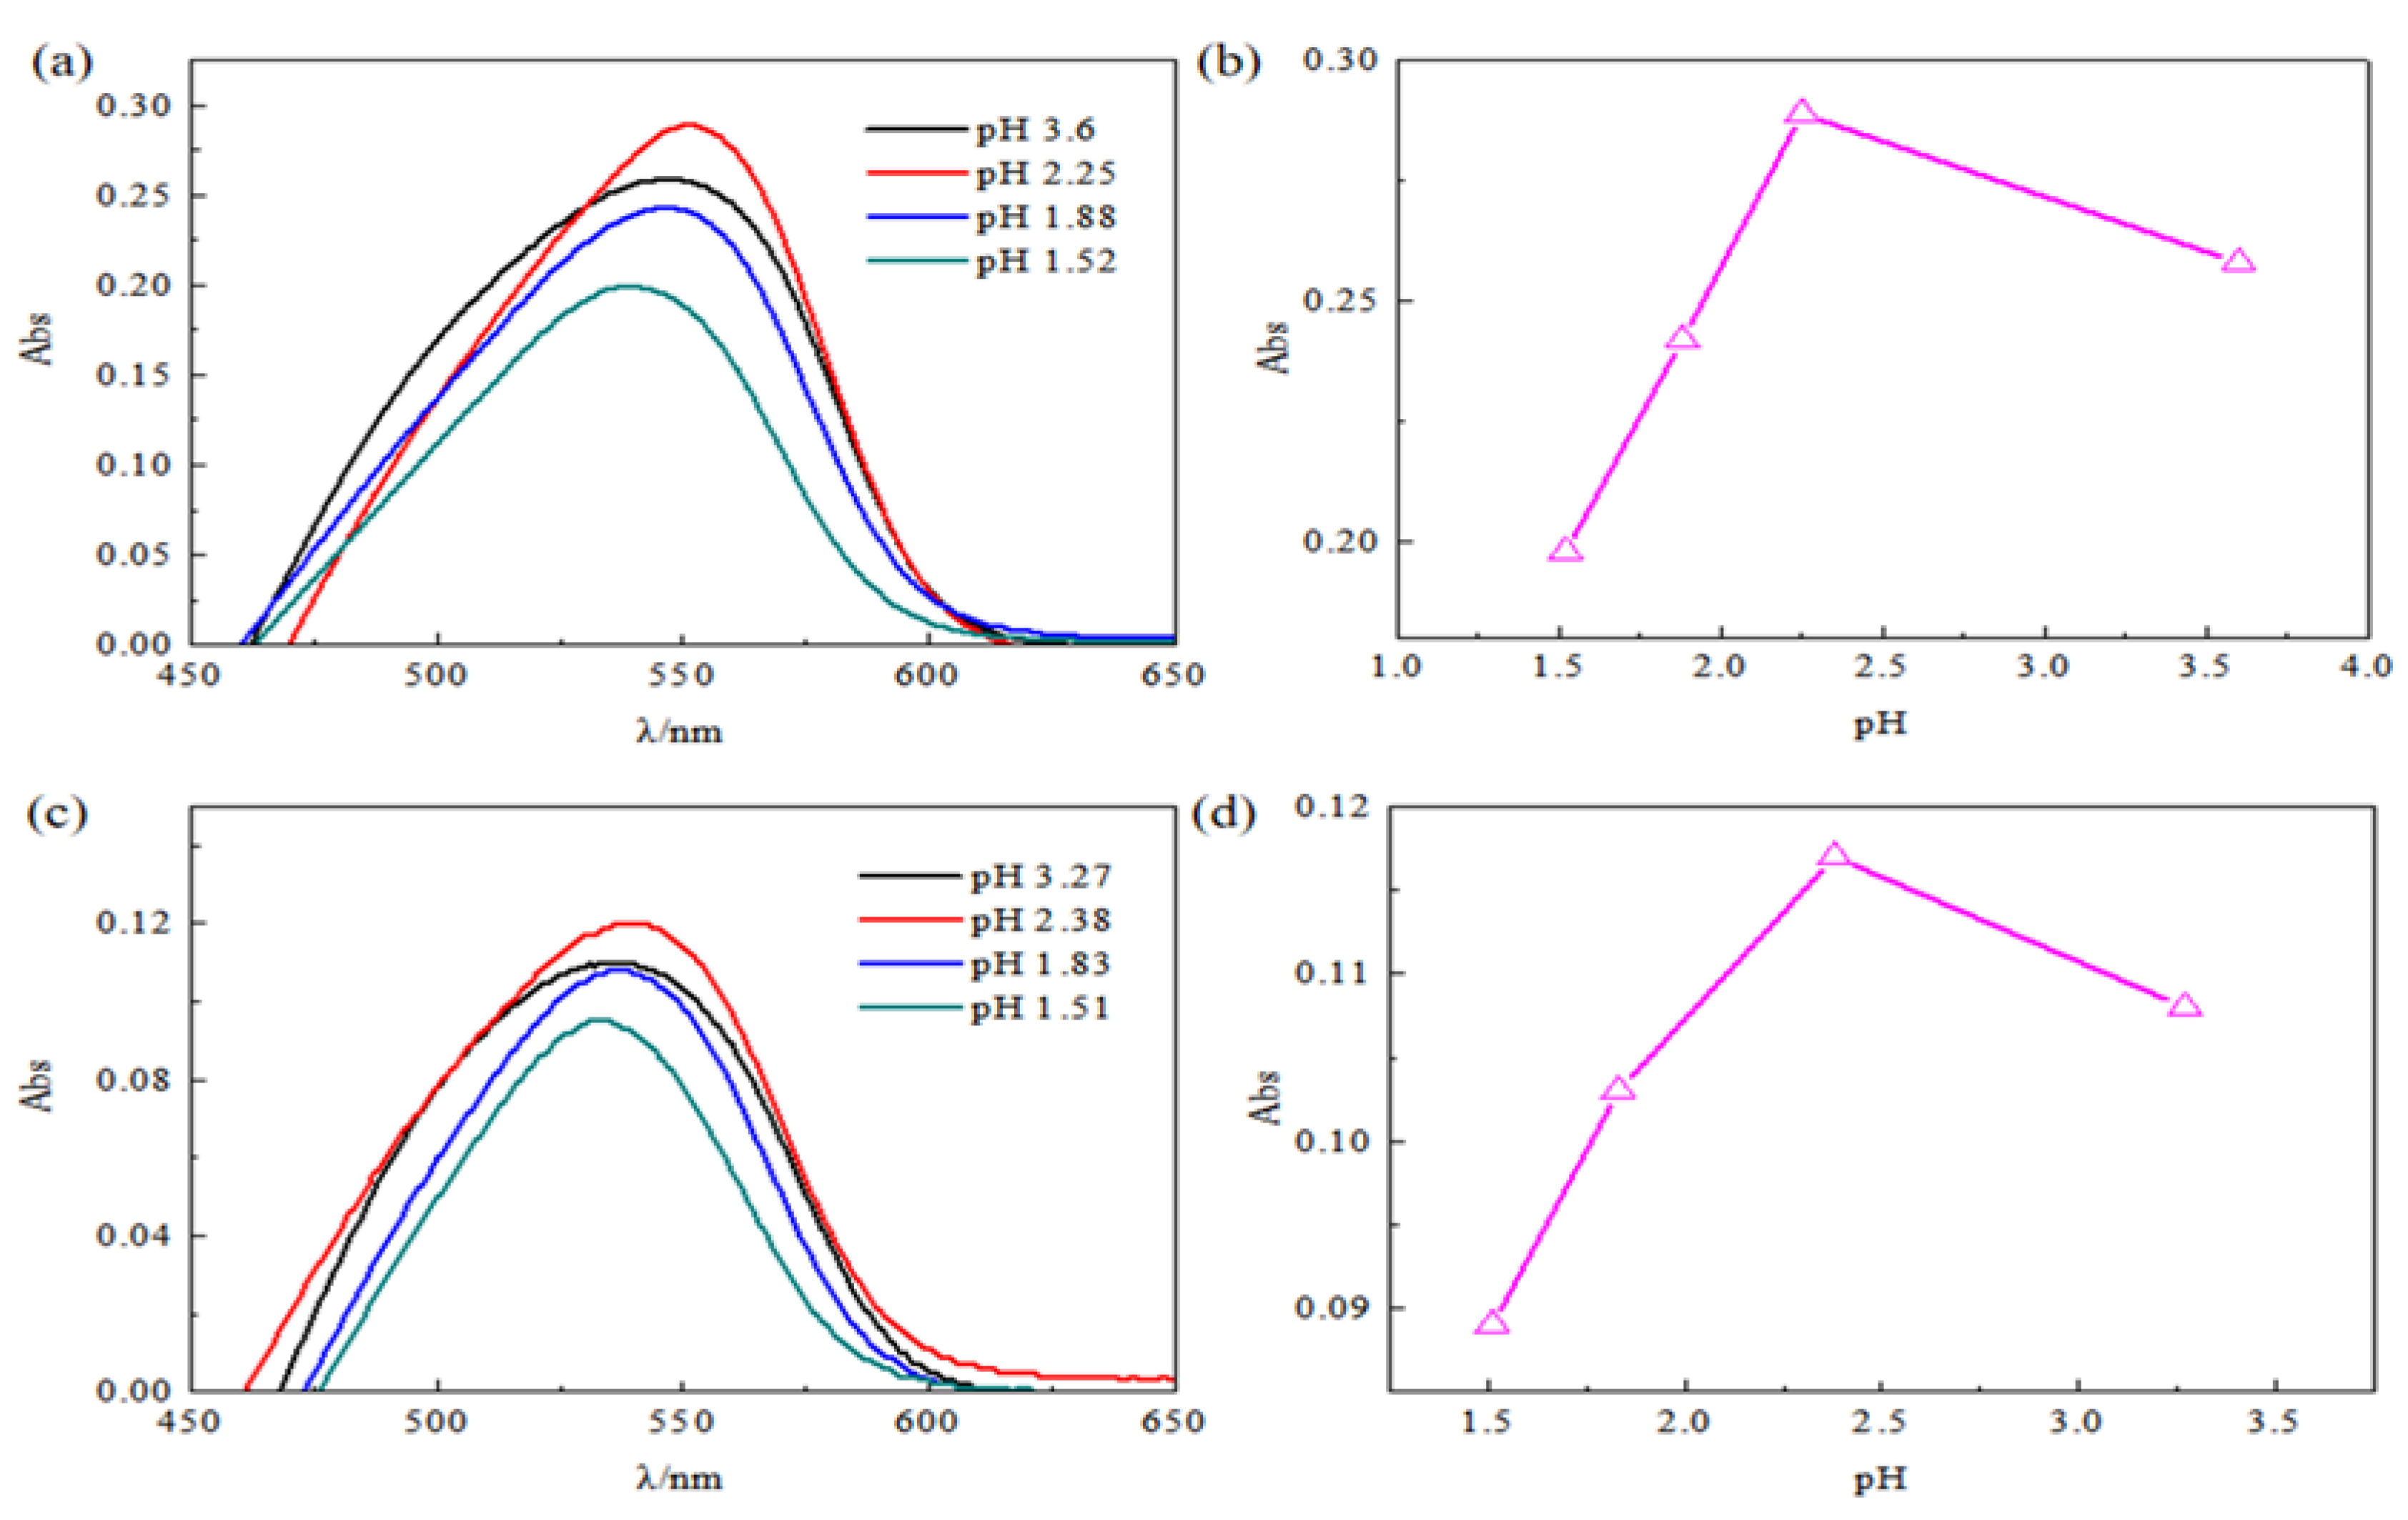
2.2. The Influence of pH on Absorbance

One drop, 0.5 mL, 2 mL and 5 mL of hydrochloric acid were absorbed into 50 mL volumetric bottles with a pipette, and 1 mL of sodium xylenol orange salt solution, 2 mL of ascorbic acid solution and 4 mL of zirconium ion solution were added to the volumetric bottle successively, and then the volumetric bottles were filled with deionized water. A pH meter (METTLER TOLEDO, Zurich, Switzerland) was used to measure the pH value of each solution in turn. Finally, the absorbance was measured in a 1 cm × 1 cm colorimetric dish (cuvette). Following the same steps described above, the effect of pH on the absorbance of hafnium ions can also be studied.

2.3. The Influence of Indicator Content on Absorbance

0.5 mL, 1 mL, 2 mL and 4 mL indicators were added into 50 mL volumetric bottles with a pipette, followed by 0.5 mL hydrochloric acid, 2 mL ascorbic acid and 4 mL zirconium ion solution, and then the volume was filled with deionized water. Finally, the absorbance was measured in a 1 cm × 1 cm colorimetric dish (cuvette). Following the same steps described above, the effect of indicator content on the absorbance of hafnium ions can also be studied.

2.4. Work Curves of Zirconium and Hafnium Ions

The zirconium solution of 0 mL, 2 mL, 4 mL, 6 mL, 8 mL and 10 mL were added into 50 mL volumetric bottles with a pipette, followed by 1 mL indicator, 2 mL ascorbic acid and 0.5 mL hydrochloric acid, and the volume was filled with deionized water. Finally, the absorbance was measured in a 1 cm × 1 cm colorimetric dish (cuvette), and the working curve of zirconium ion was obtained. Following the same steps as above, the working curve of hafnium ions can be obtained.

2.5. Zirconium and Hafnium Ion Component Determination

The measurement principle is as follows: when the total amount of zirconium and hafnium ions in the solution remains unchanged, it is assumed that all the ions to be measured in the solution are zirconium ions, and the measured content is located on the working curve of zirconium ions. Assuming that the solution contains all hafnium ions, the measured content is located on the working curve of hafnium ions. If the solution contains both zirconium ions and hafnium ions, the measured content is located in the middle of the working curve of zirconium and hafnium ions, which can be determined by the lever theorem. More suitable pH and concentration of xylenol orange sodium salt were obtained through the above experiments. In order to verify the accuracy of the method, different concentrations of solution were tested in this experiment. 4 mL, 3 mL, 2 mL, 1 mL and 0 mL zirconium ion solutions were absorbed into a 50 mL volumetric bottle with a pipette, and then 0 mL, 1 mL, 2 mL, 3 mL and 4 mL hafnium ion solutions were absorbed into the same 50 mL volumetric bottle with 1 mL indicator added successively. The 2 mL ascorbic acid, 0.5 mL hydrochloric acid solution was suspended in deionized water. Finally, the absorbance was measured in a 1 cm × 1 cm colorimetric dish.

3. Results and Discussion

3.1. Effect of pH

The absorption curves of zirconium ion and hafnium ion measured at different pH are shown in Figure 1. The maximum absorption intensity of zirconium and hafnium ions is around 550 nm, and the maximum value varies with pH. When pH is low, the maximum absorption intensity is low. The maximum absorption intensity increases with increasing pH until a maximum value, and then decreases with increasing pH. In zirconium ion solution, when the pH increases from 1.52 to 2.25, due to the high stability of ZrXO, the total amount and absorption intensity of ZrXO are not affected. When pH is 3.6, the complex has an unstable tendency, and may decompose rapidly, resulting in a decrease in absorbance [24,25,26]. The maximum absorption strength of hafnium ion has the same trend as that of zirconium ion. Therefore, pH levels need to be consistent when testing. It can be seen from the absorption curve that when the zirconium and hafnium components are measured in this experiment, the pH of 2.38 has a better effect.

3.2. The Influence of Indicator Content

The absorption curves of zirconium ion and hafnium ion measured under different sodium xylenol orange contents are shown in Figure 2. In zirconium ion solution, when the mass concentration of the indicator is 20 mg/L and 40 mg/L, the absorbance graph is a parabola, and the maximum absorbance is around 500 nm. When the indicator content reaches 80 mg/L, the absorption curve changes obviously, the maximum absorption intensity shifts to a small wavelength range, and the peak disappears, which is unfavorable to the collection of the maximum absorption intensity. In the hafnium ion solution, the absorption curve has the same trend. In the process of formulating the working curve of this experiment, the indicator content was set to 40 mg/L.

3.3. Working Curve Drawing and Determination of Hafnium

Based on the above analysis, the absorption spectra of zirconium and hafnium ions were determined at a pH of 2.38 and a sodium xylenol orange content of 40 mg/L. As shown in Figure 3, the absorbance of zirconium and hafnium ions with the same mass concentration is different, and zirconium ions are significantly higher than hafnium ions. The reason for this phenomenon is that the relative atomic mass of zirconium ion is smaller than that of hafnium ion. Therefore, the molar concentrations of zirconium and hafnium ions with the same mass concentration are different, resulting in different light absorption intensities.
The working curves of zirconium and hafnium ions are drawn in the same coordinate system, as shown in Figure 4a. The fitting degree of zirconium ion working curve is 0.99987, and the corresponding formula is y = 0.337x. The fitting degree of the working curve of hafnium ion is 0.99914, and the corresponding formula is y = 0.145x. When the total amount of zirconium and hafnium ions in the solution remains unchanged, it is assumed that the ions to be tested in the solution are all zirconium ions, and the measured content is located on the working curve of zirconium ions. Assuming that the ions to be tested are all hafnium ions, the measured content is located on the hafnium ion working curve. If the solution contains both zirconium ions and hafnium ions, the measured content is located in the middle of the zirconium and hafnium ion working curve, which can be determined by leverage theorem (Figure 4b). In order to verify the accuracy of the method, different solutions were tested when the total concentration of zirconium ion and hafnium ion was 0.8 mg/L, and the concentration was compared with that of the actual prepared solution., as shown in Table 1. The calculated hafnium content is less different from the actual hafnium content, within 5%. The facile method can be applied to the determination of hafnium content in zirconium.

4. Conclusions

In conclusion, the pH value of the solution should be strictly controlled when measuring and it has a great influence on the absorbance of zirconium and hafnium. Besides, the concentration of xylenol orange sodium indicator plays a crucial role in determining the absorption spectrum. An excessively high concentration can lead to the disappearance of the absorption peak, thereby influencing the overall absorption intensity. Therefore, the content of hafnium in zirconium can be measured by the lever principle, and the operation is simple with high accuracy.

Author Contributions

Methodology, S.L. and J.S.; Software, Z.L.; Formal analysis, X.J. and X.L.; Resources, Z.L.; Data curation, X.J. and X.L.; Writing—original draft, X.J.; Writing—review & editing, S.L. and J.S.; Funding acquisition, S.L. and J.S. All authors have read and agreed to the published version of the manuscript.

Funding

This work was financially supported by the National Natural Science Foundation of China (No. 52274356), Youth Science and Technology Innovation of Henan Province (No. 23HASTIT009), and the Projects of Zhongyuan Critical Metals Laboratory (No. GJJSGFJQ202302, GJJSGFYQ202425). The work was also supported by the China Postdoctoral Science Foundation (No. 2023TQ0324).

Data Availability Statement

The original contributions presented in the study are included in the article, further inquiries can be directed to the corresponding authors.

Conflicts of Interest

The authors declare no conflict of interest.

References

  1. Fan, J.; Duan, L.; Wang, Y.; Zhai, X.; Chen, G.; Yu, G. Preparation of DMHMP Levextrel resin and separation of zirconium and hafnium by extraction chromatography in HNO3-HCl mixture. Colloids Surf. Physicochem. Eng. Asp. 2022, 638, 128216. [Google Scholar] [CrossRef]
  2. Qin, W.; Han, X.; Wang, J.; Wang, X.; Zhang, J. Selectivity of novel PAMAM dendrimers modified with salicylaldehyde and their extraction/separation performance on Zr(Ⅳ) and Hf(Ⅳ). J. Mol. Struct. 2023, 1276, 134817. [Google Scholar] [CrossRef]
  3. Yadollahi, A.; Saberyan, K.; Torab-Mostaedi, M.; Charkhi, A.; Pourjavid, M.R. Solvent extraction separation of zirconium and hafnium from nitric acid solutions using mixture of Cyanex-272 and TBP. Radiochim. Acta 2018, 106, 675–684. [Google Scholar] [CrossRef]
  4. Kozma, K.; Zakharov, L.N.; Nyman, M. Countercation-controlled nuclearity of Zr/Hf peroxo oxalates. Cryst. Growth Des. 2020, 20, 6519–6527. [Google Scholar] [CrossRef]
  5. Luther, L.C.; Kometani, T.Y. Chemical Analysis of Bi-containing magnetic bubble garnet films. J. Am. Ceram. Soc. 1983, 66, 619–622. [Google Scholar] [CrossRef]
  6. Kamilari, E.; Farsalinos, K.; Poulas, K.; Kontoyannis, C.G.; Orkoula, M.G. Detection and quantitative determination of heavy metals in electronic cigarette refill liquids using total reflection X-Ray fluorescence spectrometry. Food Chem. Toxicol. 2018, 116, 233–237. [Google Scholar] [CrossRef]
  7. Płotka-Wasylka, J.; Frankowski, M.; Simeonov, V.; Polkowska, Ż.; Namieśnik, J. Determination of metals content in wine samples by inductively coupled plasma-mass spectrometry. Molecules 2018, 23, 2886. [Google Scholar] [CrossRef]
  8. Majeed, A.; Khan, M.S.; Ballantyne, E.K. Spectrophotometric Determination of Zirconium in Steels with Xylenol Orange. Anal. Chim. Acta 1987, 192, 125–128. [Google Scholar] [CrossRef]
  9. Liu, Y.X.; Li, Q.X.; Ma, N.; Sun, X.L.; Bai, J.F.; Zhang, Q. Application of the Zr/Hf ratio in the determination of hafnium in geochemical samples by high-resolution inductively coupled plasma mass spectrometry. Anal. Chem. 2014, 86, 11570–11577. [Google Scholar] [CrossRef]
  10. Lu, L.; Shao, X.; Lin, X.; Ding, L.; Song, B.; Sun, J. Tb3+-xylenol orange complex-based colorimetric and luminometric dual-readout sensing platform for dipicolinic acid and metal ions. Chin. Chem. Lett. 2023, 34, 107203. [Google Scholar] [CrossRef]
  11. Dayan Elshan, N.G.R.; Patek, R.; Vagner, J.; Mash, E.A. Spectrophotometric determination and removal of unchelated europium ions from solutions containing Eu-Diethylenetriaminepentaacetic acid chelate-peptide conjugates. Anal. Biochem. 2014, 464, 24–29. [Google Scholar] [CrossRef] [PubMed]
  12. Averill, D.J.; Garcia, J.; Siriwardena-Mahanama, B.N.; Vithanarachchi, S.M.; Allen, M.J. Preparation, purification, and characterization of lanthanide complexes for use as contrast agents for magnetic resonance imaging. J. Vis. Exp. JoVE 2011, 53, 2844. [Google Scholar]
  13. Larsson, K.; Cullen, T.D.; Mezyk, S.P.; McDowell, R.G.; Martin, L.R. Complications in complexation kinetics for lanthanides with DTPA using dye probe molecules in aqueous solution. RSC Adv. 2017, 7, 26507–26512. [Google Scholar] [CrossRef]
  14. Hafez, M.A.H. Study of the chromogenic reactions of semi-Xylenol Orange with rare earths and thorium. Anal. Lett. 1992, 25, 1779–1796. [Google Scholar] [CrossRef]
  15. Munshi, K.N.; Dey, A.K. Absorptiometric study of the chelates formed between the lanthanoids and xylenol orange. Microchim. Acta 1968, 56, 1059–1065. [Google Scholar] [CrossRef]
  16. Havel, J. Spectrophotometric determination of rare earth elements by flow injection analysis based on their reaction with xylenol orange and cetylpyridinium bromide. Talanta 1994, 41, 1251–1254. [Google Scholar] [CrossRef]
  17. Liosi, G.M.; Dondi, D.; Vander Griend, D.A.; Lazzaroni, S.; D’Agostino, G.; Mariani, M. Fricke-gel dosimeter: Overview of xylenol orange chemical behavior. Radiat. Phys. Chem. 2017, 140, 74–77. [Google Scholar] [CrossRef]
  18. Sato, H.; Yokoyama, Y.; Momoki, K. Chelate formation of zirconium with xylenol orange and semi-xylenol orange. Anal. Chim. Acta 1978, 99, 167–175. [Google Scholar] [CrossRef]
  19. Hurst, F.J. Separation of hafnium from zirconium in sulfuric acid solutions using pressurized ion exchange. Hydrometallurgy 1983, 10, 1–10. [Google Scholar] [CrossRef]
  20. Chen, S.; Zhang, Z.; Kuang, S.; Li, Y.; Huang, X.; Liao, W. Separation of zirconium from hafnium in sulfate medium using solvent extraction with a new reagent BEAP. Hydrometallurgy 2017, 169, 607–611. [Google Scholar] [CrossRef]
  21. Challis, H.J.G. Separate and simultaneous determination of zirconium and hafnium in nickel-base alloys with xylenol orange. Analyst 1969, 94, 94. [Google Scholar] [CrossRef]
  22. Mori, I.; Fujita, Y.; Fujita, K.; Nakahashi, Y.; Kishida, Y. Xylenol orange, zirconium(IV) and fluoride color reaction in mixed micelles of N-hexadecylpyridinium chloride and Brij 35, and its analytical application. Anal. Lett. 1988, 21, 563–581. [Google Scholar] [CrossRef]
  23. Miyachi, K.; Kurokawa, H.; Moriyama, K.; Morimoto, S.; Tabuse, K.; Asano, M.; Yamaguchi, T.; Fujita, Y. Spectrophotometric determination of micro amounts of albumin using zirconium(IV) and xylenol orange. Chem. Lett. 2012, 41, 58–59. [Google Scholar] [CrossRef]
  24. Amaral, J.C.B.S.; Morais, C.A. Equilibrium of zirconium and hafnium in the process of extraction with TBP in nitric medium–influence in the Zr/Hf separation. Miner. Eng. 2020, 146, 106138. [Google Scholar] [CrossRef]
  25. Das, A.; Chandrakumar, K.R.S.; Paul, B.; Chopade, S.M.; Majumdar, S.; Singh, A.K.; Kain, V. Enhanced adsorption and separation of zirconium and hafnium under mild conditions by phosphoric acid based ligand functionalized silica gels: Insights from experimental and theoretical investigations. Sep. Purif. Technol. 2020, 239, 116518. [Google Scholar] [CrossRef]
  26. Cheng, K.L. Determination of zirconium and hafnium with xylenol orange and methylthymol blue. Anal. Chim. Acta 1963, 28, 41–53. [Google Scholar] [CrossRef]
Figure 1. Effect of pH on absorption curve (a) Zirconium ion absorption curve; (b) The maximum absorption strength of zirconium ion at different pH values; (c) Hafnium ion absorption curve; (d) Maximum absorption strength of hafnium ion at different pH values.
Processes 12 02286 g001
Figure 2. Influence of xylenol orange indicator content on absorption curve (a) Zirconium ion; (b) Hafnium ions.
Processes 12 02286 g002
Figure 3. Absorption spectra and prepared reagents (a) Absorption curves of zirconium ions with different concentrations; (b) Absorption curves of hafnium ions at different concentrations.
Processes 12 02286 g003
Figure 4. Detection of hafnium content (a) Working curves of zirconium and hafnium ions; (b) Absorption strength at different hafnium and zirconium ion ratios at a total concentration of 0.8 mg/L.
Processes 12 02286 g004
Table 1. Calculated values and errors of zirconium and hafnium components.
Concentration
Zr/Hf (mg/L)
Absorbance
Abs
Calculated Concentration
Zr/Hf (mg/L)
Hafnium Concentration Error
0.6/0.20.2310.59/0.215%
0.4/0.40.1940.3999/0.40010.025%
0.2/0.60.1520.184/0.6162.67%
Disclaimer/Publisher’s Note: The statements, opinions and data contained in all publications are solely those of the individual author(s) and contributor(s) and not of MDPI and/or the editor(s). MDPI and/or the editor(s) disclaim responsibility for any injury to people or property resulting from any ideas, methods, instructions or products referred to in the content.

