Abstract
Accurate and reliable state of health (SOH) estimation is extremely crucial for the safe and stable operation of lithium-ion batteries (LIBs). In this paper, a method based on Lévy roulette- and fitness-distance balance-enhanced coyote optimization algorithm-optimized long short-term memory (LRFDBCOA-LSTM) is employed for SOH estimation of LIB. Firstly, six health features are extracted from battery charging and discharging data, and Savitzky–Golay is used to filter the feature data to improve correlation between feature and SOH. Then, Lévy roulette and fitness-distance balance (FDB) strategies are used to improve the coyote optimization algorithm (COA), i.e., LRFDBCOA. Meanwhile, the improved algorithm is used to optimize the internal parameters of long short-term memory (LSTM) neural network. Finally, the effectiveness of the proposed model is comprehensively validated using five evaluation indicators based on battery data obtained under three different testing conditions. The experimental results manifest that after algorithm improvement and network parameter optimization, the performance of the model is significantly improved. In addition, the method has high estimation accuracy, strong generalization, and strong robustness for SOH estimation with a maximum R2 of 0.9896 and minimum R2 of no less than 0.9711.
1. Introduction
Due to the increasing depletion of fossil fuels such as oil, coal, and natural gas [1,2], as well as significant progress in global science and technology, and the gradual popularization of green environmental protection [3,4] and low-carbon energy-saving concepts [5,6], electric vehicles (EVs), of which the power battery is the core component [7,8], have been vigorously promoted and developed rapidly. Lithium-ion batteries (LIBs) are widely applied as the power battery for EVs because of their high energy density, high power density, long cycle life, low self-discharge rate, and high output voltage [9,10]. During the operation of LIBs, the battery management system (BMS) plays a key role in monitoring and protecting the battery. Thereinto, accurate estimation of battery health status is one of the pivotal functions of a BMS [11]. State of health (SOH) is an important indicator for measuring the ratio of current performance to initial performance of a battery and is crucial for battery-based electric mobility technology. The SOH of batteries affects the endurance and safety of electric vehicles. Accurately monitoring SOH can help prevent accidental failures, extend battery life, enhance the user experience, and promote the sustainable development of electric mobility technology. Also, SOH characterizes the aging of a battery, from which an estimation is used to predict the remaining charge and discharge cycle of batteries. Consequently, accurate SOH estimation is of remarkable significance for the healthy and stable operation of subsequent LIBs.
On the one hand, SOH estimation is a tough task on account of the complex electrochemical characteristics and highly dynamic and nonlinear characteristics inside LIBs [12]. On the other hand, unlike easily measurable parameters, e.g., voltage and current, the parameters that characterize SOH cannot be directly measured by sensors, which increases the complexity of estimation research [13]. So far, the mainstream SOH estimation methods are primarily divided into three categories: the direct measurement method, model-based method, and data-driven method. The decrease in SOH caused by aging is manifested as an increase in battery internal resistance and a decrease in the battery’s remaining available capacity. The direct measurement method estimates SOH by measuring the remaining available capacity and internal resistance of the battery, in which the coulomb counting and ampere hour methods are frequently used for capacity measurement, while the hybrid pulse power characteristic method is commonly used for internal resistance measurement [14]. The strongpoint of the direct measurement method is that it is easy to operate, but the disadvantage is that it is hard to estimate online and the measurement error is large. The model-based method requires the establishment of a precise equivalent circuit model or electrochemical model for LIB through parameter identification research. However, its drawback is that the internal mechanism of LIB is very complex, and modeling is very difficult [15]. Overall, the data-driven method is extensively used on account of high accuracy, strong generalization, and strong robustness [16]. The method does not need to take into account the internal reaction mechanism of the battery but only needs to establish a nonlinear mapping between the health characteristics and SOH to achieve estimation. The classification and characteristics of the three estimation methods are shown in Table 1.

Table 1.
Comparison of three SOH estimation methods.
Reference [17] utilized an incremental capacity curve and a back-propagation (BP) neural network to achieve SOH estimation. Specifically, SOH estimation was implemented based on studying the changes in incremental capacity under different environmental temperatures and extracting relevant health features. Due to the significant influence of internal weights and thresholds on the performance of the BP neural network, Reference [18] proposed a genetic algorithm-optimized BP estimation model. Because of the highly random length of LIB cycle test data, the final SOH estimation accuracy is improved by extracting health features within a fixed feature voltage range and optimizing weights and thresholds of the network. In addition, Reference [19] adopted principal component analysis to actualize data dimensionality reduction in the model input and make use of particle swarm optimization to optimize the parameters of the BP neural network. The results attested that after data processing and parameter optimization, the accuracy of SOH estimation was effectively improved while the computational complexity of BP was reduced. In Reference [20], based on the energy characteristics of constant current (CC), constant voltage (CV) charging stages, and equal discharge voltage intervals, Gaussian process regression was applied to estimate SOH under three types of battery datasets. The results showed that the proposed model had high prediction accuracy on different datasets and demonstrated its good generalization ability. Moreover, Reference [21] proposed an estimation method based on improved ant lion optimization (IALO) and support vector regression (SVR), which optimizes the kernel parameters of SVR using IALO and selects four relevant health features as model inputs. The experiment’s results demonstrate that compared to SVR and ant lion optimization algorithm–SVR methods, IALO-SVR has better accuracy and robustness. In Reference [22], the genetic algorithm was used to improve a least squares support vector machine and combine the extracted CC charging time, CV charging capacity, and average CV charging temperature data to estimate the battery’s SOH. Compared to the aforementioned BP neural network and SVR, long short-term memory (LSTM) has the long-term data memory function. In Reference [23], LSTM with a deep learning mechanism method of SOH estimation is proposed, which uses voltage, current, and temperature data in charge and discharge scenarios to establish a mapping relationship between health features and SOH. To improve the performance of the LSTM, Reference [24] made use of fine-tuning transfer learning to estimate SOH.
In summary, the data-driven method relies on accurate selection and extraction of health features, as well as reasonable model parameter settings. However, the majority of current research papers merely innovate on data-driven approaches without considering the impact of noise on data. Consequently, this paper introduces a filtering method to denoise the collected data, thereby minimizing the influence of noise on experimental results. By focusing on this overlooked aspect, our study offers a more refined and reliable approach to data analysis. Therefore, this work proposes an estimation method of SOH based on Savitzky–Golay filter and Lévy roulette- and fitness-distance balance-enhanced coyote optimization algorithm-optimized long short-term memory (LRFDBCOA-LSTM), of which the contributions are summarized:
- Extraction of six health features: based on NASA battery charging and discharging data, the average discharge voltage, CC charging time, ratio of CC charging time to total charge time, CV charging time, ratio of CV charging time to total charge time, and equal voltage drop time are extracted;
- Savitzky–Golay is used to filter the extracted health features, it is demonstrated through correlation analysis that the filtering process improves the correlation between the extracted health features and SOH;
- By improving coyote optimization algorithm (COA) using Lévy routing strategy and fitness-distance balance (FDB) strategy, i.e., LRFDBCOA. Based on the improved algorithm, the parameters of LSTM network are optimized and SOH estimation is performed. Verification of battery datasets under three different testing conditions: SOH estimation research is conducted on the battery datasets obtained under three different testing conditions, and the results illustrate that the proposed model has high estimation accuracy, strong robustness, and strong generalization ability.
2. Battery Dataset Analysis and Feature Extraction
2.1. Definition of SOH
SOH reflects the degree of battery performance degradation. As the number of cycles increases, the performance of LIBs gradually deteriorates, and the available capacity of the battery also decreases. The capacity can accurately respond current aging level of battery. Therefore, capacity is used to define SOH [25], as follows:
where represents the current available capacity, (Ah); represents the initial available capacity, (Ah).
2.2. Description of the Battery Dataset
The aging experimental data of LIBs used for SOH estimation in this work is obtained from NASA Ames Research Center, which includes multiple cyclic charge and discharge test data of 18,650 LIBs [26]. The data detailed the measured battery voltage, current, temperature, and corresponding measurement time during the cycling process, as well as the measured battery capacity after each cycle.
The cyclic aging experiment first makes the battery voltage reach charging cut-off voltage in CC charging mode, and then continues to charge in CV charging mode until the charging current drops to 20 mA before completing the charging test. The discharge test is conducted in CC discharge mode until the discharge cut-off voltage of the battery is reached. This study used batteries B0005, B0006, and B0007 as the research objects, and the fundamental specifications and experimental conditions of each battery are shown in Table 2. The variation in battery capacity with the number of cycles is shown in Figure 1, which indicates that as the number of cycles increases, the LIB’s capacity of will gradually decrease. In addition, if the discharge cut-off voltage is too small, it will accelerate the aging rate of the battery. Therefore, it is significant to control the discharge voltage of LIB reasonably to avoid the occurrence of over-discharge phenomenon for the healthy operation during the actual operation.
Table 2.
Battery specific parameters.
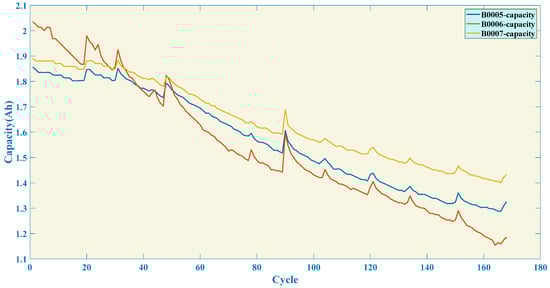
Figure 1.
The capacity degradation curve of three batteries in NASA dataset.
2.3. Health Feature Extraction and Correlation Analysis
The external output characteristics can intuitively reflect the internal characteristics of the battery so that relevant health features can be extracted from the aforementioned battery charging and discharging cycle data. Taking battery B0005 as an example, Figure 2a,b, respectively, represent the charging voltage and discharging voltage curves. It can be observed that as the number of cycles increases, CC charging duration of LIB continuously shortens while CV charging duration continuously increases, accompanied by a continuous decrease in discharge duration. Based on the analysis of charge–discharge curves, extract the following seven health features: F1: average discharge voltage; F2: total charging time; F3: CC mode charging duration; F4: CC time/total charging time; F5: CV mode charging duration; F6: CV time/total charging time; F7: equal voltage drop time.
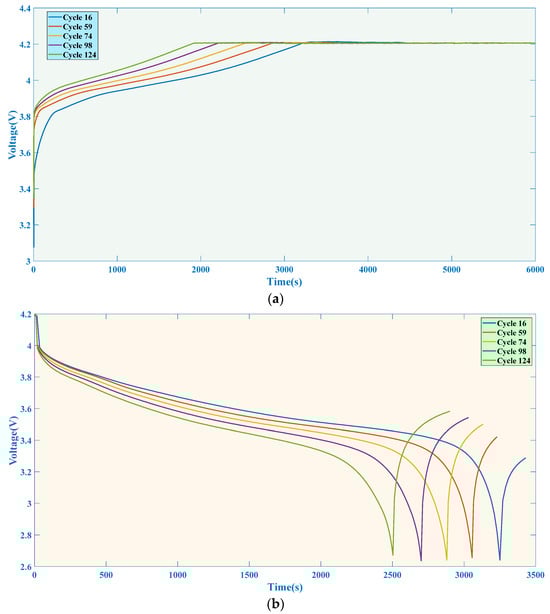
Figure 2.
Charging and discharging curves of battery: (a) charging voltage curve and (b) discharging voltage curve.
To quantificationally analyze the correlation between the extracted features and SOH, Pearson correlation and Spearman correlation are employed for analysis, as follows [27]:
where represents expectation; and represent two datasets for correlation comparison; and represent the average values of two datasets. The closer the absolute value calculated by the two correlation coefficients is to 1, the higher the correlation between the two datasets and the more ideal the mapping relationship.
The results of correlation analysis on battery health characteristics are shown in Table 3, Table 4 and Table 5. From the results in the tables above, the two features of CV mode charging duration and CV time/total charging time are negatively correlated with SOH. In the seven health features, the correlation between battery total charging time and SOH is low, while the other six characteristics have very high correlation. After correlation analysis, the final selected six features are as follows: M1: average discharge voltage; M2: CC mode charging duration; M3: CC time/total charging time; M4: CV mode charging duration; M5: CV time/total charging time; M6: equal voltage drop time.
Table 3.
Correlation between features and SOH of B0005 battery.
Table 4.
Correlation between features and SOH of B0006 battery.
Table 5.
Correlation between features and SOH of B0007 battery.
2.4. Feature Processing Based on Savitzky–Golay Filter
Due to the limitations of internal factors in batteries, measurement accuracy of voltage and current sensors, and external factors such as testing environment, there is a large quantity of outlier data in the extracted health features, which can lead to errors in SOH estimation. To eliminate the adverse effects of noise data, the Savitzky–Golay filter method is applied to filter the extracted six types of features [28]; it is a filtering method based on local polynomials that uses moving windows for least squares fitting, and the principle is as follows:
Firstly, randomly setting as the origin point, take from the original data m sample points on the left and right sides, that is, construct a window size containing . When fitting data using kth-order polynomials, which is as follows [29]:
where represents the coefficient of a polynomial.
Through the above polynomial, a k-linear equation system consisting of equations can be obtained, as follows:
where denotes the input value; indicates the output value. The least squares solution vector of as follows:
After filtering, the data output value is
In the model, the value of is 5; the value of is 3; is the transpose matrix of .
Savitzky–Golay can largely preserve the information of the original data, while also having the benefit of relatively small computational complexity. The results of the feature data before and after filtering are shown in Figure 3. After using Savitzky–Golay method, the feature data curve obtained is significantly smoother. To further quantify the benefits of filtering processing, correlation analysis is conducted on the feature data again. The correlation between the feature data of the three types of batteries and SOH is shown in Table 6, Table 7 and Table 8.
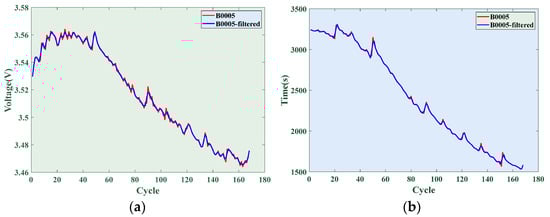
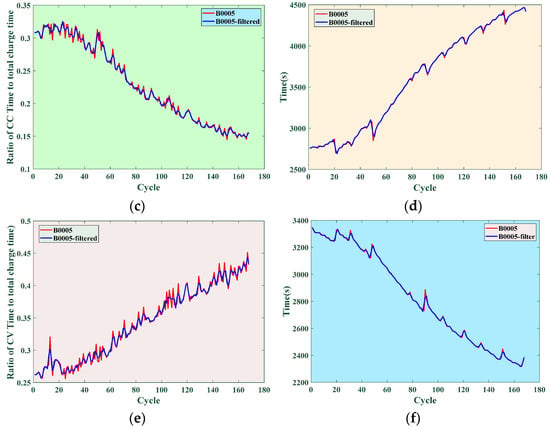
Figure 3.
Characteristic curves before and after filtering: (a) M1; (b) M2; (c) M3; (d) M4; (e) M5; (f) M6.
Table 6.
Correlation comparison before and after filtering of B0005 battery.
Table 7.
Correlation comparison before and after filtering of B0006 battery.
Table 8.
Correlation comparison before and after filtering of B0007 battery.
The tables indicate that after filtering, except for a very small decrease in the correlation degree of the voltage drop time and a constant value of the correlation degree of the average discharge voltage, the correlation degree of the other four health features has been improved to a certain extent after filtering.
2.5. Normalization Processing of Feature Data
To eliminate the influence of data units and scales on estimation results and improve model performance, this study adopts the min–max normalization method to normalize health features to the [0,1] interval, as follows [30]:
where represents normalized data; represents the number of data points; represents the ith data in the dataset; represents the maximum value of the data; represents the minimum value of the data.
3. Methodologies
3.1. LRFDBCOA
3.1.1. Lévy Roulette Strategy
Lévy roulette can improve the search performance of algorithms, and the mathematical model is as follows [31]:
where , , and represent the minimum step size, sample size, and control parameters, respectively, where the value of is determined by the dimension of the problem.
3.1.2. FDB Strategy
The application of FDB can select the optimal candidate solution in the population, which comprehensively considers the fitness value of the candidate solution and the distance from the best candidate solution. The mathematical model using Euclidean distance is as follows [31]:
where represents the solution of randomly selected individuals; represents the solution of the best candidate individual.
When calculating the total score of candidate solutions based on FDB strategy, the mathematical model is as follows:
where represents the comprehensive calculation score; represents the fitness value of individual; represents the influence weight of fitness, with a range of [0,1].
3.1.3. COA
COA imitates the social behavior of the coyote population; the population is divided into groups, each group has coyotes. The optimization process of the algorithm is divided into four steps: population initialization of coyotes, growth of coyotes, birth and death of pup, and migration of coyotes between populations [32].
- 1.
- Coyote population initialization
The behavior of coyotes is influenced by social conditions such as gender, social status, and the number of coyotes. Therefore, a coyote can be represented by social conditions as follows [33]:
where represents the social condition of the th coyote in the th population; represents the dimension of social conditions.
The initialization method for the social conditions of coyotes is as follows:
where represents the th social condition of the cth coyote in the th population; b and lb represent the upper and lower limits of the search space, respectively; is a random number between [0,1].
After population initialization, the fitness of the coyotes is evaluated as follows:
- 2.
- Coyote growth
The growth of coyotes is influenced by two factors. The first factor is that coyotes are guided by the best alpha coyote in the pack, and the process is as follows [33]:
where represents the randomly selected coyote from the p th population.
In addition, the cultural tendencies within the same group can also affect coyote growth, and the calculation of cultural tendencies is as follows:
where represents the social condition ranking of the th population in the th time.
The second influencing factor is as follows:
Based on the above two influencing factors, the new social conditions for coyotes are as follows:
where and represent the random number between 0 and 1.
Therefore, the fitness values corresponding to the updated social conditions are as follows:
Finally, choose coyotes with better social conditions to enter the next generation, as follows:
- 3.
- Pup birth and death
The birth of the new coyote is a combination of randomly selected social conditions of parents and environmental factors, as follows:
where represents a random number within [0,1]; and represent the randomly selected coyotes in the th population; and represent two randomly selected dimensions; represents the randomly selected variable in theth dimension; and represent dispersion probability and correlation probability, respectively [34].
After the birth of a pup, it is compared to the coyotes in the population. If the fitness values of the pup are all lower than other coyotes, the pup is abandoned. If there are coyotes smaller than the pup, they are replaced by the pup.
- 4.
- Coyotes migrate between populations
When coyotes are assigned to different populations, the coyotes continuously migrate to each other over time and the behavior enhances the learning process of the algorithm; the model is as follows [31]:
where represents the probability of migration.
In summary, LRFDBCOA method proposed in this study replaces the selection strategy based on fitness values in COA method with FDB selection strategy, i.e., substituting Equation (11) into Equation (16) to rank coyotes based on total scores and using Lévy roulette strategy to replace the birth model of offspring in the population, i.e., replacing Equation (9) with Equation (21) [31]. The flowchart of LRFDBCOA is shown in Figure 4.
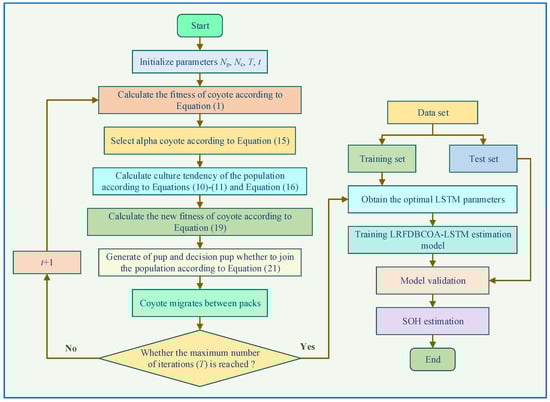
Figure 4.
The flowchart of LRFDBCOA.
3.2. LSTM
LSTM is a time-recursive neural network that can leave some information as input for the next neuron during information transmission, effectively solving the problems of gradient vanishing and exploding [35]. It updates cell units through three gate structures, and the structure of LSTM is shown in Figure 5.
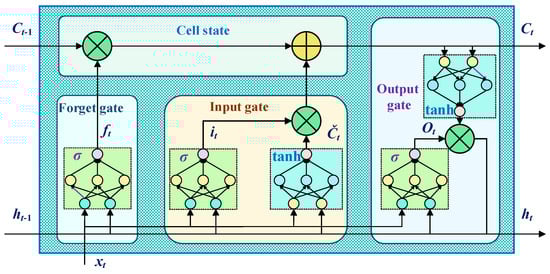
Figure 5.
LSTM network structure.
- 1.
- Forget Gate: Decide to forget some invalid information in the primitive cell unit based on the current state [36].
- 2.
- Input Gate: Determines which input information to save to the cell unit [36].
- 3.
- Output Gate: Decides which information to save in the output [37].
3.3. LRFDBCOA-LSTM for SOH Estimation
The accuracy of the LSTM network is greatly affected by model parameters, especially the number of hidden layer neurons and the initial learning rate of the network. In this study, LRFDBCOA is used to optimize the network parameters. During the iteration process of the model, the weight parameters in the network are continuously optimized to achieve the optimal solution of the model effect. The range of the number of hidden layer neurons in the network is [6,30], while the search range for the initial learning rate is [0.001,0.05], and the objective function is the error of SOH estimation. By minimizing the estimation error, the optimal network parameters are obtained. In summary, the SOH estimation flowchart based on LRFDBCOA-LSTM is shown in Figure 6.
Figure 6.
The flowchart of SOH estimation.
4. Case Studies
In this study, LRFDBCOA-LSTM is used for battery datasets under three different testing conditions, namely, B0005, B0006, and B0007. In addition, the first 60%, first 70%, and first 80% are used for SOH estimation as training data, respectively. The estimation results are compared and evaluated with the results obtained from the BP neural network [38], Elman neural network [39], radial basis function (RBF) [40], LSTM [41], and coyote optimization algorithm-optimized long short-term memory (COA-LSTM) using multiple evaluation indicators. The parameter settings for the six methods in this study are shown in Table 9. All case studies are undertaken by SimuNPS, which is implemented in the form of Python script, through a personal computer with an Intel (R) Core (TM) i5 CPU at 3.0 GHz and 64 GB of RAM.
Table 9.
Model parameter settings.
4.1. Evaluation Criteria
To quantitatively analyze the estimation results of SOH obtained, five evaluation indicators are used to evaluate the estimation performance of each method, which includes error, R2 [42], mean bias error (MBE) [43], mean absolute error (MAE), and root mean square error (RMSE) [44].
where represents the actual value of the sample; represents the number of samples; represents the predicted value of the sample; represents the average value of the actual sample.
4.2. Validation of B0005 Battery
For SOH estimation of the B0005 battery, it is implemented based on three different numbers of training and testing sets. Figure 7, Figure 8, Figure 9, Figure 10, Figure 11 and Figure 12 display SOH estimation results and error distribution boxplots obtained based on various three training set quantities. Table 10 and Figure 13 show the comparison of estimation performance among the six methods. The experimental results indicate that LRFDBCOA-LSTM method has significantly better performance than the other five algorithms. The estimation result curve is the closest SOH attenuation curve of the battery, with the values maximum R2 of 0.9896 and minimum MBE of 0.0012. In three test cases, the R2 is greater than 0.9700 of LRFDBCOA-LSTM, and BP neural network has the worst result among the six methods. In addition, after algorithm improvement and neural network parameter optimization, the estimation performance has also been effectively improved. COA-LSTM has a maximum R2 improvement of 78.9% compared to LSTM, while LRFDBCOA-LSTM has a maximum improvement of 17.85% compared to LSTM. Meanwhile, as shown in Figure 13, as the number of training sets increases, the MAE, MBE, and RMSE results obtained by the six algorithms all show a certain degree of decrease.
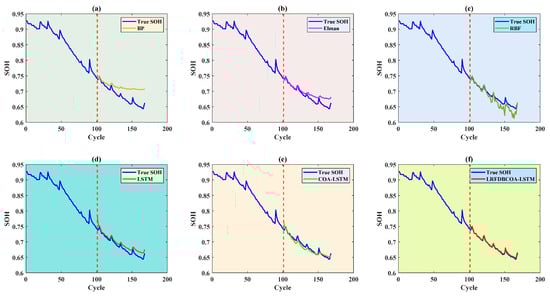
Figure 7.
SOH estimation results from the first 60% of cycles of the B0005 battery: (a) BP; (b) Elman; (c) RBF; (d) LSTM; (e) COA-LSTM; (f) LRFDBCOA-LSTM.
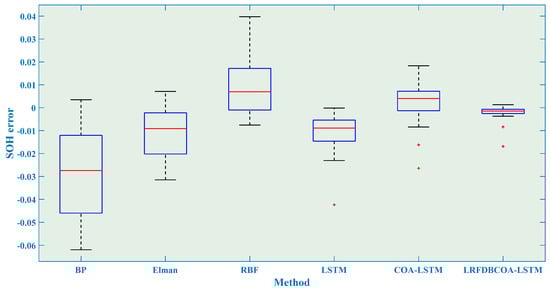
Figure 8.
SOH estimation errors from the first 60% of cycles of the B0005 battery.
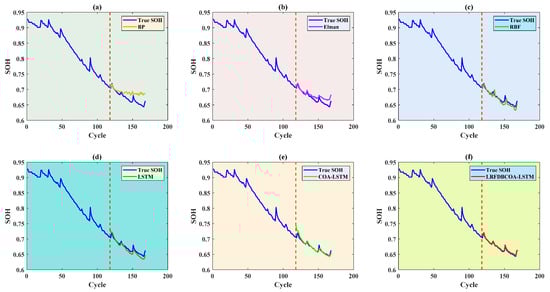
Figure 9.
SOH estimation results from the first 70% of cycles of the B0005 battery: (a) BP; (b) Elman; (c) RBF; (d) LSTM; (e) COA-LSTM; (f) LRFDBCOA-LSTM.
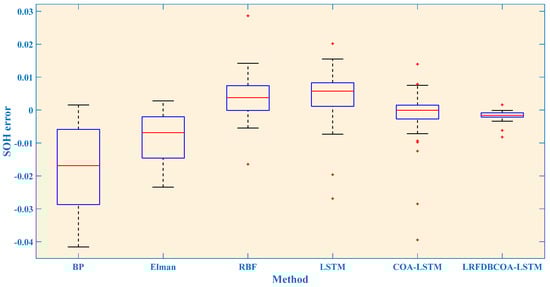
Figure 10.
SOH estimation errors from the first 70% cycles of the B0005 battery.

Figure 11.
SOH estimation results from the first 80% of cycles of the B0005 battery: (a) BP; (b) Elman; (c) RBF; (d) LSTM; (e) COA-LSTM; (f) LRFDBCOA-LSTM.
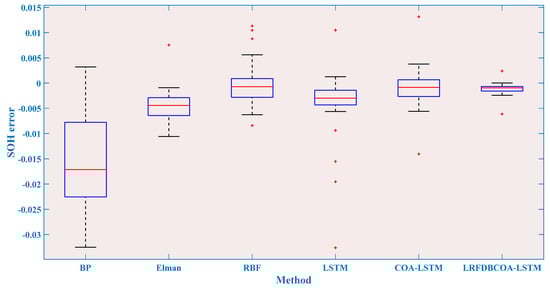
Figure 12.
SOH estimation errors from the first 80% of cycles of the B0005 battery.
Table 10.
SOH estimation R2 and MBE results of the B0005 battery using different methods.
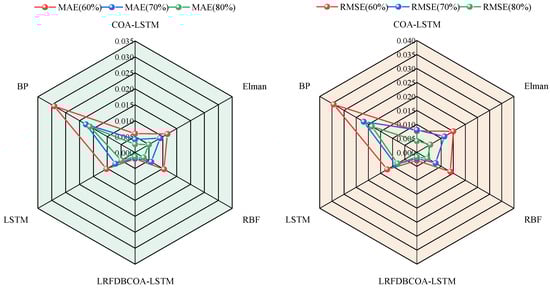
Figure 13.
SOH estimation MAE and RMSE results of the B0005 battery using different methods.
4.3. Validation of B0006 Battery
SOH estimation results of the B0006 battery are shown in Figure 14, Figure 15, Figure 16, Figure 17, Figure 18 and Figure 19. Additionally, Table 11 and Figure 20 show a comparison of the estimation performance of six methods. It can be observed that the LRFDBCOA-LSTM method has the best estimation performance, with the maximum R2 at 0.9887 and consistently greater than 0.97. Compared with LSTM, LRFDBCOA-LSTM has a maximum improvement of 17.22% in R2 and a minimum improvement of 8.43%, which adequately demonstrates that the performance of the model can be improved after neural network parameter optimization. According to Figure 20, increasing the number of training sets can improve the accuracy of estimation to a certain extent, especially in the performance of MAE and RMSE. However, it is worth noting that the values of R2 and MBE do not change significantly or even change in a negative direction, which may be due to the nonlinearity of the problem and the small total number of samples.
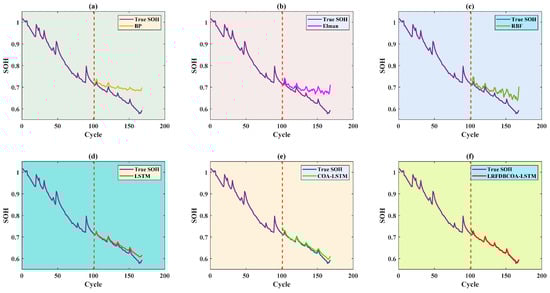
Figure 14.
SOH estimation results from the first 60% of cycles of the B0006 battery: (a) BP; (b) Elman; (c) RBF; (d) LSTM; (e) COA-LSTM; (f) LRFDBCOA-LSTM.
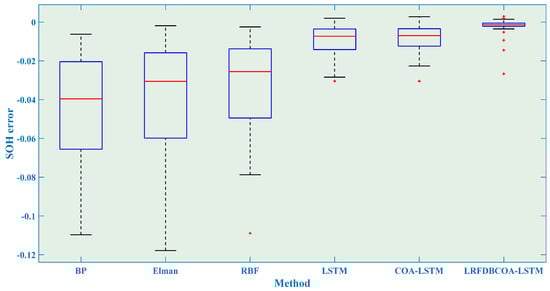
Figure 15.
SOH estimation errors from the first 60% of cycles of the B0006 battery.
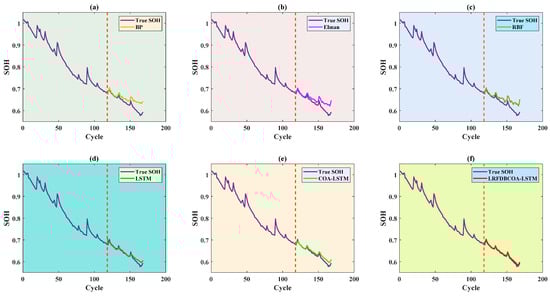
Figure 16.
SOH estimation results from the first 70% of cycles of the B0006 battery: (a) BP; (b) Elman; (c) RBF; (d) LSTM; (e) COA-LSTM; (f) LRFDBCOA-LSTM.
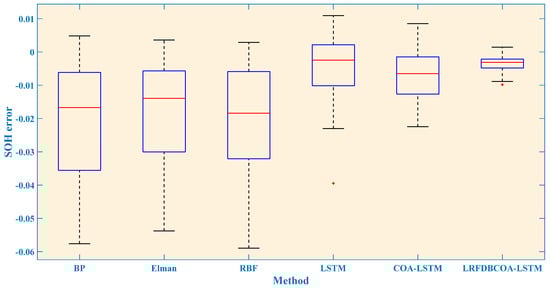
Figure 17.
SOH estimation errors from the first 70% of cycles of the B0006 battery.
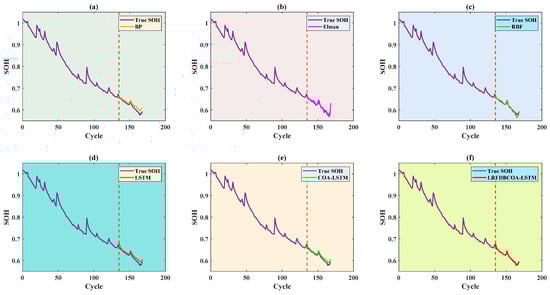
Figure 18.
SOH estimation results from the first 80% of cycles of the B0006 battery: (a) BP; (b) Elman; (c) RBF; (d) LSTM; (e) COA-LSTM; (f) LRFDBCOA-LSTM.
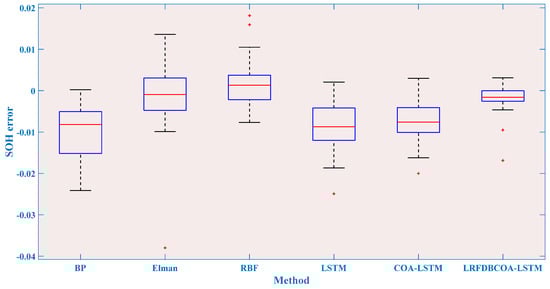
Figure 19.
SOH estimation errors from the first 80% of cycles of the B0006 battery.
Table 11.
SOH estimation R2 and MBE results of the B0006 battery using different methods.
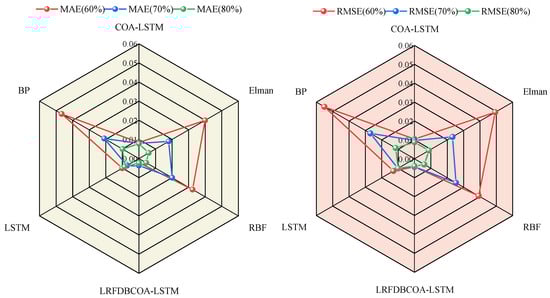
Figure 20.
SOH estimation MAE and RMSE results of the B0006 battery using different methods.
4.4. Validation of B0007 Battery
SOH estimation results of the B0007 battery are shown in Figure 21, Figure 22, Figure 23, Figure 24, Figure 25 and Figure 26, which distinctly show that the SOH estimation result obtained by LRFDBCOA-LSTM is closest to the original SOH degradation curve, and its R2 is also the highest, reaching 0.9767. Moreover, Table 12 and Figure 27 show a comparison of the estimation performance of six methods. Under the three starting point test conditions, the average R2 also reaches 0.9736 and the MBE is not more than 0.0026 of LRFDBCOA-LSTM, which testify its excellent generalization. Through five indicators, the performance of LRFDBCOA-LSTM is the best among the six methods, proving its excellent adaptability. Additionally, Table 12 demonstrates that the algorithm improvement strategy and neural network parameter optimization method proposed in this study effectively improve the performance of SOH estimation. From Figure 27, it can be observed that although the overall data sample of this study is relatively small, some evaluation indicators can prove that increasing the number of training set samples can also improve the accuracy of SOH estimation to a certain extent.
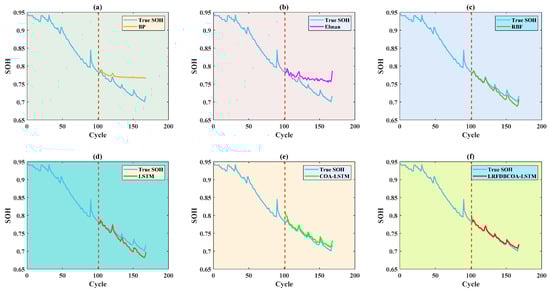
Figure 21.
SOH estimation results from the first 60% of cycles of the B0007 battery: (a) BP; (b) Elman; (c) RBF; (d) LSTM; (e) COA-LSTM; (f) LRFDBCOA-LSTM.
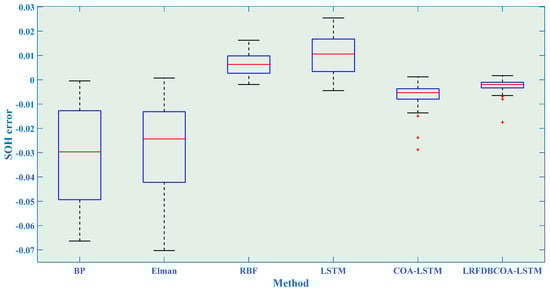
Figure 22.
SOH estimation errors from the first 60% of cycles of the B0007 battery.
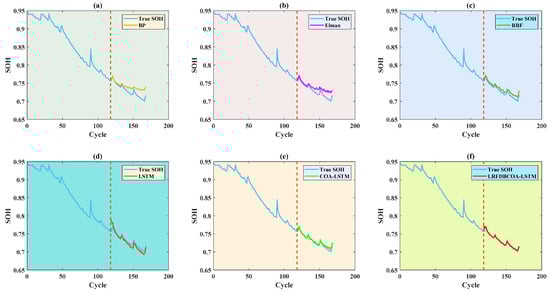
Figure 23.
SOH estimation results from the first 70% of cycles of the B0007 battery: (a) BP; (b) Elman; (c) RBF; (d) LSTM; (e) COA-LSTM; (f) LRFDBCOA-LSTM.
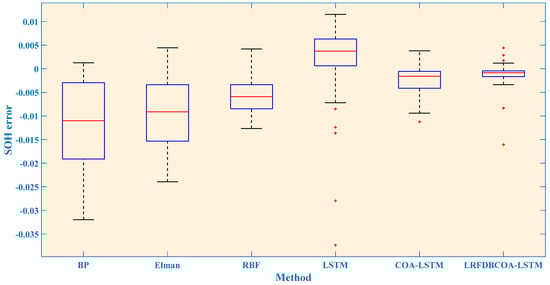
Figure 24.
SOH estimation errors from the first 70% of cycles of the B0007 battery.
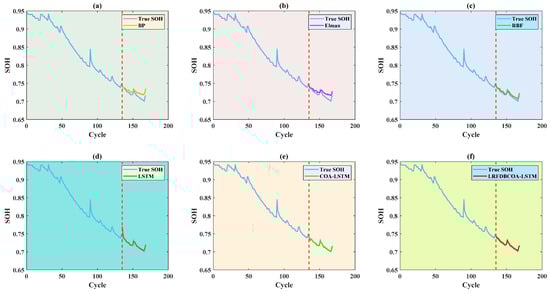
Figure 25.
SOH estimation results from the first 80% of cycles of the B0007 battery: (a) BP; (b) Elman; (c) RBF; (d) LSTM; (e) COA-LSTM; (f) LRFDBCOA-LSTM.
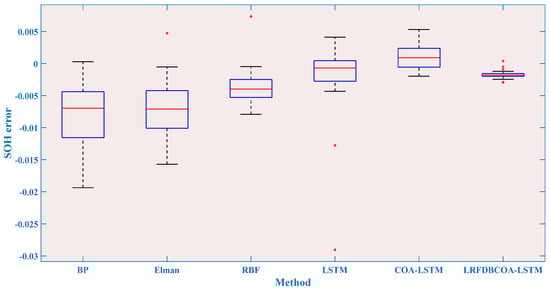
Figure 26.
SOH estimation errors from the first 80% of cycles of the B0007 battery.
Table 12.
SOH estimation R2 and MBE results of the B0007 battery using different methods.
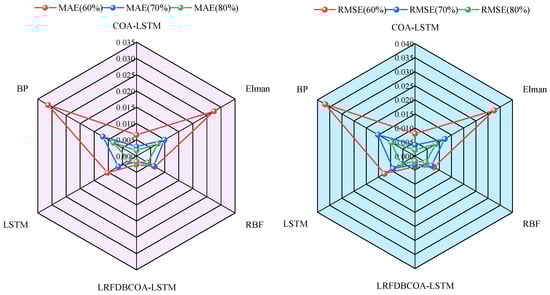
Figure 27.
SOH estimation MAE and RMSE results of the B0007 battery using different methods.
5. Discussions
Based on the above results, it can be observed that LRFDBCOA-LSTM obtains the closest SOH estimation result to the original SOH degradation curve, with the smallest error and the highest accuracy compared to the other five algorithms. Meanwhile, the experimental results of LRFDBCOA-LSTM are superior to those of COA-LSTM and LSTM, which adequately demonstrates the algorithm improvement and neural network parameter optimization strategies applied in this work that can improve the performance of estimation in the model. In addition, LRFDBCOA-LSTM achieved excellent precision for SOH research on battery datasets under three different testing conditions, which indicates that the improved model has great generalization and robustness. Nevertheless, to test the influence of data size, the verification model is established based on different estimation starting points. However, this work also has some limitations, as follows:
- (1)
- It is worth noting that the estimation results are not significant, and some estimation indicators even deteriorated with the quantity of data used for model training increases. The reason may be that the overall dataset in this work had fewer samples, so the difference in data size between samples with different starting points is not very significant.
- (2)
- Given that this method is limited to offline-state estimation of individual batteries, and that BMSs mainly focus on monitoring and managing the entire battery pack, this estimation method may not be suitable for practical battery pack management applications.
6. Conclusions
This research proposes a novel SOH estimation method based on LRFDBCOA-LSTM, which includes innovations as follows:
The charging and discharging curves of the battery are analyzed and six different health features are extracted. To eliminate outliers in feature data, Savitzky–Golay is used to filter and optimize the feature data.
The correlations between health features and SOH are calculated based on Pearson and Spearman correlation coefficients. Moreover, to enhance the global search and local development capabilities of COA while solving the parameter setting problem of LSTM, Lévy roulette and FDB strategies are applied to improve COA and optimize the network parameters of LSTM.
To verify the effectiveness, SOH experiments were conducted of the six methods under five evaluation criteria. The results highlight that LRFDBCOA-LSTM has the best estimation performance among the six methods. Furthermore, the accuracy of LRFDBCOA-LSTM is greatly improved compared to COA-LSTM and LSTM. In particular, the maximum enhancement in R2 compared to LSTM is 36.03%, and the maximum enhancement compared to COA-LSTM is 18.21%.
The experimental results based on battery datasets under three different testing conditions with different estimation starting points were compared, in which the R2 obtained was not less than 0.9711 and the maximum was 0.9896, and MBE was within 0.0036. This proves that the model is suitable for different environments and battery data and has strong generalization and robustness.
Author Contributions
Methodology, L.S.; software, F.Z.; validation, D.G.; writing—original draft preparation, H.L.; writing—review and editing, B.Y.; funding acquisition, B.Y. All authors have read and agreed to the published version of the manuscript.
Funding
This work is supported by National Natural Science Foundation of China (62263014) and Yunnan Provincial Basic Research Project (202401AT070344, 202301AT070443).
Data Availability Statement
The battery data used in this article come from NASA.
Conflicts of Interest
Authors Hongbiao Li, Dengke Gao, Linlong Shi and Fei Zheng were employed by the company Shanghai KeLiang Information Technology Co., Ltd. The remaining authors declare that the research was conducted in the absence of any commercial or financial relationships that could be construed as a potential conflict of interest.
Nomenclature
| Abbreviations | |
| BMS | battery management system |
| BP | back-propagation |
| CC | constant current |
| CV | constant voltage |
| COA | coyote optimization algorithm |
| COA-LSTM | coyote optimization algorithm optimized long short-term memory |
| EV | electric vehicle |
| FDB | fitness-distance balance |
| IALO | improved ant lion optimization |
| LIB | lithium-ion battery |
| LRFDBCOA-LSTM | Lévy roulette- and fitness-distance balance-enhanced coyote optimization algorithm-optimized long short-term memory |
| LSTM | long short-term memory |
| MAE | mean absolute error |
| MBE | mean bias error |
| RBF | radial basis function |
| RMSE | root mean square error |
| SOH | state of health |
| SVR | support vector regression |
| Variables | |
| the initial available capacity | |
| the current available capacity | |
| the number of battery data input | |
| the number of coyotes | |
| the number of coyote groups | |
| the maximum value of battery data input | |
| the minimum value of battery data input | |
| the normalized battery data | |
References
- Sun, Y.H.; Zhou, Y.; Wang, S.; Mahfoud, R.J.; Alhelou, H.H.; Sideratos, G.; Hatziargyriou, N.; Siano, P. Nonparametric probabilistic prediction of regional PV outputs based on granule-based clustering and direct optimization programming. J. Mod. Power Syst. Clean Energy 2023, 11, 1450–1461. [Google Scholar] [CrossRef]
- Arefifarf, S.A.; Alam, M.S.; Hamadi, A. A review on self-healing in modern power distribution systems. J. Mod. Power Syst. Clean Energy 2023, 11, 1719–1733. [Google Scholar] [CrossRef]
- Yang, B.; Zheng, R.Y.; Han, Y.M.; Huang, J.X.; Li, M.W.; Shu, H.C.; Su, S.; Guo, Z.X. Recent advances and summarization of fault diagnosis techniques for the photovoltaic system: A critical overview. Prot. Control Mod. Power Syst. 2024, 9, 36–59. [Google Scholar] [CrossRef]
- Kahali, R.; Jamil, M.; Lqbal, M.T. An improved perturb and observed maximum power point tracking algorithm for photovoltaic power systems. J. Mod. Power Syst. Clean Energy 2023, 11, 1165–1175. [Google Scholar]
- Yang, B.; Liu, B.Q.; Zhou, H.Y.; Wang, J.B.; Yao, W.; Wu, S.C.; Shu, H.C.; Ren, Y.X. A critical survey of technologies of large offshore wind farm integration: Summary, advances, and perspectives. Prot. Control Mod. Power Syst. 2022, 7, 1–32. [Google Scholar] [CrossRef]
- Yang, B.; Duan, J.H.; Yan, Y.F.; Liu, B.Q.; Huang, J.X.; Jiang, L.; Han, R. EMCO-based optimal layout design of hybrid wind-wave energy converters array. Prot. Control Mod. Power Syst. 2024, 9, 142–161. [Google Scholar] [CrossRef]
- Lyu, B.L.; Liu, Y.C.; Zhang, J.Y.; Tian, B.; Li, W.F. A consistency diagnosis method of series-connected lithium-ion batteries based on charging curve transformation. Shandong Electr. Power 2024, 51, 45–51. [Google Scholar]
- Wang, Y.T.; Yang, B. Optimal PV array reconfiguration under partial shading condition through dynamic leader based collective intelligence. Prot. Control Mod. Power Syst. 2023, 8, 1–16. [Google Scholar] [CrossRef]
- Yang, B.; Li, Y.L.; Li, J.L.; Shu, H.C.; Zhao, X.Y.; Ren, Y.X.; Li, Q. Comprehensive summary of solid oxide fuel cell control: A state of the art review. Prot. Control Mod. Power Syst. 2022, 7, 1–31. [Google Scholar] [CrossRef]
- Yang, B.; Qian, Y.C.; Li, Q.; Chen, Q.; Wu, J.Y.; Luo, E.B.; Xie, R.; Zheng, R.Y.; Yan, Y.F.; Su, S.; et al. Critical summary and perspectives on state-of-health of lithium-ion battery. Renew. Sustain. Energy Rev. 2024, 190, 114077. [Google Scholar] [CrossRef]
- Yang, B.; Wang, J.T.; Cao, P.L.; Zhu, T.J.; Shu, H.C.; Chen, J.; Zhang, J.; Zhu, J.W. Classification, summarization and perspectives on state-of-charge estimation of lithium-ion batteries used in electric vehicles: A critical comprehensive survey. J. Energy Storage 2021, 39, 102572. [Google Scholar] [CrossRef]
- Shrivastava, P.; Soon, T.K.; Idris, M.Y.I.B.; Mekhilef, S. Overview of model-based online state-of-charge estimation using Kalman filter family for lithium-ion batteries. Renew. Sustain. Energy Rev. 2019, 113, 109233. [Google Scholar] [CrossRef]
- Cuma, M.U.; Koroglu, T. A comprehensive review on estimation strategies used in hybrid and battery electric vehicles. Renew. Sustain. Energy Rev. 2015, 42, 517–531. [Google Scholar] [CrossRef]
- Wang, P.; Fan, L.F.; Cheng, Z. A joint state of health and remaining useful life estimation approach for lithium-ion batteries based on health factor parameter. Proc. CSEE 2022, 42, 1523–1534. [Google Scholar]
- Shen, J.W.; Ma, W.S.; Shu, X.; Shen, S.Q.; Chen, Z.; Liu, Y.G. Accurate state of health estimation for lithium-ion batteries under random charging scenarios. Energy 2023, 279, 128092. [Google Scholar] [CrossRef]
- Li, A.; Tian, H.X.; Li, K. Remaining useful life prediction of lithium-ion batteries using a spatial temporal network model based on capacity self-recovery effect. J. Energy Storage 2023, 67, 107557. [Google Scholar] [CrossRef]
- Wen, J.P.; Chen, X.; Li, X.H.; Li, Y.K. SOH prediction of lithium battery based on IC curve feature and BP neural network. Energy 2022, 261, 125234. [Google Scholar] [CrossRef]
- Zhang, F.; Xing, Z.X.; Wu, M.H. State of health estimation for Li-ion battery using characteristic voltage intervals and genetic algorithm optimized back propagation neural network. J. Energy Storage 2023, 57, 106277. [Google Scholar]
- Wu, M.Y.; Zhong, Y.M.; Wu, J.; Wang, Y.Q.; Wang, L. State of health estimation of the lithium-ion power battery based on the principal component analysis-particle swarm optimization-back propagation neural network. Energy 2023, 283, 129061. [Google Scholar] [CrossRef]
- Gong, D.L.; Gao, Y.; Kou, Y.L.; Wang, Y.R. State of health estimation for lithium-ion battery based on energy features. Energy 2022, 257, 124812. [Google Scholar] [CrossRef]
- Li, Q.L.; Li, D.Z.; Zhao, K.; Wang, L.C.; Wang, K. State of health estimation of lithium-ion battery based on improved ant lion optimization and support vector regression. J. Energy Storage 2022, 50, 104215. [Google Scholar] [CrossRef]
- Zuo, H.Y.; Liang, J.W.; Zhang, B.; Wei, K.X.; Zhu, H.; Tan, J.Q. Intelligent estimation on state of health of lithium-ion power batteries based on failure feature extraction. Energy 2023, 282, 128794. [Google Scholar] [CrossRef]
- Van, C.N.; Quang, D.T. Estimation of SOH and internal resistances of lithium ion battery based on LSTM network. Int. J. Electrochem. Sci. 2023, 18, 100166. [Google Scholar]
- Deng, Z.W.; Lin, X.K.; Cai, J.W.; Hu, X.S. Battery health estimation with degradation pattern recognition and transfer learning. J. Power Sources 2022, 525, 231027. [Google Scholar] [CrossRef]
- Qu, J.T.; Liu, F.; Ma, Y.X.; Fan, J.M. A neural-network-based method for RUL prediction and soh monitoring of lithium-ion battery. IEEE Access 2019, 7, 87178–87191. [Google Scholar] [CrossRef]
- Saha, B.; Goebel, K. Battery Data Set; NASA Prognostics Data Repository, NASA Ames Research Center: Moffett Field, CA, USA, 2007.
- Hu, X.S.; Che, Y.H.; Lin, X.K.; Onori, S. Battery health prediction using fusion-based feature selection and machine learning. IEEE Trans. Transp. Electrif. 2021, 7, 382–398. [Google Scholar] [CrossRef]
- Schettino, B.M.; Duque, C.A.; Silveira, P.M. Current-transformer saturation detection using Savitzky-Golay filter. IEEE Trans. Power Deliv. 2016, 31, 1400–1401. [Google Scholar] [CrossRef]
- Li, B.J.; Wang, Q.B.; Duan, D.P. Strain measurement errors with digital image correlation due to the Savitzky-Golay filter-based method. Meas. Sci. Technol. 2018, 29, 085004. [Google Scholar]
- Xia, Z.Y.; Qahouq, J.A.A. Lithium-ion battery ageing behavior pattern characterization and state-of-health estimation using data-driven method. IEEE Access 2021, 9, 98287–98304. [Google Scholar] [CrossRef]
- Duman, S.; Kahraman, H.T.; Guvenc, U.; Aras, S. Development of a Lévy flight and FDB-based coyote optimization algorithm for global optimization and real-world ACOPF problems. Methodol. Appl. 2021, 25, 6577–6617. [Google Scholar] [CrossRef]
- Zhang, Q.K.; Bu, X.L.; Zhan, Z.H.; Li, J.Q.; Zhang, H.X. An efficient optimization state-based coyote optimization algorithm and its applications. Appl. Soft Comput. 2023, 147, 110827. [Google Scholar] [CrossRef]
- Li, L.G.; Sun, L.J.; Xue, Y.; Li, S.J.; Huang, X.W.; Mansour, R.F. Fuzzy multilevel image thresholding based on improved coyote optimization algorithm. IEEE Access 2021, 9, 33595–33607. [Google Scholar] [CrossRef]
- Chin, V.J.; Salam, Z. Coyote optimization algorithm for the parameter extraction of photovoltaic cells. Sol. Energy 2019, 194, 656–670. [Google Scholar] [CrossRef]
- Jiang, N.J.; Yu, X.B.; Alam, M. A hybrid carbon price prediction model based-combinational estimation strategies of quantile regression and long short-term memory. J. Clean. Prod. 2023, 429, 139508. [Google Scholar] [CrossRef]
- Brahma, I. Using long short-term memory (LSTM) networks with the toy model concept for compressible pulsatile flow metering. Measurement 2023, 223, 113782. [Google Scholar] [CrossRef]
- Song, X.H.; Yao, Q.Z. Real-time state of health estimation for lithium-ion batteries based on daily segment charging data and dual extended Kalman filters-wavelet neural network-wavelet short memory neural network. Trans. China Electrotech. Soc. 2023, 39, 1565–1576. [Google Scholar]
- Li, N.; He, F.X.; Ma, W.T.; Wang, R.T.; Jiang, L.; Zhang, X.P. An indirect state-of-health estimation method based on improved genetic and back propagation for online lithium-ion battery used in electric vehicles. IEEE Trans. Veh. Technol. 2022, 71, 12682–12690. [Google Scholar] [CrossRef]
- Guo, Y.; Yang, D.F.; Zhang, Y.; Wang, L.C.; Wang, K. Online estimation of SOH for lithium-ion battery based on SSA-Elman neural network. Prot. Control Mod. Power Syst. 2022, 7, 1–17. [Google Scholar] [CrossRef]
- Mao, L.; Hu, H.Z.; Chen, J.J.; Zhao, J.B.; Qu, K.Q.; Jiang, L. Online state-of-health estimation method for lithium-ion battery based on CEEMDAN for feature analysis and RBF neural network. IEEE J. Emerg. Sel. Top. Power Electron. 2023, 11, 187–199. [Google Scholar] [CrossRef]
- Lin, M.Q.; Wu, J.; Meng, J.H.; Wang, W.; Wu, J. State of health estimation with attentional long short-term memory network for lithium-ion batteries. Energy 2023, 268, 126706. [Google Scholar] [CrossRef]
- Qian, Y.C.; Yang, B.; Zheng, R.Y.; Liang, B.X.; Wu, P.Y. State-of-health Estimation of Lithium-ion Batteries Based on EMD-DO-Elman and GRA. Power Syst. Technol. 2024, 48, 3695–3704. [Google Scholar]
- Yang, B.; Wang, J.B.; Zhang, X.S.; Yu, T.; Yao, W.; Shu, H.C.; Zeng, F.; Sun, L.M. Comprehensive overview of meta-heuristic algorithm applications on PV cell parameter identification. Energy Convers. Manag. 2020, 208, 112595. [Google Scholar] [CrossRef]
- Qiao, J.S.; Liu, X.F.; Chen, Z.H. Prediction of the remaining useful life of lithium-ion batteries based on empirical mode decomposition and deep neural networks. IEEE Access 2020, 8, 42760–42767. [Google Scholar] [CrossRef]
Disclaimer/Publisher’s Note: The statements, opinions and data contained in all publications are solely those of the individual author(s) and contributor(s) and not of MDPI and/or the editor(s). MDPI and/or the editor(s) disclaim responsibility for any injury to people or property resulting from any ideas, methods, instructions or products referred to in the content. |
© 2024 by the authors. Licensee MDPI, Basel, Switzerland. This article is an open access article distributed under the terms and conditions of the Creative Commons Attribution (CC BY) license (https://creativecommons.org/licenses/by/4.0/).