Article

The Influence of Structure Optimization on Vortex Suppression and Energy Dissipation in the Draft Tube of Francis Turbine

1
Faculty of Metallurgical and Energy Engineering, Kunming University of Science and Technology, Kunming 650093, China
2
Huaneng Lancang River Hydropower Inc., Miaowei & Gongguoqiao Hydropower Plant, Dali 672700, China
*
Author to whom correspondence should be addressed.
Processes 2024, 12(10), 2249; https://doi.org/10.3390/pr12102249
Submission received: 4 September 2024 / Revised: 10 October 2024 / Accepted: 13 October 2024 / Published: 15 October 2024
(This article belongs to the Section Process Control and Monitoring)

Abstract

:
Under partial load operating conditions, vortex rope generation in the draft tube of a Francis turbine is considered one of the main reasons for hydro unit vibration. In this paper, a Francis turbine HLA551-LJ-43 in the laboratory was taken as a prototype. Numerical simulations of the entire flow passage were carried out. Four different hydro-turbines were chosen to analyze the effect of vortex suppression, which were named the prototype turbine (N-J), the turbine with J-grooves installed on its conical section (W-J), the one with extending runner cone (C), and the one that considered the J-grooves and the extending runner cone at the same time (J+C). Under the part load conditions in which the vortex rope is easily generated (0.4–0.8 times design flow QBEP), the spectrum characteristics of pressure fluctuation, the morphology of vortex rope, and the energy dissipation based on the entropy production theory in the draft tube were studied. The results show that the three optimized structures W-J, C, and J+C could reduce the pressure pulsation in the conical section of the draft tube, weaken the eccentricity of the vortex rope, and decrease the energy losses in the runner and draft tube. It is worth mentioning that the turbine with a J+C optimized structure had the most potent effect on vortex suppression and energy dissipation. Primarily when operating in deep partial load (DPL) conditions, the efficiency of the turbine with a J+C optimized structure was increased by 13.7% compared to the prototype turbine, and the main frequency amplitude of the pressure pulsation in the draft tube was reduced to 32% of the prototype.

1. Introduction

The rapid development of the global economy has gradually increased human demand for energy. However, the combustion of traditional fossil fuels causes environmental problems such as acid rain and the greenhouse effect. Hence, coping with climate change has become a new mission that all human beings urgently need to undertake. Therefore, the international society has proposed the climate governance objective that global CO2 emissions must realize carbon peaking before 2025 and carbon neutrality before 2050. As the need for clean energy is recognized worldwide, hydropower is an essential guarantee for achieving the goal of carbon peaking and carbon neutrality and building a modern energy system that is clean as well as low-carbon, safe, and efficient [1,2].
The Francis turbine is the most widely used type in hydroelectric power generation. The water turbines in hydropower plants are mostly required to operate under off-design conditions to meet the load demand of the electric power system. However, under partial load conditions, when the ratio of axial velocity to peripheral velocity from the runner outlet to the draft tube inlet decreases to a certain extent, an asymmetric and unstable spiral vortex is generated in the recirculation zone of the draft tube center. Meanwhile, a forced vortex, the draft tube vortex rope, is formed, and pressure fluctuations are associated [3]. The synchronous pressure pulsation generated by the rotating water flow in the draft tube has an extensive frequency variation range. It becomes the main excited force for the water body resonance, which is one of the fundamental causes of the dangerous operation of the hydro unit [4,5]. Therefore, it is of great significance to study the formation and development mechanism of the vortex rope in the draft tube and associated pressure pulsations, and explore effective measures to suppress or even eliminate the draft tube vortex rope and associated pressure fluctuations. All of these play an essential role in optimizing water turbine design and improving water turbines’ hydraulic stability.
Thus far, domestic and foreign scholars have researched the problems associated with the vortex rope in the draft tube and associated pressure fluctuations. There are three main research methods: theoretical analysis, experimental measurement, and Computational Fluid Dynamics (CFD) numerical simulation [6]. Wang, Rheingans, and Rudolf et al. [7,8,9] researched the draft tube vortex rope and associated pressure pulsations using the theoretical analysis method. Moreover, some conclusions were obtained, such as the formation mechanism of the draft tube vortex and associated pressure pulsations, and the arrangement of swirl space for energy identification in the draft tube. However, the methods used for suppressing the draft tube vortex and associated pressure pulsations are onefold, mainly based on air admission. Through experimental research, Liu, Ma, and Sun et al. [10,11,12] determined the methods for ameliorating the draft tube pressure pulsation, for instance, increasing the relative height of the water turbine draft tube, adopting different shapes of runner cone, installing a steadying flow plate, supplying air to the shaft center hole, and many more. Resiga, Ciocan, and Anton et al. [13] used a laser Doppler velocimeter to measure the internal flow velocity of the water turbine and analyzed the draft tube vortex rope. They accurately represented the superposition of different eddy currents with the average eddy current, which can be used as a reference for water turbine design and optimization. Anup et al. [14] analyzed the influence of the dynamic and static interference relationship between the rotor and the stator on the vortex rope. They concluded that the pressure distribution on runner blades was related to the revolving speed and the number of guide vanes. Nevertheless, the experimental-based research on the suppression method focuses on the effect.
The suppression mechanism and influencing factors of draft tube vortex rope and associated pressure pulsations still need to be clarified. The CFD numerical simulation method has become increasingly popular with computer and CFD technology development [15]. In order to research the internal flow characteristics of water turbines under different operating conditions, Wang, Li, and Su et al. [16,17,18,19] chose the RNG k-ε turbulence model to proceed with a numerical simulation of the 3D transient turbulent flow for the flow of the entire flow passage of a Francis turbine under partial load. The amplitude and frequency characteristics of the pressure pulsation in the draft tube were successfully predicted. Mulu, Foroutan, and Hosein et al. [20,21] used the DES turbulence model to study the effect of jet technology at the draft tube inlet on suppressing the vortex rope, and a conclusion that the generation of vortex rope would be suppressed when the jet volume was definite was drawn. KC, Lee, and Thapa [22] adopted the RNG k-ε model to study the control effects of the nonsynchronous guide vane and grooving on the straight cone of the draft tube on the vortex rope, respectively. They concluded that the former had a small effect, while the latter could weaken the vortex rope, and the weakening effect was related to the depth and number of the grooves. Cheng, Zhou, and Liang et al. [23] investigated the features of vortex rope, pressure fluctuations, and runner outlet velocity at part-load conditions experimentally and numerically. They concluded that the new parameters G and Vs can be used to determine the strength of the helical vortex field based on the gradient of time-averaged velocity on the horizontal section of the draft tube cone. However, as a critical energy conversion component, one should also pay attention to the attendant energy variation of the water turbine in suppressing the draft tube vortex. Nevertheless, few studies have focused on this issue.
The draft tube vortex starts from the runner outlet near the runner cone. Accordingly, the runner cone’s shape significantly influences the flow of adjacent water [24]. When the water turbine is operating on partial load, the energy loss of the hydro unit is increased by backflow phenomena, pulsations, vortex rope, split-flow in the draft tube, and others. In addition, as a spiral vortex is easily generated in the draft tube under partial load operation, the optimization of this structure can weaken the draft tube vortex and associated pressure pulsations [25,26]. For the improvement of water turbine operation stability under partial load conditions, the structural optimization method for a water turbine that uses the method of extending the runner cone and the method of installing the J-grooves on the straight cone of the draft tube simultaneously was presented for the first time in this paper. Moreover, the inhibition of the eccentric vortex of the structural optimization method was explored under the two typical operating conditions, deep partial load (DPL) and partial load (PL), via CFD numerical simulation. In addition, when operating under the design condition, the turbulent pulsation caused by adverse flow phenomenon will lead to hydraulic losses of the Francis turbine, which are accompanied by entropy production at the same time. According to the entropy generation theory, the Local Entropy Production Rate (LEPR) is used to represent the entropy generation caused by the time-averaged movement and the velocity pulsation. Furthermore, compared with the traditional differential pressure method, it is easy to accurately judge the location of high hydraulic losses and calculate the head loss coefficient through the LEPR method [27,28,29,30]. To accurately evaluate the energy dissipation effect brought about by structural optimization, this study was based on the entropy production theory, which was used to accurately analyze and evaluate the energy dissipation of the hydro-turbines with different optimized structures. We sought to obtain the most optimal modification measure for reducing the draft tube vortex and associated pressure pulsations, which also provides instruction and reference for expanding the stable operation region of the hydro unit.

2. Prototype Model and Numerical Calculation Method

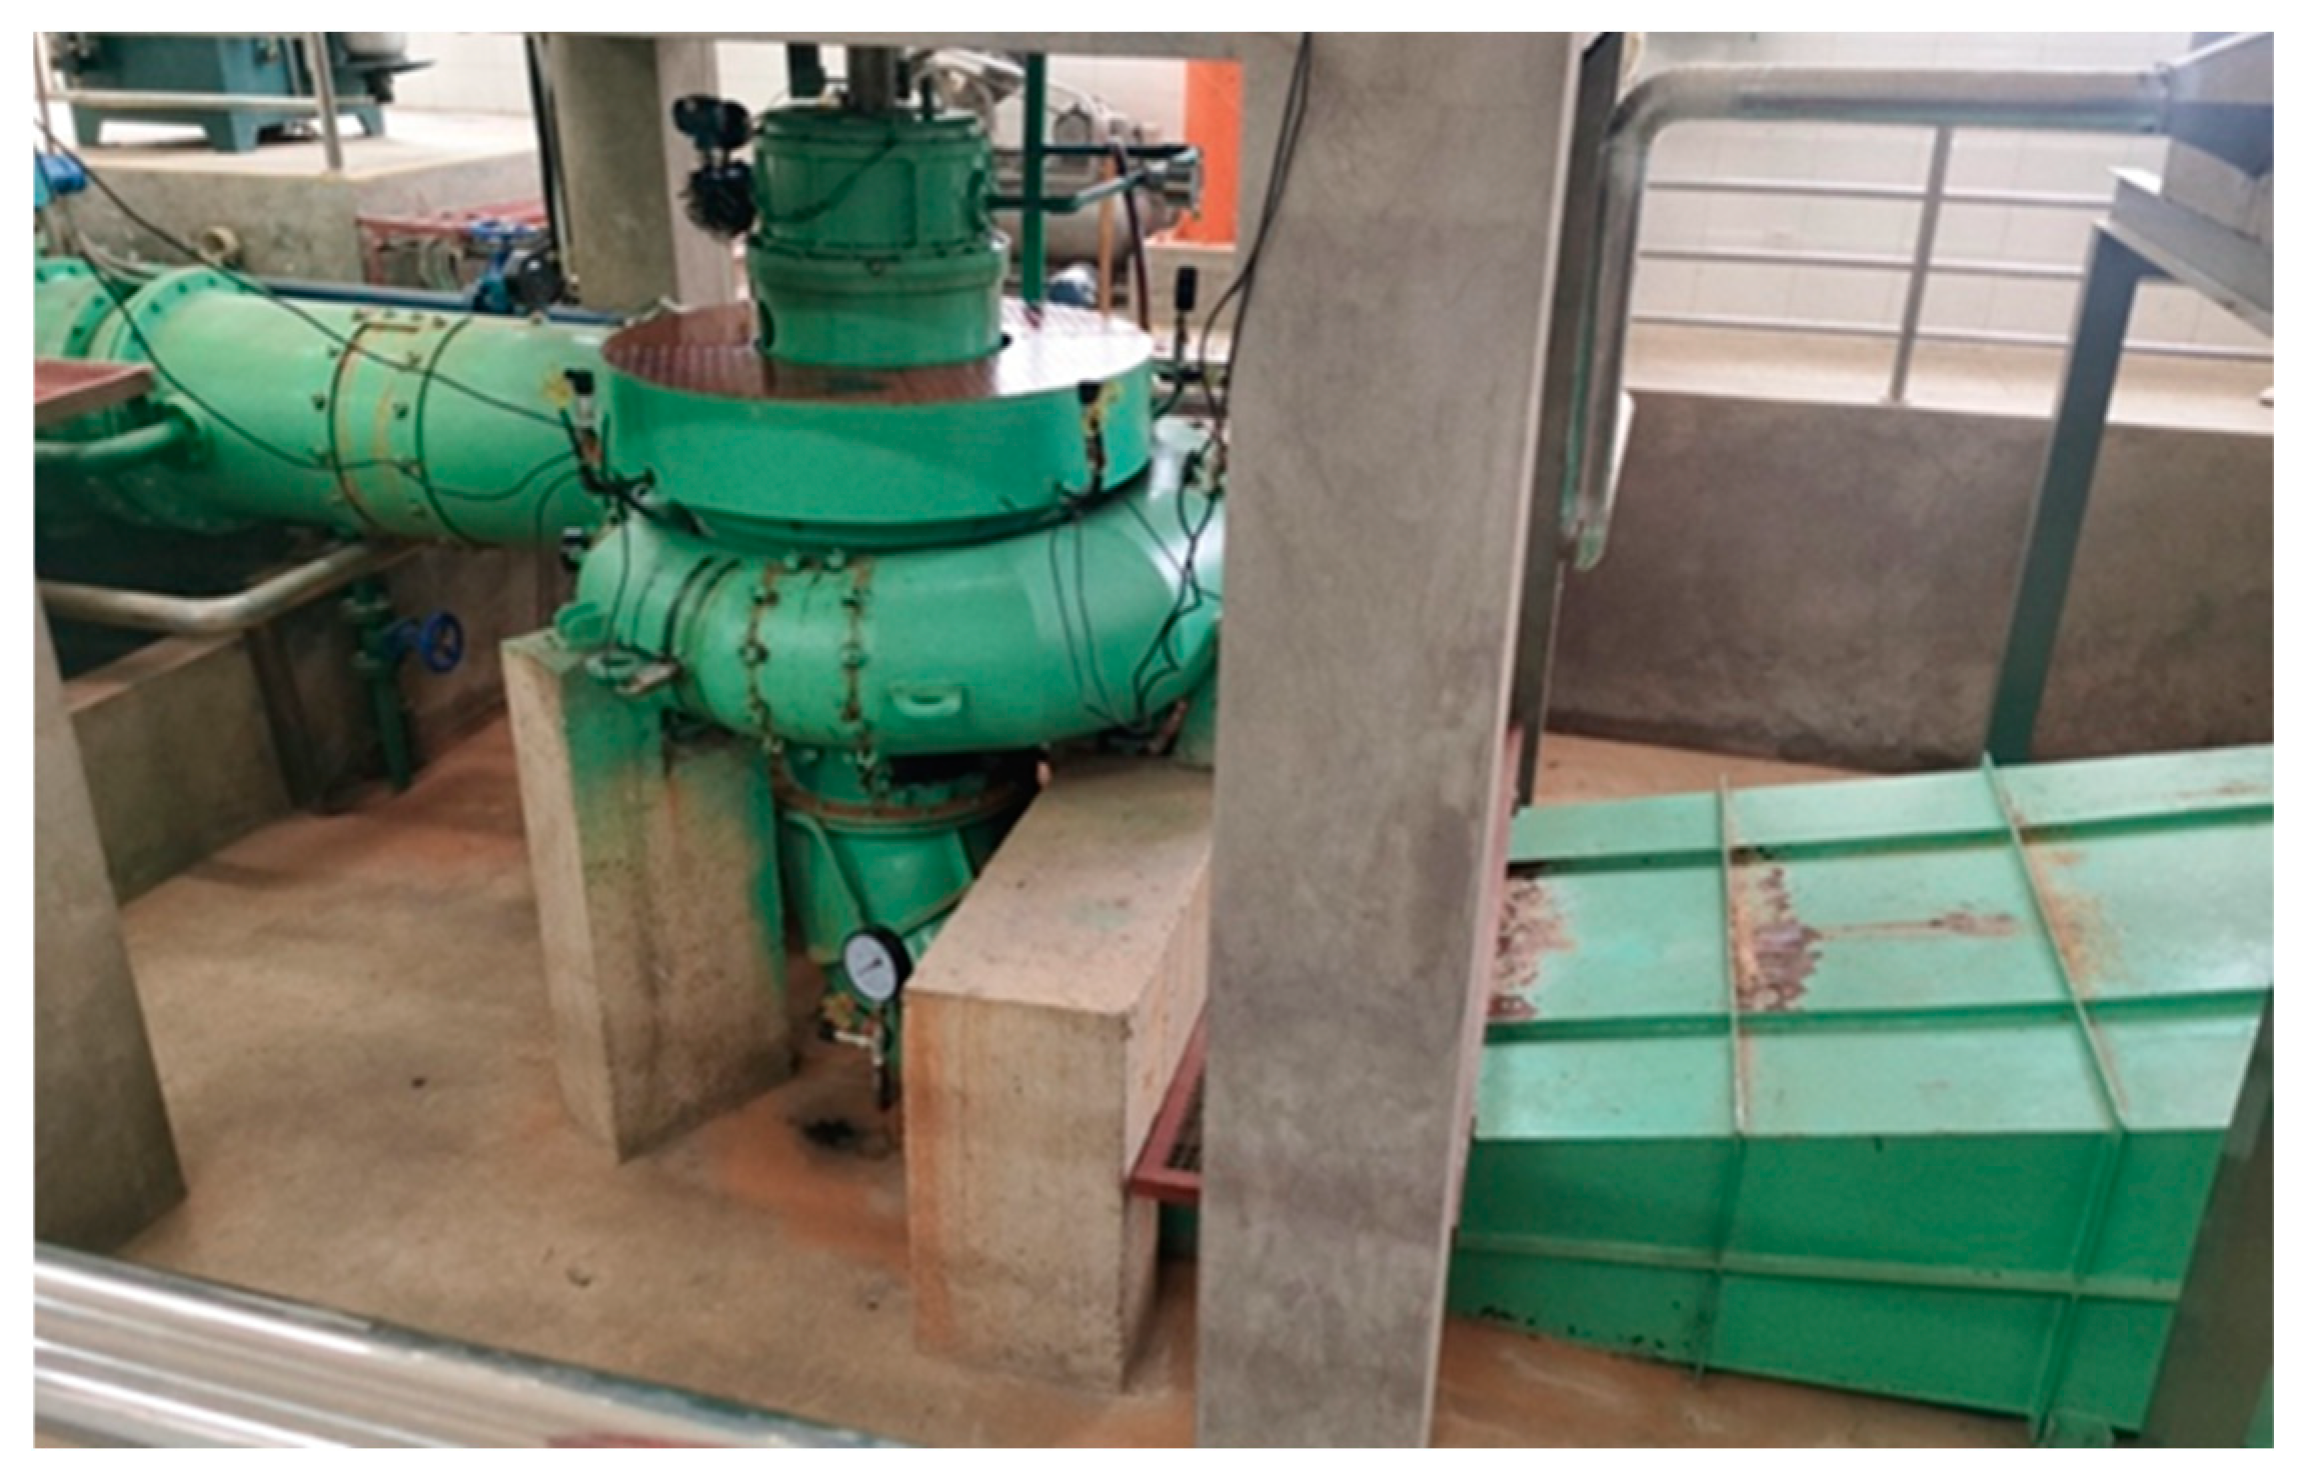
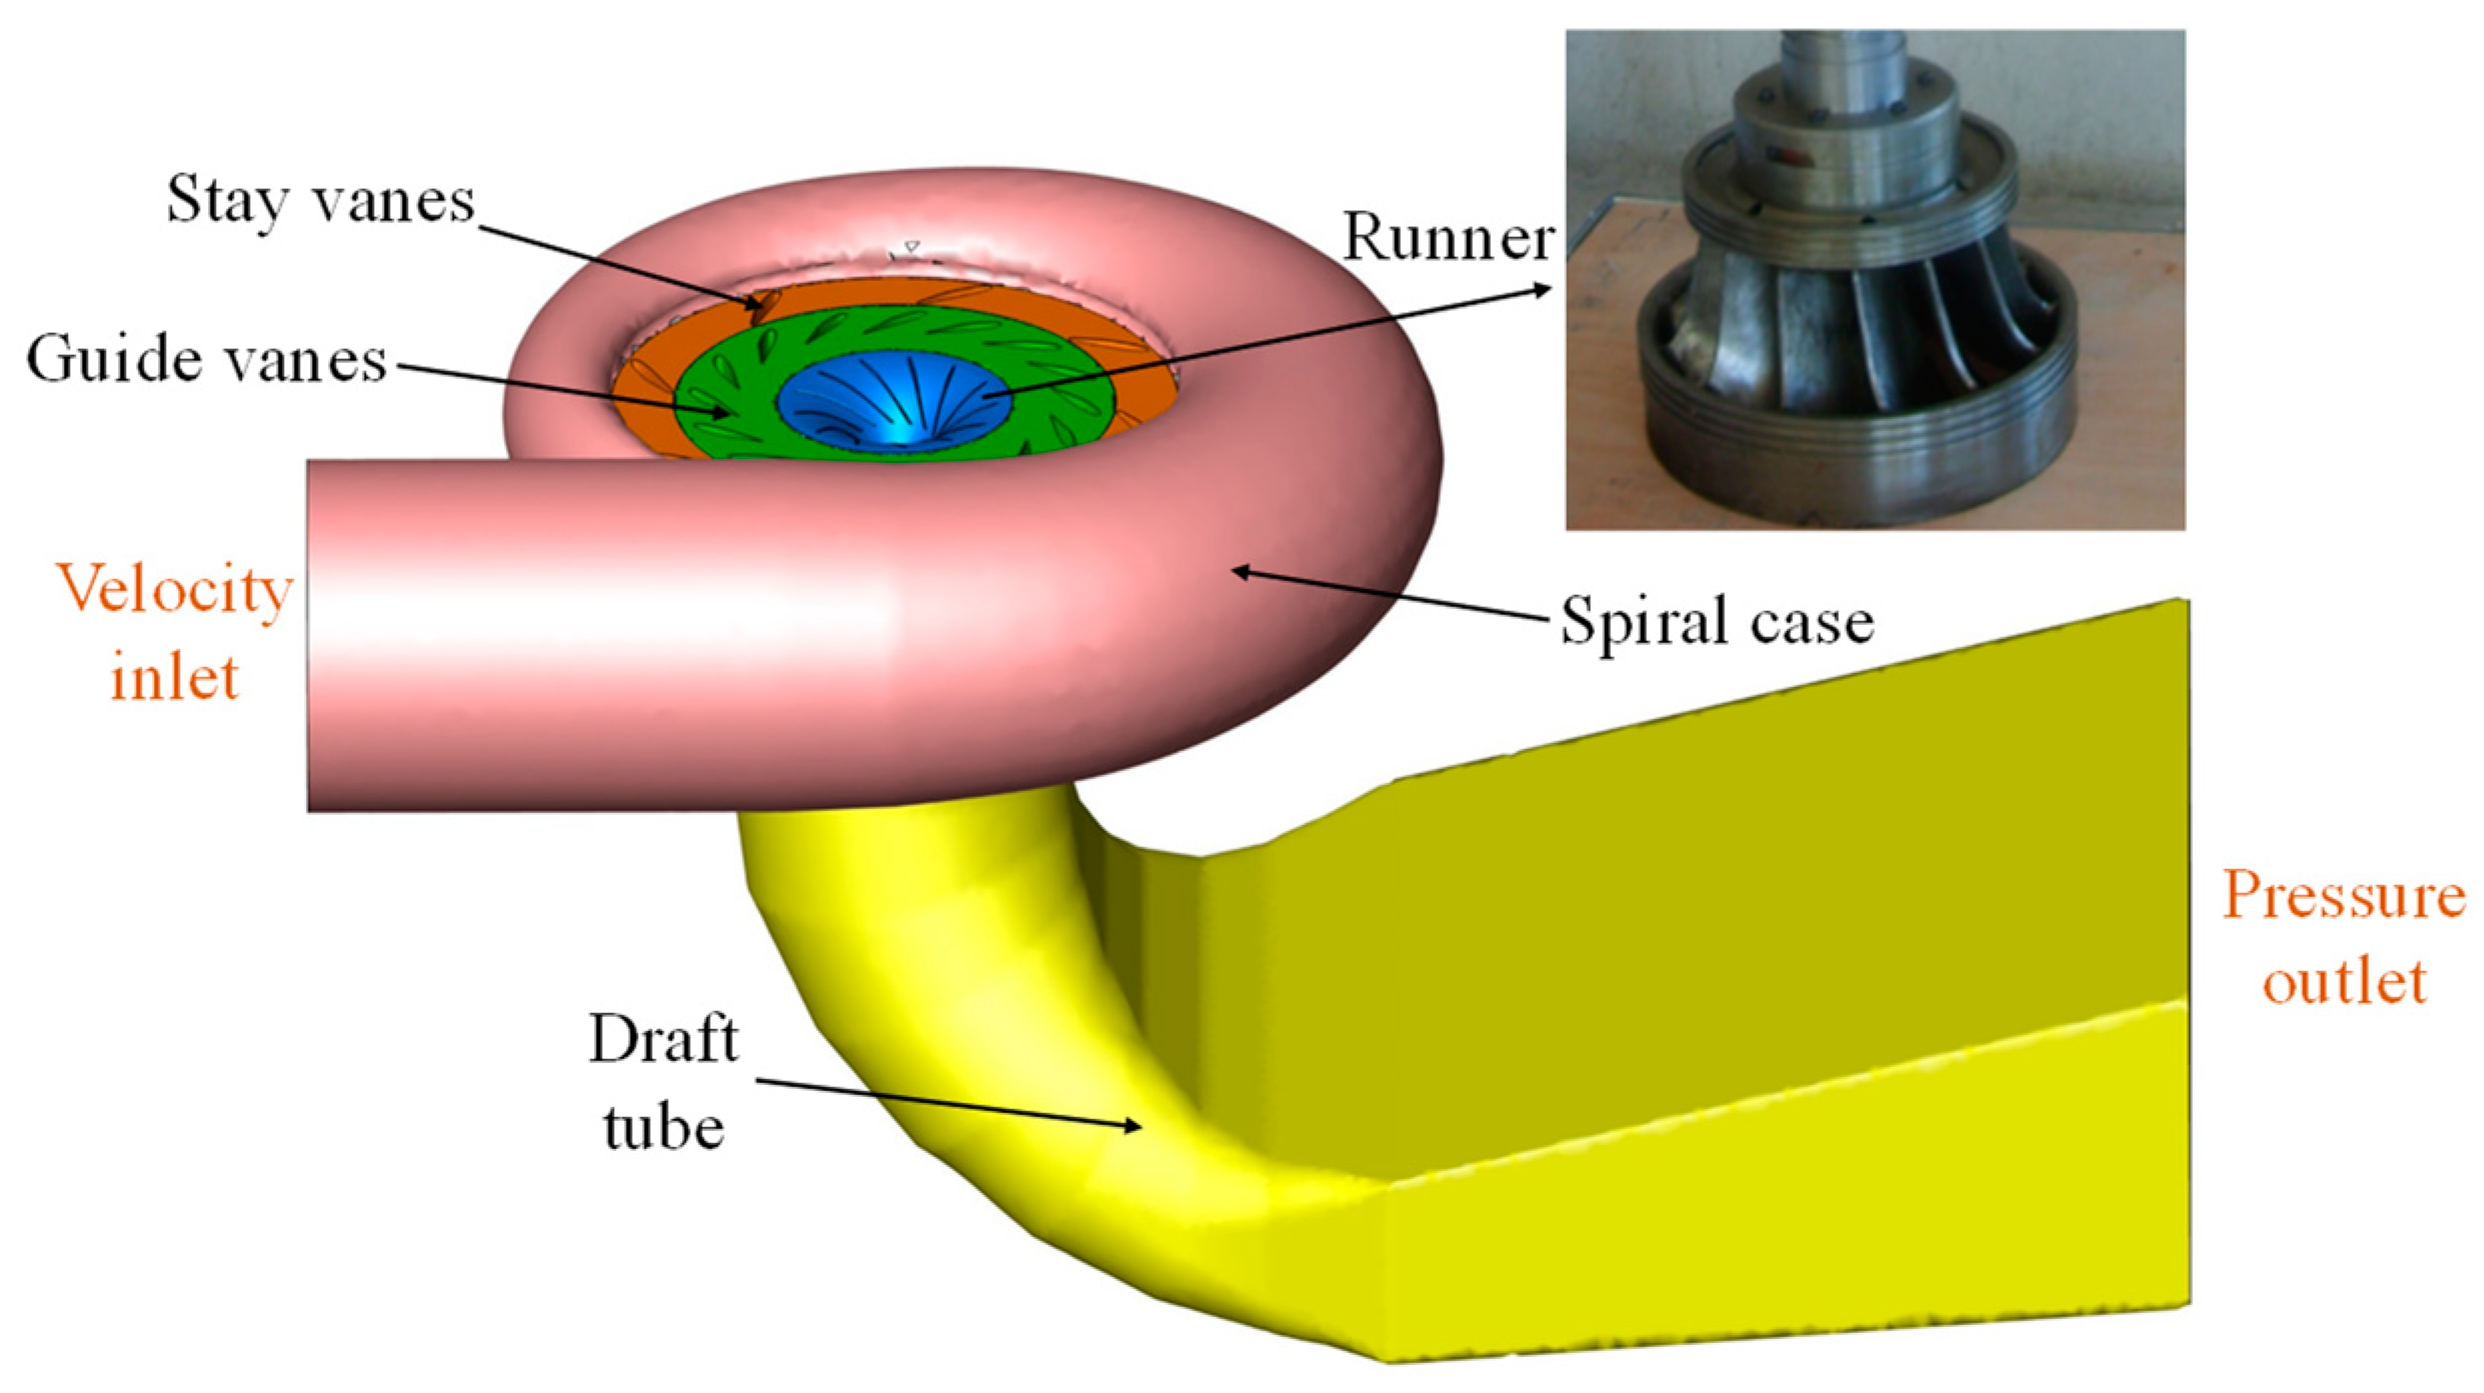
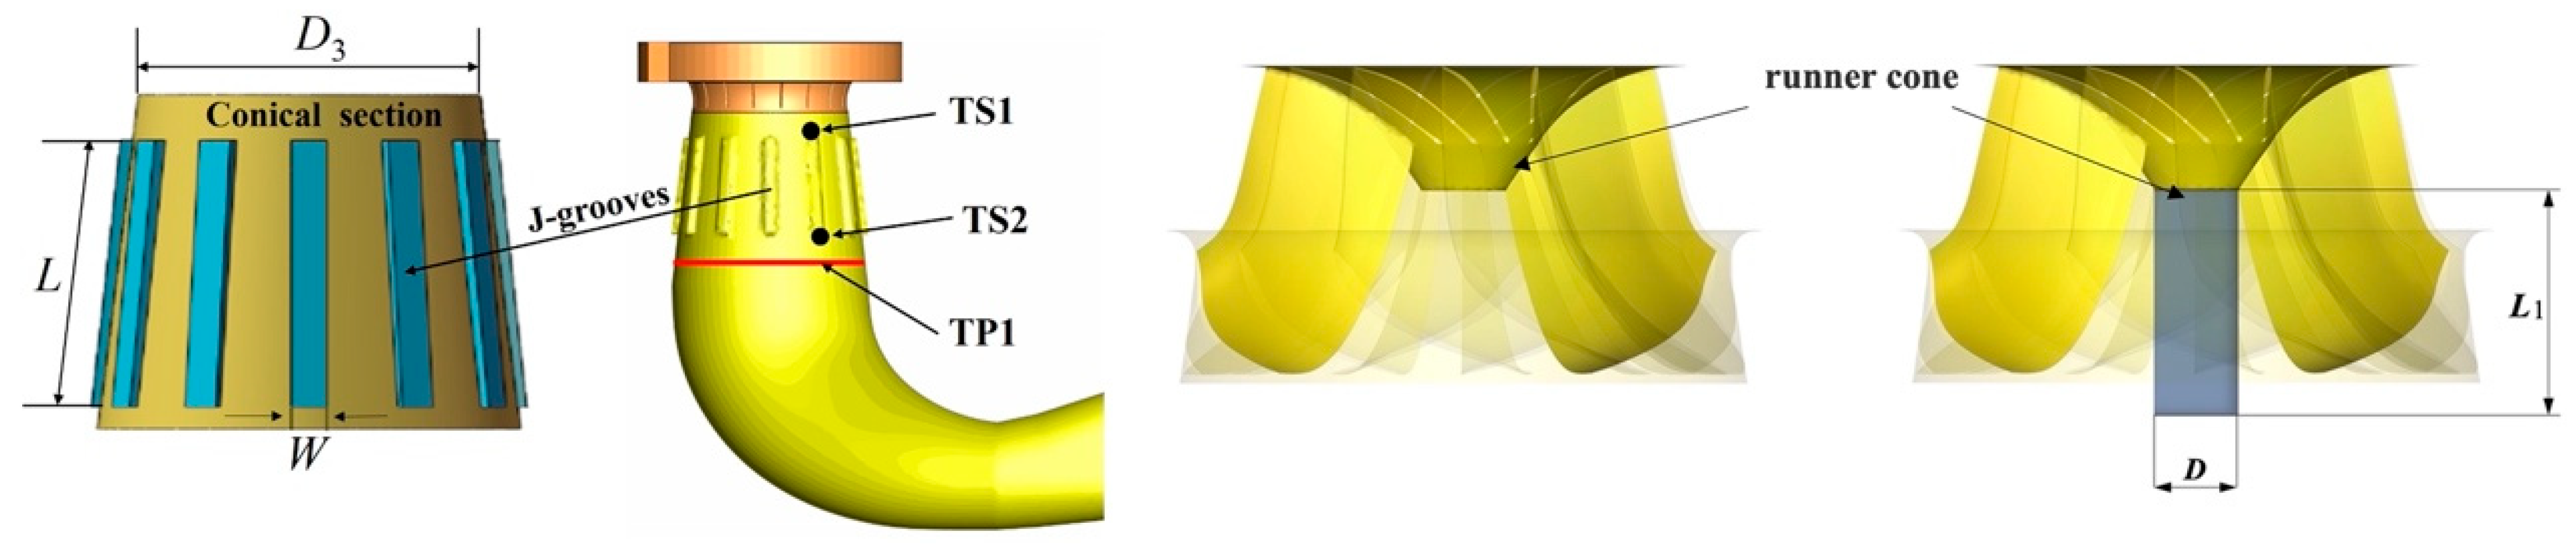
2.1. Francis Turbine Geometrical Model

In this paper, the Francis turbine in the Hydro-Mechanical-Electric Coupling Laboratory of Kunming University of Science and Technology, type HLA551-LJ-43, was taken as the research object, as shown in Figure 1. A geometric model for the whole flow passage of hydro-turbine, which contains a bend draft tube, a spiral case, a stay ring, guide vanes, and a runner with 13 blades, was established. The rated revolution of the Francis turbine nr is 600 rpm, the design flow Qr is 0.7 m3/s, and the design head Hr is 10 m. Under the designed operating condition, the turbine efficiency of the Francis turbine is 92%, and the rated output power is 55 kW. The physical parameters of the prototype are presented in Table 1.

2.2. The Fluid Governing Equations and Turbulent Model

2.2.1. The Fluid Governing Equation

The water flow in a hydro-turbine, which can be regarded as a continuous medium, is basically incompressible turbulent flow [31]. Hence, using the quality conservation principle and the conservation law of momentum is reasonable in describing the flow law of water flow in the Francis turbine [31]. The mass conservation equation is described in Formula (1) [31]:
ρ t + ( ρ u ) x + ( ρ v ) y + ( ρ w ) z = 0
in which ρ is water density (kg/m3), t is time (s), and u, v, and w are the velocity vector components in the three directions, respectively.
The water flow in the turbine flow passage is considered to be a kind of incompressible fluid whose density is constant. The above formula is simplified as:
u i x i = 0
The turbine flow field must also satisfy the momentum equation. That is, the resultant force acting on the fluid element per unit of time is equal to the rate of change of the momentum, which occurs in the action direction of the force. Hence, the momentum conservation equation based on the incompressible fluid is
( ρ V ) t + ( ρ V V ) = ρ F + τ
in which τ = p I + τ * , τ * is the viscous stress tensor, and F is the mass force. Furthermore, the momentum conservation equation turns into the following:
u i t + u j u i x j = p x i + x j ( v u j x j ) + τ i j x j
The premise of solving the momentum conservation equation is the assumption that the water flow is continuously fluid and the physical quantities are differentiable in time and space.

2.2.2. Turbulence Model

The RNG k-ε turbulence model, established using the average and pulsating motion equations, is a typical two-equation turbulence model. It is a set of closed equations used for describing the mean quantities of turbulence. The RNG k-ε model is established by introducing a series of assumptions and relying on the combination of theory and experimental experience. The RNG k-ε model is similar to the Standard k-ε model. However, the RNG k-ε model adds an item to the ε equation to improve the accuracy of high-speed flow. In addition, the influence of the vortex on turbulence is considered, which is used to improve the accuracy of vortex flow [22,32,33]. In this study, the RNG k-ε model was selected to predict the water turbine’s operating performance and flow characteristics. The transportation equations of the RNG k-ε turbulence model are shown in Formulas (5) and (6).
t ( ρ k ) + x i ( ρ k u i ) = x j ( α k μ e f f k x j ) + G k + G b ρ ε Y M + S k
t ( ρ ε ) + x i ( ρ ε u i ) = x j ( α ε μ e f f ε x j ) + C 1 ε ε k ( G k + C 3 c G b ) C 2 ε ρ ε 2 k R ε + S ε
in the equations, the turbulent kinetic energy is represented by k, and the dissipation rate is represented by ε. The dynamic viscosity coefficient of flow is expressed by µeff. The turbulent kinetic energy caused by the average velocity gradient is represented by Gk, and the turbulent kinetic energy generated by buoyancy is represented by Gb. The modification term accounting for buoyancy’s effects on turbulence is expressed by YM. α k is the reciprocal of the adequate Prandtl number of k. α ε is the reciprocal of the effective Prandtl number of ε. The user-defined source terms in the formula are Sk and Sε. C1ε, C2ε, and C3ε are constants, where C1ε = 1.44, C2ε = 1.92 and C3ε = 0.09. According to the elimination process of the scale in RNG theory, the differential equation of turbulent viscosity is derived as follows:
d ( ρ 2 k ε u ) = 1.72 v ( v ) 3 1 + C V d v
v = μ e f f μ
in the equation, the fluctuation constant is caused by fluid diffusion. It is a constant that is expressed by CV, where CV ≈ 100. The scale change of the low Reynolds number generated by turbulent transmission is represented by v . The accurate description, which can reflect how the effective turbulent transport varies with the Reynolds number (or eddy current standard), is obtained by integrating the above equations. Furthermore, the near-wall flow is handled efficiently by the model [34,35].

2.2.3. Entropy Production Theory

The entropy production theory, mainly applied to evaluate energy losses in thermal transmission, is widely used in compressible fluid, but has a few applications in incompressible fluid. Following the second law of thermodynamics, an increase in entropy is always found in an irreversible process, such as fluid flow in a fluid machinery. Furthermore, the increase in entropy is always greater than zero. In the numerical simulation of the internal flow of the Francis turbine, the heat transfer is ignored. Therefore, the fluid’s kinetic and potential energy are irreversibly converted into internal energy by the viscous force in the boundary layer, resulting in an entropy increase [36]. In this paper, the entropy production theory was adopted for the energy loss calculation in the draft tube, and the influence of modification measures on energy dissipation under partial-load conditions is evaluated.
ρ m d s d t = ρ m ( s t + u i s x i ) = 2 μ t T ( u i x i ) 2 + μ t T ( u i x j + u j x i ) 2 3 μ t T ( u ) 2
The entropy induced by the viscous dissipation can be calculated directly [37]. The symbol ϕ represents the viscous dissipation function for an incompressible flow.
ϕ = 2 μ e f f [ ( u 1 x 1 ) 2 + ( u 2 x 2 ) 2 + ( u 3 x 3 ) 2 ] + μ e f f [ ( u 1 x 2 + u 2 x 1 ) 2 + ( u 1 x 3 + u 3 x 1 ) 2 + ( u 2 x 3 + u 3 x 2 ) 2 ]
In turbulent flow, two terms are contained in the LEPR based on Reynolds time-averaged motion [38]. One is named direct entropy production rate, which is induced by time-averaged movement and expressed by S ˙ D ¯ . The other is named turbulent entropy production rate, which is induced by velocity fluctuation and expressed by S ˙ D . Consequently, the total entropy production rate is represented as [39]
S ˙ D = S ˙ D ¯ + S ˙ D
where
S ˙ D ¯ = 2 μ e f f T [ ( u ¯ 1 x 1 ) 2 + ( u ¯ 2 x 2 ) 2 + ( u ¯ 3 x 3 ) 2 ] + μ e f f T [ ( u ¯ 1 x 2 + u ¯ 2 x 1 ) 2 + ( u ¯ 1 x 3 + u ¯ 3 x 1 ) 2 + ( u ¯ 2 x 3 + u ¯ 3 x 2 ) 2 ]
S ˙ D = 2 μ e f f T [ ( u 1 x 1 ) 2 + ( u 2 x 2 ) 2 + ( u 3 x 3 ) 2 ] + μ e f f T [ ( u 1 x 2 + u 2 x 1 ) 2 + ( u 1 x 3 + u 3 x 1 ) 2 + ( u 2 x 3 + u 3 x 2 ) 2 ]
Here, the temperature is expressed by T, and the time-averaged velocities and turbulent fluctuation velocity are respectively represented by ui and ui. The three directions in the Cartesian coordinate system i are 1, 2, and 3. µeff can be calculated through Formula (14):
μ e f f = μ + μ t
in the equation, the laminar dynamic viscosity is expressed by µ, and the turbulent dynamic viscosity is expressed by µt.
Due to our inability to calculate the components of the velocity fluctuation, the entropy production rate caused by the velocity fluctuation cannot be calculated either. The studies of Kock [40] and Mathieu [41] indicate that ε or ω can be correlated with the entropy production rate generated by the velocity fluctuation when the Reynolds number tends to infinity. The LEPR induced by velocity fluctuations can be approximately calculated using the following Formulas (15) and (16):
S ˙ D = β ρ ω k T
Formula (15) represents the LEPR of velocity fluctuation in the k-ω turbulence model. Here, the frequency of turbulent eddy-viscosity with units s−1 is expressed by ω, and the empirical coefficient β, calculated by numerical simulation, equals 0.09.
S ˙ D = ρ ε T
Formula (16) represents the LEPR of velocity fluctuation in the k-ε turbulence model. ρ is the water density, with units kg/m3. T is the water temperature, with units K.

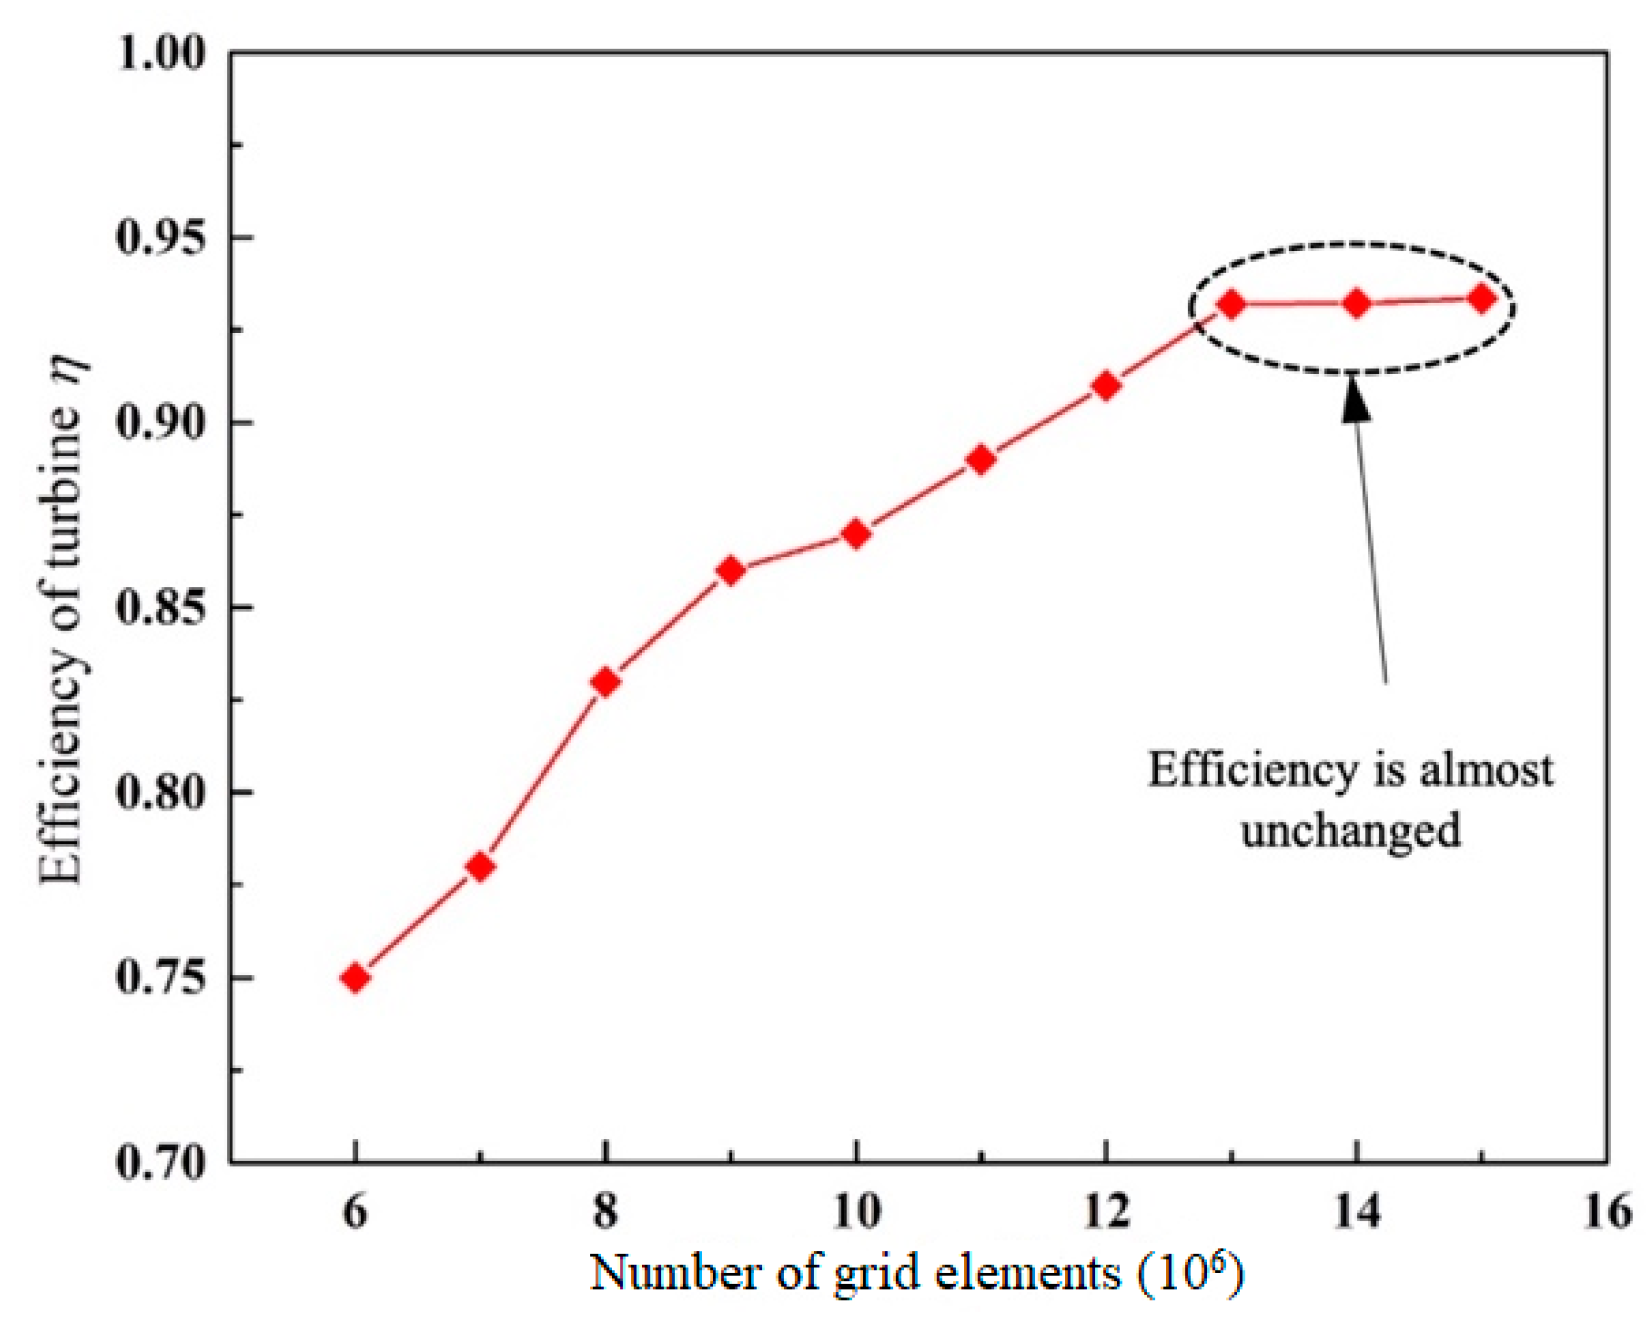
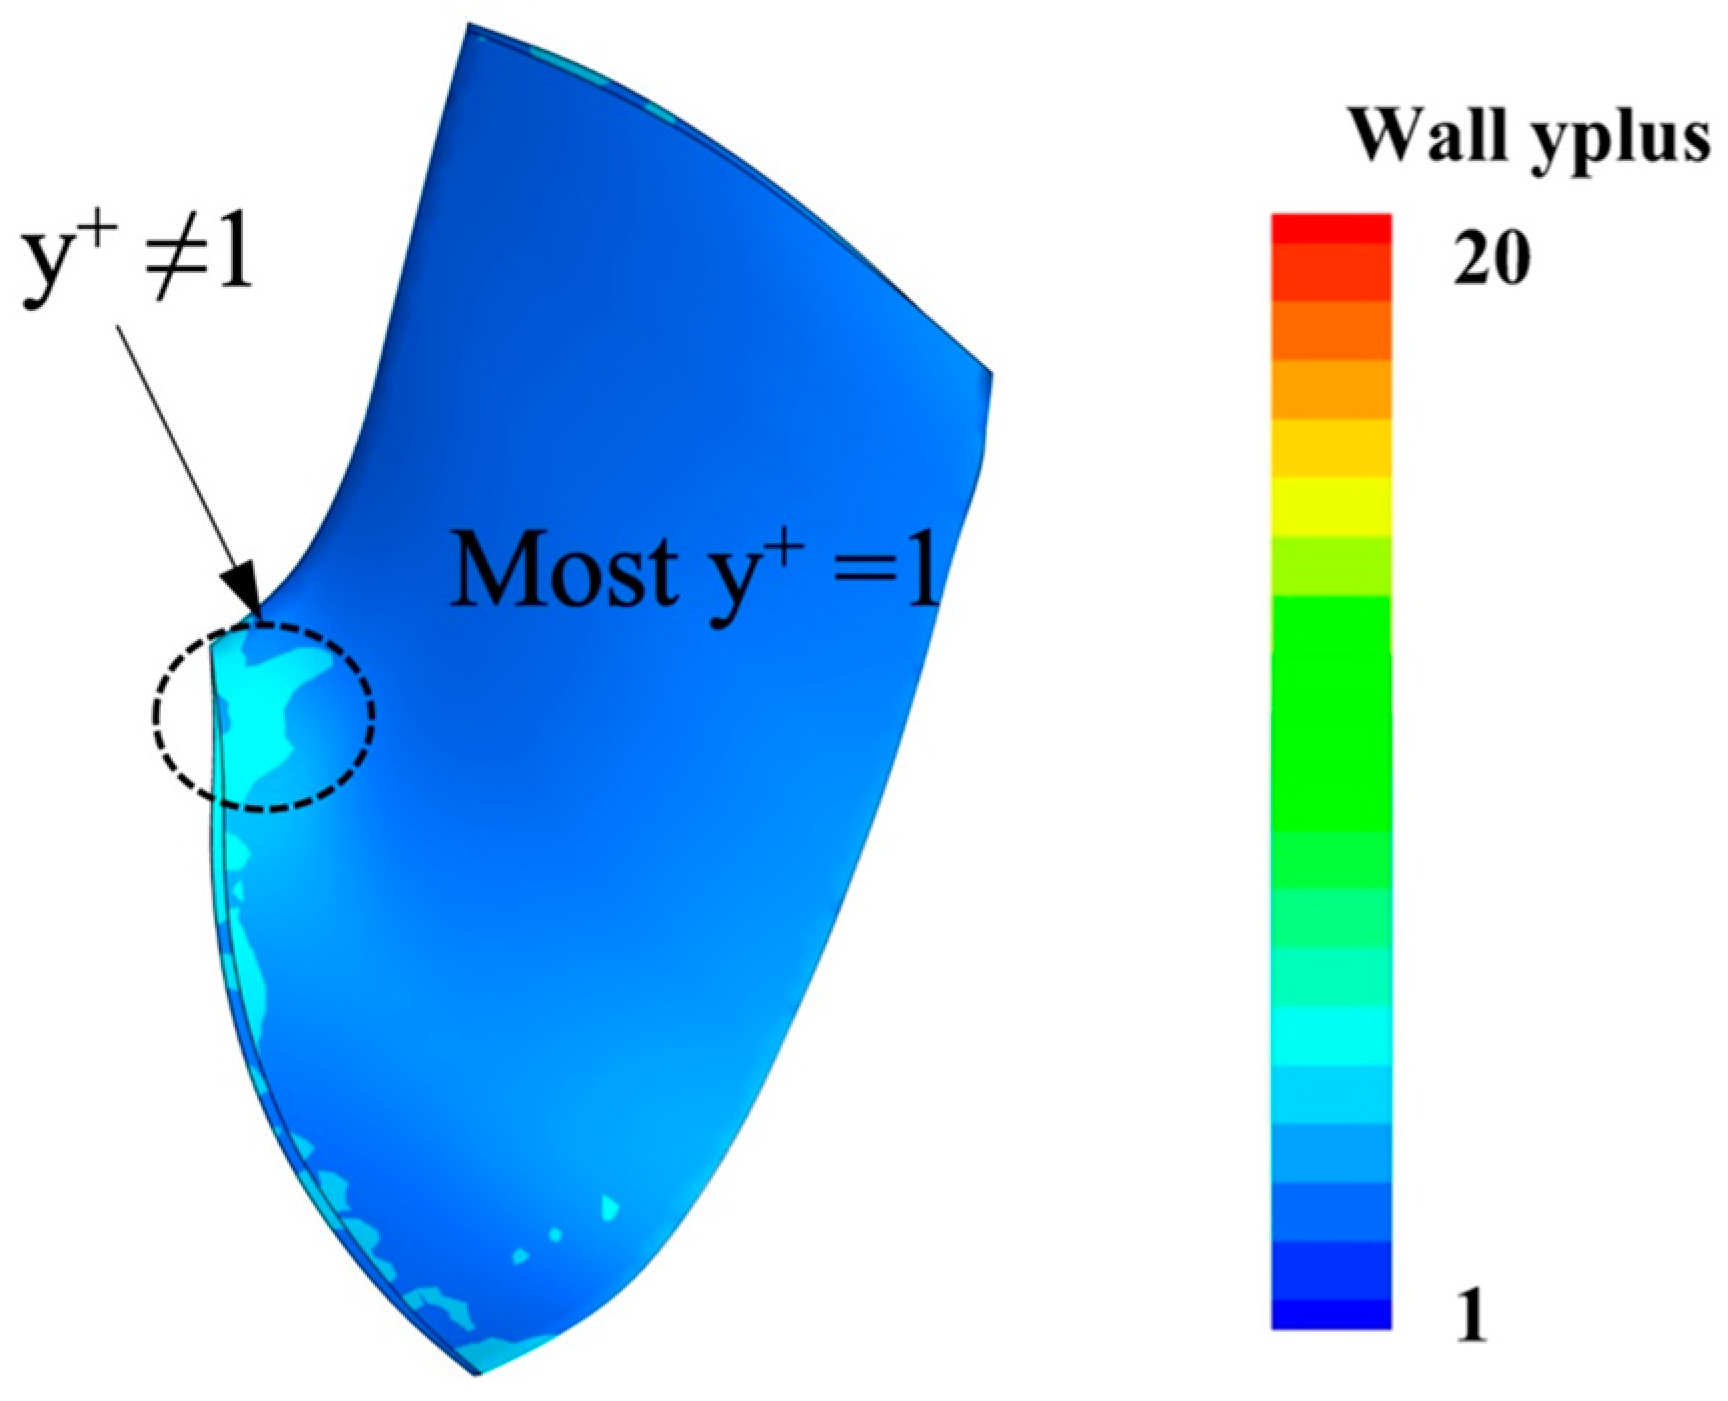
2.3. Computational Domain and Grid Generation

The whole three-dimensional flow passage model of prototype turbine HLA551-LJ-43, as shown in Figure 2, was established using the modeling software SolidWorks 2019. The water enters the turbine at the spiral case inlet, flows through the stay vane, guide vane, runner, and draft tube, and finally flows out from the draft tube outlet. According to the flow characteristics of water flow in the different components above, the structured hexahedral mesh is used to divide the components of the turbine separately. However, the stay vane and the guide vane with similar structures were regarded as a whole when dividing grid. The entire hydro-turbine is simulated by accurately combining each component’s inlet and outlet interfaces.
The grid independence of the whole water turbine is verified to ensure the accuracy and efficiency of the numerical calculation. The turbine efficiency η, which can be calculated by Formula (17), is selected as the judgment standard for grid independence verification.
η = M × 2 π n r 60 × 9.81 Q r H r
where the rotating torque output by the hydraulic turbine shaft is expressed by M with units N·m, the numerical calculation results of rotating torque M are affected by the number of grid elements. The variables such as nr, Qr and Hr are shown in Table 1.
In addition, the efficiency is evaluated by changing the number of nodes under the full load operating condition. As shown in Figure 3, the η is about 92% when the number of mesh elements reaches 13 million, and this has not significantly changed with the increase in the grid elements’ total number. In addition, on account of locating the first layer of grid nodes in the viscous sublayer, the near-wall region needs to be divided into sufficiently fine grids. When the flow parameters are constant, the denser the boundary layer grid is, the smaller the value of y+ is. As shown in Figure 4, when the number of grid elements reaches 13 million, the boundary layer of the turbine blade is dense, the grid is fine, and the average value of y+ node distribution on the blade wall is 1. Through grid independence verification, synthetically considering the calculation accuracy and efficiency, a mesh scheme involving about 13 million grid elements was selected for the turbine calculation domain. The mesh division of each component is shown in Figure 5. The maximum grid size in the runner and distributor domains was set to not exceed 1.5 mm. The mesh size of the blade passage and the near-wall region is controlled to not exceed 0.6 mm. To ensure the accuracy of the laminar flow characteristics in the near-wall region, the boundary layer grid is used to mesh the distributor and runner blade. The minimum height of the first-layer boundary layer grid of the distributor is set to 0.05 mm, and the minimum height of the first-layer boundary layer grid of the runner is set to 0.01 mm. The grids of the spiral case inlet area and the draft tube area are relatively coarse, and the maximum grid sizes are set to 4 mm and 5 mm, respectively. The numbers of mesh elements and nodes of each turbine component are shown in Table 2.
Three structural optimization models of the turbine were established in this study. The three turbine models were based on the prototype turbine HLA551-LJ-43, namely, installing J-grooves on the conical section of the draft tube (W-J), extending the runner cone (C), and installing J-grooves on the conical section of the draft tube while extending the runner cone at the same time (J+C). The numerical calculation results of the above three structural optimization measures were compared with those of the prototype turbine (N-J) to study the effects on vortex suppression and energy dissipation of different structural optimization measures under different operating conditions. The layout of monitoring points and the two optimized structures, the W-J and the C, are shown in Figure 6. Our predecessors assessed the optimal layout of the J-groove in the throat ring of the draft tube. The research results show that 12 J-grooves, evenly distributed along the circumferential direction, was the most suitable number for the turbine HLA551-LJ-43 [42]. Moreover, the length L of each J-groove was 120 mm, and the width W of each J-groove was 10 mm. The draft tube’s inlet diameter has been represented by D3. For the optimization measures of extending the runner cone, the outlet section of the prototype runner cone was extended with a section diameter D of 30 mm and an increased length L1 of 88 mm. The prototype and three kinds of turbines with optimized structures are shown in Table 3. Two monitoring points (TS1, TS2) and one monitoring surface (TP1) were set up on the throat ring of the draft tube to analyze the changes in pressure and vortex intensity before and after the water enters the J-grooves. The monitoring surface TP1 was the exit surface of the throat ring of the draft tube.
The water flow in the whole passage of the water turbine was regarded as incompressible. The velocity inlet at the spiral casing entrance and the static pressure outlet at the draft tube outlet were taken as the boundary conditions. According to the known inlet flow of the water turbine, the spiral case’s inlet velocity was calculated using Formula (18). The flow ratio of the inlet and outlet of the draft tube is difficult to calculate owing to the uncertainty of water flow in the draft tube. Therefore, the outlet pressure of the draft tube was considered the standard atmospheric pressure, as shown in Formula (19).
V i n l e t = Q T π ( D 0 / 2 ) 2
P o u t = 1.01 × 10 5 P a
where D0 represents the inlet diameter of the spiral case.

3. Results and Discussions

Different degrees of vortex rope will be generated in the draft tube when the water turbine is operated under partial-load conditions, especially at 0.5 to 0.75 times the design flow. The low-frequency pressure pulsation will be induced by the vortex rope, resulting in hydraulic instability in the hydro units, thus affecting the safety operation of the hydro units [43,44,45]. Therefore, numerical simulations were carried out for the three structural optimization schemes. Two typical operating conditions, DPL (the corresponding flow ratio Q* is 53%, Q* = Q/QBEP, QBEP is the discharge on the best efficiency point) and PL (the corresponding flow ratio Q* is 69%), on which the vortex rope easily generates were chosen. The effects of each optimized structure’s vortex suppression and energy dissipation on turbine operation under partial load conditions were analyzed from the spiral case’s three aspects of pressure pulsation, vortex shape, and energy loss.

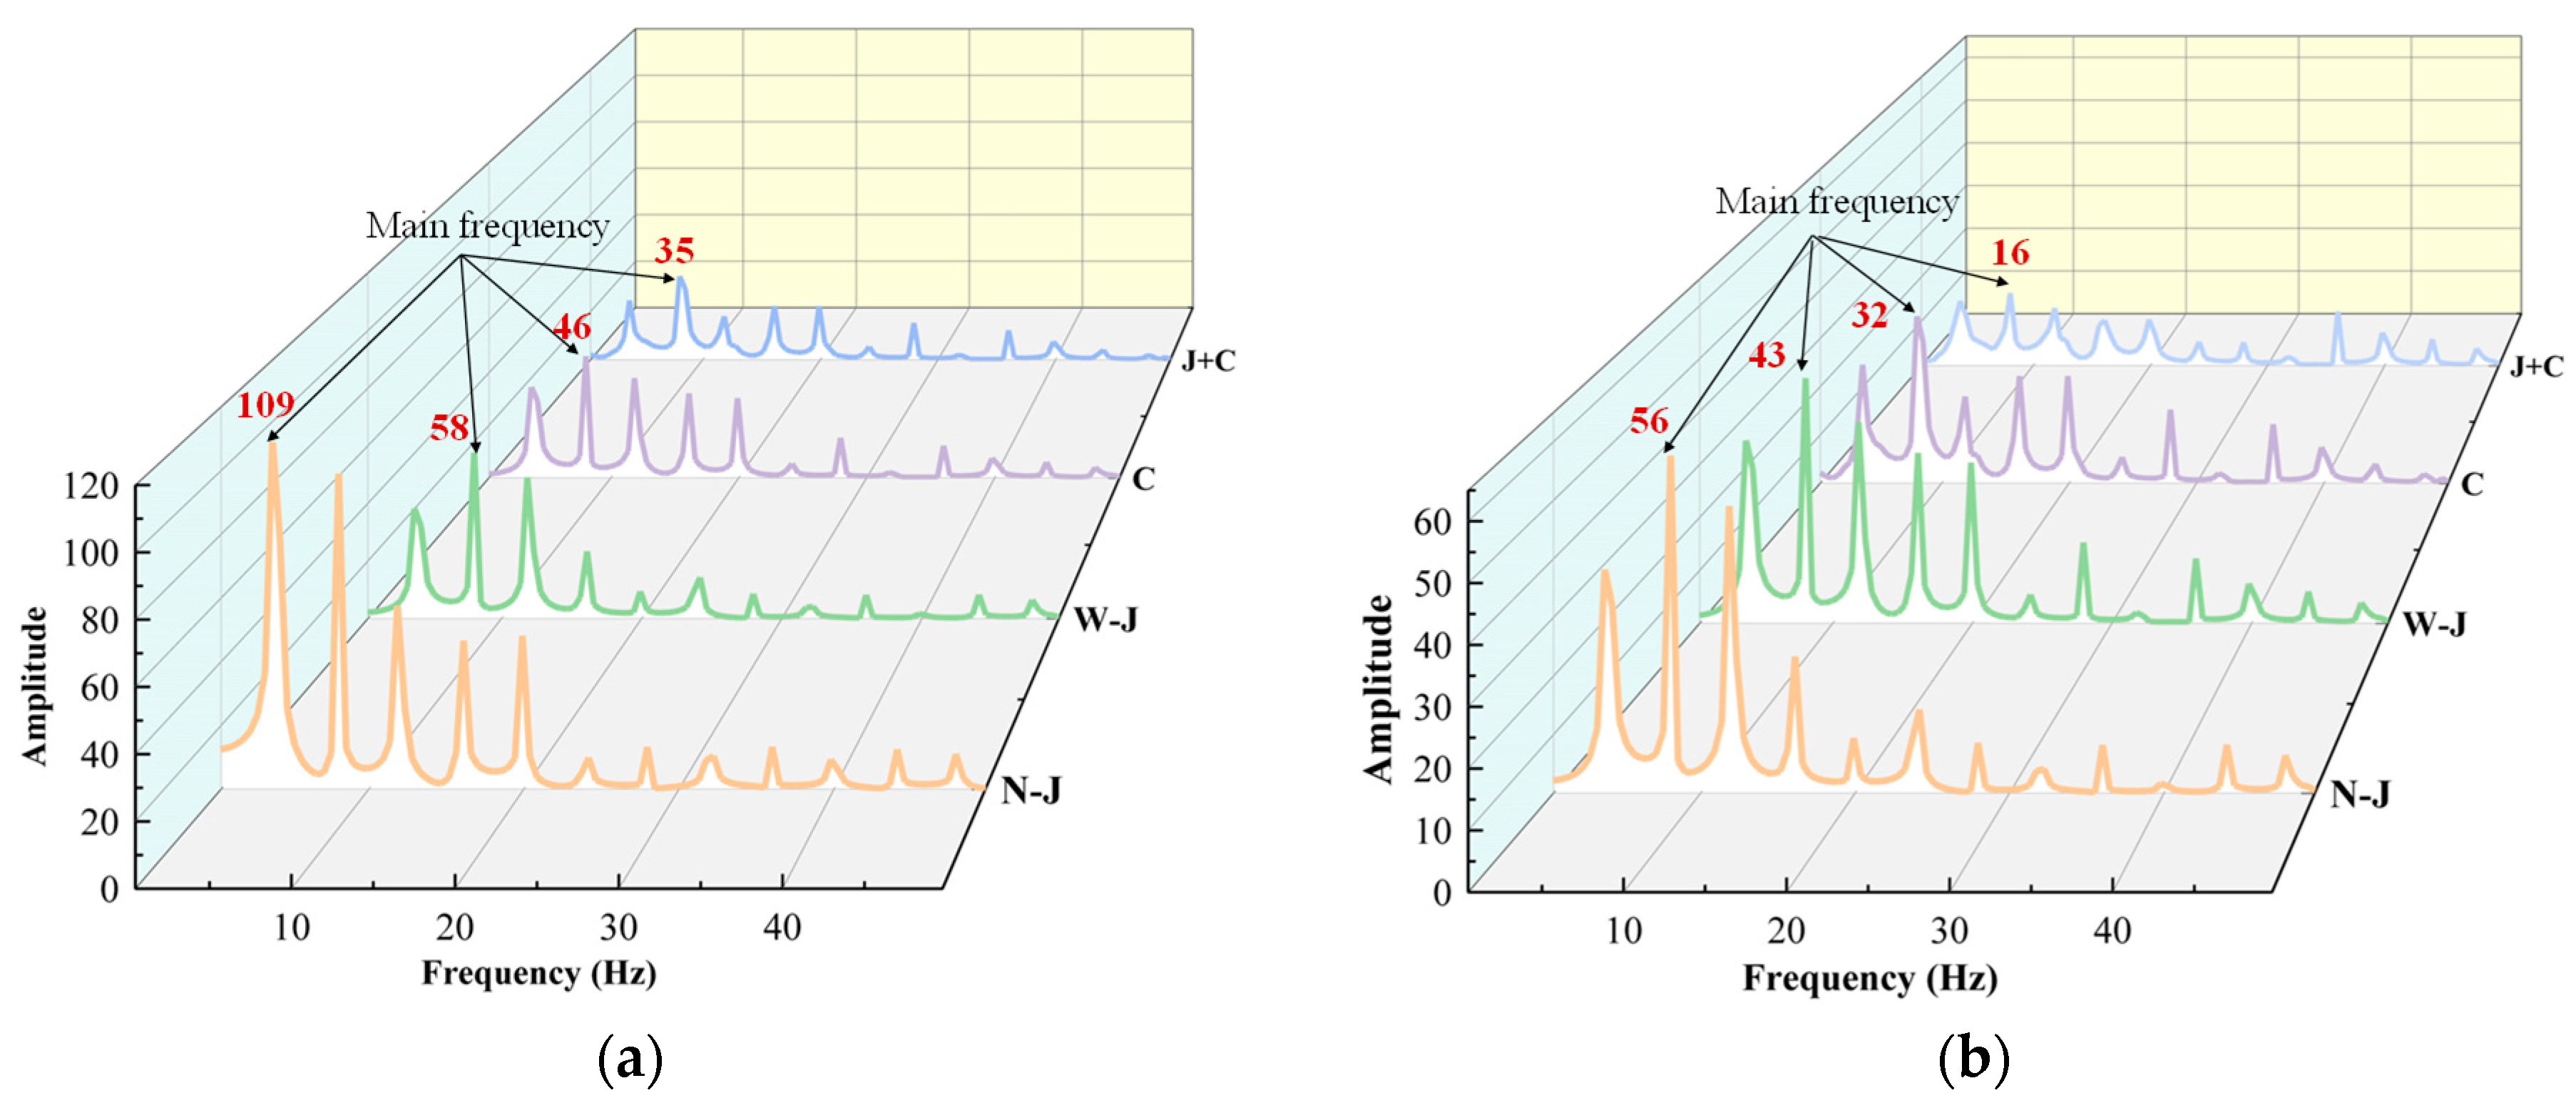
3.1. Pressure Fluctuation Analysis

When operating under partial load conditions, an eccentric rotating pressure will form in the draft tube, which is caused by the superimposition of the rotating pressure field of the vortex and the pressure field of the water flow [4,46]. The eccentric rotating pressure leads to the generation of the pressure pulsations on the draft tube wall. The pressure pulsation amplitude increases with decreasing distance between the pipe wall and the lowest pressure point [4,47]. Consequently, it is of guiding significance for the operation stability of turbines with different degrees of structure optimization to study the amplitude and distribution characteristics of the pressure fluctuation in the draft tube, capture the spectrum characteristics of the pressure fluctuation, and explore the changes of the axial velocity and circumferential velocity of the water flow in the straight cone section of the draft tube.
In Figure 7, the pressure fluctuation in the draft tube under two partial load conditions (the DPL and the PL) is shown. The simulation models are the prototype N-J and the three structural optimization models W-J, C, and J+C. Figure 7 shows that the draft tube pressure of the four hydro-turbine models changes periodically. However, the amplitude and pulsation period of each pressure pulsation is different. Under the DPL condition, the pressure pulsation amplitude of N-J is the maximum. The peak value of the pressure pulsation of N-J is about 56,500 Pa, which is higher than those of the three optimized structures. The pressure pulsation amplitude of the W-J model is higher than that of the C and J+C models. Moreover, the pressure pulsation phase of the W-J model is consistent with that of the N-J model. Overall, the pressure in the draft tube of the J+C model changes most gently with time, and the pulsation amplitude is about 1000 Pa, the lowest among the four kinds of turbine models. Figure 7b shows that the pressure fluctuation ranges of W-J, C, and J+C models are basically consistent under PL conditions. However, the pressure fluctuation amplitude of the N-J was significantly higher, with a value of 250 Pa, than the three structural optimization turbines. In addition, the pressure fluctuation phase of the draft tube’s vortex rope could not be changed when the J-grooves were added to the straight cone section under the same operating conditions. It can be seen that the three structural optimization measures of installing J-grooves on the throat ring of the draft tube, extending the runner cone, and simultaneously installing J-grooves on the conical section of the draft tube and extending the runner cone could significantly reduce the pressure fluctuation amplitude in the draft tube of the hydraulic turbine under partial load conditions. Among the three structure optimization measures, the pressure fluctuation amplitude of the J+C model is the smallest, and the change with time is the smoothest. The finding that the J+C optimized structure is the most beneficial to the stable operation of the hydro unit is obtained.
The pressure fluctuation spectrogram in the draft tube of the prototype N-J and the three structural optimization models named W-J, C, and J+C under DPL and PL conditions are shown in Figure 8. It is found from the spectrogram that under the two operating conditions, at monitoring point TS2, the main frequency of the prototype is 4 Hz, and the main frequencies of the three structural optimization models are between 7 and 9 Hz. It can be concluded that the main frequency of pressure pulsation has modifying effects on the draft tube. The prototype spectrum peak is the highest, and the spectrum peaks are remarkably decreased after modification. Under the DPL condition, the primary frequency amplitude reduces from 109 in the N-J model to 35 in the J+C model. The same change trend also occurs under the PL condition, whereby the main frequency amplitude also decreases from the 56 of the N-J model to the 16 of the J+C model. In detail, the main frequency amplitude of the W-J is reduced by 40–55% compared with the N-J, the main frequency amplitude of the C is reduced by 55–70% compared with the N-J, and the main frequency amplitude of modified J+C is reduced by 65–80% compared with the N-J. Hence, it can be determined that the three modification measures impact the primary frequency of the pressure fluctuation in the draft tube. Moreover, the J+C model with two optimized structures simultaneously reduces the pressure spectrum peak to the greatest extent, especially under deep partial load conditions; the improvement is better than that seen under partial load conditions. Therefore, the J+C structural optimization measure not only improves the operating conditions of the hydro unit, but also expands its stable operation range.
Vu represents the circumferential velocity component when the water flows through the water turbine, and Vz represents the axial velocity components. The two kinds of velocity components of the water flow under the two partial load conditions, the DPL and the PL, are compared in Figure 9. The magnitude and distribution of the two velocity components change with different working conditions in the draft tube, as shown in Figure 9. Under the PL condition, at the center of the monitoring surface TP1, or r/R = 0, the circumferential velocity Vu is approximately equal to 1. Under the DPL condition, the circumferential velocity Vu at the same position is approximately equal to 3. This means that an apparent eccentric vortex appeared in the draft tube under DPL conditions. Compared to the N-J, the countercurrent in the central region increased with the increase in the axial velocity near the draft tube wall. When the water flow on the draft tube wall is mixed with the main water flow, the axial velocity in the central region is almost the same as that in the model with no J-grooves. The Vu in the straight cone is smaller than that when the J-grooves are not installed. The water flow in the draft tube without the J-groove has obvious eccentricity, especially under the DPL conditions. When r/R = −0.25, the circumferential velocity Vu is reduced by about 1 m/s compared with the N-J. This means that the J-grooves can effectively reduce the circumferential velocity component Vu. For a draft tube with or without J-groove, the change of axial velocity Vz is not significant. From Figure 9, it can also be seen that, due to the suppression of part backflow in the throat ring of the draft tube by extending the runner cone, the values of axial velocity Vz near the center of the straight cone section of the two optimization models, C and J+C, are greater, and can reach the maximum value 0.8 m/s. Under the guidance of the runner cone, the suppressed water flows along the axial direction, increasing the axial velocity Vz. Nevertheless, near the near-wall region, there is no noticeable difference in water flow in the draft tubes of the four hydro-turbine models. Significantly, the circumferential velocity Vu was decreased most when the J+C optimized structure was adopted. This shows that extending the runner cone by installing J-grooves on the throat ring of the draft tube in the meantime imparts the water flow in the section center with a higher axial velocity and a lower circumferential velocity, suppresses part of the backflow and weakens the eccentric vortex, which has the best effects on vortex suppression.

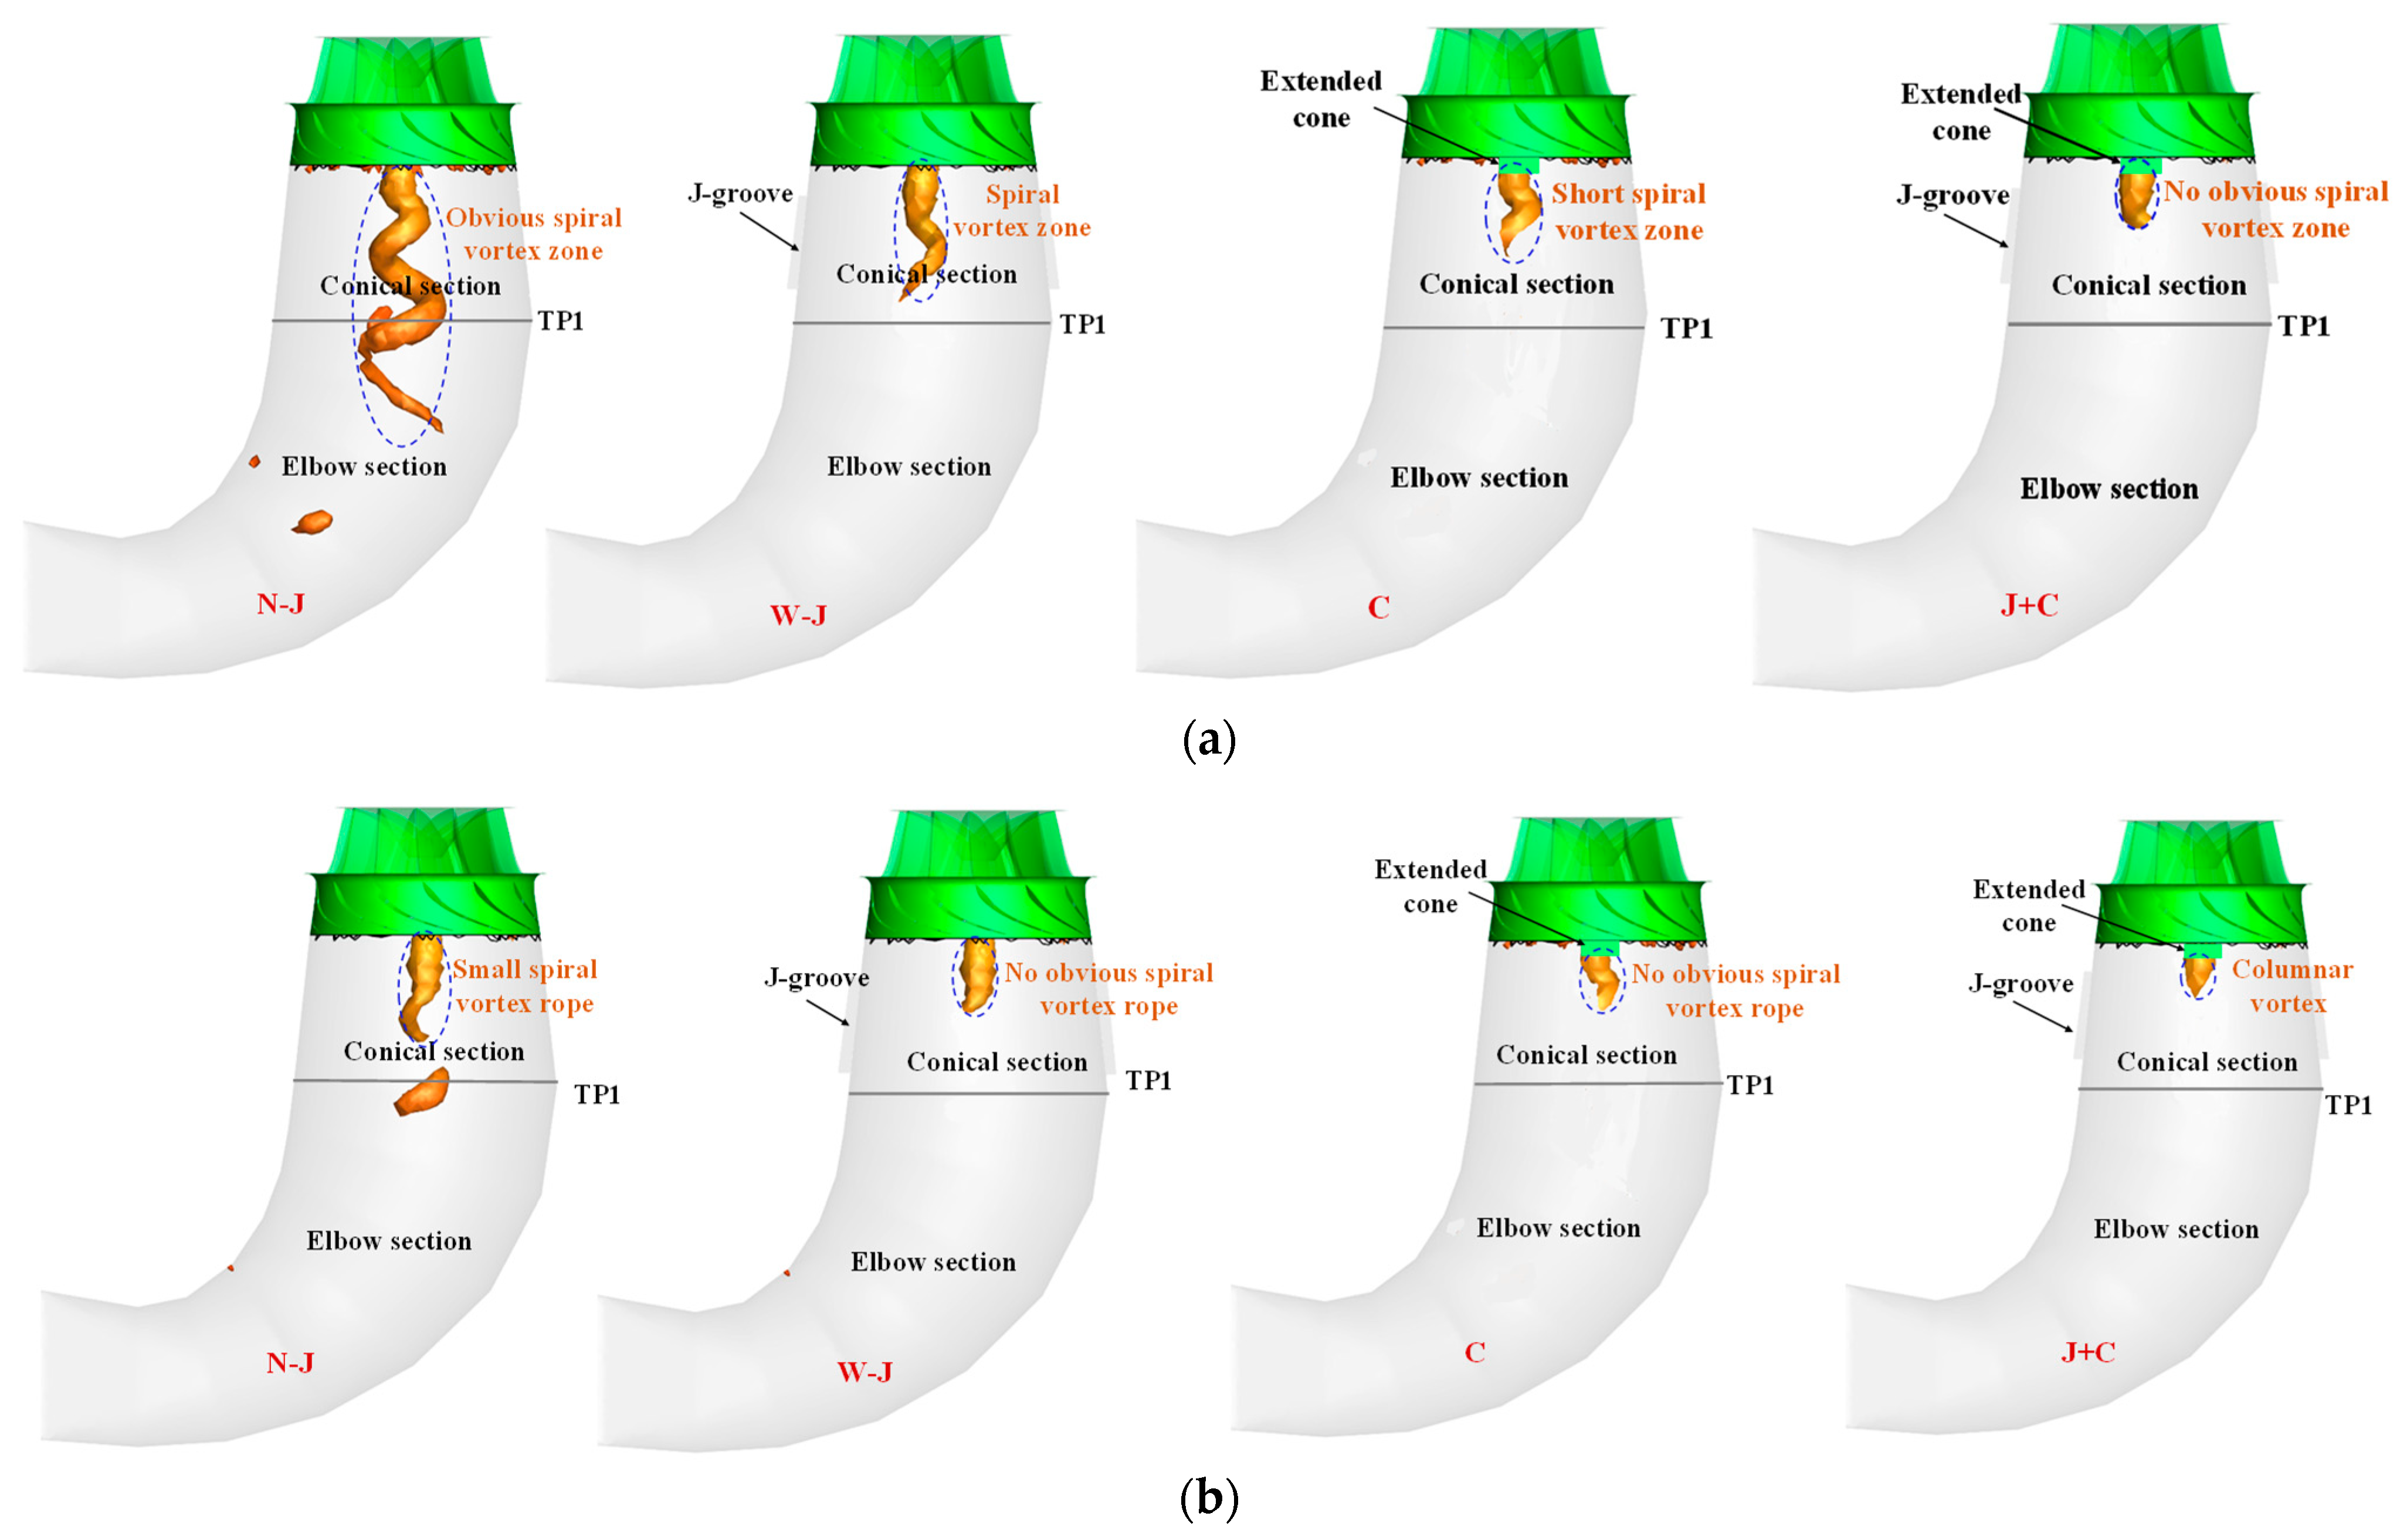
3.2. Analysis of Vortex Rope Morphology

Under off-design operating conditions, the water flow at the runner outlet produces a significant circumferential velocity component extending to the draft tube. A rotary vortex rope in the draft tube is generated by circumferential and axial velocity components [4]. Moreover, the vortex rope is considered the major contributor to pressure pulsations, which causes the vibration of the hydro unit. Thus, studying the vortex suppression effect of different optimized structures is essential. The vortex rope morphology in the draft tube of the three optimized models under the two partial-load conditions is shown in Figure 10.
Figure 10 shows that the less the water turbine deviates from the design operating condition, that is, the PL operating condition, the weaker the spiral vortex. This shows that with increases in the load, there will be a reduction in the circumferential velocity component of the water flow at the runner outlet, and the vortex rope weakens. In the meantime, the vibration of the hydro unit caused by pressure pulsation decreases. Compared with the prototype turbine N-J, under DPL and PL operating conditions, the length of the draft tube vortex rope of the W-J and C models is a little different. When the J+C optimized structure is adopted, there is no prominent spiral vortex rope in the throat ring of the draft tube, and the vortex suppression effect is the best. Especially under the Q* = 69% condition, the water flow at the runner outlet will be an approximately columnar vortex, close to the outflow pattern under optimal working conditions, and the hydro unit will show steady performance. The reason is that the disorder of the water flow discharged from the runner is reduced by the conduction of the runner cone extension and J-grooves; with the increase in the axial velocity of water flow, the vortex intensity and the circumferential velocity component at the runner outlet decrease. Most of the water flow, which joins the main flow and flows out of the draft tube, has an apparent axial movement trend. The remaining water flow enters the backflow region, participating in the movement of the backflow region, the return flow region, and the dead water region. The rotating water flow gradually evolves into a vortex rope, but the length and eccentricity of the vortex rope decrease.
The streamlines of section TP1 of the draft tube under DPL working conditions are shown in Figure 11, which can be used to evaluate the vortex suppression effects of different optimized structures on the draft tube. It can be seen from Figure 11 that the water flow in the draft tube of the prototype and the turbines with optimized structures have a definite circumferential velocity under DPL and PL working conditions. Under the DPL operating condition (as shown in Figure 11a), when the water turbine is in the middle opening area, the pressure pulsation amplitude of the vortex rope in the draft tube is vital, and causes the vibration and swing amplitude of the hydro unit to be increased, bringing significant security risks. There is an apparent eccentric vortex core in the return flow region of the prototype turbine. With the installation of J-grooves or runner cone extension, the water flow in the throat ring of the draft tube will have no pronounced eccentricity on the TP1 section. Moreover, the water flow forms a particular circulation under the action of the circumferential velocity and intensively flows down under the action of the axial velocity. The streamlines on section TP1 are more uniform and symmetrical for the water turbine, showing two modification measures simultaneously. The streamlines near the axis, the center of the outflow, are denser. The streamlined density around the wall is consistent, and no prominent vortex structure exists. Under the DPL operating condition, as shown in Figure 11b, the eccentric vortex structure in the draft tube of the prototype turbine is weakened compared with the DPL condition. However, the streamlines of section TP1 are not uniform. With the installation of J-grooves or runner cone extension, the water flow in the straight cone section of the draft tube still shows inconspicuous eccentricity on the TP1 section, and the streamline generated by the backflow is basically in the center position. The tight streamline is formed under high flow velocity, and the streamline around the wall tends to be consistent. Especially for a turbine with two modification measures introduced simultaneously, there is no prominent vortex structure, the cross-section streamline is more uniform and symmetrically distributed, and there is no water flow around the wall. The formation and development of the vortex rope could be effectively suppressed by adding J- grooves and lengthening the runner cone simultaneously.

3.3. Analysis of Energy Loss

There will be an increase in energy loss in the draft tube caused by the water backflow, pressure pulsation, vortex rope, flow separation, and so on, when the Francis turbine is operated under optimal conditions [47,48]. In the past, the traditional differential pressure assessment method has been used to measure energy loss. However, the location of high hydraulic losses cannot be accurately determined by the traditional differential pressure assessment method [47]. The coefficient of head loss calculated by the local entropy production rate (LEPR) is more similar to the true value of the flow loss compared to the traditional differential pressure assessment [47,49]. Accordingly, the energy changes caused by different modification measures during vortex rope suppression under the DPL condition are evaluated based on the entropy production theory. The calculation results are shown in Figure 12. In Figure 12, one monitoring surface named Section 1 is set below the runner cone. The other monitoring surface, named Section 2, is set at the throat ring of the draft tube. The energy losses of the runner and the throat ring of the draft tube were observed quantitatively in the two above sections.
In Figure 12a, we can see that the water flows into the runner with a large angle of attack on the blade under the DPL condition, and the circumferential component at the runner outlet is greater. So, a sizeable hydraulic loss is produced for the above two reasons. In addition, in the figure, a robust high LEPR near the runner blades and at the walls a1 and b1 of the throat ring of the draft tube can be observed. After the J-grooves are installed on the conical section of the draft tube, the unstable water flow has axial momentum after flowing through the J-grooves. The initially disordered water flow participates in the main water flow again. So, the LEPR of the water flow through the J-grooves decreases, and the higher LEPR is only distributed above the J-grooves and on the wall of the J-grooves, as shown in Figure 12b. After the runner cone is lengthened, which is shown in Figure 12c, the axial velocity of the water flow increases, the rotating water flow is suppressed, and the central region is occupied by the main water flow, so the LEPR near here is lower. In Figure 12d, it can be observed that under the combined action of the J-grooves and the lengthened runner cone, the water flowing through the runner enters into the draft tube in the form of a columnar vortex, and the energy dissipation at the runner outlet and the draft tube wall is significantly weakened. Thus, the loss of entropy production at Section 1 and Section 2 of the J+C turbine is less than that seen in N-J, W-J and C turbines, and the LEPR at the walls a4 and b4 of the J+C turbine are lower than those of the other three structures. It can be seen in Figure 12 that the entropy production theory can be used to accurately evaluate the energy loss associated with different modification measures in suppressing the draft tube vortex. Moreover, under the DPL operating conditions, in a turbine with a J+C optimized structure, the energy loss at the runner outlet and the straight cone section of the draft tube can be significantly reduced, and the energy dissipation effect is also the most remarkable.
To quantitatively obtain the energy dissipation effect of the four types of turbine structures, the hydraulic losses of the prototype and the three modified turbines under different operating conditions were calculated based on the entropy production theory. Figure 13 shows that the hydraulic losses of the type turbine structures operating under DPL conditions are more extensive than those under optimal working conditions, and the hydraulic losses of the prototype turbine are up to 8.2 m. The hydraulic loss reduction degree of the three modified turbines, W-J, C, and J+C, is the most significant, but the difference is not evident in the design condition (Q* = 1). The above result suggests that under partial load conditions, the energy losses of turbines with the three optimized structures are significantly reduced. Furthermore, the optimized structure J+C, in which the J-grooves and lengthening runner cone are applied simultaneously, can minimize the hydraulic loss of the turbine under all kinds of operating conditions.
The comparison of the efficiency of the prototype turbine and the three optimized structure turbines under different operating conditions based on the entropy production theory is shown in Figure 14. It can be found that under partial load conditions, the efficiency of the four turbines corresponds to the hydraulic loss curve. The efficiency of the prototype turbine is lower than that of the three optimized structure turbines, and the efficiency of the J+C turbine is the highest. However, the efficiency difference between the four turbines is not apparent under the optimal operating condition, and the efficiency difference is evident under the off-optimal operating condition, especially the DPL operating condition. The above result suggests that under partial load conditions, the energy losses of turbines with the three optimized structures are reduced, and the efficiency of the water turbines is improved. Furthermore, the optimized structure J+C, in which the J-grooves and lengthening runner cone are applied simultaneously, can give the turbine the highest efficiency under partial load conditions.
It can be concluded that using the entropy production theory to evaluate the energy loss in suppressing the vortex rope in the turbine draft tube is feasible. The structural optimization measure J+C can further weaken the vortex intensity at the runner outlet of the water turbine, and reduce the pressure pulsation and hydraulic loss induced by the eddy current to achieve energy dissipation and improve the water turbine’s efficiency.

4. Conclusions

We aimed at the problem of the rotating vortex appearing in the Francis turbine’s draft tube under partial load conditions, which leads to pressure pulsation and hydraulic loss and affects the operation stability of the hydro unit. This study is based on the structural optimization of water turbines. Moreover, by installing J-grooves on the wall of the straight cone section, lengthening the runner cone, and adopting the two optimization structures above at the same time, the pressure pulsation, vortex pattern of draft tube, and energy loss of the prototype N-J and the turbines with three different modified structures, W-J, C, and J+C, were analyzed using the numerical simulation method. The main conclusions can be drawn as follows:
(1)
The draft tube pressure’s fluctuation amplitudes in the three optimized turbines, W-J, C, and J+C, can be effectively reduced. The J+C optimized structure adopted in the two modification methods can significantly decrease the pressure pulsation amplitude from 109 to 35. Thus, the eccentric vortex was effectively weakened, and the stable operation range of the hydro unit was expanded;
(2)
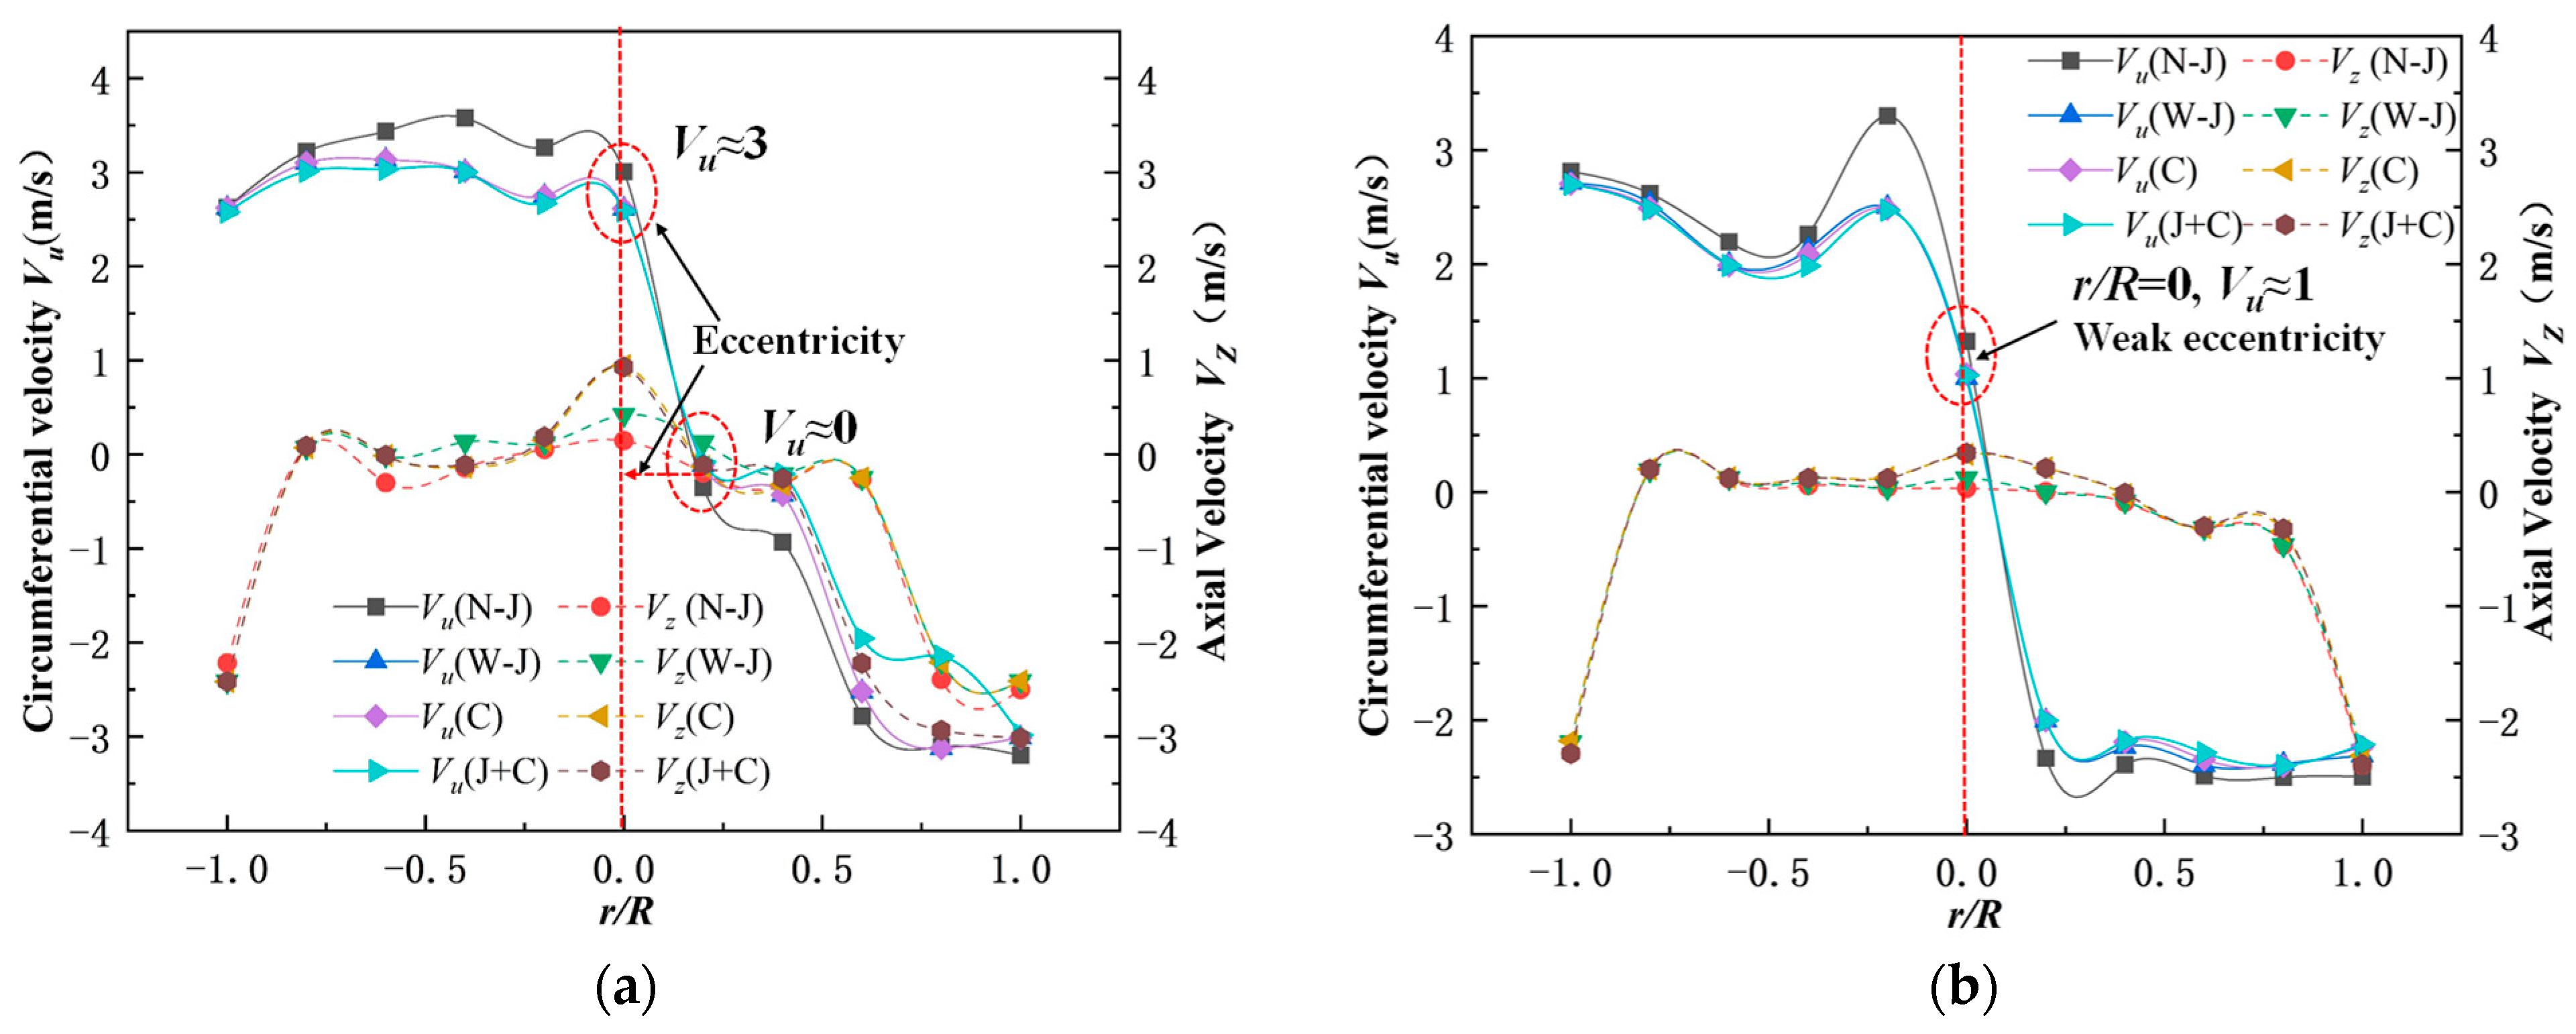
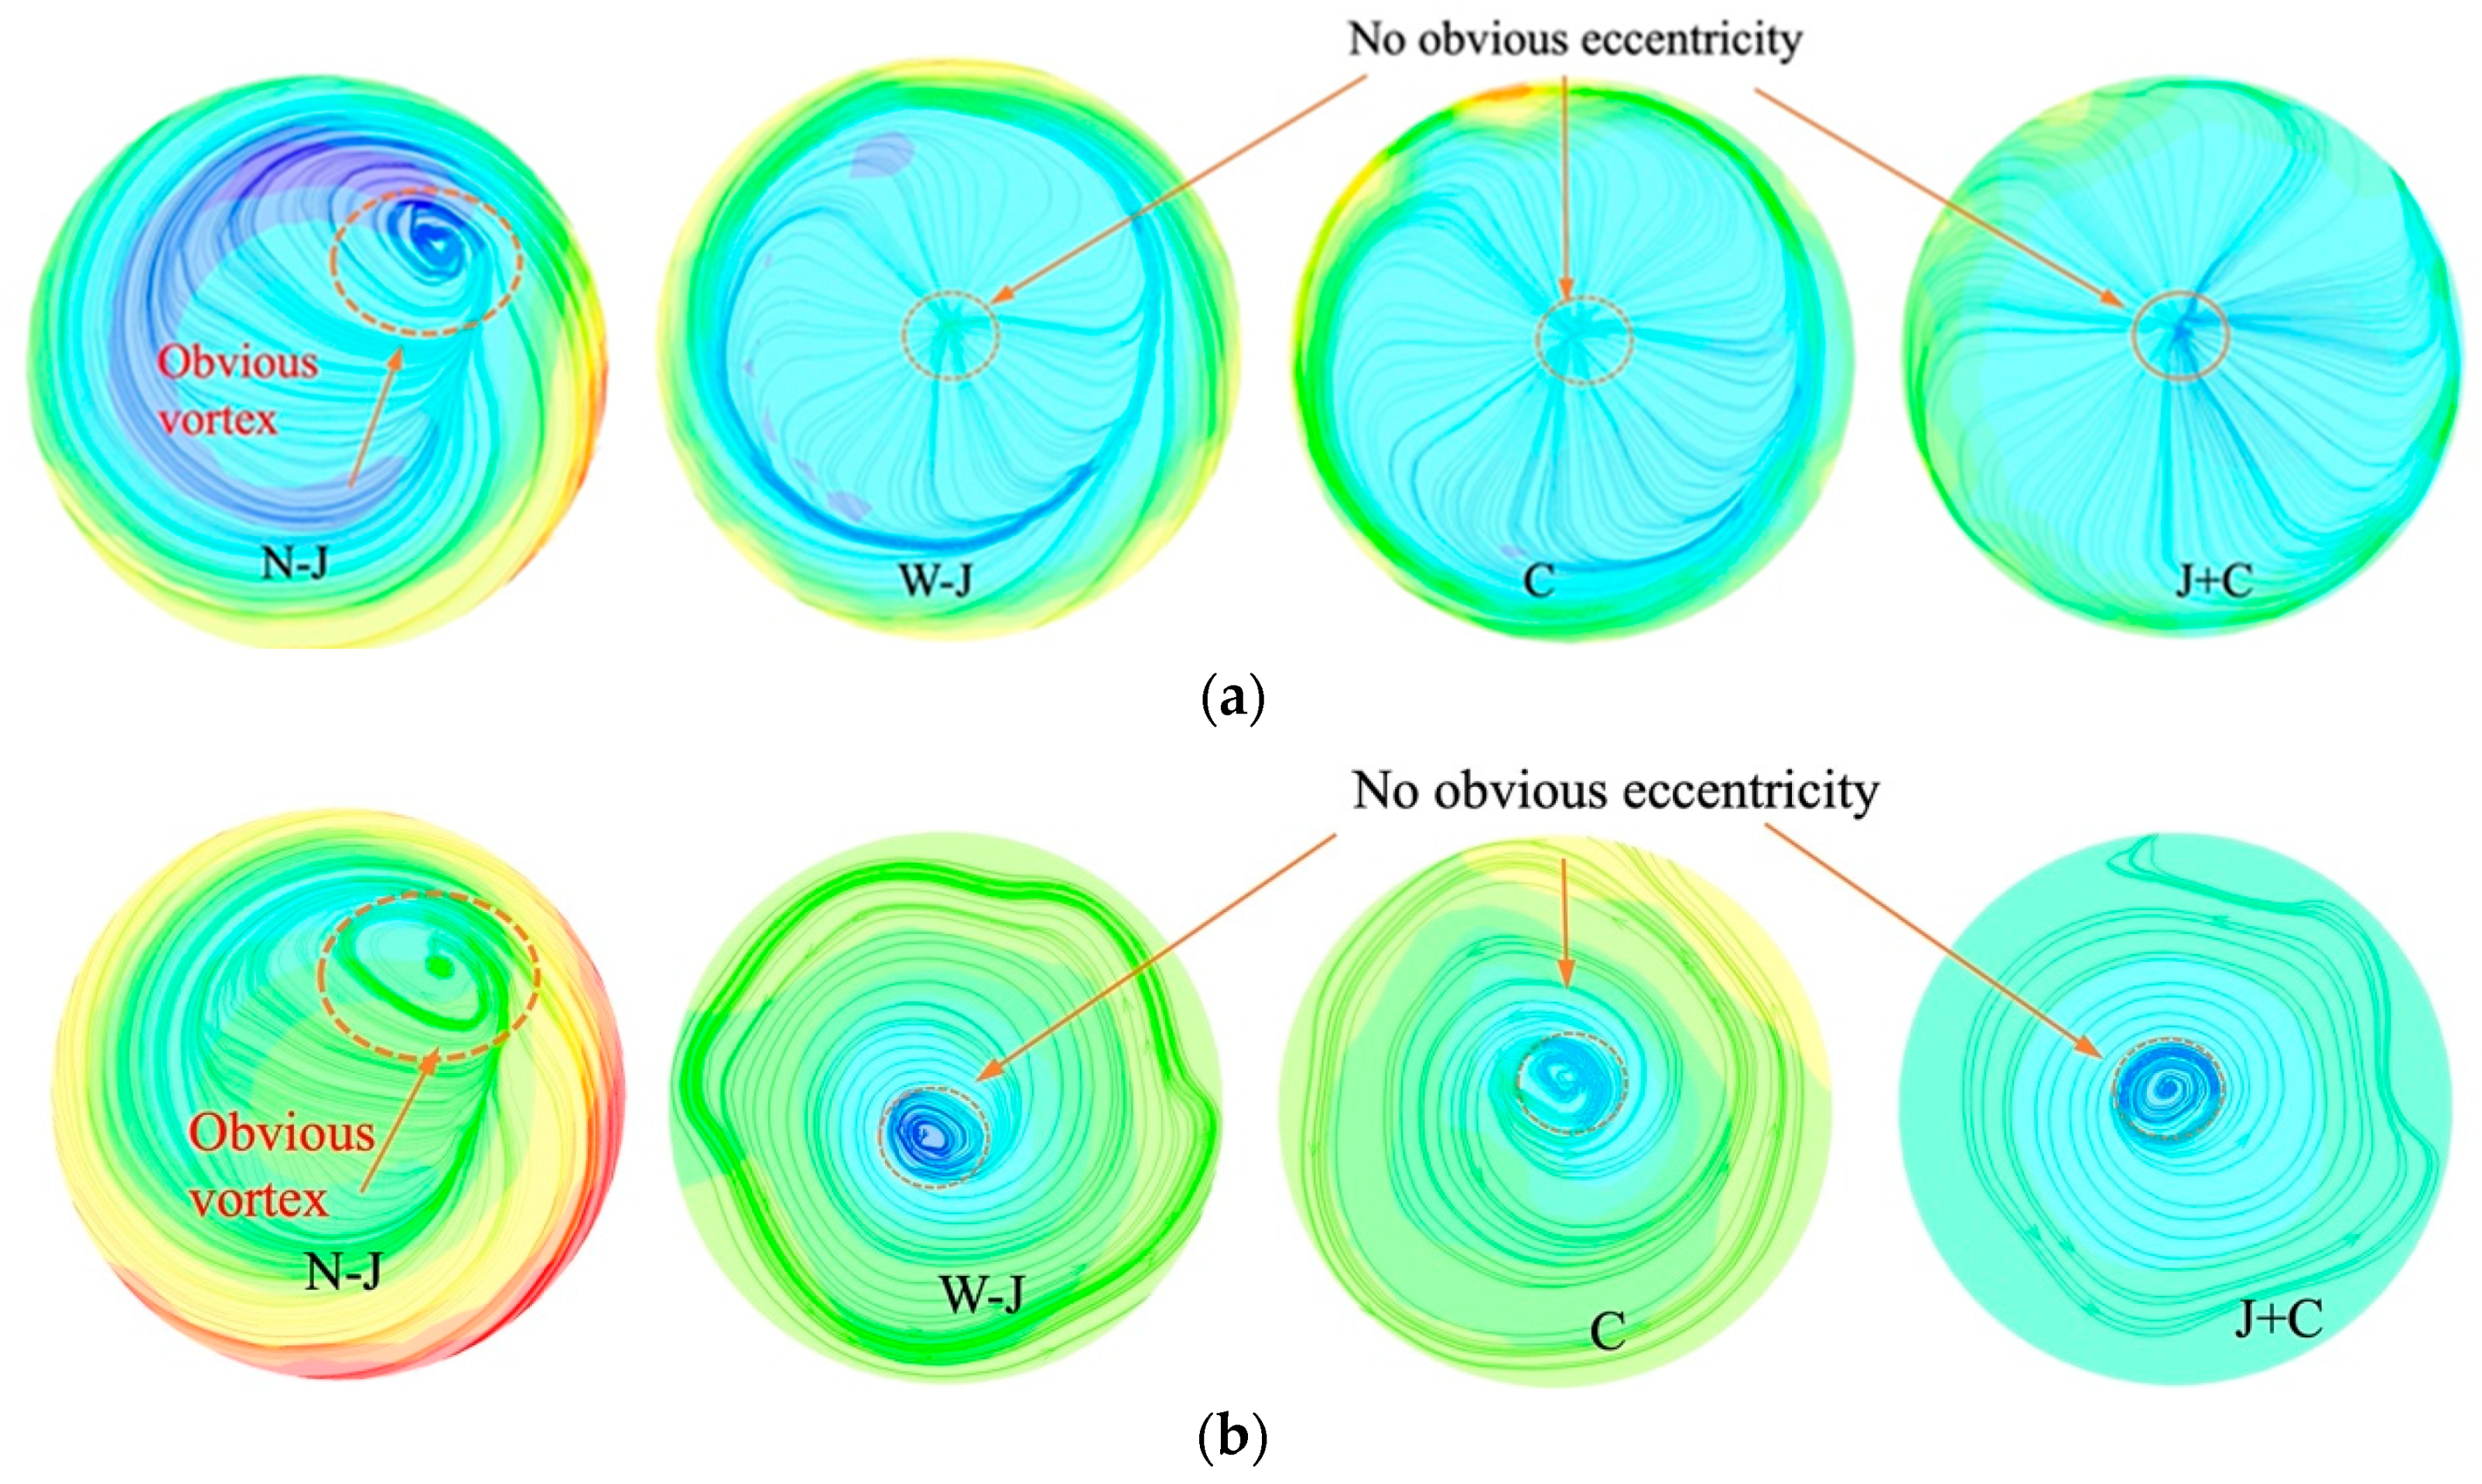
Comparing the vortex morphologies of different modification measures, the J+C optimized structure with J-grooves and runner cone extension can reduce the circumferential velocity at the runner outlet under partial load conditions and increase the axial velocity. The diameter and length of the vortex rope are significantly suppressed. Therefore, the eccentric vortex in the draft tube is notably reduced. The optimization structure J+C can have a pronounced effect on vortex suppression;
(3)
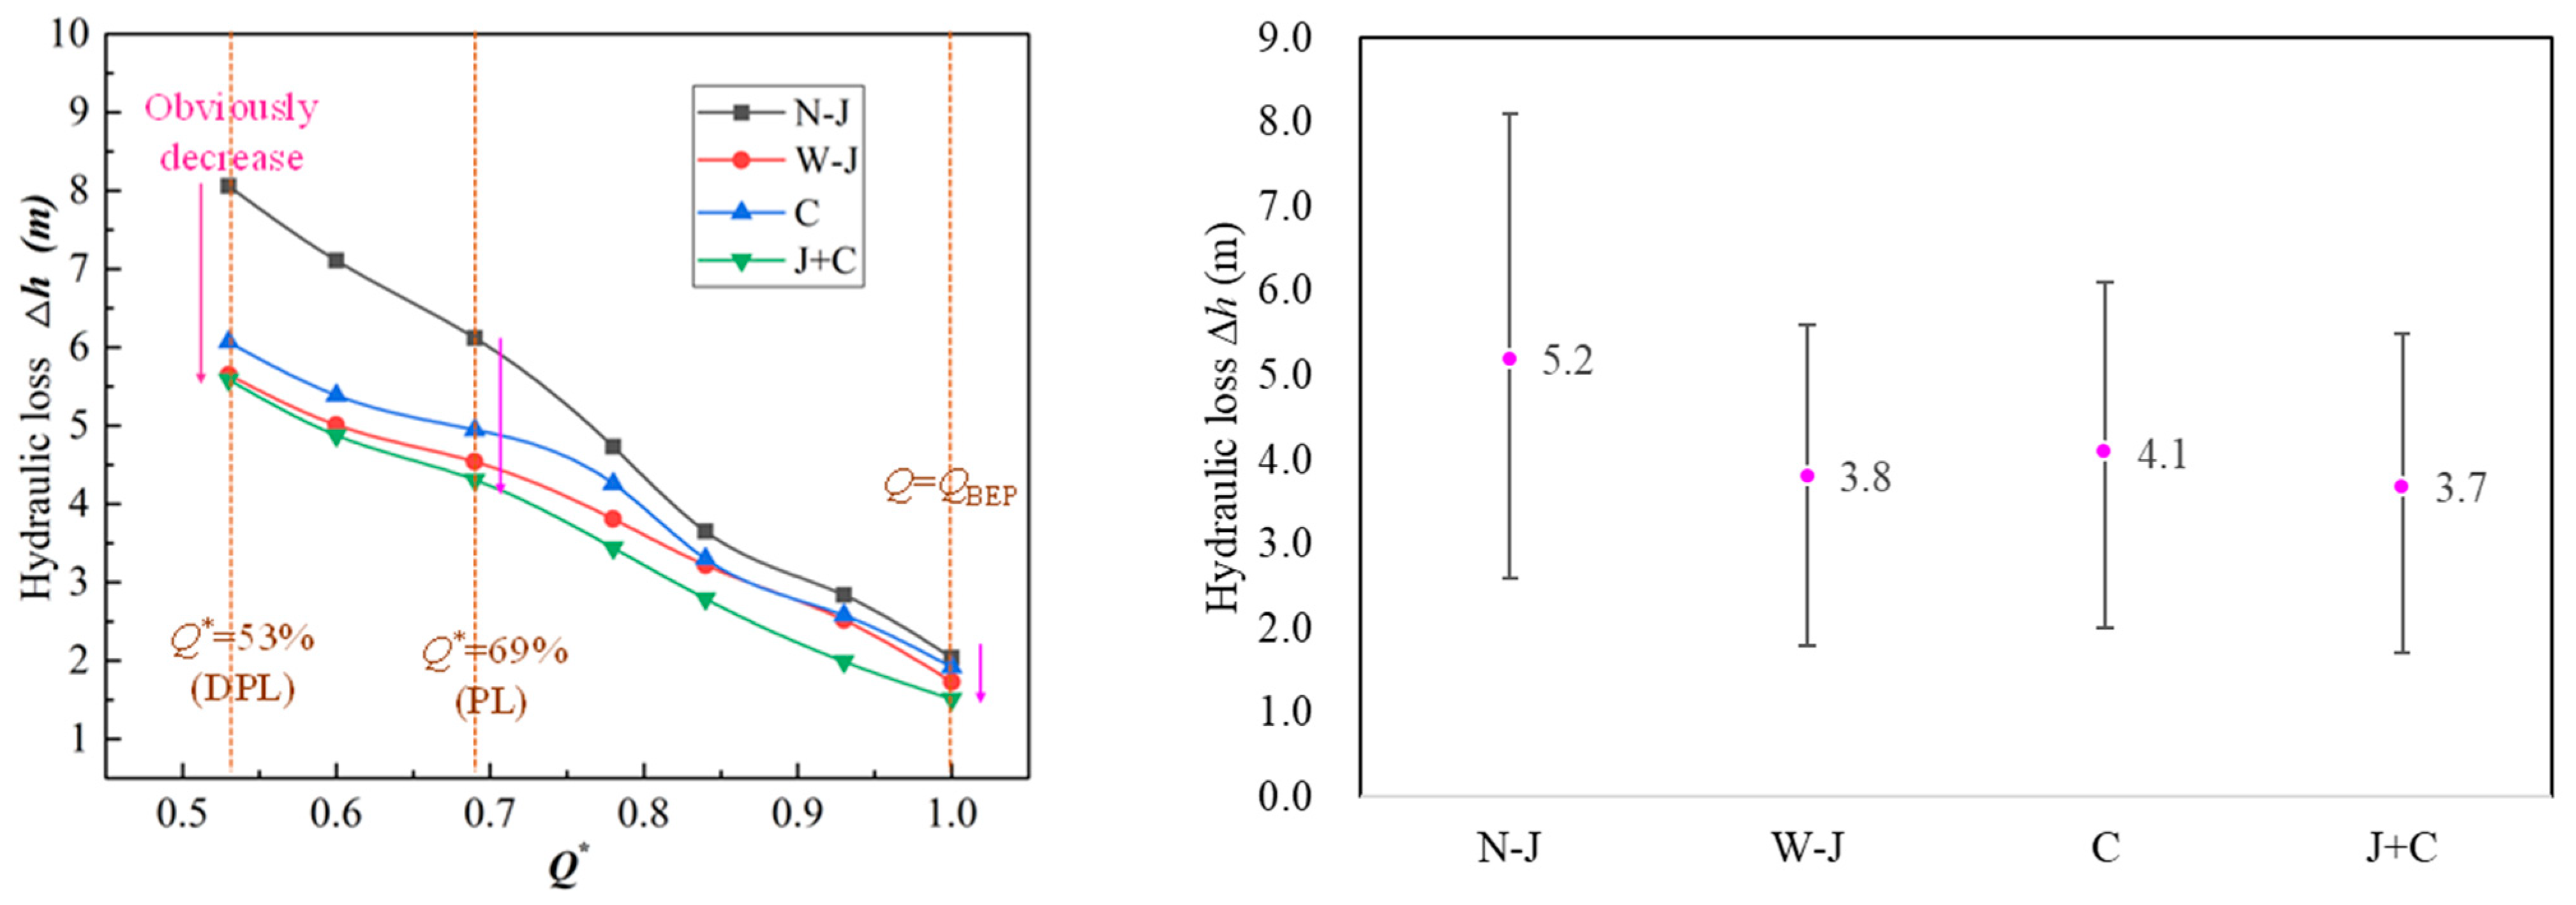
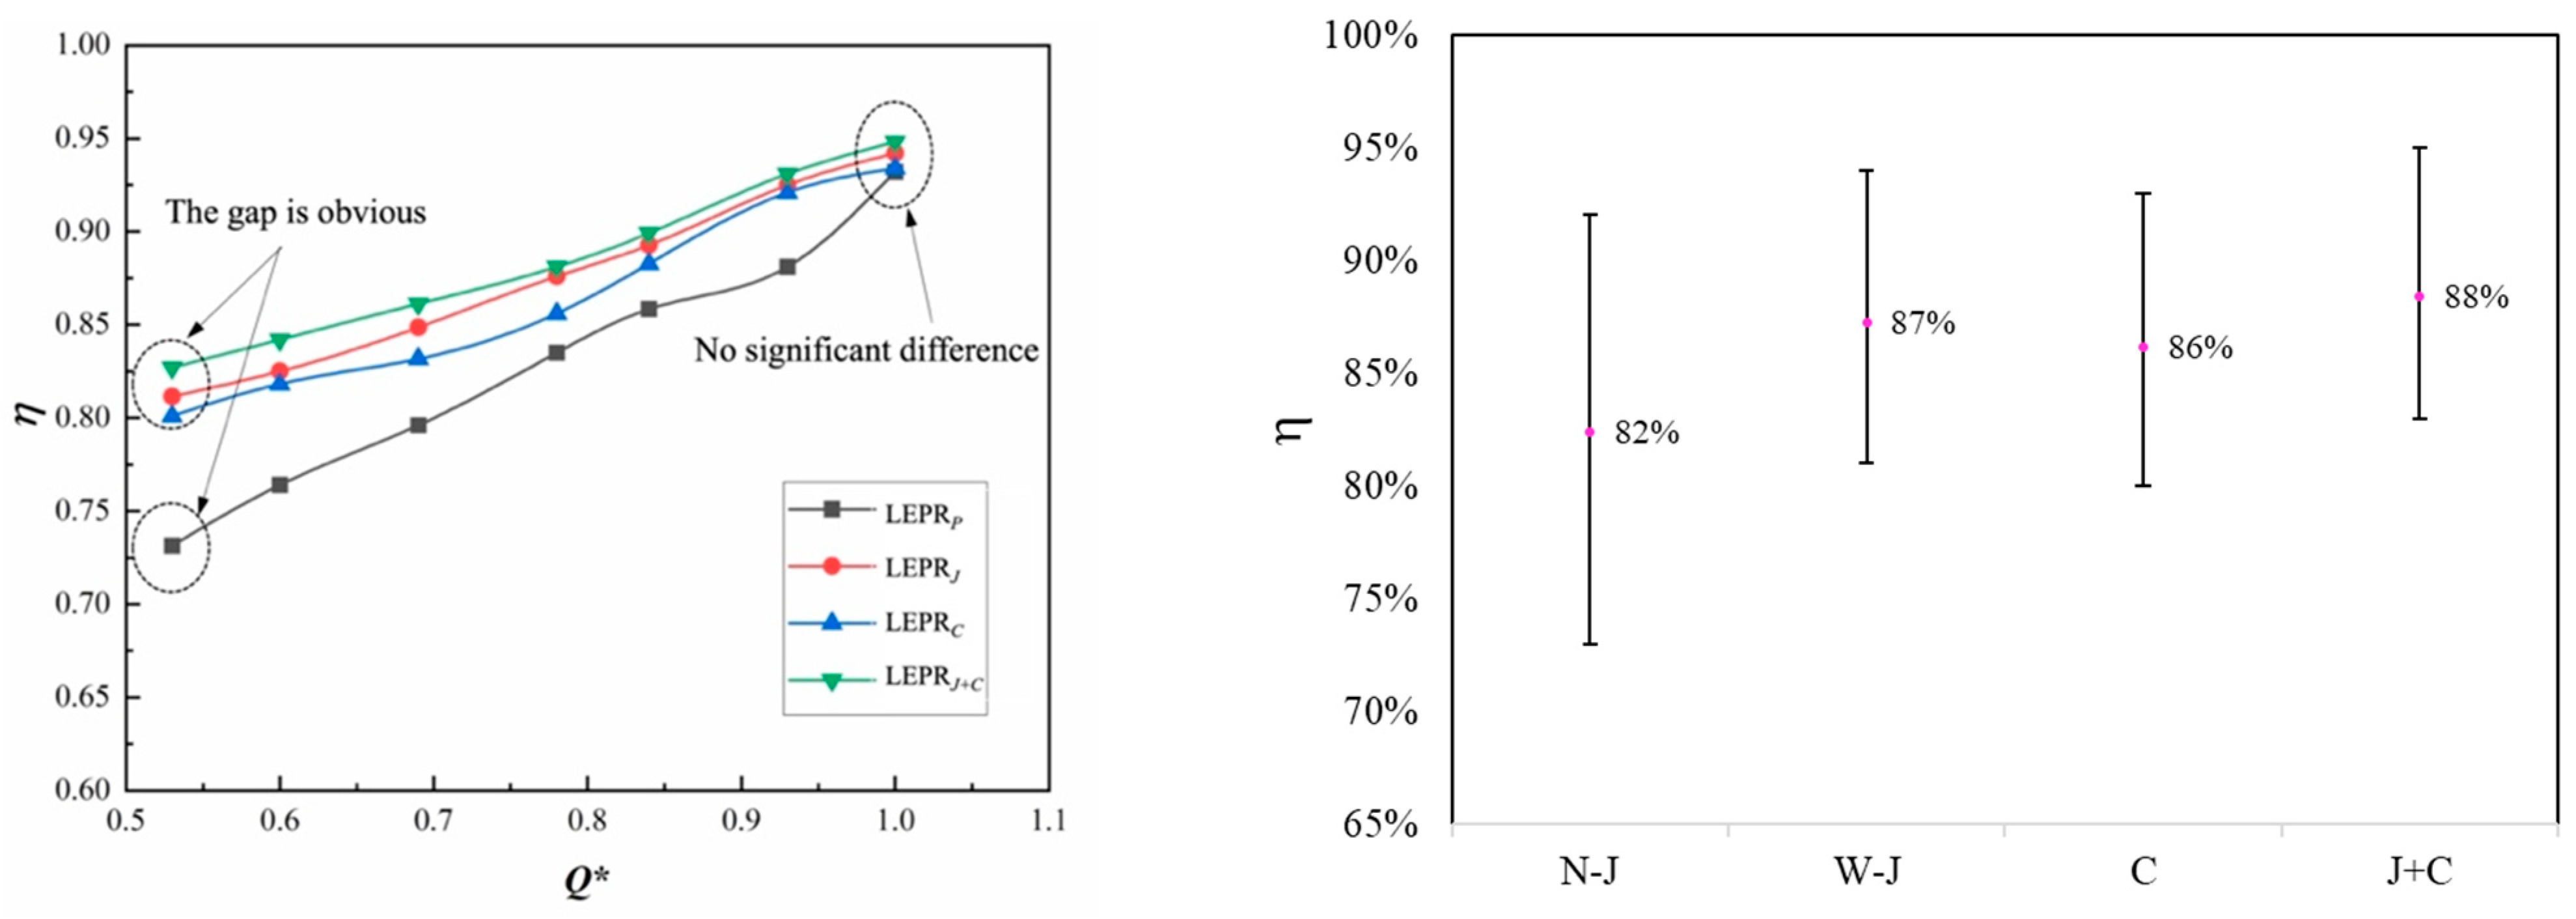
By comparing the entropy production losses in the prototype and under the modification measures, it can be found that the structure optimization measure J+C can most notably minimize the pressure pulsation induced by the eddy current at the runner outlet and the hydraulic loss associated with the pressure pulsation. The energy dissipation effect is the most obvious under deep partial load conditions. The efficiency of the turbine with a J+C optimized structure was increased by 13.7% compared to the prototype turbine. Therefore, the entropy production theory can be used to locate the high hydraulic loss position in hydraulic machinery accurately, and also can be used to evaluate the energy loss accompanying the vortex rope’s generation in the draft tube of the water turbine.
It can be seen from the above conclusions that the optimization structure J+C exerts a positive effect on vortex suppression and energy dissipation. The consequences of this study can be used as a basis for future research on vortex suppression and energy dissipation in a draft tube. However, this research did not conduct an experiment verifying the numerical simulation results. In a follow-up study, prototype tests will be considered to discuss the engineering value of the optimization structure J+C in improving the operation stability of the hydroelectric generating set under part-load conditions.

Author Contributions

Conceptualization, X.Z. and Z.L.; methodology, X.Z. and C.N.; software, C.N.; validation, X.Z. and Z.L.; formal analysis, X.Z.; investigation, X.Z.; resources, Z.L.; data curation, X.Z. and C.N.; writing—original draft preparation, C.N.; writing—review and editing, X.Z.; visualization, Z.L.; supervision, Z.L.; project administration, Z.L.; funding acquisition, Z.L. All authors have read and agreed to the published version of the manuscript.

Funding

This research was funded by Applied Basic Research Key Project of Yunnan province (No. 202401AS070058) and the National Natural Science Foundation of China (Grant No. 52469017).

Data Availability Statement

Unable to obtain data due to privacy restrictions.

Conflicts of Interest

Author Cong Nie was employed by the company Huaneng Lancang River Hydropower Inc. The remaining authors declare that the research was conducted in the absence of any commercial or financial relationships that could be construed as a potential conflict of interest.

Nomenclature

N-JNo J-grooves
W-JWith J-grooves
CExtending runner cone
J+CWith J-grooves and extending runner cone simultaneously
BEPBest efficiency point
QBEPDischarge on the best efficiency point (m3/s)
DPLDeep partial load condition
PLPartial load condition
CFDComputational Fluid Dynamics
RNGRenormalization Group
kTurbulent kinetic energy (m2/s2)
εDissipation rate (m2/s3)
DESDetached Eddy Simulation
LEPRLocal Entropy Production Ratio
nrRated revolution (r/min)
QrDesign flow (m3/s)
HrDesign head (m)
kWKilowatt
vˆEffective viscosity ratio
ϕ Viscous dissipation function
S ˙ D Local entropy generation rate (W·m−3·K−1)
S ˙ D ¯ Direct entropy production rate (W·m−3·K−1)
S ˙ D Turbulent entropy production rate (W·m−3·K−1)
μ e f f Dynamic viscosity coefficient of flow
ηTurbine efficiency (%)
y+Non-dimensional wall distance
LLength of J-grooves (mm)
WWidth of J-grooves (mm)
D3Inlet diameter of draft tube (m)
DDiameter of the runner cone’s extended section (mm)
L1Length of the runner cone’s extended section (mm)
V i n l e t Velocity of the spiral case’s inlet (m/s)
P o u t Pressure of the draft tube’s outlet (Pa)
Q*Corresponding flow ratio
rThe position from the origin in the x-direction (m)
RThe radius of reference radius (m)
VuCircumferential speed (m/s)
VZAxial speed (m/s)
ΔhHydraulic loss (m)

References

  1. Zhou, J.P.; Du, X.H.; Zhou, X.B. Innovating ideas to promote the sustainable development of hydropower development—Forecast of hydropower development situation and analysis of countermeasures in the 14th Five-Year. China Electr. Power 2021, 8, 34–37. [Google Scholar]
  2. Tang, W. “Carbon Neutrality” aimed electric power development in the 14th Five-Year. Pet. New Energy 2021, 33, 13–17. [Google Scholar]
  3. Su, X.; Cao, Z.; Li, Y.; Jin, Y.; Tang, Z. Research on Flow Stability and Vibration of an Industrial Hydraulic Turbine. Processes 2021, 9, 311. [Google Scholar] [CrossRef]
  4. Zhang, S.Q. Study of hydraulic stability on large-scale the Francis turbine. Ph.D. Thesis, Huazhong University of Science and Technology, Wuhan, China, 2008. [Google Scholar]
  5. Goyal, R.; Gandhi, B.K. Review of hydrodynamics instabilities in Francis turbine during off-design and transient operations. Renew. Energy 2018, 116, 697–709. [Google Scholar]
  6. Li, Q.F.; Wang, Y.K.; Liu, C.; Zhang, J.X.; Zhang, Z.J.; Wang, R.B. Pressure fluctuation characteristics of Francis pump turbine in Hump zone. J. Drain. Irrig. Mach. Eng. 2018, 36, 488–493. [Google Scholar]
  7. Wang, G. Study on vibration and stability of hydraulic turbine and associated test technology. Ph.D. Thesis, Harbin Institute of Technology, Harbin, China, 2002. [Google Scholar]
  8. Rheingans, W.J. Power swings in hydroelectric power plants. Trans. ASME 1940, 62, 171–177. [Google Scholar] [CrossRef]
  9. Rudolf, P.; Martin, J. Decomposition of the Swirling Flow Fields. In Proceedings of the 4-th International Meeting on Cavitation and Dynamic Problems in Hydraulic Machinery and Systems, Belgrade, Serbia, 26–28 October 2011. [Google Scholar]
  10. Liu, W.J.; Liu, G.N.; Wei, X.Z.; Han, X.L. Stability Research for Zhouba Hydraulic Power Station. Large Electr. Mach. Hydraul. Turbine 2006, 1, 49–52. [Google Scholar]
  11. Ma, Y.; Geng, Q.H.; Qian, B.; Feng, Z.G. Model test research on air supply for tail water pipe of Gongzui Hydropower Station. Yangtze River 2016, 47, 102–104. [Google Scholar]
  12. Sun, J.P.; Xiong, H.; Ao, J.P.; Zheng, L.Y. Influence of gas-supply on the stability of operating in low head of left bank units at three gorges hydropower station. J. Huazhong Univ. Sci. Technol. (Nat. Sci. Ed.) 2006, 34, 75–77. [Google Scholar]
  13. Susan-Resiga, R.; Ciocan, G.D.; Anton, I.; Avellan, F. Analysis of the Swirling Flow Downstream a Francis Turbine Runner. J. Fluids Eng. 2006, 128, 177–189. [Google Scholar] [CrossRef]
  14. Anup, K.C.; Thapa, B.; Lee, Y.H. Transient numerical analysis of rotor–stator interaction in a Francis turbine. Renew. Energy 2014, 65, 227–235. [Google Scholar]
  15. Tiwari, G.; Kumar, J.; Prasad, V.; Patel, V.K.; Tiwari, G. Utility of CFD in the design and performance analysis of hydraulic turbines -A review. Energy Rep. 2020, 6, 2410–2429. [Google Scholar] [CrossRef]
  16. Wang, Z.W.; Zhou, L.J.; Huang, Y.F. Simulation of unsteady flow induced by in vortices the draft tube of a Francis turbine. J. Tsinghua Univ. (Sci. Technol.) 2002, 42, 1647–1650. [Google Scholar]
  17. Li, Z.C.; Chang, S.J.; Xin, Z. Numerical Simulation of Elimination of Pressure Fluctuation in Francis Turbine Draft Tube Using Water Jet. Trans. Chin. Soc. Agric. Mach. 2013, 44, 53–57. [Google Scholar]
  18. Su, W.T.; Zheng, Z.Y.; Li, X.B.; Lan, C.F. Verification of large eddy simulation (LES) applied in Francis hydro-turbine under partial flow conditions. J. Harbin Inst. Technol. 2015, 47, 90–97. [Google Scholar]
  19. Ye, S.; Li, X.; Zhu, Z.; Li, L.; Lin, T. Numerical Study of the Energy Flow Characteristics of Multi-Stage Pump as Turbines. Processes 2022, 10, 2488. [Google Scholar] [CrossRef]
  20. Mulu, B.G.; Jonsson, P.P.; Cervantes, M.J. Experimental investigation of a Kaplan draft tube—Part I: Best efficiency point. Appl. Energy 2012, 94, 71–83. [Google Scholar] [CrossRef]
  21. Foroutan, H.; Yavuzkurt, S. Flow in the Simplified Draft Tube of a Francis Turbine Operating at Partial Load—Part I: Simulation of the Vortex Rope. J. Appl. Mech. 2014, 81, 061010. [Google Scholar] [CrossRef]
  22. Kc, A.; Lee, Y.H.; Thapa, B. CFD study on prediction of vortex shedding in draft tube of Francis turbine and vortex control techniques. Renew. Energy 2016, 86, 1406–1421. [Google Scholar] [CrossRef]
  23. Cheng, H.; Zhou, L.; Liang, Q.; Guan, Z.; Liu, D.; Wang, Z.; Kang, W. A method of evaluating the vortex rope strength in draft tube of Francis turbine. Renew. Energy 2020, 152, 770–780. [Google Scholar] [CrossRef]
  24. Li, R.F.; Zhao, Y.; Liu, D.F.; Shi, Q. Study on the Influence of Cone with Holes on the Vortex Zone of Vortex Rope of the Francis Turbine. Large Electr. Mach. Hydraul. Turbine 2020, 2, 55–60. [Google Scholar]
  25. Daniel, B.M.; Zhao, Y.; Zhang, Y.M. Geometric shape optimization of turbine draft tube. Extern. Big Mot. 2005, 5, 64–68. [Google Scholar]
  26. Xin, Q.; Wu, J.; Du, J.; Ge, Z.; Huang, J.; Yu, W.; Yuan, F.; Wang, D.; Yang, X. Study of Draft Tube Optimization Using a Neural Network Surrogate Model for Micro-Francis Turbines Utilized in the Water Supply System of High-Rise Buildings. Processes 2024, 12, 1128. [Google Scholar] [CrossRef]
  27. Zhou, L.; Hang, J.; Bai, L.; Krzemianowski, Z.; El-Emam, M.A.; Yasser, E.; Agarwal, R. Application of entropy production theory for energy losses and other investigation in pumps and turbines: A review. Appl. Energy 2022, 318, 119211. [Google Scholar] [CrossRef]
  28. Zhang, Y.X.; Hou, H.C.; Xu, C.; He, W.; Li, Z. Application of entropy production method to centrifugal pump energy loss evaluation. J. Drain. Irrig. Mach. Eng. 2017, 35, 277–282, 288. [Google Scholar]
  29. Nan, X.; Liu, L.; Ma, N.; Lu, Q.; Lin, F. Numerical investigation of entropy generation distribution in a transonic compressor. In Proceedings of the ASME Turbo Expo: Turbomachinery Technical Conference & Exposition, Seoul, Republic of Korea, 13–17 June 2016. [Google Scholar]
  30. Xu, L.H.; Guo, T.; Wang, W.Q. Effects of Vortex Structure on Hydraulic Loss in a Low Head Francis Turbine under Overall Operating Conditions Base on Entropy Production Method. Renew. Energy 2022, 198, 367–379. [Google Scholar]
  31. Wang, F.J. The Analysis of Computational Fluid Dynamic; Tsinghua University Press: Beijing, China, 2004; pp. 2–15. [Google Scholar]
  32. Favrel, A.; Müller, A.; Landry, C.; Yamamoto, K.; Avellan, F. Study of the vortex-induced pressure excitation source in a Francis turbine draft tube by particle image velocimetry. Exp. Fluids 2015, 56, 1–15. [Google Scholar] [CrossRef]
  33. Zhang, N. Research on the Evolution Mechanism of Cavitation Vortex in Draft Tube of Francis Turbine. Ph.D. Thesis, Harbin Institute of Technology, Harbin, China, 2020. [Google Scholar]
  34. Zuo, Z.; Liu, S.; Liu, D.; Qin, D.; Wu, Y. Numerical analyses of pressure fluctuations induced by inter blade vortices in a model Francis turbine. Hydrodynamics 2015, 27, 513–521. [Google Scholar] [CrossRef]
  35. Demirel, G.; Acar, E.; Celebioglu, K.; Aradag, S. CFD-driven surrogate-based multi-objective shape optimization of an elbow type draft tube. Int. J. Hydrogen. Energy 2017, 42, 17601–17610. [Google Scholar] [CrossRef]
  36. Bilicki, Z.; Giot, M.; Kwidzinski, R. Fundamentals of two-phase flow by the method of irreversible thermodynamics. Int. J. Multiph. Flow 2002, 28, 1983–2005. [Google Scholar] [CrossRef]
  37. Wang, C.; Zhang, Y.; Hou, H.; Zhang, J.; Xu, C. Entropy production diagnostic analysis of energy consumption for cavitation flow in a two-stage LNG cryogenic submerged pump. Int. J. Heat Mass Transf. 2019, 129, 342–356. [Google Scholar] [CrossRef]
  38. Herwig, H.; Kock, F. Direct and indirect methods of calculating entropy generation rates in turbulent convective heat transfer problem. Heat Mass Transf. 2007, 43, 207–215. [Google Scholar] [CrossRef]
  39. Li, D.; Wang, H.; Qin, Y.; Han, L.; Wei, X.; Qin, D. Entropy production analysis of hysteresis characteristic of a pump-turbine model. Energy Convers. Manag. 2017, 149, 175–191. [Google Scholar] [CrossRef]
  40. Kock, F.; Herwig, H. Local entropy production in turbulent shear flows: A high-Reynolds number model with wall functions. Int. J. Heat Mass Transf. 2004, 47, 2205–2215. [Google Scholar] [CrossRef]
  41. Mathieu, J.; Scott, J. An Introduction to Turbulent Flow; Cambridge University Press: Cambridge, UK, 2000. [Google Scholar]
  42. Viet, L.V.; Chen, Z.M.; Choi, Y.D. Optimum design of J-groove for a bulb turbine model to suppress swirl flow in the draft tube. IOP Conf. Ser. Earth Environ. Sci. 2019, 240, 022030. [Google Scholar]
  43. Muhirwa, A.; Cai, W.H.; Su, W.T.; Liu, Q.; Binama, M.; Li, B.; Wu, J. A review on remedial attempts to counteract the power generation compromise from draft tubes of hydropower plants. Renew. Energy 2020, 150, 743–764. [Google Scholar] [CrossRef]
  44. Egusquiza, E.; Estevez, A.; Cabrera, J.; Vega, R. Vibration behavior in Hydro Power Plants Field Data Analysis. In Proceedings of the 20nd IAHR Symposium, Charlotte, NC, USA, 6–9 August 2000. [Google Scholar]
  45. Skoták, A.; Mikulasek, J.; Troubil, P. Unsteady flow in the draft tube with elbow. Part A–Experimental investigation. In Proceedings of the 10th International Meeting of the Work Group on The Behavior on hydraulic machinery under steady oscillatory conditions, Trondheim, Norway, 26–28 June 2001. [Google Scholar]
  46. Sotoudeh, N.; Maddahian, R.; Cervantes, M.J. Investigation of Rotating Vortex Rope formation during load variation in a Francis turbine draft tube. Renew. Energy 2020, 151, 238–254. [Google Scholar] [CrossRef]
  47. Luo, Z.; Nie, C.; Lv, S.; Guo, T.; Gao, S. The Effect of J-Groove on Vortex Suppression and Energy Dissipation in a Draft Tube of Francis Turbine. Energies 2022, 15, 1707. [Google Scholar] [CrossRef]
  48. Hou, H.; Zhang, Y.; Li, Z.; Jiang, T.; Zhang, J.; Xu, C. Numerical analysis of entropy production on a LNG cryogenic submerged pump. J. Nat. Gas Sci. Eng. 2016, 36, 87–96. [Google Scholar] [CrossRef]
  49. Yu, Z.F.; Wang, W.Q.; Yan, Y.; Liu, X.S. Energy loss evaluation in a Francis turbine under overall operating conditions using entropy production method. Renew. Energy 2021, 169, 982–999. [Google Scholar] [CrossRef]
Figure 1. Prototype hydro turbine HLA551-LJ-43.
Processes 12 02249 g001
Figure 2. Three-dimensional model of the prototype turbine.
Processes 12 02249 g002
Figure 3. Grid independence verification.
Processes 12 02249 g003
Figure 4. The y plus of the Francis turbine blade.
Processes 12 02249 g004
Figure 5. Unstructured hexahedral grids of each flow component.
Processes 12 02249 g005
Figure 6. The layout of the modification measures of W-J and C, the location of the monitoring points, and the monitoring surface.
Processes 12 02249 g006
Figure 7. Pressure fluctuation at monitoring points TS2 of the prototype and the three structural optimization measures under DPL and PL conditions, listed as: (a) Q* = 53% (DPL); (b) Q* = 69% (PL).
Processes 12 02249 g007
Figure 8. Pressure fluctuation spectrogram at monitoring points TS2 of the prototype and the three structural optimization measures under DPL and PL conditions, listed as: (a) Q* = 53% (DPL); (b) Q* = 69% (PL).
Processes 12 02249 g008
Figure 9. The distribution of the circumferential and axial velocity of the prototype and the three structural optimization measures under DPL and PL conditions, listed as: (a) Q* = 53% (DPL); (b) Q* = 69% (PL).
Processes 12 02249 g009
Figure 10. The vortex rope zone of the prototype and the three structural optimization measures under DPL and PL conditions, listed as: (a) Q* = 53% (DPL); (b) Q* = 69% (PL).
Processes 12 02249 g010
Figure 11. The streamlines of section TP1 of the draft tube under DPL and PL conditions, listed as: (a) Q* = 53% (DPL); (b) Q* = 69% (PL).
Processes 12 02249 g011
Figure 12. LEPR distribution on the outlet of runner and draft tube of different modification measures under DPL operating conditions (Q* = 53%), listed as: (a) N-J; (b) W-J; (c) C; (d) C+J.
Processes 12 02249 g012
Figure 13. Hydraulic losses of four turbine models under different operating conditions.
Processes 12 02249 g013
Figure 14. Efficiency of four turbine models under different operating conditions.
Processes 12 02249 g014
Table 1. The physical parameters of the prototype.
ParameterValueSymbol
Runner diameter 0.43 mD1
Unit speed81.587 r/minn11
Unit discharge1.064 m3/sQ11
Runner blades number13Zr
Stay vanes number16ZT
Guide vanes number8Zs
Entrance diameter of spiral casing0.547 mD0
Design head10 mHr
Rated revolution600 rpmnr
Design flow0.7 m3/sQr
Rated output power55 kWPr
Turbine efficiency on design operating condition92%ηr
Table 2. Utilized grid details for each component.
Turbine ComponentSpiral CaseDistributerRunnerDraft Tube
elements (×104)380210474232
nodes (×104)354200445221
Table 3. Summary table of the four turbine models.
Optimized Structure TypeInstalling J-Grooves on Conical Section of Draft TubeExtending the Runner Cone
Abbreviation of Model Name NumberLengthWidthDiameterLength
12120 mm10 mm30 mm88 mm
N-JNoNo
W-JYesNo
CNoYes
J+CYesYes
Disclaimer/Publisher’s Note: The statements, opinions and data contained in all publications are solely those of the individual author(s) and contributor(s) and not of MDPI and/or the editor(s). MDPI and/or the editor(s) disclaim responsibility for any injury to people or property resulting from any ideas, methods, instructions or products referred to in the content.

