Article

Molecular Insights into CO2 Diffusion Behavior in Crude Oil

1
Changqing Oilfield Branch Company, Xi’an 710018, China
2
No.8 Oil Production Plant, Changqing Oilfield Company, Xi’an 710018, China
3
No.5 Oil Production Plant, Changqing Oilfield Company, Xi’an 710018, China
4
No.3 Oil Production Plant, Changqing Oilfield Company, Xi’an 710018, China
5
National Key Laboratory of Petroleum Resources and Engineering, China University of Petroleum (Beijing), Beijing 102249, China
*
Author to whom correspondence should be addressed.
Processes 2024, 12(10), 2248; https://doi.org/10.3390/pr12102248
Submission received: 15 July 2024 / Revised: 11 September 2024 / Accepted: 15 September 2024 / Published: 15 October 2024
(This article belongs to the Special Issue Advances in Enhancing Unconventional Oil/Gas Recovery, 2nd Edition)

Abstract

:
CO2 flooding plays a significant part in enhancing oil recovery and is essential to achieving CCUS (Carbon Capture, Utilization, and Storage). This study aims to understand the fundamental theory of CO2 dissolving and diffusing into crude oil and how these processes vary under reasonable reservoir conditions. In this paper, we primarily use molecular dynamics simulation to construct a multi-component crude oil model with 17 hydrocarbons, which is on the basis of a component analysis of oil samples through laboratory experiments. Then, the CO2 dissolving capacity of the multi-component crude was quantitatively characterized and the impacts of external conditions—including temperature and pressure—on the motion of the CO2 dissolution and diffusion coefficients were systematically investigated. Finally, the swelling behavior of mixed CO2–crude oil was analyzed and the diffusion coefficients were predicted; furthermore, the levels of CO2 impacting the oil’s mobility were analyzed. Results showed that temperature stimulation intensified molecular thermal motion and increased the voids between the alkane molecules, promoting the rapid dissolution and diffusion of CO2. This caused the crude oil to swell and reduced its viscosity, further improving the mobility of the crude oil. As the pressure increased, the voids between the internal and external potential energy of the crude oil models became wider, facilitating the dissolution of CO2. However, when subjected to external compression, the CO2 molecules’ diffusing progress within the oil samples was significantly limited, even diverging to zero, which inhabited the improvement in oil mobility. This study provides some meaningful insights into the effect of CO2 on improving molecular-scale mobility, providing theoretical guidance for subsequent investigations into CO2–crude oil mixtures’ complicated and detailed behavior.

1. Introduction

In recent decades, carbon dioxide (CO2) has become the primary greenhouse gas (GHG) emission from human production and daily life, which is one of the leading causes of global warming. Global warming has affected the daily lives of all living beings [1]. To mitigate the adverse impact and achieve carbon neutrality, large-scale implementation of low-carbon and energy-saving measures has become a global consensus and future development trend [2]. According to the Global Carbon Capture and Storage Institute (GCCSI) report, CCUS-EOR represents a primary approach for reducing carbon emissions [3,4,5]. One of the most resultful approaches to enhance oil recovery (EOR) is injecting CO2 into reservoirs, which not only improves oil recovery but also enables geological storage of CO2 [6,7,8,9], thus enabling effective and efficient closed-loop utilization of CO2. By dissolving and diffusing CO2 into crude oil, it can be beneficial to decrease the viscosity and interfacial tension of crude oil, expand the crude oil’s volume, enhance the mobility of crude oil, and significantly increase oil recovery [10,11,12,13,14,15]. At the same time, a portion of CO2 will be trapped in the reservoir to achieve the goal of carbon capture and storage. The displacement efficiency of CO2 is largely influenced by the reservoir fluid’s properties and the CO2–oil mixtures’ phase behavior. Therefore, the dissolution and diffusion of CO2 in crude oil are two of the most critical parameters to quantify displacement efficiency.
Numerous experiments have been conducted in the past to investigate the enhanced oil recovery mechanisms of various gases, including CO2 [16,17], N2 [18], hydrocarbons [17,19,20], and others. These methods are typically categorized as direct or indirect. The direct method [21,22] calculates the diffusion coefficient by analyzing the components in the diffusion process. The indirect method [23] is primarily based on the PVT method, which determines the diffusion coefficient by monitoring the changes in vessel pressure or volume during the diffusion process. With the continuous advancements in testing methods, CT scanning [24], NMR [25], and other techniques have become widely utilized in the investigation of diffusion. Zhao et al. [26] realized in situ dynamic monitoring of procedures for diffusing CO2 into crude oil using low-field magnetic resonance (NMR) technology, and calculated the CO2 diffusion coefficient that changed with time and location. Li et al. [27] developed a new method that can be used under reservoir conditions for estimating the effective coefficient of CO2 diffusion in oil-saturated porous media, and their results match the mathematical model. Song et al. [28] made use of X-ray Computer-Assisted Tomography (CAT) to evaluate the coefficient of carbon dioxide diffusion in heavy oil. Liu et al. [29] took advantage of online nuclear magnetic resonance (NMR) instruments to conduct CO2-HNP experiments and found that the main controlling factor was driven by molecular diffusion-controlled dissolved CO2. Widuramina et al. [30] used Schlieren imaging to visualize the dissolution rate of supercritical CO2 in n-octane and n-decane.
However, there are still many challenges in investigating the microscopic mechanisms through experiments [31]. In recent years, the application of molecular dynamics (MD) simulation in the field of petroleum and gas engineering has significantly increased. MD simulation is based on classical Newtonian mechanics, and can help us to learn and comprehend the behaviors and mechanisms on a molecular scale inside a complex molecular system [32,33,34], including the analysis of microphysical, kinetic, and thermodynamic properties such as intermolecular forces and molecular trajectories [35]. Therefore, MD simulation is more effective than experiments in directly investigating microscopic mechanisms [31]. MD simulation is utilized in petroleum and gas engineering research to investigate the mobility characteristics of hydrocarbons [36] and the thermodynamic properties of displacement fluids and crude oil mixtures. Moh et al. [37] employed MD simulation to study the adsorption and oil displacement processes of CO2 and CH4 in calcite nanopores, while examining the impact of their diffusion coefficient differences on the displacement processes. Yuan et al. [38] revealed the adsorption and flow mechanisms of CO2–decane miscible fluids in SiO2 pores by the way of MD simulation, revealing that competitive adsorption between CO2 and decane was a key factor for decane displacement. Zhang et al. [39] investigated the solubility of CO2 in octane and its impact on the expansion behavior of octane. Li et al. [40] employed Monte Carlo (MC) and MD simulations to study the swelling reaction and viscosity reduction in n-alkanes by the influence of CO2. By examining the interfacial interaction between Bakken crude oil and gas, Li et al. [41] calculated some key parameters, including the gas solubility, swelling coefficient, diffusion coefficient, and minimum miscibility pressure (MMP). Several researchers have conducted simulations to investigate the phase behavior and volume changes in CO2–oil mixtures [41,42]. Recently, some scholars have utilized MD simulation to explore the viscosity changes and diffusing coefficients of nano-clusters in hydrocarbon fluids [43]. However, previous studies have predominantly focused on single-component crude oil, which could not accurately reflect the true nature of crude oil realistically. Therefore, the mutual effects between multi-component crude oil and CO2 are particularly important.
To better understand the dissolution and diffusion mechanisms of CO2 and multi-component crude oil as well as their influence on crude oil mobility, we utilize MD simulation to observe the process of CO2 dissolution and diffusion. Additionally, we understand the swelling impact of CO2 on crude, as well as the impact of conditions including temperature and pressure on the dissolution and diffusion. Finally, we predict the diffusion coefficient of multi-component crude oil and its impact on crude oil mobility. The included temperatures vary from 313 K to 323 K and the pressures range from 3 MPa to 10 MPa.

2. Methodology

2.1. Molecular Model

Figure 1 illustrates the molecular schematic diagram of the CO2–oil simulation. The simulation system consisted of two parts: (1) A multi-component crude oil model (25.87 × 25.87 × 25.87 Å3) before CO2 dissolution, which included C1~C33+. Since C17+ accounts for a small proportion, we adopted the method of dividing pseudo-components to construct a reasonable crude oil model and facilitate simulation by dividing C18~C33+ into C17+. Therefore, the constructed crude oil model contained components ranging from C1 to C17+ with a density of 0.82 g/cm3 (Table 1); (2) CO2 molecules were added as adsorbents to the crude oil model and simulated under different reservoir pressures (3 to 10 MPa) and temperatures (313 K, 318 K, 323 K). This part is mainly the simulation of CO2 dissolving within crude oil on the condition that reservoir statuses vary, without setting the reservoir structure. The simulated reservoir is a low-pressure one, and thus the pressure and temperature are based on actual reservoir conditions.

2.2. Simulation Details

We used the BIOVIA Material Studio 2019 software package [44] for the MD simulation, which mainly used Visualizer, Amorphous Cell, Sorption, and Forcite modules for the model construction, simulation, post-processing, and analysis. First, all alkanes and CO2 molecules were constructed and geometrically optimized in the Visualizer module. Then, the construction of the crude oil model was completed in the Amorphous Cell module. Each component was set according to the composition of the crude oil sample so that the density of the crude oil model was consistent with that of the sample; this step ensures the authenticity and accuracy of the simulation model. To keep the model’s energy minimized, we used the steepest descent method; after that, we equilibrated for 1 ns in the NVT ensemble by the way of using a simulation timestep of 1 fs. In this article, we retained the temperature at 313 K, 318 K, and 323 K, respectively, by the Nosé–Hoover thermostat. In addition, simulations were performed using a timestep of 1 fs in the NPT ensemble, and the pressure was controlled at 3 to 10 MPa by the Berendsen barostat. After that, we used the Sorption module for the Monte Carlo simulation; CO2 was added to the different crude oil systems as a diffused adsorption, and particle motion was sampled by the Metropolis method. In this work, the force fields for the CO2 and crude oil were taken from the COMPASS force field, which was confirmed to have good applicability to alkane molecules. Simultaneously, this approach was adequately parameterized and strictly monitored using initial high-level calculations to obtain parameters and optimize them to match the experimental data. In this force field, the Lennard-Jones 9-6 potential and Coulomb’s electrostatic potential denote the non-bonded potentials. The former depicts the potential energy difference values between the weak repulsive and attractive forces of the van der Waals force. It is generally displayed as follows:
E = i > j q i q j r i j + i > j E i j 2 r i j 0 r i j 9 3 r i j 0 r i j 6
r i j 0 = r i 0 6 + r j 0 6 2 1 6
where ij represents an atom pair; Eij is the potential well depth; rij0 denotes the zero potential distance for the atom pair; r is the distance between the two atoms.
We employed the particle mesh Ewald method to calculate the electrostatic interactions [45]. The cutoff length between the non-electrostatic interactions and electrostatic interactions was 1.25 nm [34,43]. Meanwhile, the Ewald method [34,43,46], having a precision of 0.01 kcal/mol, was applied. Periodic boundary conditions were used in the simulations. For the purpose of guaranteeing that the total energy of the simulation model was minimized and kept stable, we set 1 fs as a timestep for all the simulations in this article.

2.3. Diffusion Coefficient

Grounded on the definition of mean square displacement, the diffusion coefficient was calculated by Equation (3) [47,48]:
D = 1 6 N α lim t d d t i = 1 N α r i ( t ) r i ( 0 ) 2
where Nα represents the amount of diffused atoms in the system; ri(t) represents the displacement vector of molecule i from time 0 to time t. The coefficient of diffusion is worked out by choosing and utilizing the best trendline (y = ax + b) of the MSD curves. The diffusion coefficient was obtained using Equation (4) [49]:
D = a 6
According to the Stokes–Einstein (SE) equation, the coefficient of CO2 diffusion affects the viscosity of crude oil, and they have an inverse relationship. The SE formula was listed in Equation (5) as follows [50],
μ = k T 6 π α D
where T denotes the temperature; α is the CO2 molecular radius in 1.65 × 10⁻⁸ cm [51]; k represents Boltzmann’s constant in 1.38 × 10⁻²³ J/K; D represents the diffusion coefficient and unit is cm2/s; and μ is the oil viscosity in Pa·s.

2.4. Model Validation

Under different pressure and temperature conditions, crude oil models exhibited different configurations and contact relations at the microscopic molecular level, resulting in different crude oil volumes, densities, and viscosity properties at the macroscopic level.
The density of individual oil molecules in the crude oil model, simulated for 1 ns under the NPT ensemble, was compared with the data provided by the National Institute of Standards and Technology (NIST) [52], as shown in Figure 2. The established single-component crude oil model was found to be reasonable. In addition, the density of the multi-component crude oil model was compared with the experimental test results of field oil samples, both of which were 0.82 g/cm3. Therefore, the model is considered reliable.

3. Results and Discussion

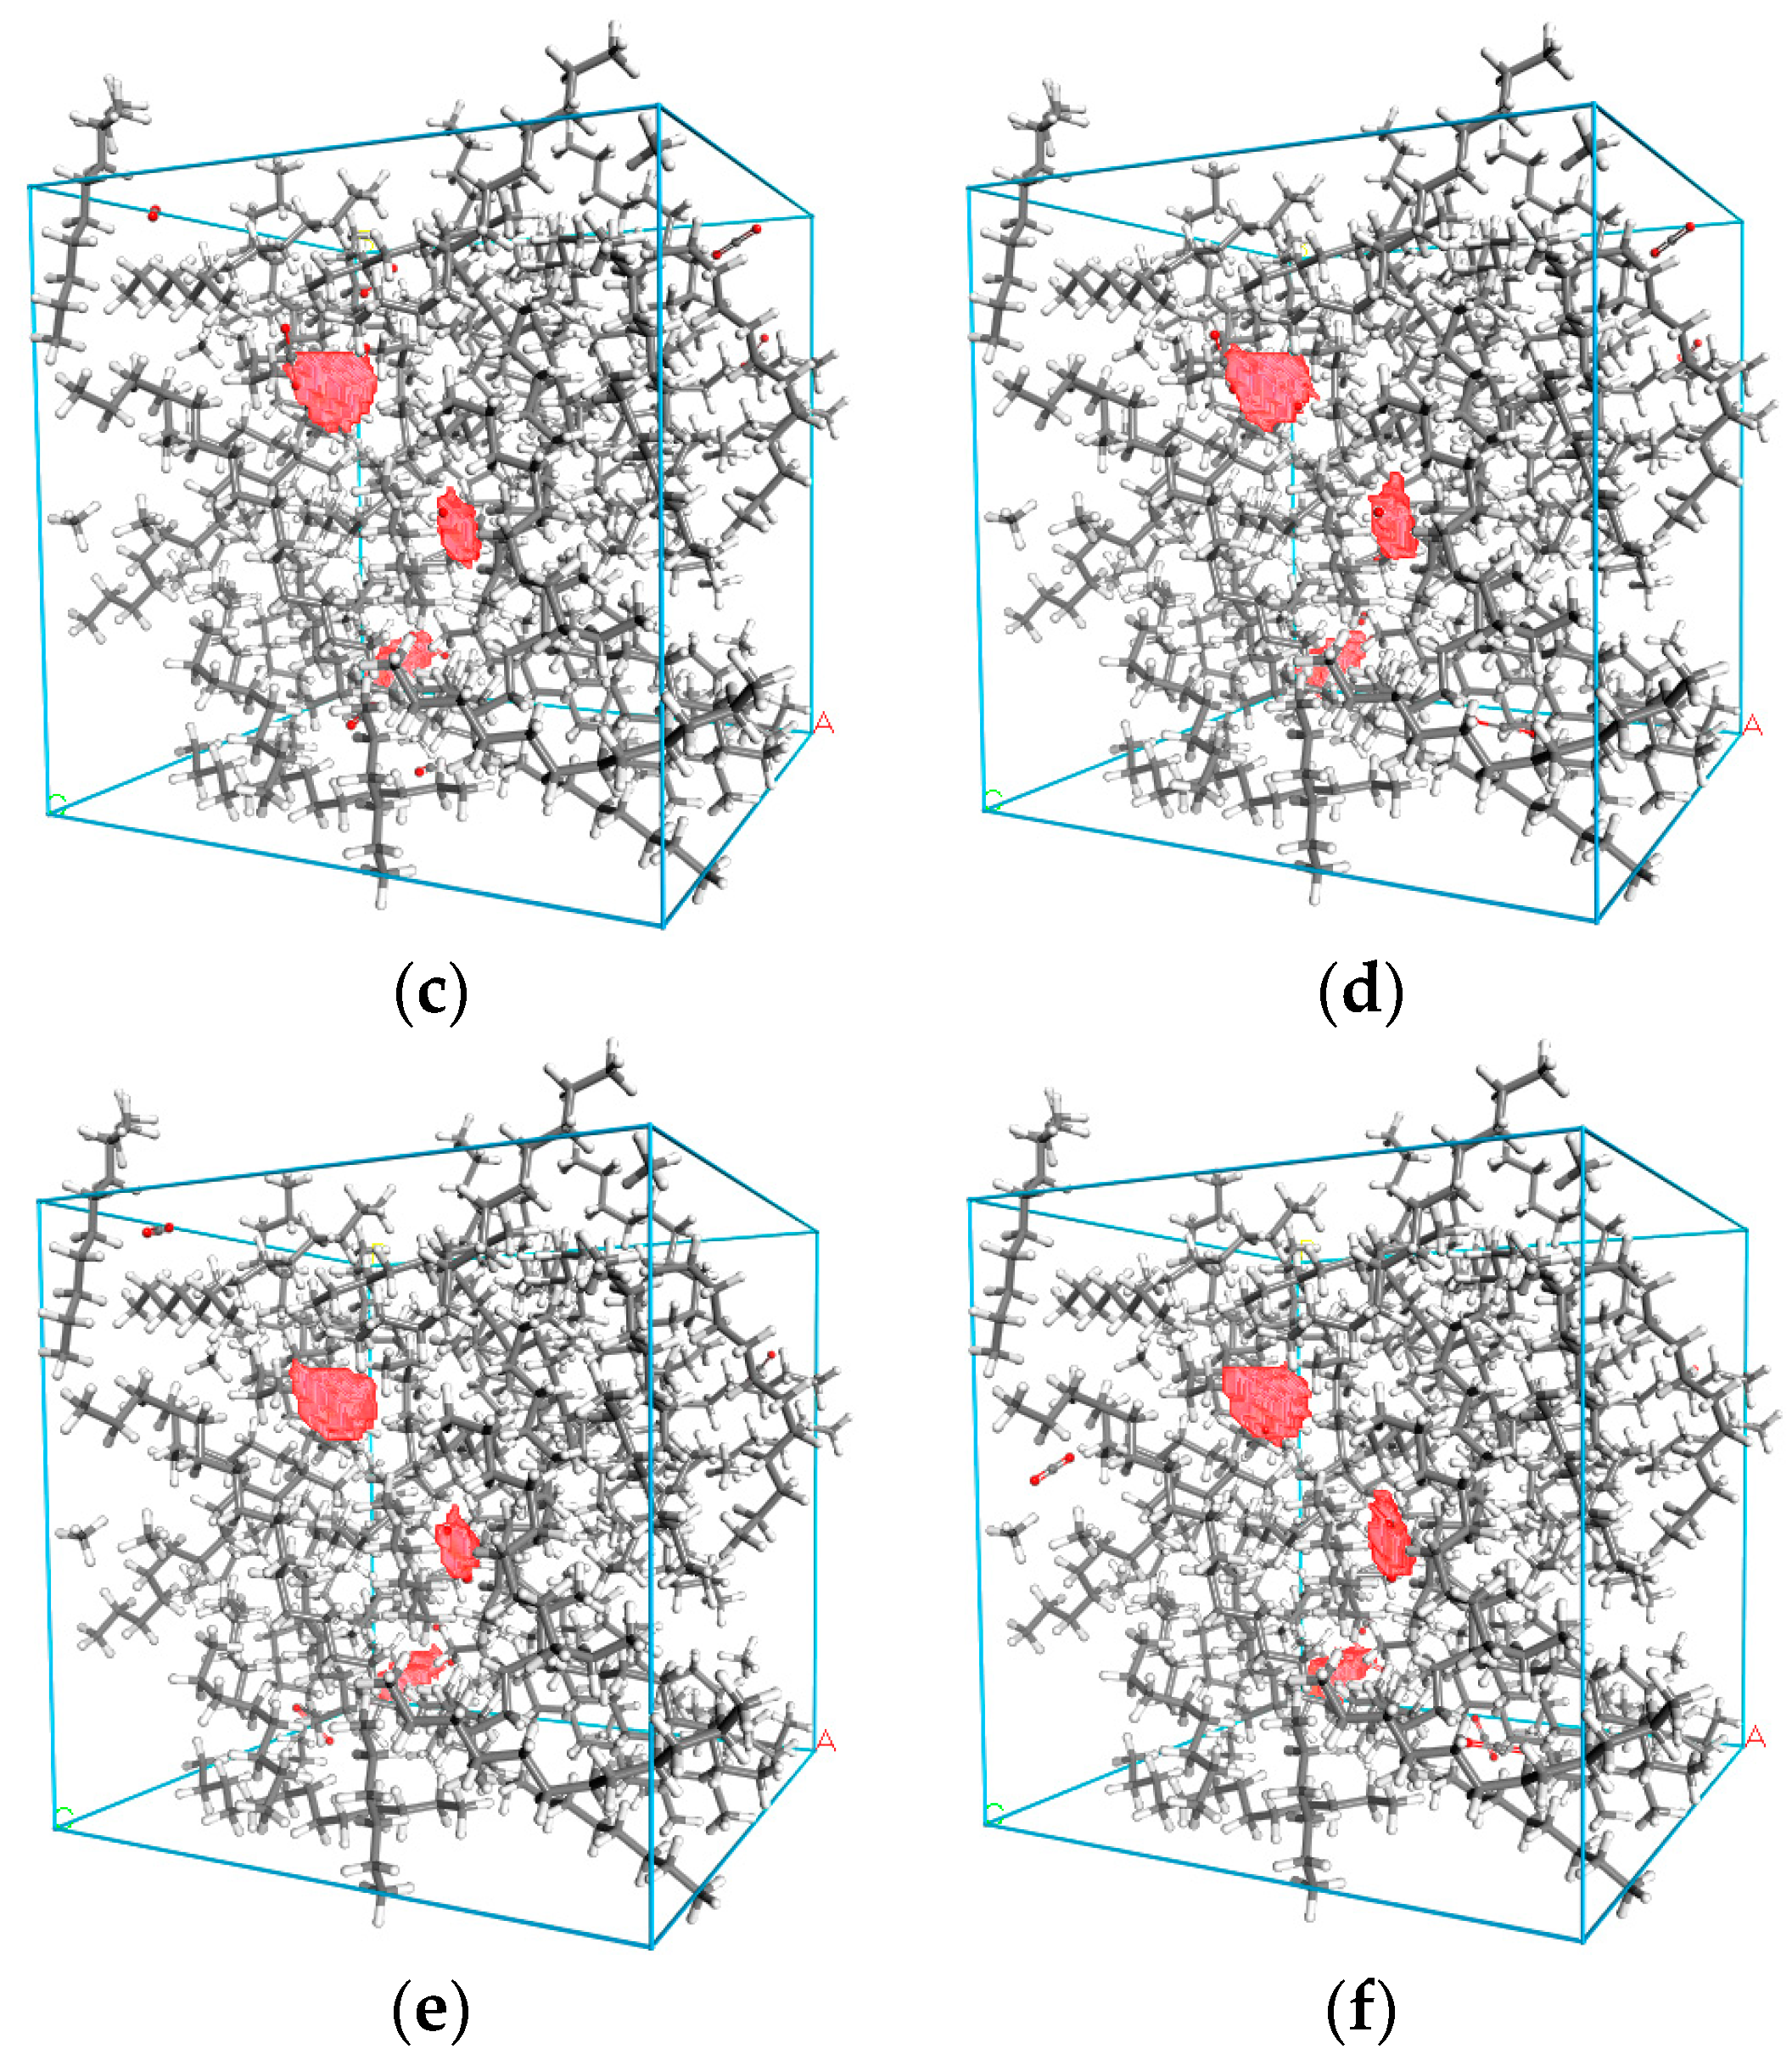
3.1. Density Distribution of CO2

The distribution of CO2 density dissolved into different systems is shown in Figure 3. The red portion represents the concentration distribution of CO2 molecules dissolved in different systems. The location and approximate quantities of CO2 molecules dissolved and diffused in different crude oil systems can be observed clearly. As shown in Figure 3, there were some large voids between different alkane molecules, and CO2 dissolved and diffused into the voids. At the same temperature, with increasing pressure, the amount of CO2 molecules dissolved in the different systems also increases, and the concentration distribution of CO2 between the alkane molecular voids becomes more obvious. There were some differences in the behavior of temperature and pressure. Under the same pressure, with increasing temperature, the dissolution of CO2 increased. High temperatures have a stronger effect on the CO2 dissolving into different oil systems. The impact of temperature and pressure on the mechanism was later investigated in detail.

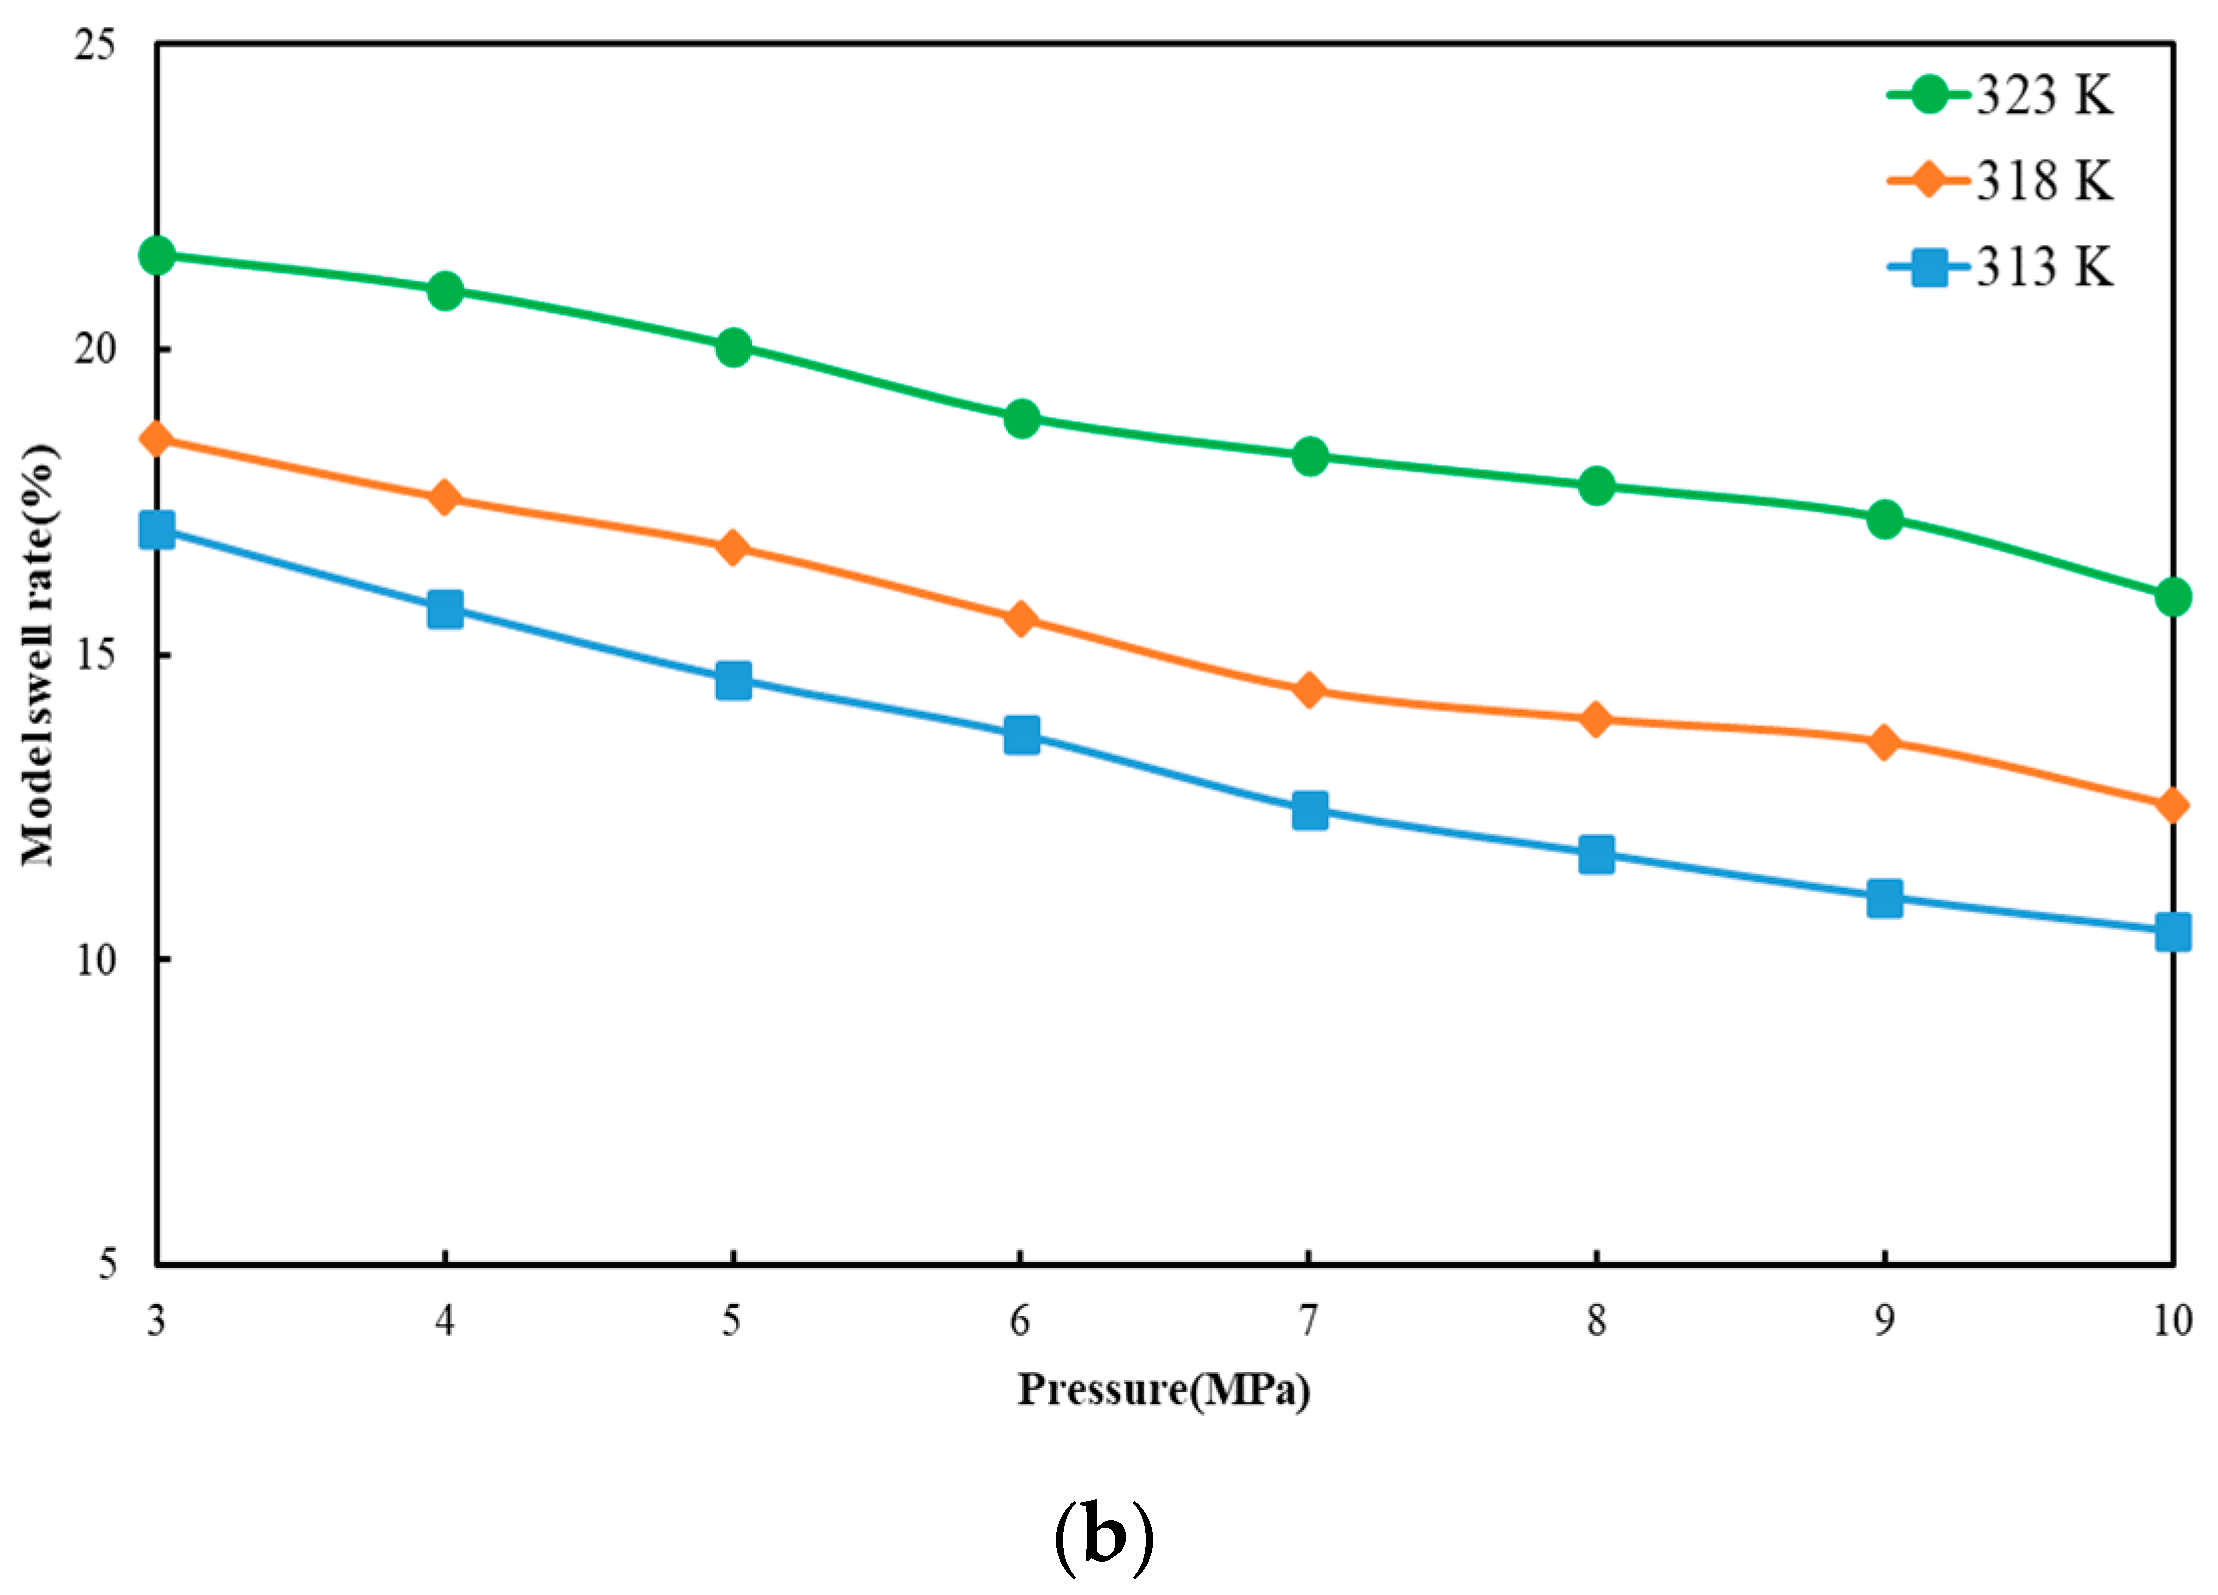
3.2. Model Swelling Rate

As the pressure increased, the crude oil systems were compressed and their volumes decreased. However, the temperature increase aggravated thermal motion between molecules, leading to an increase in system volume. CO2 entered the alkane molecule voids through dissolution and diffusion, further increasing crude oil system volume. The volume swelling rate of the model was calculated by Equation (6):
ε = V f i n V i n i V i n i
where Vfin represents the final model’s volume; Vini represents the initial model’s volume; and ε defines the model swelling rate.
The variation trend in the volume swelling rates before and after dissolving CO2 in the crude oil systems, at various temperatures and pressures, is revealed in Figure 4. It can be grasped that the models were compressed due to the decline in pressure, the volume of each model also decreased with the increase in pressure. The crude oil models exhibited fluctuations in volume before dissolving CO2, mainly due to a large number of components in the crude oil model and differences in the chain length among alkane molecules, which affected the process of volume compression. However, the volume variation in the crude oil models decreased almost in a linear trend after dissolving the CO2, and the rate of volume variation for each model was also similar and smaller than that of the undissolved CO2 models. This indicates that, after filling the alkane molecular voids with CO2 through dissolution and diffusion, the potential energy difference between the internal and external systems decreased. These systems had almost reached dynamic equilibrium and were less affected by external circumstances. The specific volume of the crude oil model before and after dissolving CO2 and the calculated volume swelling rate at different pressures in the 323 K system are provided in Table 2 and Table 3 (Tables S1–S4).
As the temperature increased, these models swelled and their volume increased. From the simulation results of the systems at 313 K, 318 K, and 323 K, the average swelling rate of the crude oil models before dissolving the CO2 molecules was 13.04% and the average swelling rate of the crude oil model after dissolving CO2 molecules was 32.65% for every temperature increase of 5 K (Figure 5). The increase in temperature promoted both the dissolution and diffusion of CO2 molecules and the swelling of the crude oil models. The reason is that as the temperature increases, the kinetic energy of all molecules increases, leading to increases in movement ability of the alkane molecules and the internal space of the crude oil system, resulting in system swelling. The movement ability of CO2 molecules was also enhanced, increasing the probability of entering the intermolecular voids of alkanes and enhancing both dissolution and diffusion. As a result, the amount of dissolved CO2 also increased.

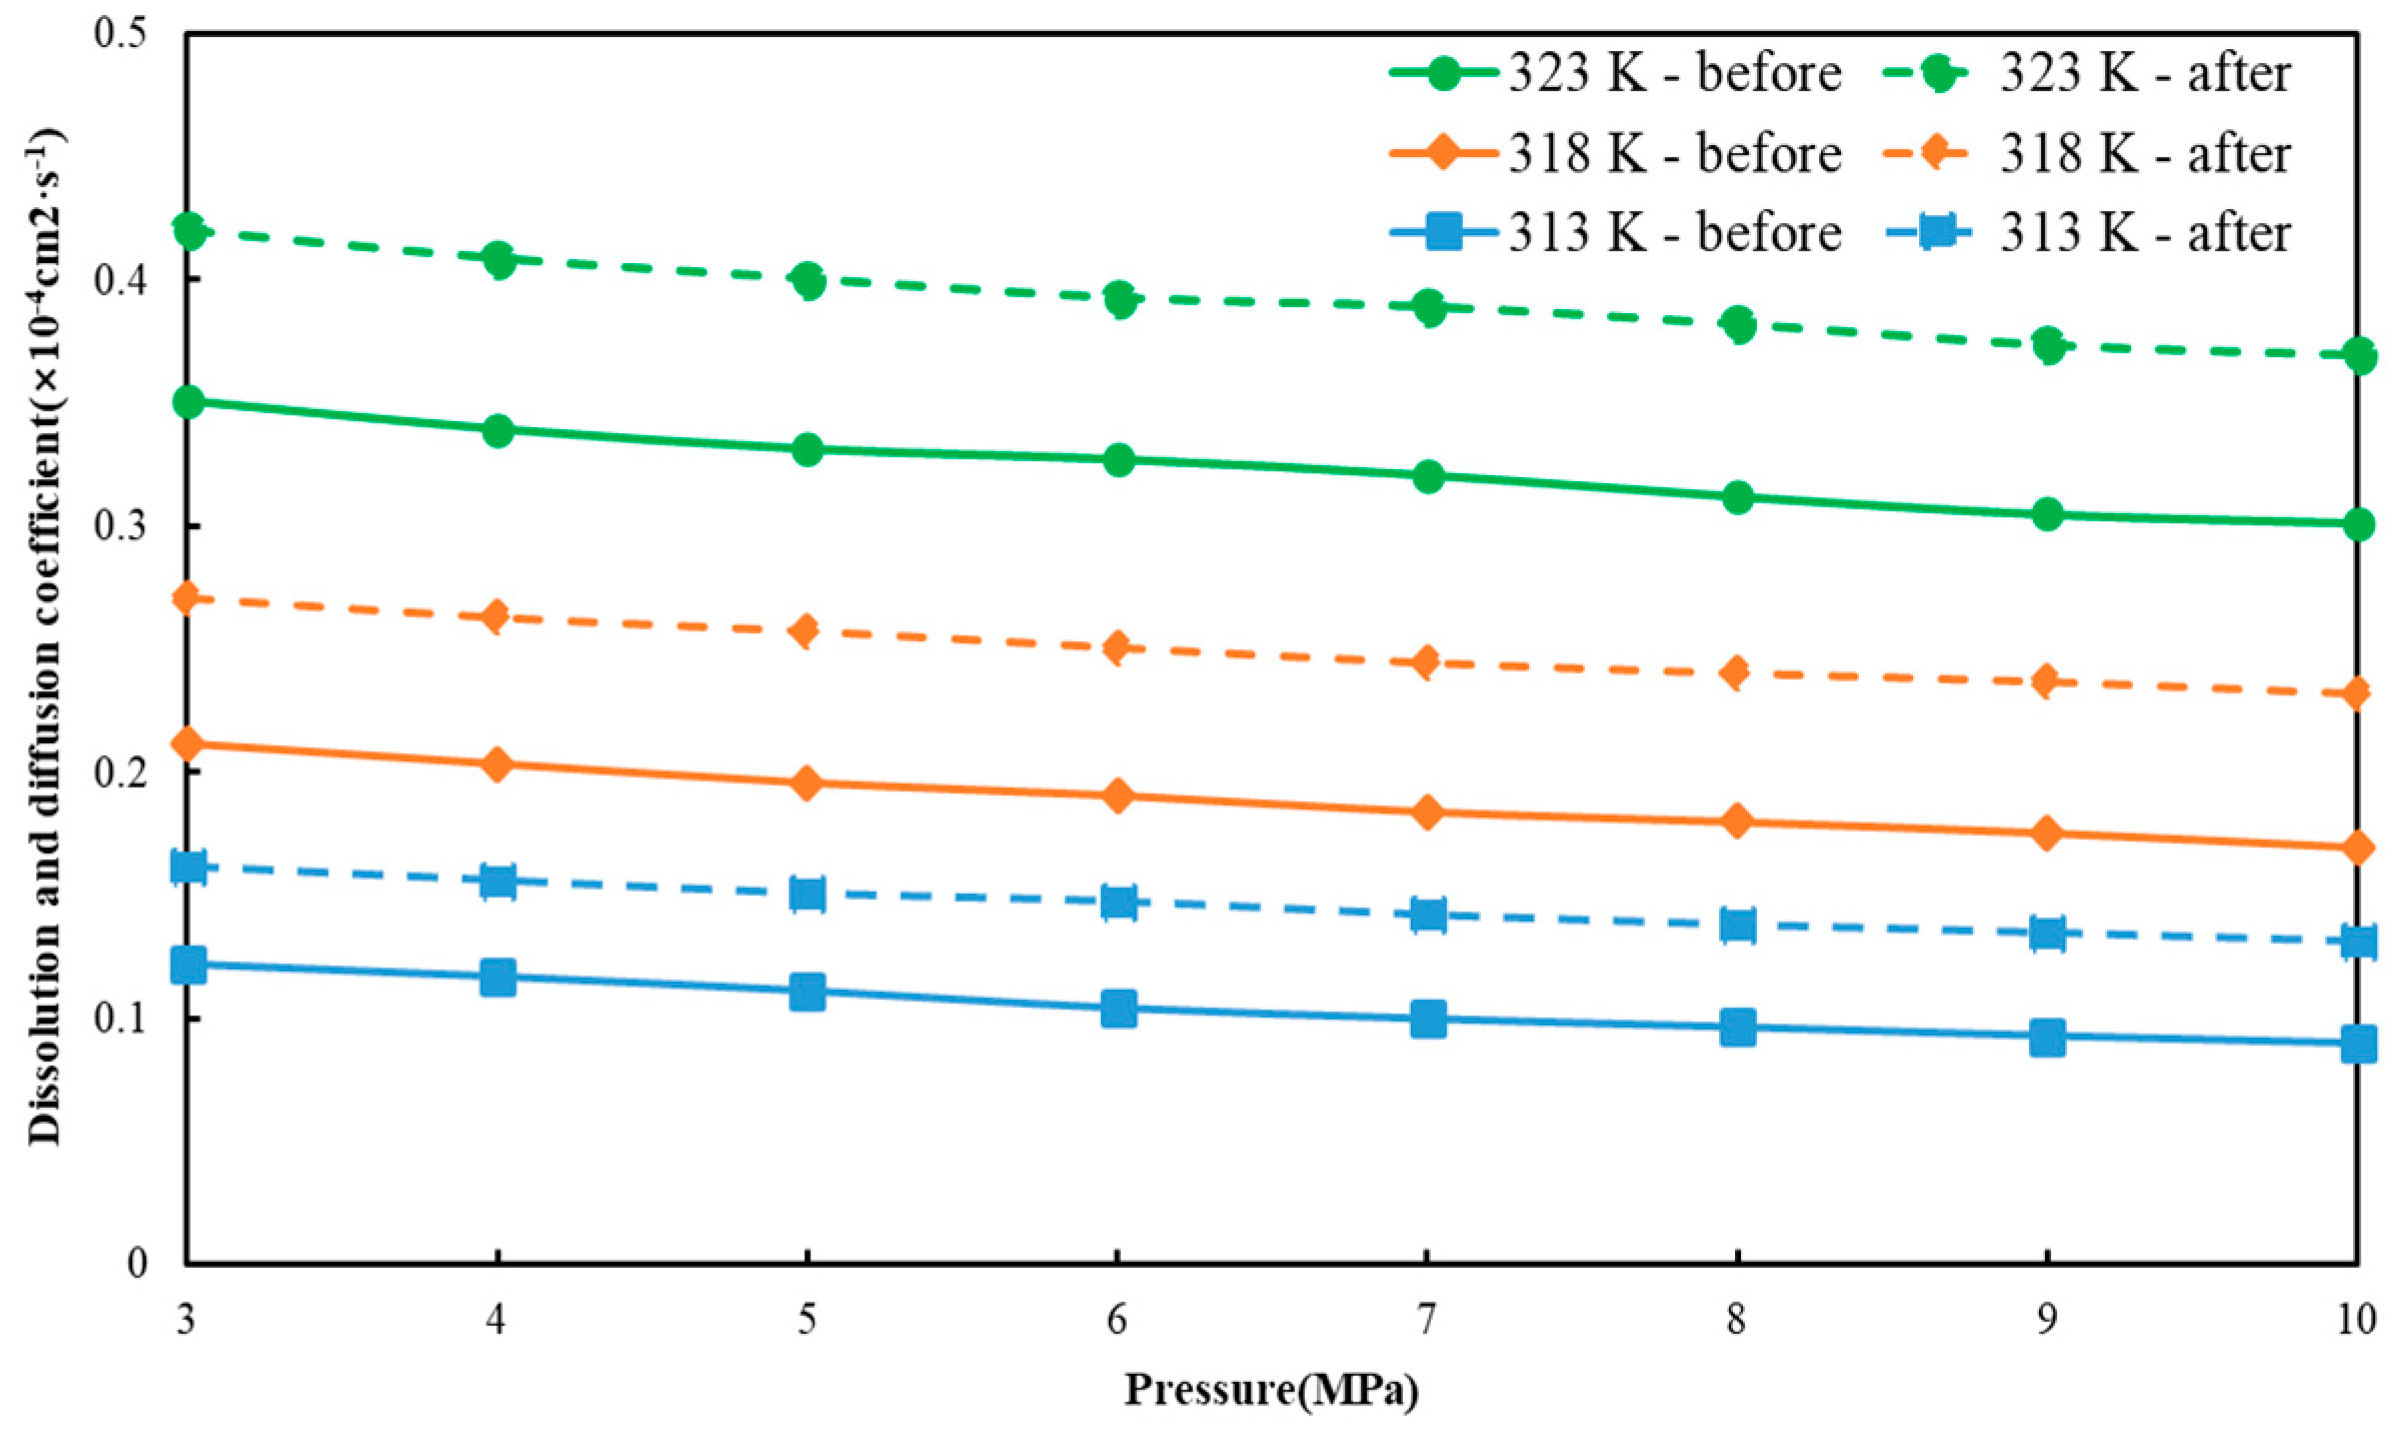
3.3. Dissolution and Diffusion

The coefficients of the amount of CO2 dissolving in different crude systems are shown in Figure 6. According to the curve analysis, at the same temperature, the dissolution of CO2 in different systems increases with pressure. This indicates that an increase in pressure promoted the dissolution of CO2 molecules. The reason is that there existed a potential energy difference between the internal voids of alkane molecules, and the external space was occupied by CO2. At higher pressures, this potential energy difference increased, promoting the filling of CO2 into the molecular voids of alkane and resulting in the stronger dissolution of CO2.
In Figure 6, the dissolution coefficient of CO2 increased rapidly at first and then gradually reached a relatively gentle growth with increasing pressure. In the early stage, when the pressure was low, there was a small potential energy difference between the internal area of the alkane molecules and the external area of the CO2, resulting in limited dissolution of CO2 in the voids. At this time, the attraction between the CO2 and the alkane molecules was dominant, and the dissolution of CO2 increased as pressure increased. Then, the dissolution gradually increased with pressure until it reached a plateau, indicating that as pressure increased, the distance between CO2 and alkane molecules decreased and repulsive forces between them became dominant. The gradual increase in CO2 dissolution continued until dynamic equilibrium was reached.
Under the same pressure, the dissolution of CO2 in the 323 K system was always better than in other systems; the lowest amount was in the 313K system and there was a medium amount in the 318 K system. The dissolution behavior of molecules at different temperatures indicates that the movement of molecules was slower at lower temperatures, and the capacity for voids between alkane molecules to dissolve CO2 was limited, which reduced the dissolution of CO2. However, at higher temperatures, the kinetic energy of CO2 increased, leading to increases in the free path of molecular motion and collision probability between CO2 and alkane molecules. This affected the size of voids and resulted in a faster dissolution rate for CO2. The dissolution rates of CO2 were higher in the 323 K system than in the 318 K system but relatively higher in the initial 318 K system. This phenomenon indicates that, despite the positive promotion effect of high temperatures, pressure conditions still inhibited the dissolution of CO2. The mechanism behind this pressure inhibition will be discussed at great length in the coming exposition.
The coefficient of CO2 diffusion was determined at various pressure and temperature conditions (50). As shown in Figure 7, the pressure increased while the coefficient of CO2 diffusion declined at the same temperature. However, with an increase in temperature at the same pressure, the diffusion coefficient of CO2 increased. This is similar to the variation in the diffusion coefficient for multi-component crude oil, which is analyzed in the following sections.

3.4. Prediction of Diffusion Coefficient

To obtain the diffusion coefficient with the help of molecular dynamic simulation, the density distribution of the alkane molecules is supposed to be chiefly calculated. The density distribution of CO2 in the crude oil systems under different conditions was obtained by simulation, as shown in Figure 3. Then, the specific amount of CO2 dissolved in the oil systems was predicted, and with these numbers, we were able to calculate the diffusion coefficient of multi-component crude oil molecules. Figure 8 shows the Mean Square Displacement (MSD) vs. simulation time diagram for the 323 K system under varying pressure conditions.
As shown in Figure 8, the crude oil systems range widely between 0 and 2200 Å2 before dissolving CO2 in MSD, and the MSD range changed after dissolving the CO2, which is between 0 and 2600 Å2. Then, the diffusion coefficient of the multi-component crude oil was calculated, as shown in Figure 9. With increasing pressure, the volume swelling rate of the crude oil system model decreased under the influence of external pressure due to the diffusion coefficient decrease before and after dissolving CO2. For example, the diffusion coefficient in the 323 K system dropped from 0.3506 × 10⁻⁴ cm2/s at 3 MPa to 0.3015 × 10⁻⁴ cm2/s at 10 MPa and it declined from 0.4198 × 10⁻⁴ cm2/s at 3 MPa to 0.3694 × 10⁻⁴ cm2/s at 10 MPa before and after dissolving CO2, respectively. With an increase in temperature, the kinetic energy of all molecules increased, resulting in a higher diffusion coefficient. For instance, the diffusion coefficient of the 3 MPa increased from 0.1224 × 10⁻⁴ cm2/s at 313 K to 0.3506 × 10⁻⁴ cm2/s at 323 K and from 0.1618 × 10⁻⁴ cm2/s at 313 K to 0.4198 × 10⁻⁴ cm2/s at 323 K before and after dissolving CO2, respectively. From the analysis of these data and Figure 9, it can be concluded that the diffusion coefficient of the system was generally larger after dissolving CO2 than before. This is because the dissolved CO2 occupied alkane molecular voids, which reduced interaction forces between the alkane molecules.
The diffusion of multi-component crude oil and CO2 was calculated, respectively. The diffusion coefficient of crude oil and its variation with temperature were analyzed before and after the dissolution of CO2. It was found that both the dissolution of CO2 and an increase in temperature can improve the mobility of crude oil. However, the viscosity reduction effect of temperature on multi-component crude oil was better than that of CO2 dissolution. On the one hand, as pressure increased, the dissolution coefficient of CO2 also increased; on the other hand, as pressure increased, the interaction between alkane molecules also increased and thus reduced the diffusion coefficient of both CO2 and the alkane molecules. The mobility of crude oil generally showed a slight improvement.

4. Conclusions and Future Perspectives

In this study, molecular dynamics simulations were employed to investigate the dissolution and diffusion behavior of CO2 in multi-component crude oil and its impact on oil mobility under varying temperature and pressure conditions. The results demonstrate that increasing temperature and pressure enhances the solubility of CO2 in crude oil, promoting significant swelling and viscosity reduction, which in turn improves the mobility of the oil. The diffusion coefficients of CO2 and crude oil were calculated, showing a temperature-dependent increase in diffusion, while higher pressures inhibited the diffusion process.
The findings from this study have important implications for enhanced oil recovery (EOR) and carbon sequestration. The improved understanding of CO2 behavior in crude oil systems offers valuable insights for optimizing CO2 injection processes in oil reservoirs, particularly in low-permeability and mature fields. By promoting crude oil flow and simultaneously storing CO2 underground, this dual approach has the potential to increase oil recovery while contributing to global carbon capture and storage (CCS) efforts.
However, the model used in this research is subject to several limitations. While molecular dynamics simulations provide a detailed molecular-level perspective, they do not fully represent the complexities of actual reservoirs, including geological heterogeneity, broader hydrocarbon mixtures, and field-specific conditions. These limitations suggest the need for further research to bridge the gap between molecular simulations and real-world reservoir behavior.
Future studies should focus on incorporating more complex fluid compositions and geological factors into the model as well as validating these findings with experimental and field-scale data. Additionally, extending the application of CO2 in EOR requires further exploration of optimal injection strategies that balance both oil recovery and CO2 sequestration under various reservoir conditions. This study provides a theoretical foundation for such future research, with the goal of enhancing the efficiency and sustainability of CO2-driven oil recovery processes.

Supplementary Materials

The following supporting information can be downloaded at: https://www.mdpi.com/article/10.3390/pr12102248/s1, Table S1: Crude oil model volumes and swell rates in the 313 K systems; Table S2: CO2-crude oil model volumes and swell rates in the 313 K systems; Table S3: Crude oil model volumes and swell rates in the 318 K systems; Table S4: CO2-crude oil model volumes and swell rates in the 318 K systems. Figure S1: MSD curves of crude oil systems before and after dissolving CO2 molecules in 313 K and 318 K systems at different pressures. (a) Crude oil systems in 313 K; (b) CO2-Crude oil systems in 313 K; (c) Crude oil systems in 318 K; (d) CO2-Crude oil systems in 318 K.

Author Contributions

Conceptualization, C.G.; methodology, W.F.; formal analysis, D.C.; investigation, K.W. (Keqin Wu); resources, Y.Z.; data curation, S.P.; writing—original draft preparation, Y.G.; writing—review and editing, H.W.; supervision, K.W. (Keliu Wu). All authors have read and agreed to the published version of the manuscript.

Funding

This research received no external funding.

Data Availability Statement

The data are contained within the article.

Conflicts of Interest

Authors Chunning Gao, Yongqiang Zhang, Wei Fan were employed by the Changqing Oilfield Branch Company; Dezhao Chen, Keqin Wu, Shuai Pan were employed by the Changqing Oilfield Company. The remaining authors declare that the research was conducted in the absence of any commercial or financial relationships that could be construed as a potential conflict of interest.

Nomenclature

SymbolDescriptionUnit
Eijthe potential well depth
rij0the zero potential distance for the atom pair
rthe distance between the two atoms
Nαthe amount of diffused atoms in the system
ri(t)the displacement vector of molecule i from time 0 to time t
TtemperatureK
αCO2 molecular radius1.65 × 10−8 cm
kBoltzmann’s constant1.38 × 10−23 J/K
Dthe diffusion coefficientcm2/s
μthe oil viscosity Pa·s
Vfinthe final model’s volumeÅ3
Vinithe initial model’s volumeÅ3
εthe model swelling rate%
PpressureMPa

References

  1. Kaya, Y.; Gale, J. Greenhouse Gas Control Technologies. In Proceedings of the 6th International Conference on Greenhouse Gas Control Technologies, Kyoto, Japan, 1–4 October 2002; Available online: https://www.sciencedirect.com/book/9780080442761/greenhouse-gas-control-technologies-6th-international-conference#book-description (accessed on 14 July 2024).
  2. Ye, H.; Liu, Q.; Peng, B. Research progress in evaluation of carbon storage potential based on CO2 flooding technology. Clean Coal Technol. 2021, 27, 107–116. [Google Scholar] [CrossRef]
  3. Song, X.; Wang, F.; Ma, D.; Gao, M.; Zhang, Y. Progress and prospect of carbon dioxide capture, utilization and storage in CNPC oilfields. Pet. Explor. Dev. 2023, 50, 229–244. [Google Scholar] [CrossRef]
  4. Ricky, E.X.; Mwakipunda, G.C.; Nyakilla, E.E.; Kasimu, N.A.; Wang, C.; Xu, X. A comprehensive review on CO2 thickeners for CO2 mobility control in enhanced oil recovery: Recent advances and future outlook. J. Ind. Eng. Chem. 2023, 126, 69–91. [Google Scholar] [CrossRef]
  5. Li, Q.; Liu, J.; Wang, S.; Guo, Y.; Han, X.; Li, Q.; Cheng, Y.; Dong, Z.; Li, X.; Zhang, X. Numerical insights into factors affecting collapse behavior of horizontal wellbore in clayey silt hydrate-bearing sediments and the accompanying control strategy. Ocean Eng. 2024, 297, 117029. [Google Scholar] [CrossRef]
  6. Qin, J.; Han, H.; Liu, X. Application and enlightenment of carbon dioxide flooding in the United States of America. Pet. Explor. Dev. 2015, 42, 232–240. [Google Scholar] [CrossRef]
  7. Perera, M.S.A.; Gamage, R.P.; Rathnaweera, T.D.; Ranathunga, A.S.; Koay, A.; Choi, X. A Review of CO2-Enhanced Oil Recovery with a Simulated Sensitivity Analysis. Energies 2016, 9, 481. [Google Scholar] [CrossRef]
  8. Bui, M.; Adjiman, C.S.; Bardow, A.; Anthony, E.J.; Boston, A.; Brown, S.; Fennell, P.S.; Fuss, S.; Galindo, A.; Hackett, L.A.; et al. Carbon capture and storage (CCS): The way forward. Energy Environ. Sci. 2018, 11, 1062–1176. [Google Scholar] [CrossRef]
  9. Miao, J.; Yang, G. Status and Prospect of CO2 Capture and Oil Displacement in China. Pet. Petrochem. Today 2020, 28, 32–37. [Google Scholar]
  10. Orr, F.M.; Heller, J.P.; Taber, J.J. Carbon dioxide flooding for enhanced oil recovery: Promise and problems. J. Am. Oil Chem. Soc. 1982, 59, 810A–817A. [Google Scholar] [CrossRef]
  11. Zhang, Y.P.; Hyndman, C.L.; Maini, B.B. Measurement of gas diffusivity in heavy oils. J. Pet. Sci. Eng. 2000, 25, 37–47. [Google Scholar] [CrossRef]
  12. Yang, C.; Gu, Y. Diffusion coefficients and oil swelling factors of carbon dioxide, methane, ethane, propane, and their mixtures in heavy oil. Fluid Phase Equilibria 2006, 243, 64–73. [Google Scholar] [CrossRef]
  13. Abedini, A.; Torabi, F. On the CO2 storage potential of cyclic CO2 injection process for enhanced oil recovery. Fuel 2014, 124, 14–27. [Google Scholar] [CrossRef]
  14. Song, Z.; Song, Y.; Li, Y.; Bai, B.; Song, K.; Hou, J. A critical review of CO2 enhanced oil recovery in tight oil reservoirs of North America and China. Fuel 2020, 276, 118006. [Google Scholar] [CrossRef]
  15. Ren, D.; Wang, X.; Kou, Z.; Wang, S.; Wang, H.; Wang, X.; Tang, Y.; Jiao, Z.; Zhou, D.; Zhang, R. Feasibility evaluation of CO2 EOR and storage in tight oil reservoirs: A demonstration project in the Ordos Basin. Fuel 2023, 331, 125652. [Google Scholar] [CrossRef]
  16. Li, L.; Zhang, Y.; Sheng, J.J. Effect of the Injection Pressure on Enhancing Oil Recovery in Shale Cores during the CO2 Huff-n-Puff Process When It Is above and below the Minimum Miscibility Pressure. Energy Fuels 2017, 31, 3856–3867. [Google Scholar] [CrossRef]
  17. Hawthorne, S.B.; Miller, D.J. A comparison of crude oil hydrocarbon mobilization by vaporization gas drive into methane, ethane, and carbon dioxide at 15.6 MPa and 42 °C. Fuel 2019, 249, 392–399. [Google Scholar] [CrossRef]
  18. Assef, Y.; Almao, P.P. Evaluation of Cyclic Gas Injection in Enhanced Recovery from Unconventional Light Oil Reservoirs: Effect of Gas Type and Fracture Spacing. Energies 2019, 12, 1370. [Google Scholar] [CrossRef]
  19. Li, L.; Sheng, J.J. Experimental study of core size effect on CH4 huff-n-puff enhanced oil recovery in liquid-rich shale reservoirs. J. Nat. Gas Sci. Eng. 2016, 34, 1392–1402. [Google Scholar] [CrossRef]
  20. Hawthorne, S.B.; Sorensen, J.A.; Miller, D.J.; Gorecki, C.D.; Harju, J.A.; Pospisil, G. Laboratory Studies of Rich Gas Interactions with Bakken Crude Oil to Support Enhanced Oil Recovery. In Proceedings of the 7th Unconventional Resources Technology Conference, Denver, CO, USA, 22–24 July 2019. [Google Scholar]
  21. Hill, E.S.; Lacey, W.N. Rate of solution of propane in quiescent liquid hydrocarbons. Am. Chem. Soc. 1934, 26, 1327–1331. [Google Scholar] [CrossRef]
  22. Reamer, H.H.; Opfell, J.B.; Sage, B.H. Diffusion coefficients in hydrocarbon systems methane-decane-methane in liquid phase-methane-decane-methane in liquid phase. Am. Chem. Soc. 1956, 48, 275–282. [Google Scholar] [CrossRef]
  23. Riazi, M.R. A new method for experimental measurement of diffusion coefficients in reservoir fluids. J. Pet. Sci. Eng. 1996, 14, 235–250. [Google Scholar] [CrossRef]
  24. Liu, Y.; Teng, Y.; Lu, G.; Jiang, L.; Zhao, J.; Zhang, Y.; Song, Y. Experimental study on CO2 diffusion in bulk n-decane and n-decane saturated porous media using micro-CT. Fluid Phase Equilibria 2016, 417, 212–219. [Google Scholar] [CrossRef]
  25. Fayazi, A.; Kantzas, A. Determining Diffusivity, Solubility, and Swelling in Gaseous Solvent–Heavy Oil Systems. Ind. Eng. Chem. Res. 2019, 58, 10031–10043. [Google Scholar] [CrossRef]
  26. Zhao, Y.; Mao, X.; Huang, M.; Song, Y. Experimental method for in-situ measurement of CO2-oil diffusion coefficient in porous media using NMR. Exp. Technol. Manag. 2022, 39, 19–23. [Google Scholar] [CrossRef]
  27. Li, Z.; Dong, M. Experimental Study of Carbon Dioxide Diffusion in Oil-Saturated Porous Media under reservoir conditions. Ind. Eng. Chem. Res. 2009, 48, 9307–9317. [Google Scholar] [CrossRef]
  28. Song, L.; Kantzas, A.; Bryan, J. Experimental Measurement of Diffusion Coefficient of CO2 in Heavy Oil Using X-ray Computed-Assisted Tomography under Reservoir Conditions. In Proceedings of the Canadian Unconventional Resources and International Petroleum Conference, Calgary, AB, Canada, 19–21 October 2010. [Google Scholar] [CrossRef]
  29. Afari, S.; Ling, K.; Sennaoui, B.; Maxey, D.; Oguntade, T.; Porlles, J. Optimization of CO2 huff-n-puff EOR in the Bakken Formation using numerical simulation and response surface methodology. J. Pet. Sci. Eng. 2022, 215, 110552. [Google Scholar] [CrossRef]
  30. Amarasinghe, W.; Fjelde, I.; Guo, Y. CO2 dissolution and convection in oil at realistic reservoir conditions: A visualization study. J. Nat. Gas Sci. Eng. 2021, 95, 104113. [Google Scholar] [CrossRef]
  31. Li, C.; Pu, H.; Zhong, X.; Li, Y.; Zhao, J.X. Interfacial interactions between Bakken crude oil and injected gases at reservoir temperature: A molecular dynamics simulation study. Fuel 2020, 276, 118058. [Google Scholar] [CrossRef]
  32. Jin, H.; Wu, Y.; Guo, L.; Su, X. Molecular dynamic investigation on hydrogen production by polycyclic aromatic hydrocarbon gasification in supercritical water. Int. J. Hydrogen Energy 2016, 41, 3837–3843. [Google Scholar] [CrossRef]
  33. Liu, X.; Wang, T.; He, M. Investigation on the condensation process of HFO refrigerants by molecular dynamics simulation. J. Mol. Liq. 2019, 288, 111034. [Google Scholar] [CrossRef]
  34. Ding, W.; Shi, J.; Wei, W.; Cao, C.; Jin, H. A molecular dynamics simulation study on solubility behaviors of polycyclic aromatic hydrocarbons in supercritical water/hydrogen environment. Int. J. Hydrogen Energy 2021, 46, 2899–2904. [Google Scholar] [CrossRef]
  35. Li, B.; Liu, G.; Xing, X.; Chen, L.; Lu, X.; Teng, H.; Wang, J. Molecular dynamics simulation of CO2 dissolution in heavy oil resin-asphaltene. J. CO2 Util. 2019, 33, 303–310. [Google Scholar] [CrossRef]
  36. Seyyedattar, M.; Ghamartale, A.; Zendehboudi, S.; Butt, S. Assessment of CO2-Oil swelling behavior using molecular dynamics simulation: CO2 utilization and storage implication. J. Mol. Liq. 2023, 379, 121582. [Google Scholar] [CrossRef]
  37. Moh, D.Y.; Zhang, H.; Sun, S.; Qiao, R. Molecular anatomy and macroscopic behavior of oil extraction from nanopores by CO2 and CH4. Fuel 2022, 324, 124662. [Google Scholar] [CrossRef]
  38. Yuan, L.; Zhang, Y.; Liu, S.; Zhang, J.; Song, Y. Molecular dynamics simulation of CO2-oil miscible fluid distribution and flow within nanopores. J. Mol. Liq. 2023, 380, 121769. [Google Scholar] [CrossRef]
  39. Zhang, J.; Pan, Z.; Liu, K.; Burke, N. Molecular Simulation of CO2 Solubility and Its Effect on Octane Swelling. Energy Fuels 2013, 27, 2741–2747. [Google Scholar] [CrossRef]
  40. Li, C.; Pu, H.; Zhao, J.X. Molecular Simulation Study on the Volume Swelling and the Viscosity Reduction of n-Alkane/CO2 Systems. Ind. Eng. Chem. Res. 2019, 58, 8871–8877. [Google Scholar] [CrossRef]
  41. Zhang, J.; Seyyedi, M.; Clennell, M.B. Molecular Dynamics Simulation of Transport and Structural Properties of CO2–Alkanes. Energy Fuels 2021, 35, 6700–6710. [Google Scholar] [CrossRef]
  42. Song, Y.-L.; Gu, S.-H.; Song, Z.-J.; Zhang, Z.-Y.; Chang, X.-Y.; Guo, J. Effect of confinement on the three-phase equilibrium of water-oil-CO2 mixtures in nanopores. Pet. Sci. 2022, 19, 203–210. [Google Scholar] [CrossRef]
  43. Loya, A.; Stair, J.L.; Jafri, A.R.; Yang, K.; Ren, G. A molecular dynamic investigation of viscosity and diffusion coefficient of nanoclusters in hydrocarbon fluids. Comput. Mater. Sci. 2015, 99, 242–246. [Google Scholar] [CrossRef]
  44. Materials Studio. A Material Modeling Software of Accelrys Company; United States [EB/OL]. Available online: https://www.3ds.com/products-services/biovia/ (accessed on 14 July 2024).
  45. Gingrich, T.R.; Wilson, M. On the Ewald summation of Gaussian charges for the simulation of metallic surfaces. Chem. Phys. Lett. 2010, 500, 178–183. [Google Scholar] [CrossRef]
  46. Higgoda, U.A.; Hellmann, R.; Koller, T.M.; Fröba, A.P. Enhancement of the predictive power of molecular dynamics simulations for the determination of self-diffusion coefficient and viscosity demonstrated for propane. Fluid Phase Equilibria 2019, 496, 69–79. [Google Scholar] [CrossRef]
  47. Wang, S.; Liu, C.; Jian, Z. Molecular dynamics simulation of diffusion coefficient of Al-Cu alloy. J. Xi’an Technol. Univ. 2018, 38, 559–564. [Google Scholar] [CrossRef]
  48. Zhang, J.; Tang, C.; Qiu, Q.; Yang, L. Effect of water on the diffusion of small molecular weight acids in nano-SiO2 modified insulating oil. J. Mol. Liq. 2020, 314, 113670. [Google Scholar] [CrossRef]
  49. Zeebe, R.E. On the molecular diffusion coefficients of dissolved, and and their dependence on isotopic mass. Geochim. Cosmochim. Acta 2011, 75, 2483–2498. [Google Scholar] [CrossRef]
  50. Costigliola, L.; Heyes, D.M.; Schrøder, T.B.; Dyre, J.C. Revisiting the Stokes-Einstein relation without a hydrodynamic diameter. J. Chem. Phys. 2019, 150, 021101. [Google Scholar] [CrossRef]
  51. Qi, H.; Han, J.; Xu, N.; Bouwmeester, H.J.M. Hybrid organic-inorganic microporous membranes with high hydrothermal stability for the separation of carbon dioxide. ChemSusChem 2010, 3, 1375–1378. [Google Scholar] [CrossRef]
  52. Thermophysical Properties of Fluid Systems. Available online: http://webbook.nist.gov/chemistry/fluid/ (accessed on 14 July 2024).
Figure 1. (a) Molecular structure of C8H18 and CO2. (b) Schematics of molecular simulation of the multi-component crude oil model. The crude oil model density was set as 0.82 g/cm3.
Processes 12 02248 g001
Figure 2. Comparison of density values of octane in crude oil models under different conditions.
Processes 12 02248 g002
Figure 3. Density distribution of CO2 molecules dissolved in different crude oil systems at various pressures and temperatures: (a) the system at 313 K and 3 MPa; (b) the system at 313 K and 10 MPa; (c) the system at 318 K and 3 MPa; (d) the system at 318 K and 10 MPa; (e) the system at 323 K and 3 MPa; (f) the system at 323 K and 10 MPa. In the figure, blue represents the boundary of the model, gray indicates the crude oil molecules, and red depicts the dissolved CO2.
Processes 12 02248 g003aProcesses 12 02248 g003b
Figure 4. Curves of model swelling rates of crude oil systems with temperature and pressure before and after dissolving CO2: (a) crude oil systems; (b) CO2–crude oil systems.
Processes 12 02248 g004aProcesses 12 02248 g004b
Figure 5. Swellling rate curves of crude oil systems before and after dissolving CO2 molecules at three temperatures: (a) 313 K; (b) 318 K; (c) 323 K.
Processes 12 02248 g005aProcesses 12 02248 g005b
Figure 6. The dissolved CO2 molecules in crude oil systems at varying temperatures.
Processes 12 02248 g006
Figure 7. Diffusion coefficient curves of CO2 molecules at various pressures in 313 K, 318 K, and 323 K systems.
Processes 12 02248 g007
Figure 8. MSD curves of crude oil systems before and after dissolving CO2 molecules in 323 K system at different pressures: (a) crude oil systems; (b) CO2–crude oil systems.
Processes 12 02248 g008
Figure 9. Diffusion coefficient curves of crude oil systems before and after dissolving CO2 molecules in different systems.
Processes 12 02248 g009
Table 1. Compositional analysis of the crude oil.
ComponentMole %Plus Fraction AnalysisMole %
C114.446
C26.487C1–C437.793
C310.674C5+62.207
C46.186
C53.958
C63.223C1–C857.605
C74.893C9+42.395
C87.738
C95.632
C105.162C1–C1684.856
C113.577C17+15.144
C123.109
C132.969
C142.527
C152.368
C161.907
C17+15.144
Total100
Table 2. Crude oil model volumes and swelling rates in the 323 K systems.
Pressure MPaFinal Model Volume Å3Volumetric Strain Å3Model Swelling Rate %
320,672.0233356.74119.39
420,329.7643014.48217.41
520,325.3773010.09517.38
620,218.5412903.25916.77
720,202.7602887.47816.68
820,070.5362755.25415.91
920,043.7432728.46115.76
1019,804.0002488.71814.37
Table 3. CO2–crude oil model volumes and swelling rates in the 323 K systems.
Pressure MPaFinal Model Volume Å3Volumetric Strain Å3Model Swelling Rate %
321,047.0383731.75621.55
420,948.0193632.73720.98
520,789.5973474.31520.07
620,588.8673273.58518.91
720,478.8103163.52818.27
820,393.6283078.34617.78
920,301.9492986.66717.25
1020,082.5612767.27915.98
Disclaimer/Publisher’s Note: The statements, opinions and data contained in all publications are solely those of the individual author(s) and contributor(s) and not of MDPI and/or the editor(s). MDPI and/or the editor(s) disclaim responsibility for any injury to people or property resulting from any ideas, methods, instructions or products referred to in the content.

