Article

A Study on Acid Dissolution Characteristics and the Permeability Enhancement of Deep Coal Rock

1
College of Petroleum Engineering, Xi’an Shiyou University, Xi’an 710065, China
2
Engineering Research Center of Development and Management for Low to Ultra-Low Permeability Oil & Gas Reservoirs in West China of Ministry of Education, Xi’an Shiyou University, Xi’an 710065, China
3
Xi’an Key Laboratory of Tight Oil (Shale Oil) Development, Xi’an 710065, China
4
Oil Production Technology Research Institute, PetroChina Xinjiang Oilfield Company, Karamay 834000, China
5
Zhundong Production Plant, PetroChina Xinjiang Oilfield Company, Fukang 831500, China
6
China United Coalbed Methane Corporation Ltd., Beijing 100015, China
7
Department of Electrical Engineering and Computer Science, University of Stavanger, 4036 Stavanger, Norway
*
Author to whom correspondence should be addressed.
Processes 2024, 12(10), 2209; https://doi.org/10.3390/pr12102209
Submission received: 18 September 2024 / Revised: 28 September 2024 / Accepted: 8 October 2024 / Published: 10 October 2024
(This article belongs to the Section Chemical Processes and Systems)

Abstract

:
In order to reveal the acidification and dissolution characteristics of deep coal rock, core acidification and dissolution experiments are carried out based on low-field nuclear magnetic resonance technology to study the dissolution characteristics of different acid types when applied to coal rock, and to quantitatively evaluate the dissolution characteristics of acid solutions when applied to different-scale pore throats and the karst corrosion characteristics of primary fractures. This will help to further understand the dissolution rate and pore volume growth rate of coal powder under the action of different acid types. Improving the seepage effect of coal seams is of great significance. The results show that 15% acetic acid has the best effect with regard to karst erosion and permeability. The pore volume growth rate is 442.49%, and the permeability increases by up to 31 times. With large pores, the rapid dissolution stage of mud acid, hydrochloric acid, and mixed acid mainly occurred in the first 36 h, and the rapid dissolution stage of acetic acid and hydrofluoric acid applied to the core mainly occurred at 36–72 h. The dissolution rate of acid solution is strongly correlated with porosity and permeability, and the higher the acetic acid concentration, the larger the permeability increase.

1. Introduction

As a type of clean energy, coalbed methane occupies an important position in the energy structure in China. It is mainly distributed in the Ordos Basin and Qinshui Basin [1,2,3,4]. China possesses coalbed methane reserves of nearly 30.8 × 10¹² m3, mainly concentrated in shallow reservoirs above 2000 m. The exploration and development of deep coalbed methane below 2000 m is in its infancy, and only some blocks have yielded results. As compared to shallow coalbed methane, deep coalbed methane exhibits high temperatures, pressure, and stress; low porosity and low permeability; strong and stable production; and substantial development potential. Further exploration and development is therefore warranted [5,6,7].
The abundant quantities of quartz, dolomite, pyrite, and clay minerals present in coal rock fill the pores and cracks. This reduces the connectivity of the pores and cracks and impairs the permeability of coal rock, thereby hindering the output and migration of coalbed methane [8]. At the same time, gas pressure, effective stress, and individual permeability of fractured briquette rock mass have important effects on macroscopic permeability. Some scholars have proposed a new coal permeability model, considering the effects of stress and gas adsorption/desorption to solve this problem [9,10]. The acidification process removes the soluble mineral components of the coal, thus increasing the porosity of coal. Most prior studies have shown that, after the removal of minerals in coal via acidification, the coal particle surface becomes macroscopically darker and exhibits a fuzzy texture. For low-rank and high-mineral-content coal, acidification increases the permeability by 25–130 times [11,12,13,14,15].
Hydrochloric acid has a remarkable effect on the dissolution of siderite, calcite, dolomite, and other carbonate minerals in coal rock. Acidification can increase the permeability of coal rock by over 20-fold within a short duration [16]. Acetic acid exhibits a notable dissolution effect on the granular minerals, kaolinite, and calcite present on the coal and rock surfaces. Acetic acid can effectively dissolve the calcite that fills the cracks in low-permeability coal and rock rich in calcite, thus improving the permeability of these materials. With the increase in acetic acid concentration, the dissolution effect of acetic acid on coal surface cracks is accordingly enhanced. The greatest dissolution effect has been reported in the case of acetic acid with a concentration of 75% for 72 h on coal samples [17,18]. Hydrofluoric acid can effectively dissolve silicate, whereas hydrochloric acid and acetic acid do not readily react with silicate, making the dissolution rate of hydrofluoric acid to clay minerals much higher than that of hydrochloric acid and acetic acid [19,20]. The mixed acid solution of various acids can dissolve a wider range of minerals and has a certain solubility for carbonate, silicate, and clay minerals. The proportions of the acids in mixed solutions can be suitably adjusted to achieve the efficient dissolution of different reservoirs [21,22,23].
Previous studies have confirmed that the use of acidizing, fracturing, and other reservoir reconstruction measures to exploit coalbed methane or shale gas has a significant impact on the microstructure of coal [24,25,26,27,28,29,30]. Mercury injection, carbon dioxide adsorption, liquid nitrogen adsorption, and other methods are used to characterize the microscopic pore throat structure of coal rock, and so it is difficult to carry out repeated tests on the same acidified sample and directly compare the relevant relationships before and after acidification treatment [31,32,33,34,35]. Research on the acidification and dissolution of coal rock has mostly focused on the dissolution rate and pore volume change of single acid solutions. Few studies have examined the dissolution law between organic acid, inorganic acid, and inorganic composite acid solutions. The dissolution characteristics of coal rock micro-morphology are mostly described in a single stage before or after dissolution, and comparative studies on the micro-morphological characteristics of coal rock before and after dissolution are scarce. The research results obtained thus cannot accurately reveal the dissolution characteristics of acid solution when applied to the microscopic surface of coal rock and elucidate the law of dissolution and the permeability increase of the internal pore throat structure. Therefore, in this study, we analyzed the 8+9# coal rock core samples from the eastern margin of the Ordos Basin by performing acid dissolution experiments. Through low-field nuclear magnetic resonance (NMR) analyses and indoor acid dissolution experiments, the dissolution characteristics of core samples after the acidification of different types of acid solutions were quantitatively evaluated within 72 h. Combined with scanning electron microscopy (SEM) experiments, the characteristics of the same micro-morphology before and after dissolution were compared to reveal the law of acidification and permeability increase of deep coal rock [36,37,38].

2. Experiment

2.1. Experimental Material

The coal rock samples used in this study are from the 8+9# coal seam in the eastern margin of Ordos Basin. (1) The obtained coal rock is processed in accordance with the national standard GB/T 23561.1-2009 [39], “Methods for the Determination of physical and mechanical properties of coal Rock Part 1: General Provisions for sampling”, and the 5 cm × φ2.5 cm plunger core sample is prepared using a wire-cutting instrument (Suzhou Zhonggu Industrial Co., Ltd., Suzhou, China) (Table 1). (2) The acid solution used to carry out the coal core acid leaching experiment is shown in Table 2. (3) We pulverize, grind, screen and dry coal rock to obtain 80–100-mesh powder coal rock samples for the coal dissolution rate test. (4) The plunger core sample is wire-cut and a coal flake sample with a size of 0.5 cm × φ2.5 cm is prepared for the SEM experiment.

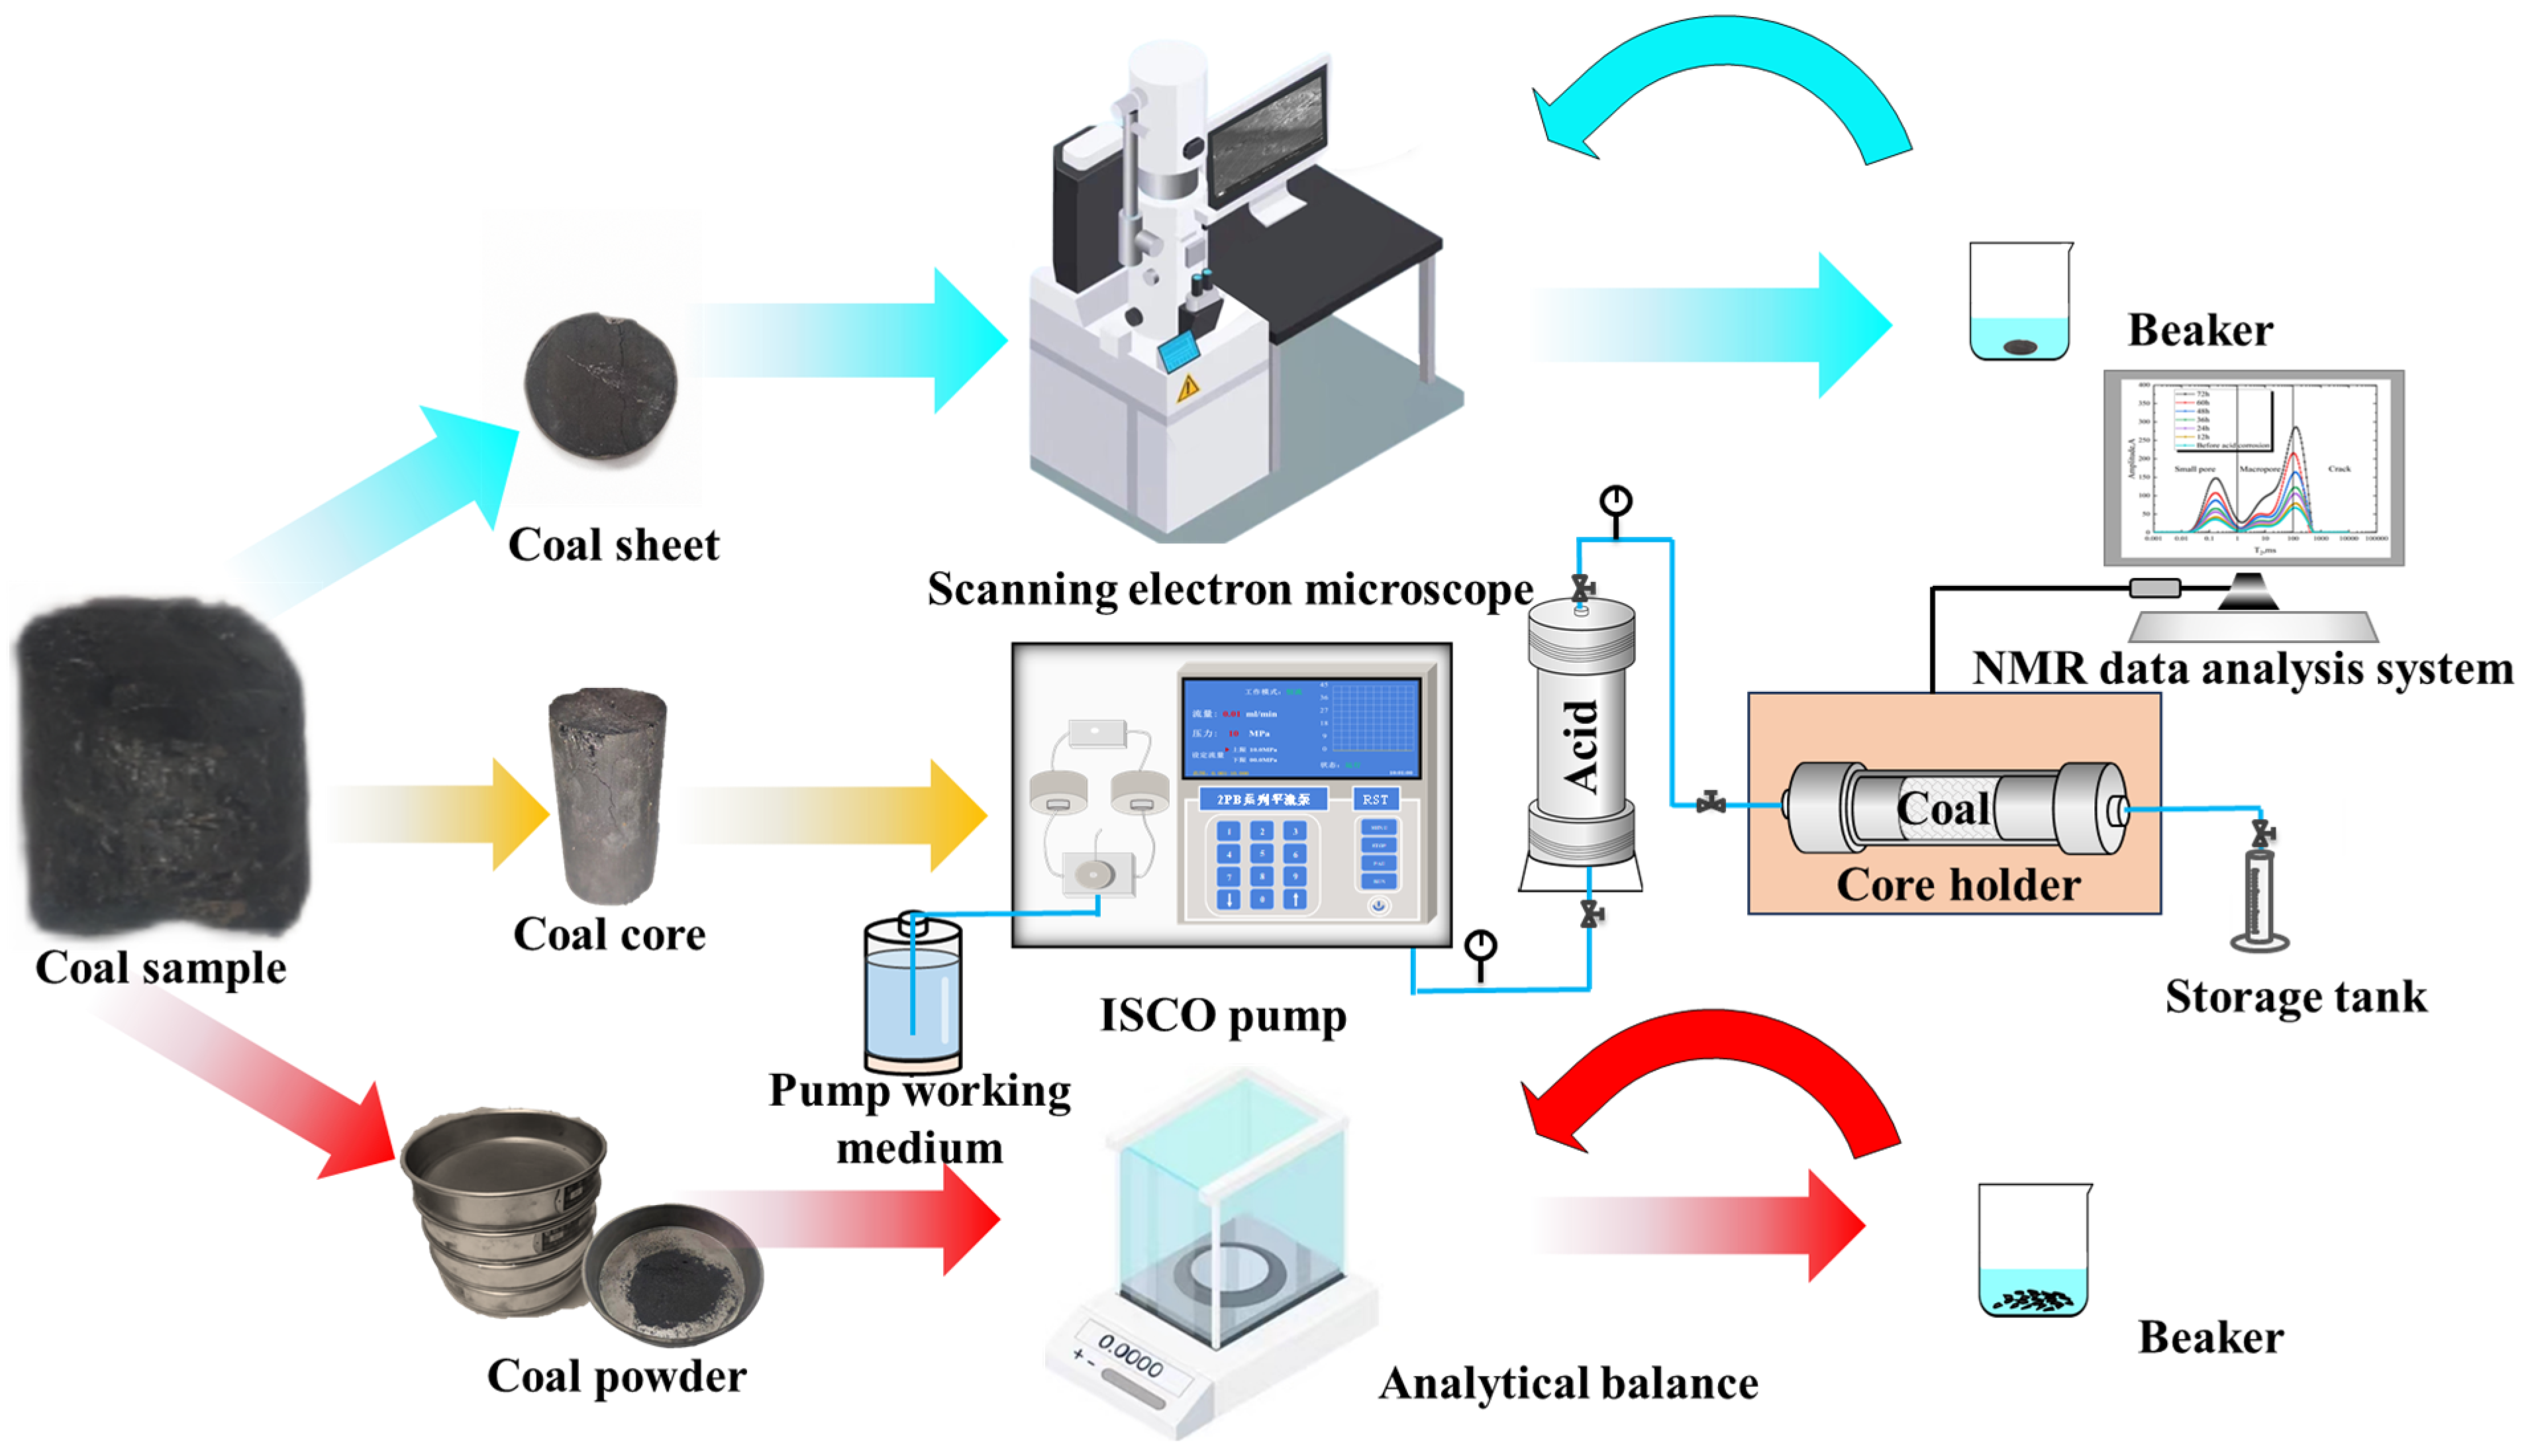
2.2. Experimental Steps and Methods

This study entailed low-field NMR analyses, a core acid pretreatment experiment, a coal powder dissolution experiment, and a field-emission SEM imaging experiment. These were performed on 8+9# coal seam samples from the eastern margin of Ordos Basin. The pore volume growth rate, dissolution rate, and permeability with different dissolution times, acid types, and pore scales were compared and analyzed. The dissolution characteristics of different acids when applied to coal rock were accurately characterized, and the law of dissolution and permeability increase of acid when applied to coal rock were revealed.
In the coal rock acid pretreatment experiment, we followed various steps. (1) The preparation of the acid solution: according to Table 3, 500 mL different formulations of acid solution were prepared. (2) Drying measurement: The coal rock sample was placed in a drying oven (Shanghai Lichen Bangxi Instrument Technology Co., Ltd., Shanghai, China) and dried at 105 °C for 8 h to reach a constant weight. The initial permeability of the dry core was measured by the gas permeability test method. (3) Saturated deionized water (Deionized water equipment is manufactured by NanJing Light of the ERST EST Co., Ltd., Nanjing, China): The core plunger sample was placed in a high-temperature and high-pressure physical flow simulation experimental device system (Nantong Huaxing Petroleum Instrument Co., Ltd., Nantong, China), and the deionized water was displaced to the depth of the core using an ISCO pump (Nantong Huaxing Petroleum Instrument Co., Ltd., Nantong, China). The displacement speed was 0.05 mL/min, and the displacement pressure was 10 MPa. The confining pressure was set to 12 MPa with an annular pressure tracking pump (Nantong Huaxing Petroleum Instrument Co., Ltd., Nantong, China). When the injection amount reached 5 PV, saturation was stopped to establish a deionized water distribution model of the experimental core. After saturation, nuclear magnetic resonance T2 spectrum scanning was performed (Shanghai Electronic Technology Co., Ltd., Shanghai, China). (4) The coal rock samples shown in Table 1 were placed in the core holder, and different acid fluids (A~E) were displaced to the depth of the core by ISCO pump. The displacement speed was 0.05 mL/min, and the displacement pressure was 12 MPa. The confining pressure was set to 14 MPa by the ring pressure tracking pump (Nantong Huaxing Petroleum Instrument Co., Ltd., Nantong, China), and the back pressure was set to 2 MPa to stabilize the acid displacement process. The displacement was 72 h, and the NMR T2 spectrum scan was performed at 0 h, 12 h, 24 h, 36 h, 48 h, 60 h, and 72 h, respectively. (5) Gas permeability after the experiment: When the displacement time reached 72 h, the coal rock sample was taken out and placed in a drying oven, the temperature was set to 105 °C for 8 h to reach a constant weight, and the permeability of the rock sample after dissolution was measured. The dissolution time was set to 72 h, and it was found that the experimental results within 72 h were basically consistent with the experimental results of the previous stage (60 h). The 72 h experimental process can not only ensure the maximum degree of acid solution and coal karst dissolution reaction, but also ensure the efficient and orderly conduct of the experiment [17,18].
We conducted a pulverized coal dissolution experiment. (1) Grinding and screening: Coal rock samples (50 g) were ground in a grinding machine (Beijing Grinder Instrument Co., Ltd., Beijing, China). Then, the pulverized coal was screened in a vibrating screen, and the 80–100-mesh pulverized coal samples were selected. (2) Drying: pulverized coal samples were placed in an oven and dried at 105 °C for 8 h until a constant weight was reached. (3) Weighing minerals: minerals were weighed (5 g) in an inert plastic bottle with an analytical balance (Beijing Grinder Instrument Co., Ltd., Beijing, China) and numbered. (4) The reaction of the acid solution and minerals: Each acid solution (30 mL) mentioned in Table 3 was added to a separate plastic beaker. The acid solution and minerals were stirred evenly at 25 °C for 72 h. (5) Filtration and weighing: The acid solution after the reaction was filtered using a dry qualitative filter paper (Fu Shun Shi Min Zheng Lv Zhi Chang, Fushun, China). After filtering, the filter paper and minerals were placed in the oven to dry at a temperature of 105 °C for 8 h to reach a constant weight, followed by cooling and weighing. The dissolution rate η was then calculated as follows:
η = m 1 + m 0 m 2 + m 0 m 1 × 100 % ,
where:
m 0 is the quality of filter paper (g);
m 1 is the total mass of pulverized coal before dissolution (g); and
m 2 is the total mass of pulverized coal after dissolution (g).
SEM was used to observe the surface morphology of coal at the nanometric level and demonstrate the effect of acid solution treatment in terms of the dissolution of coal samples. The microstructure of coal was analyzed using the APREO scanning electron microscope (CIQTEK Co., Ltd., Hefei, China) (Figure 1). A circular slice with a diameter of 2.5 cm was cut from the core plunger. Two observation sites of cracks and flat matrix were selected on the slice, and each site was circled by the laser. The specimens were placed under a scanning electron microscope and amplified 200–20,000 times for the experiments. The specimen was soaked and corroded for 72 h and dried. The specimen was placed under the scanning electron microscope to scan the marker points again. Nanometer indentation was used for fixed-point positioning to ensure that the same position could be observed using scanning electron microscopy before and after acid immersion.

2.3. Calculation Method of Pore Volume Growth Rate

As shown in Figure 2, by comparing the difference in coverage area under the NMR T2 spectrum, the degree of change in the volume of microscopic pore throat before and after the experiment can be quantitatively characterized. The coverage area value under the NMR T2 spectrum can reflect the effective pore throat volume in the core sample. If the acid solution increases the volume of the seepage channel, the signal amplitude of the T2 spectrum of the core will increase, indicating that the effective pore throat volume of the core sample will increase.
Supposing that, in the process of the acid solution experiment, the effective pore throat volume before the application of a solution of 0.10–10.00 ms is represented by (Si), and the effective pore throat volume after solution’s application is represented by (So + Si), then the pore volume growth rate b is calculated as follows:
b = S o S i × 100 % ,
where b is the volume growth rate in %; So represents the difference between the T2 spectral signal amplitude area of the pore volume after the experiment and the pore volume before the experiment; and Si represents the T2 spectral signal amplitude area of the pore volume before the experiment.

3. Results and Discussion

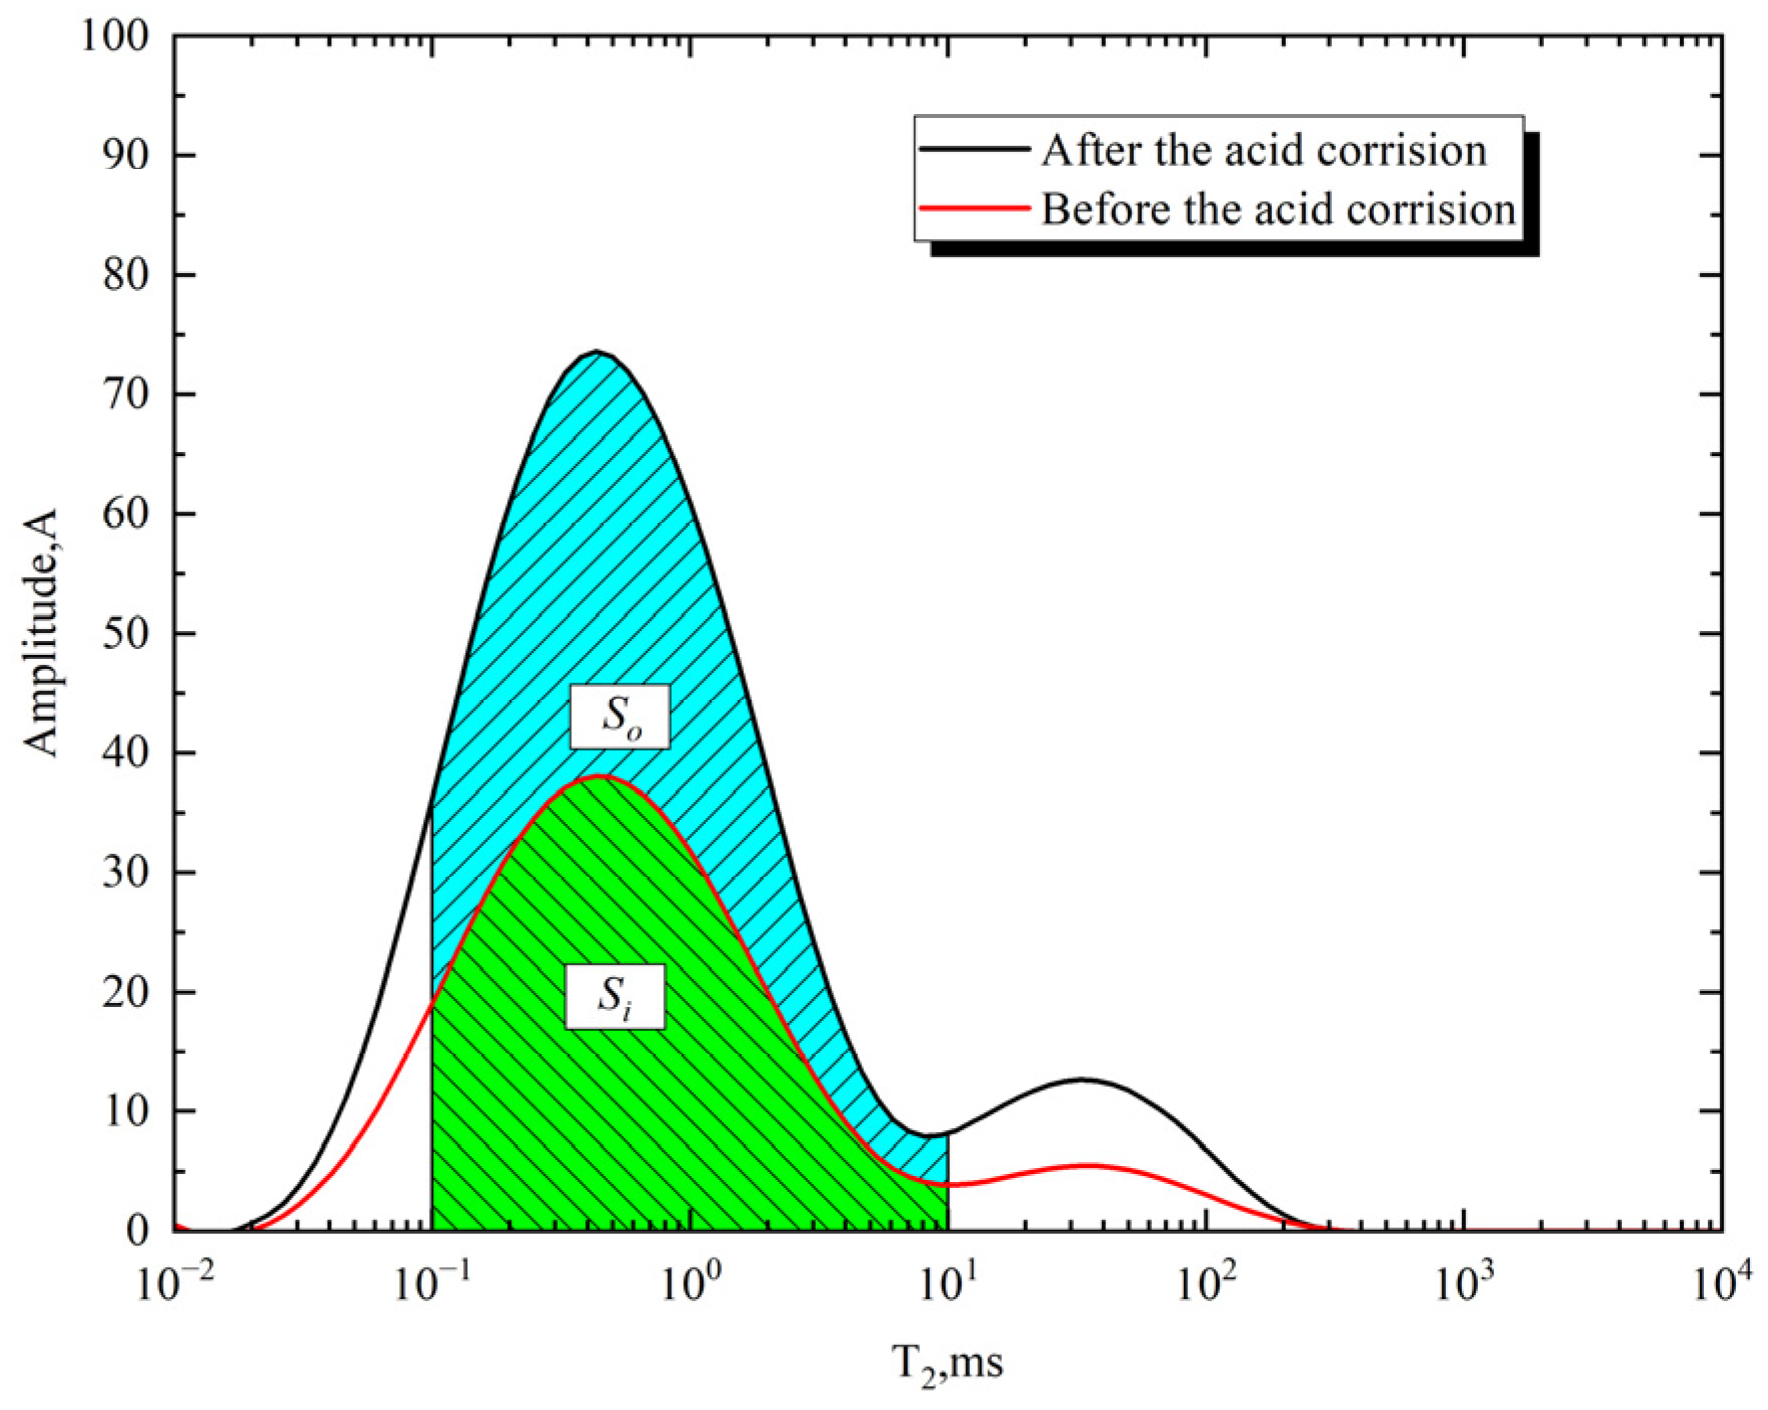
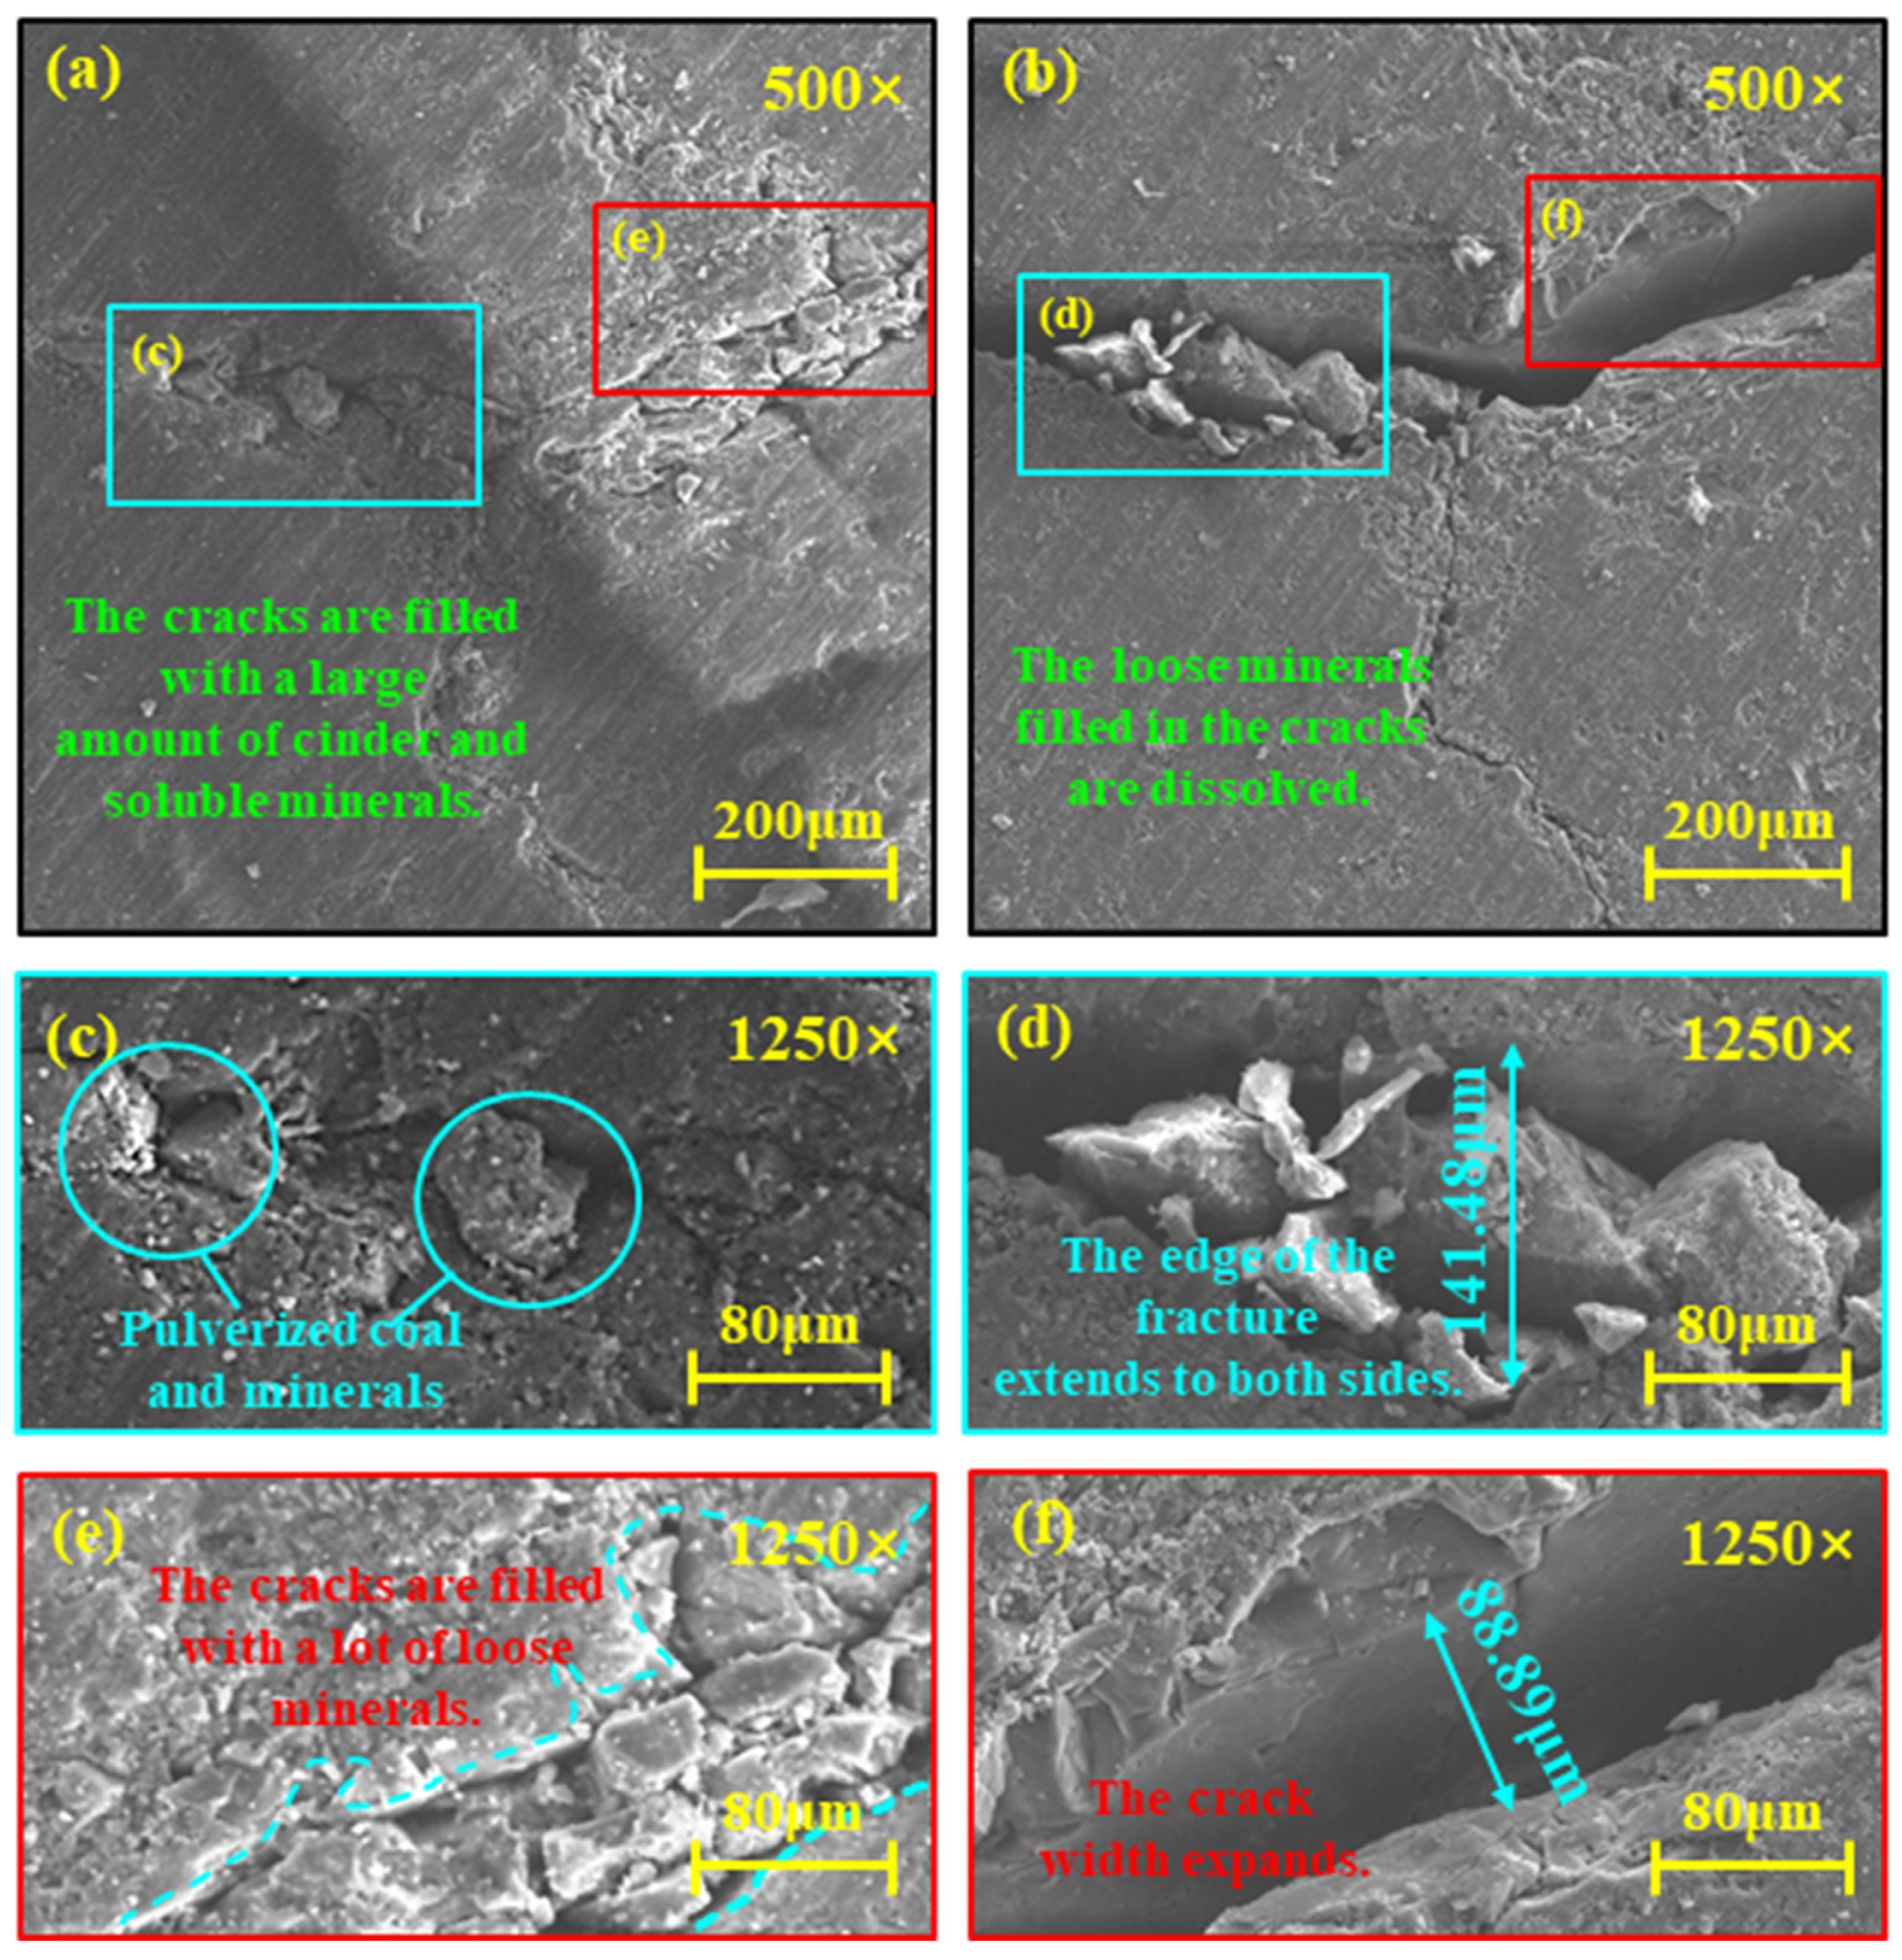
3.1. Pore Dissolution Characteristics

The variation characteristics of pore volume in the core were monitored using low-field NMR technology. The growth rate of pore volume was calculated in accordance with the dissolution in different time periods, and the dissolution characteristics of the acid solution when applied to different pore throats were quantitatively evaluated.
Figure 3a shows the dissolution pore volume T2 spectrum of coal rock core and 15% acetic acid after 12, 24, 36, 48, 60, and 72 h. The T2 spectrum curve of the pore volume distribution floated slowly in the first 36 h of acid saturation, indicating that the dissolution rate was slow in the first 36 h of dissolution. The pore volume growth rate was 82.56%. As the acid solution continued to dissolve, the T2 spectrum curve of pore volume distribution in each stage continued to increase along with the amplitude, indicating that the dissolution rate in this stage increased until the end of dissolution. The pore volume growth rate was 442.49%. Additionally, in the first 36 h of the slow dissolution rate, the pore volume growth rate in the smaller pore throat (0.01–1 ms) was 84.32%, the pore volume growth rate in the larger pore throat (1–100 ms) was 78.23%, and the pore volume growth rate in the fracture (100–1000 ms) was 82.56%. Notably, the three rates were similar. Under the subsequent 36 h of dissolution, the growth rate of pore volume in smaller pore throats, larger pore throats, and fractures continued to increase. The growth rate of pore volume in smaller pore throats was 134.50%, that in larger pore throats was 155.45%, and that in fractures was 132.31%. This was because the acetic acid first dissolved the relatively loose mineral debris on the surface of the rock sample, and because the initial dissolution and expanding effect was relatively weak, which made the dissolution rate slow in the first 36 h of the dissolution and produced a pore volume growth rate of only 82.56%. In the subsequent 36 h of dissolution, acetic acid further dissolved a large amount of loose mineral debris located in the fracture. At the same time, the minerals on the surface of the fracture were dissolved and exfoliated, making the acetic acid more able to dip into the depth of the fracture, and the dissolution dissolved most minerals in the depth of the fracture. The pore volume growth rate of the fracture increased to 132.31%, and the nearly closed fracture was obviously open. The fracture edge extended laterally to both sides, and the permeability improvement effect of corrosion was significantly increased, which had a large promotion effect on the growth rate of pore volume and the auxiliary improvement in permeability effect.
As shown in Figure 3b, the dissolution rate of 15% hydrofluoric acid is low in the first 36 h of dissolution, the pore volume growth is slow, and the pore volume growth rate is 53.31%. In the 36–72 h dissolution stage, the dissolution rate increases significantly, and the pore volume growth rate increases by 75.24% compared with the first 36 h. At the end of the 72 h imbibition experiment, the pore volume growth rate is 350.39%. The calculation results of the volume growth rate of different-scale pore throats show that in the 36–72 h of rapid dissolution, the pore volume growth rate of smaller pore throats is 27.17%, that of larger pore throats is 62.76%, and that of fractures is 966.88%. The rate for fractures is much higher than that of macropores and small pores. In the entire dissolution stage, the pore volume growth rates of the smaller pore throat, larger pore throat, and fracture pore volume are 168.10%, 273.55%, and 1793.08%, respectively. Comprehensive analysis shows that the 36–72 h of hydrofluoric acid dissolution of coal rock is a high-speed dissolution stage, which mainly acts on cracks and macropores. This is because hydrofluoric acid can react with the loose silicate minerals on the surface of the rock sample, and because the effect of dissolution is relatively strong. At the same time, hydrofluoric acid can react with the hydroxyl (-OH) functional group in an organic matter to produce organic fluoride. The pore volume growth rate is 53.31% in the first 36 h of dissolution. In the subsequent 36 h of dissolution, hydrofluoric acid further dissolved a large amount of loose mineral debris located in the fracture and dissolved most of the silicate minerals deep in the fracture, the fracture pore volume growth rate increased to 75.24%, and the corrosion had a relatively strong effect on expanding the diameter, which had a great role in promoting the coal rock in such a way as to increase the volume of seepage channels.
From the point of view of acidity, acetic acid and hydrofluoric acid belong to weak acids, while hydrochloric acid is a strong acid. They can react and dissolve with the relatively loose carbonate minerals on the surface of rock samples. The effect of dissolution and diameter expansion is relatively strong, and the seepage channel increases greatly. Compared with hydrofluoric acid, the volume growth rate of the hydrofluoric acid solution increased by 22.38%. It can be seen from Figure 3c that the dissolution characteristics of 15% hydrofluoric acid are significantly different from those of hydrofluoric acid and acetic acid. The pore volume growth rate at 36 h before leaching was 189.56%, which was significantly higher than that of hydrofluoric acid and acetic acid at 36 h. The pore volume growth rate was 28.74% after 36 h, which was lower than that of hydrofluoric acid and acetic acid from 36 h to 72 h. The growth rate of the pore volume of the pore throat was 179.67%, that of the pore volume of the larger pore throat was 765.57%, and that of the fracture pore volume was 296.6%. It can be seen that the first 36 h of hydrochloric acid dissolution of coal rock is a high-speed dissolution stage in which the main effect is expressed in the larger pore throat.
Figure 3d shows the T2 spectrum of the dissolution space after the dissolution of coal rock core and mud acid solution. The pore volume growth rate of the sample in the first 36 h was calculated to be 154.26%. At the end of the 72 h imbibition experiment, the pore volume growth rate of the coal rock was 310.07%. From the overall characteristics of the volume distribution curve of mud acid dissolution, the growth rate of pore volume in the first 36 h was significantly greater than that in other stages, and the growth rate of the overall pore volume was slower after 36 h. Similarly, the pore volume growth rate inside the pore throats of different scales shows the same law, i.e., the pore volume growth rate of smaller pore throats, larger pore throats, and cracks is faster in the first 36 h, but with the increase in imbibition time, the pore volume growth rate decreases as a whole. Comparative analysis shows that the dissolution characteristics of mud acid on coal rock are basically the same as those of hydrochloric acid, mainly acting on larger pore throats and cracks. This is because the mud acid first dissolves the loose mineral debris on the surface of the rock sample and the mineral debris located in the crack, but a part of the mineral debris blocks the matrix pore pipe. However, the overall dissolution effect is good, and the pore volume growth rate reaches 154.26% in the first 36 h of the dissolution. In the subsequent 36 h of corrosion, the mud acid further enters into the depth of the fracture, and most of the minerals in the depth of the fracture are dissolved. The growth rate of the fracture pore volume increases to 310.07%, and the expansion effect of corrosion is significantly increased. It should be noted that at 36 h before acetic acid (15%) dissolution, the pore volume growth rate was 82.56%. The pore volume growth rate was 189.56% at 36 h before hydrochloric acid (15%) dissolution. The pore volume growth rate was 154.26% 36 h before the dissolution using mud acid (12%HCl + 3%HF). This is because the mud acid contains 12% hydrochloric acid, and so its dissolution rate is relatively low compared with 15% hydrochloric acid, and the difference in early acidification effect is relatively small [11,40]. Some 36 h before acetic acid (15%) dissolution, the pore volume growth rate was 82.56%; the pore volume growth rate was 189.56% at 36 h before hydrochloric acid (15%) dissolution. The pore volume growth rate was 154.26% at 36 h before the dissolution of mud acid (12%HCl + 3%HF). This is because the mud acid contains 12% hydrochloric acid, and so its dissolution rate is relatively small compared with 15% hydrochloric acid, and the difference in early acidification effect is relatively small.
As shown in Figure 3e, the pore volume growth rate at each stage 36 h before the mixed acid solution dissolution was 13.57–28.00%, the NMR T2 spectrum signal value increased significantly at 36 h, and the pore volume growth rate was 77.59%. As the experiment continued, the rise in the curve in each period was small, indicating that the dissolution rate is relatively slow. Until the end of the 72 h acid pretreatment experiment, the pore volume increase in the first 36 h was significantly greater than that in other stages, signifying a high-efficiency corrosion stage. The pore volume growth rate of fractures (100~1000 ms) was higher than that of large pores (1~100 ms) and small pores (0.01~1 ms), increasing from 63.93% to 415.21%, and the pore volume growth rate increased the most in the first 36 h. The pore volume growth rate in the first 36 h of the fracture was 305.68%, which was much higher than that of large pores and small pores. However, the pore volume growth rate in the fracture decreased rapidly to 28.03% during 36~72 h of the corrosion phase. Comprehensive analysis shows that the pore volume growth rate of fractures in the first 36 h is much higher than that of large pores and small pores. This is because the overall pore volume of fractures is large and the acid quickly enters the cracks. After dissolving the mineral debris located inside the cracks, it continues to migrate deep into the cracks, dissolving most minerals in the deep cracks. Fractures are still the main contributors to pore volume growth.
Figure 4 shows the comparison of the morphology of coal rock cracks before and after dissolution. It is found that the original coal sample cracks are “T”-shaped, and the cracks are filled with large amounts of loose mineral debris. After acid treatment, most of the minerals in the cracks are dissolved and disintegrate. The cracks change from filling cracks to local filling cracks. The edge of the cracks expands to both sides, and the maximum crack width is 141.48 μm [17,40].
Figure 5 shows the scanning electron microscope imaging comparison before and after the dissolution of the smooth matrix surface. Before the dissolution, there were 6 obvious primary micropores on the surface of the coal sample, and large numbers of loose minerals were gathered and distributed. At the same time, some minerals were located in the cracks, and the cracks were almost closed. After acid dissolution, six primary micropores on the surface of the matrix were blocked by the slag, the mineral aggregates were dissolved and disintegrated, the fracture width increased, some minerals located in the fracture were dissolved and disintegrated, and the fracture was obviously open [11,40].

3.2. Cumulative Pore Volume Growth Rate

By analyzing the dissolution nuclear magnetic data of 5 coal rock cores, the growth rates of the pore volumes of different pore throat scales were obtained for 12–72 h (Table 4). The data demonstrated the degree of dissolution of different acid types when applied to different scale of pore. The dissolution law of different acid fluids on coal rock cores was revealed via comparative analysis.
As shown in Figure 6a, the growth rate of smaller pores in terms of volume, after the dissolution of coal rock core by different types of acid solution, is 157.37–428.09%. The growth rate of smaller pores in terms of volume after the dissolution of coal rock by acetic acid after 12 h is greater than that of the other four acid solutions, and the growth rate of the smaller pores in terms of volume is 328.09%. Within 12–36 h, the growth rate curve of smaller pores of acetic acid showed a gentle upward trend, indicating that the dissolution rate of acetic acid to coal rock was relatively stable. Within 36–72 h, the growth rate curve of smaller pores of acetic acid increased continuously, indicating that the dissolution of smaller pores of coal rock by acetic acid was enhanced. The change in the hydrofluoric acid curve showed a gentle trend within 12–36 h, and a slight increase was observed within 36–72 h. However, the overall pore volume growth rate did not change significantly, remaining between 17.65% and 68.10%. The pore volume growth rate curves of mud acid, mixed acid, and hydrochloric acid showed a steady rise in 12–36 h, and the curve tended to be gentle during 36–72 h, indicating that the dissolution effect of mud acid, mixed acid, and hydrochloric acid when applied to the smaller pores of coal rock was mainly concentrated in 12–36 h.
Figure 6b shows that the larger pore volume growth rate of hydrochloric acid after the dissolution of coal rock is the largest, standing at 765.57%, followed by the rates of hydrofluoric acid and acetic acid. The change trend depicted in Figure 6a,b shows a certain similarity: the growth rate curve of larger pore volume of mud acid, mixed acid, and hydrochloric acid rises steadily within 12–36 h and tends to increase gradually within 36–72 h. The growth rate curve of the larger pore volume of acetic acid and hydrofluoric acid increased steadily at 12–36 h and dramatically within 36–72 h, showing an approximate “J”-type change trend. This shows that the dissolution of larger pores of coal rock by mud acid, mixed acid, and hydrochloric acid is mainly concentrated within 12–36 h, whereas the dissolution of larger pores of coal rock by acetic acid and hydrofluoric acid is mainly concentrated within 36–72 h.
Figure 6c depicts the cumulative growth rate curve of the fracture volume. It is obvious that the pore volume growth rate curve of hydrofluoric acid increases slowly before 36 h, and increases rapidly in the shape of “J” after 36 h, indicating that the dissolution ability of hydrofluoric acid when applied to coal and rock gradually enhanced after 36 h. The other four acids showed a slow upward trend as a whole, indicating that the dissolution of the fracture using the other four acids increased slowly with time, and the increase was not substantial. Comparative analyses reveal that the pore volume growth rate of hydrofluoric acid is much larger than that of other acid types, indicating that the dissolution degree of hydrofluoric acid when applied to coal rock fractures is stronger than that of other acid types. This is because hydrofluoric acid can react with the loose silicate minerals on the surface of the rock sample to dissolve them and, at the same time, it can react with the hydroxyl (-OH) functional group in the organic matter to generate organic fluoride. During the subsequent 36 h of dissolution, hydrofluoric acid further dissolved a large amount of loose mineral debris located in the fracture. This mineral debris gradually peeled off, making hydrofluoric acid more immersed and furthering its migration to the deep part of the fracture. Additionally, the acid continued to dissolve and disintegrate most of the silicate minerals in the deep part of the fracture. The dissolution expansion effect is relatively strong, and so the curve rises rapidly in the “J” shape after 36 h.

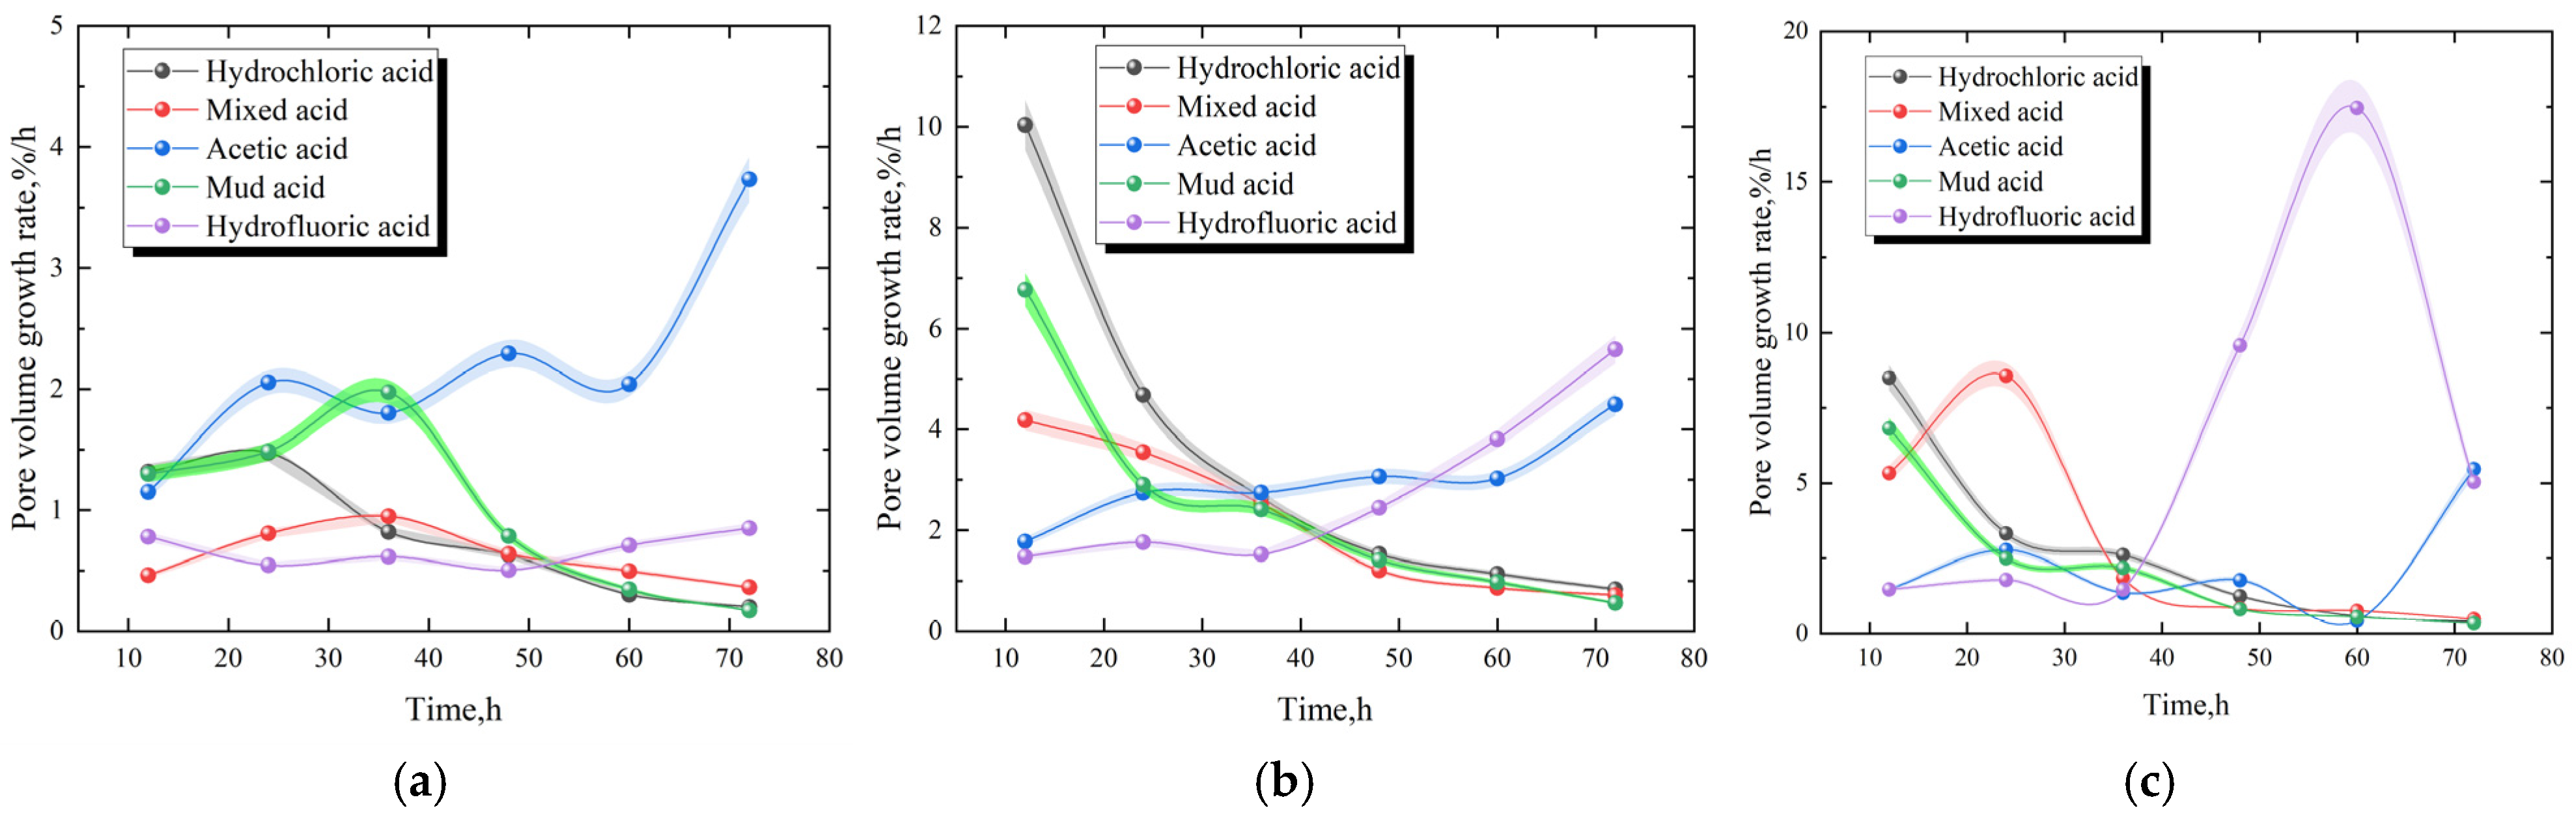
3.3. Change Rate of Pore Volume Growth

Figure 7a shows the variation curve of the pore volume growth rate. We found that the pore volume growth rate increases gradually after the dissolution of smaller pores by acetic acid. At the end of the experiment, the pore volume growth rate reached 3.7%, which was much larger than the pore volume growth rate of other acids. The result indicates that acetic acid has a strong dissolution effect on small pores of coal rock and has a significant impact. The dissolution effect of mud acid and mixed acid on coal rock reached the best effect at about 36 h. With the extension of time, the dissolution effect gradually weakened. Hydrochloric acid showed a consistent downward trend in terms of the dissolution characteristics of different pore sizes. During the experiment, the overall pore volume growth rate of hydrofluoric acid changed relatively little, and the overall performance was gentle, <1%/h.
Figure 7b shows the change curve of the macropore volume growth rate of each acid solution-dissolved core. First, the diagram (Figure 7b) shows that the change trend of the curve is mainly divided into two categories: those corresponding to acetic acid and those corresponding to hydrofluoric acid. The curve rises rapidly and is higher than those of the other three types of acid, indicating that the late stage of acid entering the coal rock core is the peak period of dissolution of the larger pore throat. Under the same conditions, acetic acid and hydrofluoric acid take a long time to efficiently dissolve the larger pores of coal rock. The other shows mixed acid, hydrochloric acid, and mud acid. The starting point of the curve is higher. Before 36 h, the pore volume growth rate decreases rapidly in the experiment. After 36 h, the curve gradually slows down and the rate is lower than that of acetic acid and hydrofluoric acid. This shows that mixed acid, hydrochloric acid, and mud acid dissolve the larger pores of the core faster in the first 36 h of contact with the core and can effectively promote the increase in the core pore volume.
In Figure 7c, the volume growth rate curve of each acid dissolution core fracture is shown. The dissolution rate of mud acid and hydrochloric acid reached the highest rate at 12 h, standing at 6.81%/h and 8.49%/h, respectively. The growth rate gradually decreased with time, indicating that the dissolution effect of mud acid and hydrochloric acid when applied to coal rock fractures gradually slowed down with time. The curve of fracture volume growth rate of acetic acid decreased slowly from 12 h to 60 h, but increased rapidly after 60 h. Finally, the fracture pore volume growth rate was 5.47%/h at 72 h, indicating that acetic acid showed the maximum volume growth rate for coal rock fractures at 72 h. Mixed acid and hydrofluoric acid showed similar trends, increasing first and then decreasing. The pore volume growth rate of mixed acid increased continuously before 24 h and reached the maximum pore volume growth rate at 24 h, whereas hydrofluoric acid had a maximum pore volume growth rate of 17.46%/h at 60 h and this dropped to 5.03%/h at 72 h. In the first 36 h, the growth rate of fracture pore volume is much higher than that of large pore and small pore volume. This is because the overall pore volume of the fracture is large, and the acid will quickly enter the fracture. After the mineral debris located in the fracture surface is dissolved in a short time, the mineral debris on the surface is quickly peeled off. This process dissolves most of the minerals inside the fracture, and so the fracture has a great dynamic effect in terms of improving the permeability of coal rock in the first 36 h.

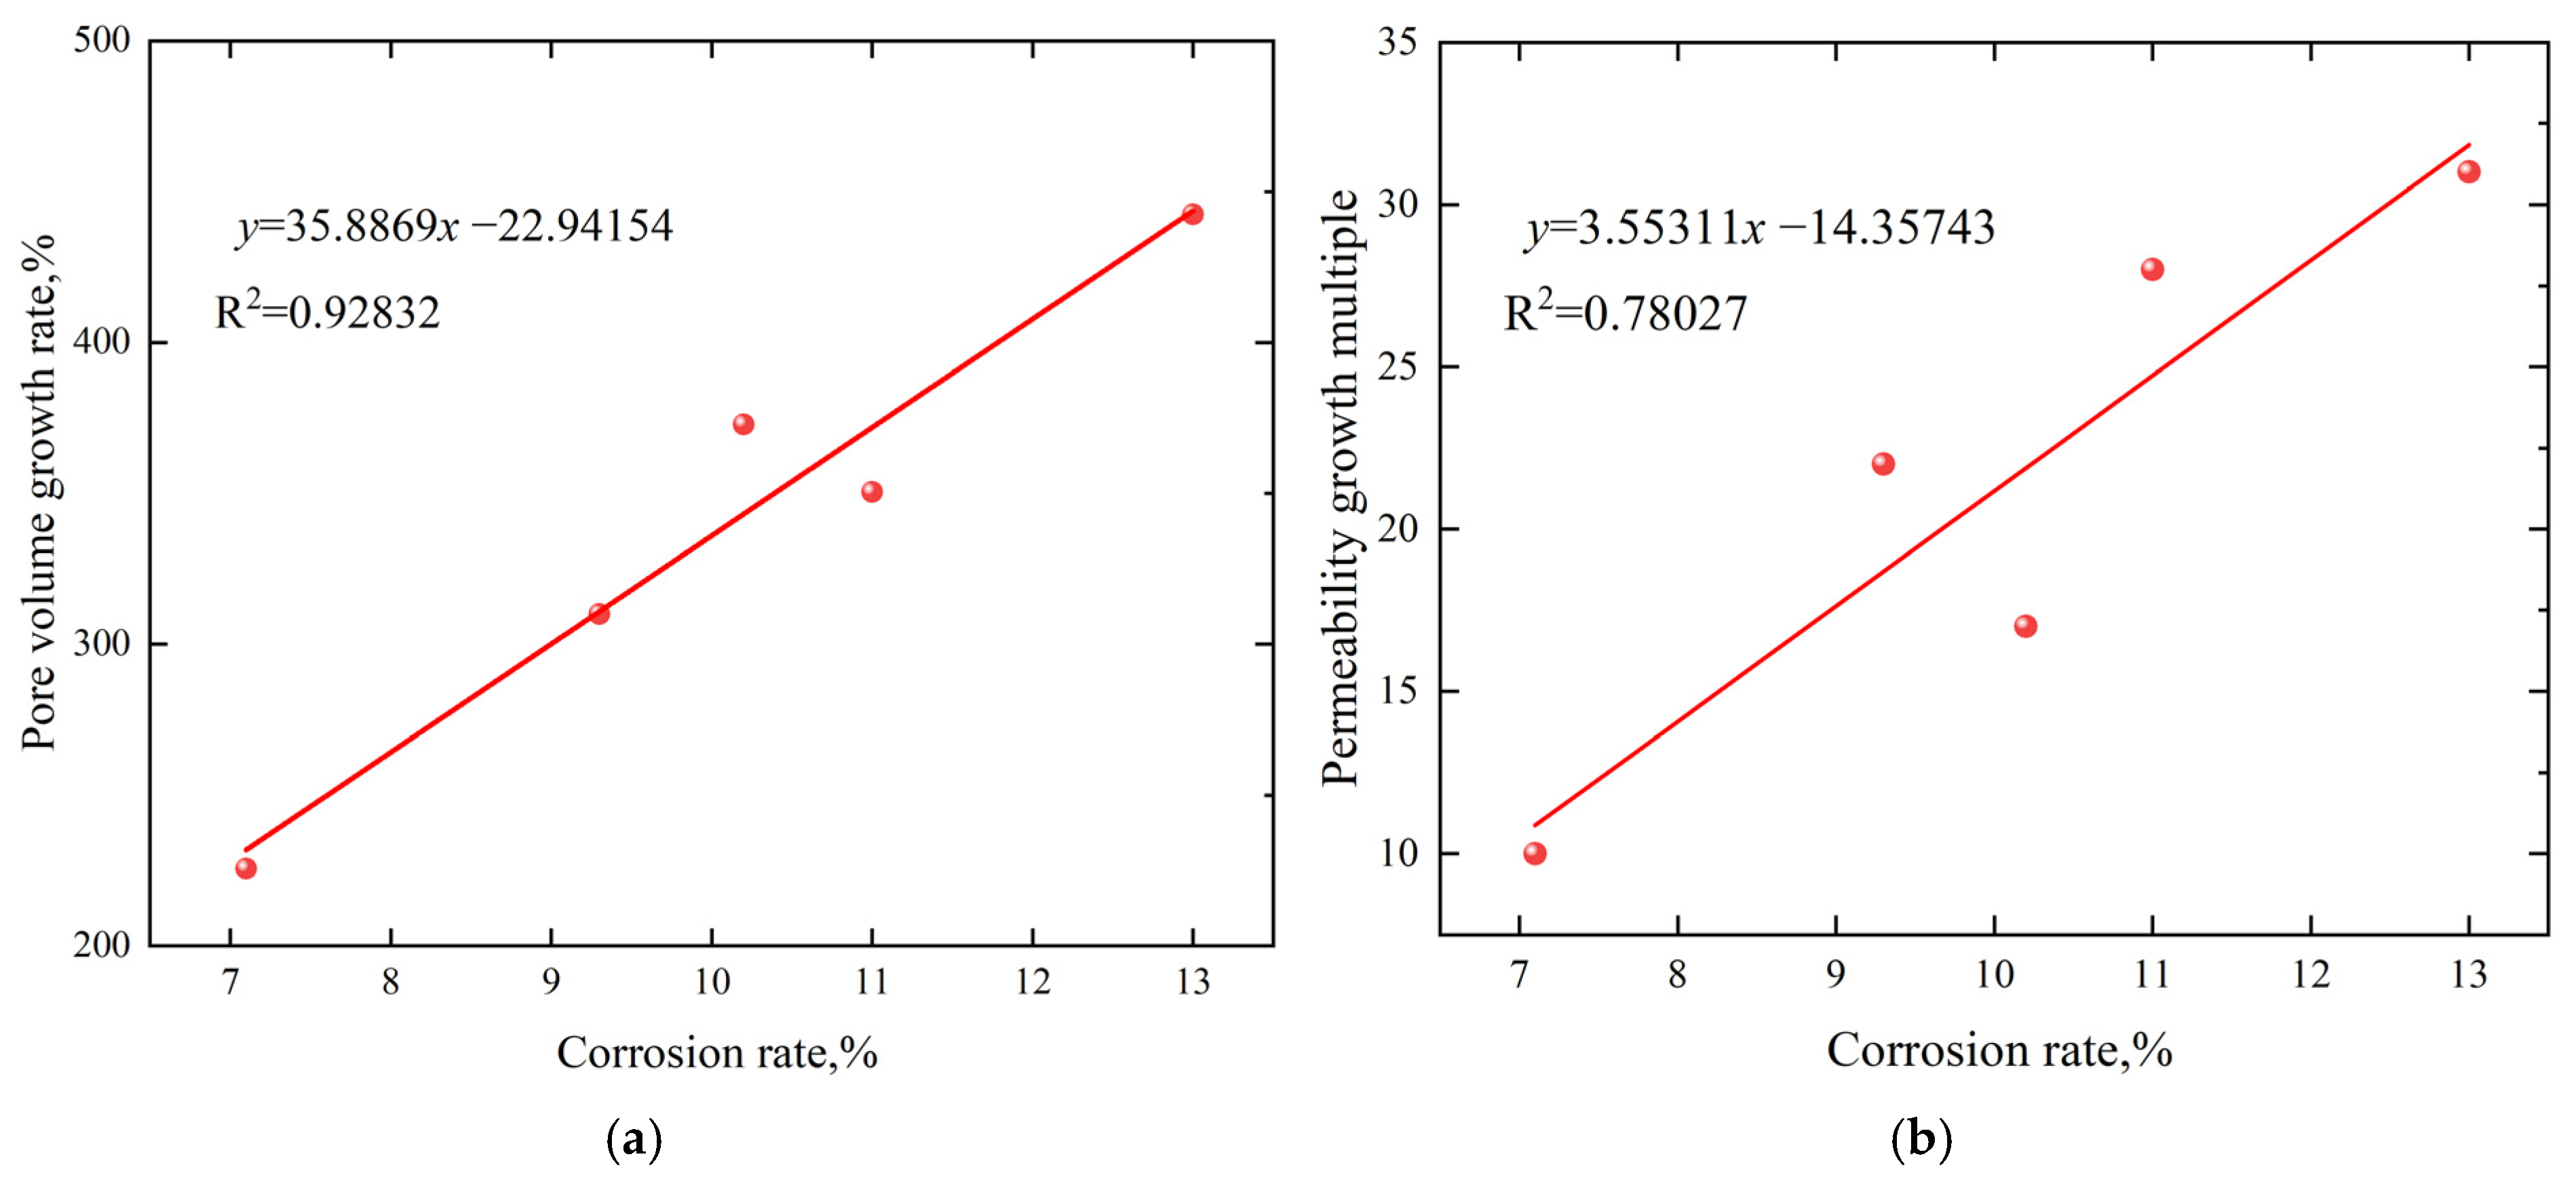
3.4. Analysis of Permeability Increasing Law

According to SY/T 6385-2016, entitled ‘Determination method of rock porosity and permeability under overburden pressure’, the permeability test process is as follows. (1) Instrument (Jiangsu Hongbo Machinery Manufacturing Co., Ltd., Nantong, China) preparation: connect the power supply, fully preheat the instrument and equipment, and calibrate the pressure system and setting system of the instrument before the experiment. (2) Rock sample installation: the rock sample is placed in the core holder, and an initial pressure of 2.00 MPa is applied to the rock sample, as is required to determine the permeability of the rock sample. (3) After the experiment is completed, the rock sample is taken out, the gas source and power supply are turned off according to the instrument’s requirements, and the necessary dust removal and maintenance are conducted. (4) The pore volume growth rate is equal to the permeability after dissolution minus the permeability before dissolution, divided by the permeability before dissolution. The calculation results are shown in Table 5. After the coal rock core was dissolved by acid solution for 72 h; it was then dried. After testing the permeability, it was found that the permeability increased significantly, with an increase of 10~31 times. The main reason was that the uneven dissolution pores produced by acid solution dissolution improved the original pore structure of the coal rock. It may also have been due to the drying effect, which produced chapped pores in coal rock. By the linear fitting of the curves of the dissolution rate, pore volume growth rate, and the permeability growth multiple, the correlation analysis found that the correlation coefficient between dissolution rate and pore volume growth rate was 0.92832 (Figure 8). The correlation between the dissolution rate and the permeability growth multiple was as high as 0.78027, and the two had a strong positive correlation with the dissolution rate, indicating that the dissolution effect of the acid solution when applied to coal rock could greatly improve the permeability of coal rock.

3.5. Main Controlling Factors of Coal Rock Dissolution

The gray correlation analysis method measures and describes the degree of correlation between each influencing factor by analyzing the similarities between the changing trends of each influencing factor. The steps mainly include determining the original sequence, calculating the correlation coefficient, and calculating and sorting the correlation degree [41]. Gray correlation analysis was performed on 10 groups of pulverized coal dissolution rate data in which the dissolution rate was selected as the evaluation basis of acid dissolution effect. From among the influencing factors of dissolution, the type of acid was studied. The dissolution rate was used as the reference sequence for the analysis, and the acid type was used as the comparison sequence to obtain the original sequence data (Table 6).
According to the results of the correlation degree between the three acids and the dissolution rate of coal rock, shown in Table 7, the correlation degree between acetic acid and the dissolution rate of coal rock was the largest, standing at 28.86, followed by that of hydrochloric acid; hydrofluoric acid had the weakest correlation. This shows that acetic acid has the greatest influence on the dissolution rate of coal rock, and hydrochloric acid and hydrofluoric acid have a weak influence on the dissolution rate of coal rock. We further clarify the influence of acetic acid on the dissolution rate of coal and rock, working according to the correlation analysis of acetic acid concentrations and the dissolution rates of the different solutions in Table 3, with results shown in Figure 9.
Figure 9 shows that the concentration of acetic acid is positively correlated with the dissolution rate, with a correlation coefficient of 0.98466, indicating that the higher the concentration of acetic acid, the greater the dissolution rate.

4. Conclusions

(1)
Among different acid solutions, 15% acetic acid has the best dissolution effect on coal rock, with a pore volume growth rate of 442.49% and a 32-time permeability increase. Considering 36 h as the node, 0–36 h can be defined as the high-speed dissolution stage of mud acid, hydrochloric acid, and mixed acid. Further, 36–72 h can be divided into the high-speed dissolution stages of acetic acid and hydrofluoric acid. In this paper, the maximum concentration of acetic acid is 15%, the concentration can be increased to 75% or higher later, and the dissolution characteristics of different acid types can also be observed.
(2)
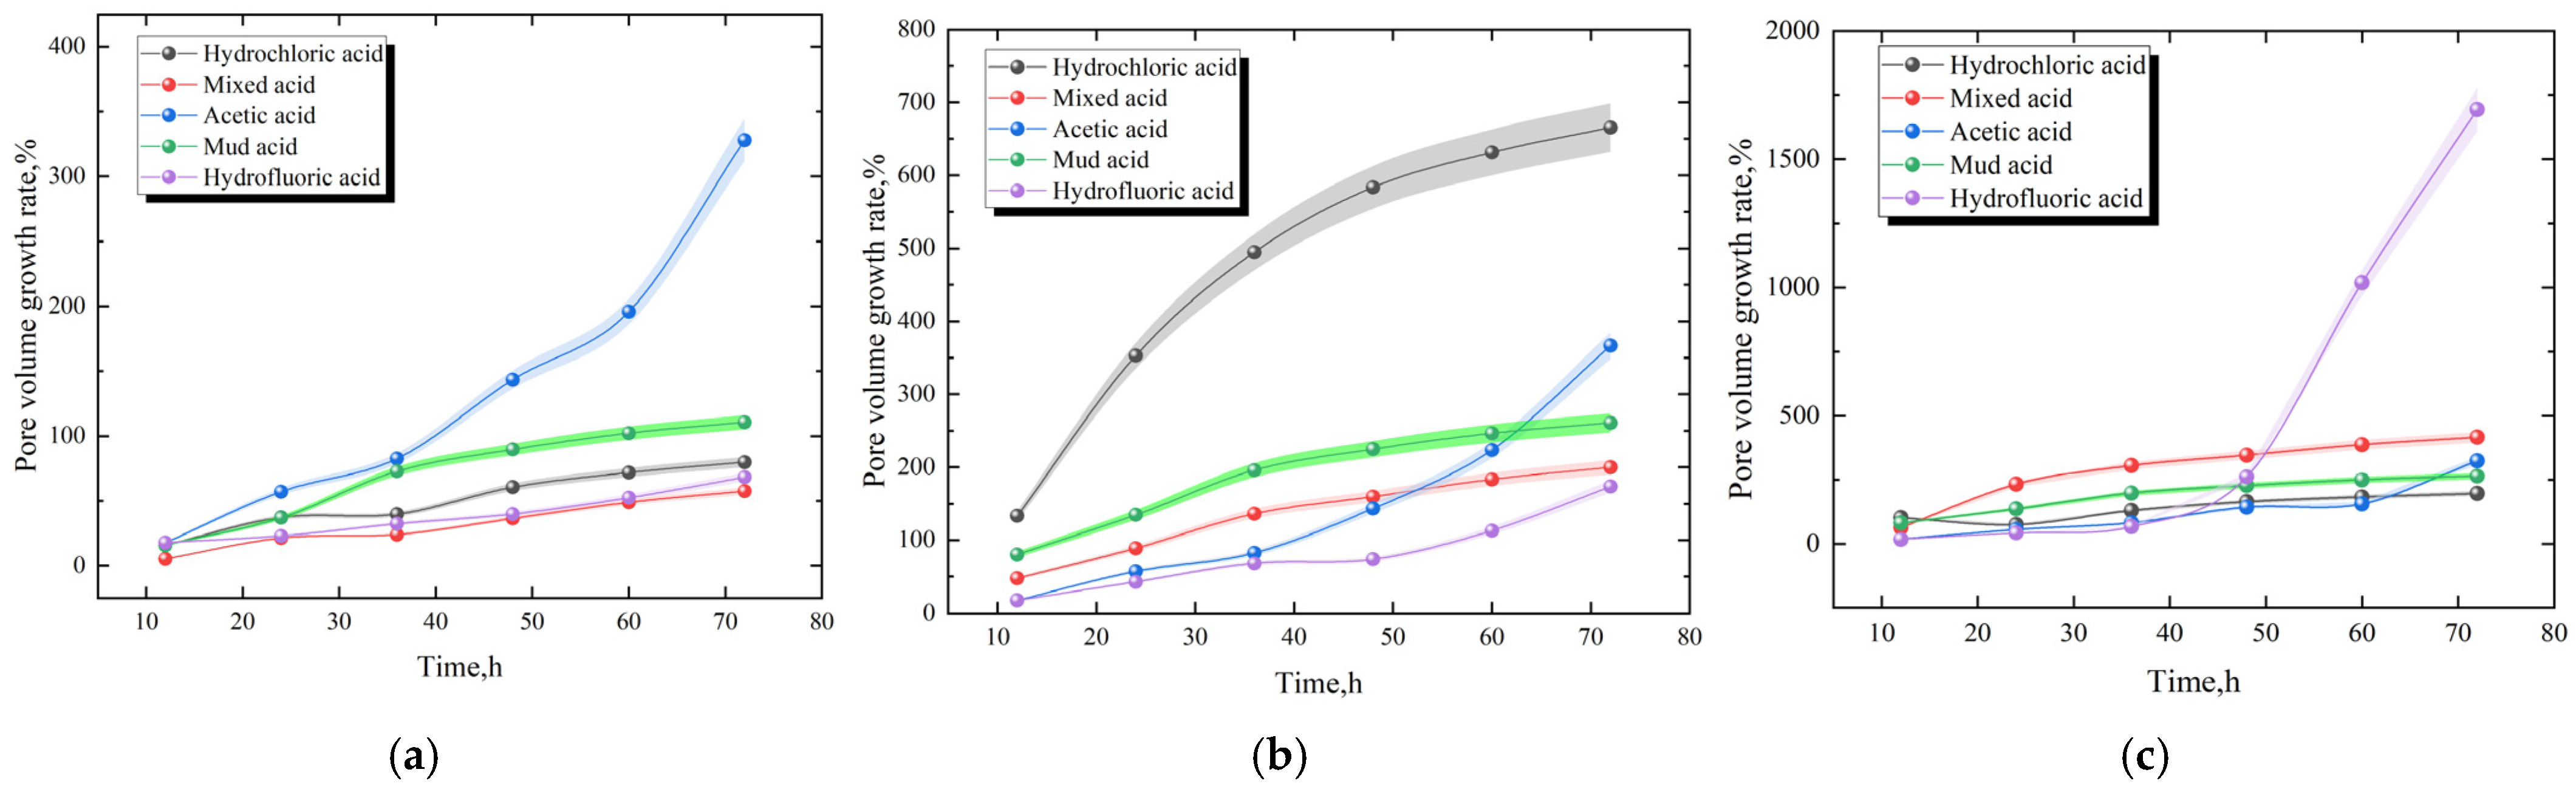
After the dissolution of core samples using mud acid, mixed acid, and hydrochloric acid, the volume growth rate of larger pores and fractures showed a trend of initial rapid increase, followed by a slower increase, and then a gradual decrease. The volume growth rates of macropores and fractures after the dissolution of core samples by hydrofluoric acid and acetic acid were slower before 36 h; however, the pore volume growth rate gradually increased after 36 h.
(3)
There is a strong positive correlation between porosity, permeability, and dissolution rate. The greater the degree of dissolution, the better the seepage performance. Acetic acid has the greatest impact on the degree of acid corrosion, followed by hydrochloric acid and hydrofluoric acid. The greater the concentration of acetic acid, the greater the degree of coal rock dissolution.

Author Contributions

Conceptualization, C.W.; methodology, C.W. and X.D.; formal analysis, J.W.; investigation, K.H.; data curation, J.W.; writing—original draft, W.L. and X.Z.; writing—review and editing, C.W. and N.Z.; supervision, X.D. All authors have read and agreed to the published version of the manuscript.

Funding

This research was sponsored by the National Natural Science Foundation of China (No. 52374041), Key Research and Development Program of Shaanxi Province (No. 2023-YBGY-306), Key Scientific Research Project of Education Department of Shaanxi Province (No. 22JY054). Meanwhile, this research was funded by the Graduate Innovation Fund Project of Xi’an Shiyou University (YCX2413051).

Data Availability Statement

The original contributions presented in the study are included in the article, further inquiries can be directed to the corresponding author.

Conflicts of Interest

Author Weijiang Luo was employed by the Oil Production Technology Research Institute, PetroChina Xinjiang Oilfield Company. Author Xiancai Dai was employed by the Zhundong Production Plant, PetroChina Xinjiang Oilfield Company. Author Jian Wu was employed by the China United Coalbed Methane Corporation Ltd. The remaining authors declare that the research was conducted in the absence of any commercial or financial relationships that could be construed as a potential conflict of interest.

References

  1. Xu, F.; Yan, X.; Lin, C.; Li, S.; Xiong, X.; Yan, D.; Wang, H.; Zhang, S.; Xu, B.; Ma, X.; et al. Research progress and development direction of key technologies for efficient coalbed methane development in China. Coal Geol. Explor. 2022, 50, 1–14. [Google Scholar]
  2. Yang, C.; Yang, Z.; Li, X.; He, Y.; Yi, L. Status and prospect of reservoir stimulation technologies for CBM surface well production in China. Nat. Gas Ind. 2022, 42, 154–162. [Google Scholar]
  3. Xu, F.; Hou, W.; Xiong, X.; Xu, B.; Wu, P.; Wang, H.; Feng, K.; Yun, J.; Li, S.; Zhang, L.; et al. The status and development strategy of coalbed methane industry in China. Pet. Explor. Dev. 2023, 50, 669–682. [Google Scholar] [CrossRef]
  4. Liu, S.; Tang, S.; Yin, S. Coalbed methane recovery from multilateral horizontal wells in Southern Qinshui Basin. Adv. Geo-Energy Res. 2018, 2, 34–42. [Google Scholar] [CrossRef]
  5. Liu, J.; Sun, H.; Lei, Y.; Cao, J. Current situation and development trend of coalbed methane development and utilization technology in coal mine area. J. China Coal Soc. 2020, 45, 258–267. [Google Scholar]
  6. Xu, C.; Lai, W.; Zhang, X.; Zhang, J. New progress and future exploration thinking of CNOOC oil and gas exploration. China Offshore Oil Gas 2023, 35, 1–12. [Google Scholar]
  7. Gao, L.; Pang, J.; Xie, Y.; Zhou, L. Analysis on potential geological mining model of deep coalbed methane in Linxing Block. Coal Sci. Technol. 2019, 47, 89–96. [Google Scholar]
  8. Wang, C.; Gao, J.; Yang, M.; Zhang, X.; Ren, J.; Li, X.; Yang, J.; Chen, S. Study on influencing factors and mechanism of acidizing antireflection effect of high-rank coal. J. Saf. Environ. 2023, 23, 3070–3080. [Google Scholar]
  9. Yang, H.; Xu, Z.; Fan, M.; Rajender, G.; Rachid, B.S.; Alan, E.B.; Ian, W. Progress in carbon dioxide separation and capture: A review. J. Environ. Sci. 2008, 20, 14–27. [Google Scholar] [CrossRef]
  10. Li, Y.; Zhang, C.; Sun, Y.; Song, Z.; Zhang, L. Experimental Study on the Influence Mechanism of Coal–Rock Fracture Differential Deformation on Composite Permeability. Nat. Resour. Res. 2022, 31, 2853–2868. [Google Scholar] [CrossRef]
  11. Bai, X.; Wang, Y.; He, G.; Zhou, Z.; Wang, D.; Zhang, D. Research on a permeability model of coal damaged under triaxial loading and unloading. Fuel 2023, 354, 129375. [Google Scholar] [CrossRef]
  12. Ren, X.; Yu, H. Interaction between sequestered supercritical CO2 and minerals in deep coal seams. Int. J. Coal Geol. 2019, 202, 1–13. [Google Scholar]
  13. Liu, Y.; Rajendar, G.; Terry, W. Ash formation from excluded minerals including consideration of mineral–mineral associations. Energy Fuels 2007, 21, 461–467. [Google Scholar] [CrossRef]
  14. Ward, C.R. Analysis and significance of mineral matter in coal seams. Int. J. Coal Geol. 2002, 50, 135–168. [Google Scholar] [CrossRef]
  15. Robeck, E.; Huo, D. A more accurate method for estimating in situ coal density and mineral matter from ash and specific energy determinations. Int. J. Coal Geol. 2016, 168, 237–252. [Google Scholar] [CrossRef]
  16. Zhao, W.; Li, R.; Wu, X.; Tang, J.; Wang, K.; Wang, Y. Preliminary indoor experiments on enhancing permeability rate of coal reservoir by using acidification technology. China Coalbed Methane 2012, 9, 10–13. [Google Scholar]
  17. Yang, H.; Yu, Y.; Cheng, W.; Jun, R.; Xu, Q. Influence of acetic acid dissolution time on evolution of coal phase and surface morphology. Fuel 2021, 286, 119464. [Google Scholar] [CrossRef]
  18. Yu, Y.; Gao, C.; Yang, H.; Cheng, W.; Xin, Q.; Zhang, X. Effect of acetic acid concentration and dissolution time on the evolution of coal phases: A case report of bituminous coal. J. Mol. Liq. 2021, 340, 117298. [Google Scholar] [CrossRef]
  19. Lu, H.; Wei, K.; Ma, W.; Xie, K.; Wu, J.; Lei, Y.; Dai, Y. Effect of acetic acid on the leaching behavior of impurities in metallurgical grade silicon. Sep. Sci. Technol. 2017, 52, 1257–1264. [Google Scholar] [CrossRef]
  20. Xu, Q.; Liu, R.; Seeram, R. Comparative experimental study on the effects of organic and inorganic acids on coal dissolution. J. Mol. Liq. 2021, 339, 116730. [Google Scholar] [CrossRef]
  21. Wei, Z.; Lin, B.; Tong, L.; Ting, L.; Wei, Y. Effect of acidification on microscopic properties and pore structure of coal. Fuel 2023, 343, 127834. [Google Scholar] [CrossRef]
  22. Wei, W.; Yu, H.; Guo, C.; Zhang, X.; Liu, G.; Cheng, S.; Zhao, B. Effect of Fouling Layer (Acid–Ash Reaction) on Low-Temperature Corrosion Covering Heating Surface in Coal-Fired Flue Gas. Processes 2022, 10, 241. [Google Scholar] [CrossRef]
  23. Li, S.; Fan, Y.; Guo, Y.; Wang, Y.; He, T.; Zhang, H.; Ye, J.; Chen, W.; Zhang, X. Simulation and Control Strategies for Longitudinal Propagation of Acid Fracture in a Low-Permeability Reservoir Containing Bottom Water. Processes 2024, 12, 792. [Google Scholar] [CrossRef]
  24. Li, Q.; Li, Q.; Wang, F.; Wu, J.; Wang, Y. The Carrying Behavior of Water-Based Fracturing Fluid in Shale Reservoir Fractures and Molecular Dynamics of Sand-Carrying Mechanism. Processes 2024, 12, 2051. [Google Scholar] [CrossRef]
  25. Li, Q.; Li, Q.; Han, Y. A Numerical Investigation on Kick Control with the Displacement Kill Method during a Well Test in a Deep-Water Gas Reservoir: A Case Study. Processes 2024, 12, 2090. [Google Scholar] [CrossRef]
  26. Yang, C.; Tang, Y.; Kang, H.; Gou, M.; Yu, X. Occurrence of minerals in coal and its geological controlling factors-significance in evaluation of coal washability. ACS Omega 2021, 6, 24362–24376. [Google Scholar] [CrossRef]
  27. Li, X.; Kang, J.; Wang, P.; Liu, Y.; Fu, Q. Geochemistry and mineralogy of Late Carboniferous coal (No. 8) from the Jialequan Mine, Xishan Coalfield, Shanxi Province, China: Evidences for the geologic controls of trace elements. Arab. J. Geosci. 2020, 13, 1171. [Google Scholar] [CrossRef]
  28. Magni, M.; Postiglione, E.; Marzorati, S.; Verotta, L.; Trasatti, S.P. Green Corrosion Inhibitors from Agri-Food Wastes: The Case of Punica granatum Extract and Its Constituent Ellagic Acid. A Validation Study. Processes 2020, 8, 272. [Google Scholar] [CrossRef]
  29. Hiei, Y.; Shirai, H. Basic Study on Mineral Removal from Coal-The Influence of Mineral Distribution and Size of Pulverized Coal on Characteristics of Mineral Removal. Coal Prep. 2006, 26, 137–148. [Google Scholar] [CrossRef]
  30. Dou, H.; Xie, J.; Xie, J.; Sun, G.; Li, Z.; Wang, Z.; Miao, Y. Study on the mechanism of the influence of HNO3 and HF acid treatment on the CO2 adsorption and desorption characteristics of coal. Fuel 2022, 309, 122187. [Google Scholar] [CrossRef]
  31. Li, R.; Wang, K.; Wang, Y. Indoor study on acidification for enhancing the permeability of coal. J. China Coal Soc. 2014, 39, 913–917. [Google Scholar]
  32. Fang, H.; Sang, S.; Liu, S. Three-dimensional spatial structure of the macro-pores and flow simulation in anthracite coal based on X-ray μ-CT scanning data. Pet. Sci. 2020, 17, 1221–1236. [Google Scholar] [CrossRef]
  33. Zhang, J.; He, J.; Zhang, R.; Zhang, L.; Xu, W. Optimization and Performance Evaluation of an Atomized Acid System for the Expansion of Carbonate Gas Injection. Processes 2023, 11, 3080. [Google Scholar] [CrossRef]
  34. Liu, C.; Zhang, L.; Li, Y.; Liu, F.; Martyushev, D.A.; Yang, Y. Effects of microfractures on permeability in carbonate rocks based on digital core technology. Adv. Geo-Energy Res. 2022, 6, 86–90. [Google Scholar] [CrossRef]
  35. Cao, Y.; Tang, M.; Zhang, Q.; Tang, J.; Lu, S. Dynamic capillary pressure analysis of tight sandstone based on digital rock model. Capillarity 2020, 3, 28–35. [Google Scholar] [CrossRef]
  36. Quanle, Z.; Baiquan, L.; Ting, L.; Yan, Z.; Zhen, Z.; Fazhi, Y. Variation of methane adsorption property of coal after the treatment of hydraulic slotting and methane pre-drainage: A case study. J. Nat. Gas Sci. Eng. 2014, 20, 396–406. [Google Scholar]
  37. Quanle, Z.; Tiancheng, Z.; Tengfei, M.; Shixiang, T.; Xueqi, J.; Zebiao, J. Effect of water-based SiO2 nanofluid on surface wettability of raw coal. Energy 2022, 254, 124228. [Google Scholar]
  38. Quanle, Z.; Baiquan, L.; Jinyan, L.; Ting, L.; Yan, Z.; Fazhi, Y.; Chuanjie, Z. Variation in the Pore Structure of Coal after Hydraulic Slotting and Gas Drainage. Adsorpt. Sci. Technol. Vol. 2014, 32, 623–705. [Google Scholar]
  39. GB/T 23561.1-2009; Methods for Determining the Physical and Mechanical Properties of Coal and Rock—Part 1: General Requirements for Sampling. Standardization Administration of the People’s Republic of China: Beijing, China, 2009.
  40. Wei, J.; Su, E.; Xu, G.; Yang, Y.; Han, S.; Chen, X.; Chen, H.; An, F. Comparative analysis of permeability rebound and recovery of tectonic and intact coal: Implications for coalbed methane recovery in tectonic coal reservoirs. Energy 2024, 301, 131702. [Google Scholar] [CrossRef]
  41. Nie, L.; Zhou, D.; Guo, X.; Hui, J.; Bian, J.; Gao, L. Analysis on influencing factors of post fracture response in low permeability gas reservoir with gray correlation method. Fault-Block Oil Gas Field 2013, 20, 133–136. [Google Scholar]
Figure 1. Experiment flow chart.
Processes 12 02209 g001
Figure 2. Pore volume growth rate calculation diagram.
Processes 12 02209 g002
Figure 3. T2 spectrum of acid corrosion characteristics. (a) CH3COOH (15%). (b) HF (15%). (c) HCl (15%). (d) Mud acid (12%HCl + 3%HF). (e) Mixed acid (7%HCl + 3%HF + 5%CH3COOH).
Processes 12 02209 g003
Figure 4. The comparison of scanning electron microscopy before and after the acid solution corrosion of cracks and macropores, with (a,c,e) showing results before acid corrosion and (b,d,f) showing results after acid corrosion.
Processes 12 02209 g004
Figure 5. Comparison of scanning electron microscopy before and after acid corrosion of small pores: (a) before the acid corrosion; (b) after the acid corrosion.
Processes 12 02209 g005
Figure 6. Pore volume growth rate of different-scale pore throats in each stage. (a) Smaller pores. (b) Larger pores. (c) Crack.
Processes 12 02209 g006
Figure 7. Different pore volume growth rates: (a) small pore; (b) large pore; (c) crack.
Processes 12 02209 g007
Figure 8. Correlation analysis of the pore volume growth rate, the permeability growth multiple, and the dissolution rate. (a) The correlation between the pore volume growth rate and dissolution rate. (b) The correlation between the permeability growth multiple and dissolution rate.
Processes 12 02209 g008
Figure 9. Correlation between acetic acid concentration and dissolution rate.
Processes 12 02209 g009
Table 1. Core samples.
Core NumberDepth (m)Length (cm)Diameter (cm)Porosity (%)Permeability (10−3 μm)
12087.805.022.505.161.38
22088.264.982.504.981.41
32088.454.972.515.171.39
42088.655.012.515.211.40
52088.725.032.505.091.37
Table 2. The acids used in the experiments.
AcidAcid Concentration (%)PurityManufacturer
HF40Analytically pureXilong Scientific Co., Ltd.,
Shantou, China
CH3COOH36Analytically pureDamao Chemical Reagent Factory,
Tianjin, China
HCl36Analytically pureTianjin Chemical Reagent Factory No.1,
Tianjin, China
Table 3. Acid ratio of the acid pretreatment experiment and dissolution rate experiment.
ABCDEFGHIJ
HF3%/15%/5%3%3%5%7%7%
CH3COOH///15%3%5%7%7%5%3%
HCl12%15%//7%7%5%3%3%5%
Table 4. Pore volume growth rate in different stages.
TimeHFMud AcidCH3COOHMixed AcidHCl
Total pore volume
growth rate
0–36 h53.31%154.26%82.56%77.59%189.56%
36–72 h128.55%20.95%142.39%27.08%28.74%
Total350.39%310.07%442.49%225.54%372.77%
Macropore volume
growth rate
0–36 h68.07%195.81%82.56%136.06%494.69%
36–72 h62.76%21.95%155.45%28.03%28.68%
Total273.55%360.74%466.33%299.80%765.57%
Small pore volume
growth rate
0–36 h32.19%72.63%84.32%23.92%39.57%
36–72 h27.17%21.95%134.50%27.00%28.74%
Total168.10%210.53%428.09%157.37%179.67%
Fracture volume
growth rate
0–36 h68.07%198.18%82.56%305.67%130.40%
36–72 h966.88%21.95%132.31%26.99%28.74%
Total1793.08%363.64%424.09%515.21%296.60%
Table 5. Different acid dissolution rates.
HFMud AcidCH3COOHMixed AcidHCl
Pre-dissolution mass (g)55555
Mass after dissolution (g)4.454.544.354.654.49
Dissolution rate (%)119.3137.110.2
Initial permeability (10−3 μm)0.650.590.630.580.61
Permeability after dissolution (10−3 μm)18.8513.5720.166.3810.98
Permeability growth multiple28.00 22.00 31.00 10.00 17.00
Table 6. Original sequence of gray correlation analysis of pulverized coal dissolution.
HFCH3COOHHClCorrosion Rate
A3%/12%9.3%
B//15%10.2%
C15%//11%
D/15%/13%
E5%3%7%7.1%
F3%5%7%8.1%
G3%7%5%9.3%
H5%7%3%5.5%
I7%5%3%5.3%
J7%3%5%4.2%
Table 7. A comparison of the correlation coefficient and the correlation degree of sequence sample data.
HFCH3COOHHCl
Correlation coefficientA3.544.9017.73
B2.935.444.69
C5.423.8027.09
D12.93244.487.90
E72.3114.808.56
F13.8411.3823.39
G4.861.261.26
H0.720.720.72
I0.721.260.72
J0.540.510.72
Correlation degree11.7828.8614.76
Disclaimer/Publisher’s Note: The statements, opinions and data contained in all publications are solely those of the individual author(s) and contributor(s) and not of MDPI and/or the editor(s). MDPI and/or the editor(s) disclaim responsibility for any injury to people or property resulting from any ideas, methods, instructions or products referred to in the content.

