Abstract
In recent years, the optimization of diesel engine exhaust mufflers has predominantly targeted acoustic performance, while the impact on engine power performance has often been overlooked. Therefore, this paper proposes a parallel perforated tube expansion muffler and conducts a numerical analysis of its acoustic and aerodynamic performance using the finite element method. Then, a Kriging model is established based on the Design of Experiments to reveal the impact of different parameter couplings on muffler performance. With transmission loss (TL) and pressure loss (PL) as the optimization objectives, a multi-objective optimization study is carried out using the competitive multi-objective particle swarm optimization (CMOPSO). The optimization results indicate that this method can simplify the optimization model and improve optimization efficiency. After CMOPSO calculation, the average TL of the muffler increased from 27.3 dB to 31.6 dB, and the PL decreased from 1087 Pa to 953 Pa, which reduced the exhaust noise and improved the fuel economy of the engine, thus enhancing the overall performance of the muffler. This work provides a reference and guidance for the optimal design of mufflers for small agricultural diesel engines.
1. Introduction
In the context of green development in countries around the world, agricultural machinery has become an important pillar of modern agricultural development [1,2]. Small diesel engines, with their compact size and high efficiency, have become the core power equipment in agricultural production. However, the noise pollution they generate is also increasing [3]. As a key component for controlling exhaust pollution, the performance of exhaust mufflers has always attracted extensive attention from the relevant researchers.
Currently, many scholars are employing various methods to study the acoustic performance of mufflers. Alsah et al. [4] conducted a simulation study on the acoustic performance of a micro-perforated cylindrical plate muffler using the boundary element method. By combining this with the response surface methodology (RSM), the muffler was optimized, achieving a satisfactory noise reduction effect. Li et al. [5,6] used a two-dimensional axisymmetric analysis method and an orthogonal analysis to solve the sound propagation characteristics of a multi-cavity reactive muffler and studied the influence of the muffler’s structural parameters on the coupling effect of muffler chambers. Some scholars [7,8,9,10] have conducted research on mufflers of various shapes, such as cylindrical mufflers, Helmholtz mufflers, perforated tube mufflers, expansion mufflers, etc. Fu et al. [11,12] used the finite element analysis (FEA) to reveal the influence of the muffler’s structural factor on the transmission loss (TL). Fan et al. [13] used a one-dimensional numerical method to study the noise reduction performance of perforated baffles and perforated pores in reactive mufflers. Denia et al. [14] found that using an empty extension would result in a quarter-wave resonance, and that a sound-absorbing material improved high-frequency noise reduction. Liu et al. [15] compared the muffler schemes with different channel expansion angles and different flow area ratios using numerical calculations. Some studies [16,17] have shown that the geometric position, shape, and number of baffle holes have a significant impact on the sound attenuation performance. Erkan et al. [18] used a simplex centroid mixture design combined with the response surface method to carry out the optimization study of mufflers and found that as the number of baffles increases, the muffler performance becomes better. Based on past engineering experience, it is possible to design a muffler with different structures to achieve effective noise reduction [19,20,21]. It is evident that the internal structure of the muffler and its configuration significantly impact both the TL and PL. In muffler optimization design, designers often sacrifice some aerodynamic performance to achieve optimal acoustic performance. Additionally, the internal structure of the muffler can take various forms, and the impacts of single and multi-parameter variations on aerodynamic and acoustic performance differ. Addressing these multi-objective optimization challenges poses a significant difficulty for practitioners in the field.
In recent years, with the advancement of computer science and technology, some researchers [22,23] have used topology optimization methods to achieve the local optimization of mufflers. Many studies [24,25,26] have shown that the Design of Experiments (DOE) can scientifically and reasonably arrange experiments, thereby reducing the number of experiments, shortening the test cycle, analyzing the impact of experimental errors, and improving experimental accuracy. Therefore, it is widely used in engineering optimization. Renato et al. [27] used particle swarm optimization (PSO) to achieve the optimization of the acoustic performance of the muffler. Lu et al. [28] proposed a compact micro-perforated panel muffler with a serial–parallel coupling mode and achieved broadband noise reduction using a transfer matrix method combined with a multi-population genetic algorithm. Zuo et al. [29] established an approximate model of TL by correcting the thickness correction coefficient in the transfer matrix, and combined it with the NSGA algorithm to perform the multi-objective optimization of the muffler. Experimental results demonstrated the reliability of this method. Wang et al. [30] proposed two structural optimization schemes for mufflers based on GT-POWER, but did not conduct experimental validation. Chang et al. [31] combined artificial neural network models with genetic algorithms to achieve the precise optimization of mufflers at target frequencies. This method improves the optimization efficiency of mufflers. Altabey et al. [32] used deep learning algorithms to predict the acoustic properties of mufflers with different materials, which enhanced the optimization efficiency in material selection for mufflers. Xie et al. [33] optimized the acoustic performance of mufflers using a GA-BP neural network algorithm. Hossein et al. [34] conducted local and global sensitivity analyses on frequency, temperature, area ratio, and pipe length for the HQ pipe muffler, and proposed a genetic algorithm to optimize acoustic performance and geometric shape, achieving favorable results. The rapid development of the DOE method and computer technology has provided new ideas for the optimization design of mufflers.
Recent studies indicate that the current optimization research on mufflers typically focuses solely on acoustic performance. However, aerodynamic performance is also a crucial indicator for evaluating muffler efficiency. Therefore, this paper comprehensively considers both aerodynamic and acoustic performance in the optimization process. Firstly, a parallel perforated tube expansion muffler is proposed. Finite element simulations were conducted based on rated operating conditions to calculate the PL and TL of the muffler. Additionally, an engine test bench was set up to validate the reliability of the finite element analysis. Through this analysis, a Kriging approximation model was developed based on the DOE. Finally, the CMOPSO was used to perform multi-objective optimization on the muffler performance.
2. Muffler Modeling and Test Verification
2.1. Test
2.1.1. Equipment
The exhaust muffler for small diesel engines must effectively reduce noise while also considering fuel economy. The exhaust muffler is a parallel perforated tube expansion type, consisting of an inlet inner tube, two perforated plates, and two parallel straight-through perforated tubes. The structural scheme is illustrated in Figure 1, and the initial structural parameters are listed in Table 1.
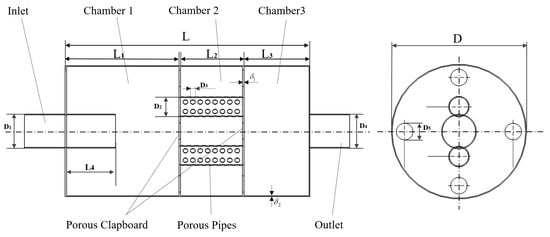
Figure 1.
Schematic diagram of muffler structure.

Table 1.
Basic parameters of the muffler.
The experimental tests in this study are based on the engine test bench built at the Intelligent Manufacturing Laboratory for Power Systems at universities in Hunan Province, as shown in Figure 2. The main components of the experimental setup include the following: a 186 series single-cylinder diesel engine (single-cylinder direct injection, bore * stroke = 86 * 72 mm, rated speed = 3000 r/min, and compression ratio = 19.5), an engine control and monitoring system (FC2000, XiangYi Power Testing Instrument Co., Ltd., Changsha, Hunan, China), an eddy current dynamometer (GWD-160 XiangYi Power Testing Instrument Co., Ltd., Hunan, China), a muffler, a sound level meter (HS5670B, State-owned Hongsheng, Rui’an, Zhejiang, China), a spectrum analyzer (Goodwill Electronics Co., Ltd., Taiwan, China), a pressure sensor (FC2050, XiangYi Power Testing Instrument Co., Ltd.), soundproof panels, and a computer.
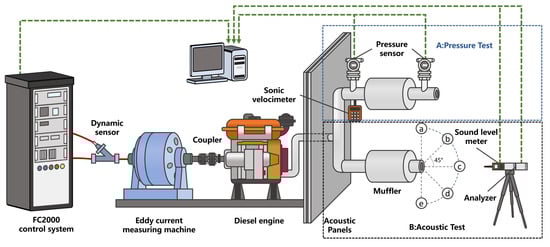
Figure 2.
Muffler performance of test bench: (A) pressure test and (B) acoustic test.
2.1.2. Method
The muffler test was strictly carried out in accordance with the industry standard JB/T9869-2020 [35], Exhaust Silencers of Internal Combustion for Construction Machinery, to measure the sound pressure level (SPL) and exhaust back pressure of the exhaust muffler. The acoustic performance of the exhaust muffler can be judged by the insertion loss (IL) and TL. These two indicators can reflect the noise reduction performance of the exhaust muffler in different aspects. The IL can be calculated by measuring the difference in SPL before and after the installation of the muffler. Considering the experimental conditions, this paper selects the IL as the test indicator to more accurately assess the noise reduction performance of the exhaust muffler. The spatial five-point method [11] is used for measurement and recording.
The air dynamics performance of the exhaust muffler is most directly assessed by measuring the pressure difference. This measurement is taken at the upstream and downstream ends of the muffler within the exhaust system. Before the experiment begins, once all the equipment has stabilized, the pressure loss (PL) of the muffler is determined. This is performed by measuring the difference in total pressure at the inlet and outlet ends of the muffler using a pressure sensor.
2.1.3. Results
By controlling the engine test system, the PL at different inlet velocities of the engine is measured. Data are recorded only after allowing the equipment to stabilize before each measurement. Figure 3 shows the PL at inlet velocities of 10 m/s, 20 m/s, 30 m/s, 40 m/s, 50 m/s, and 60 m/s. The figure indicates that the PL increases in a parabolic manner.
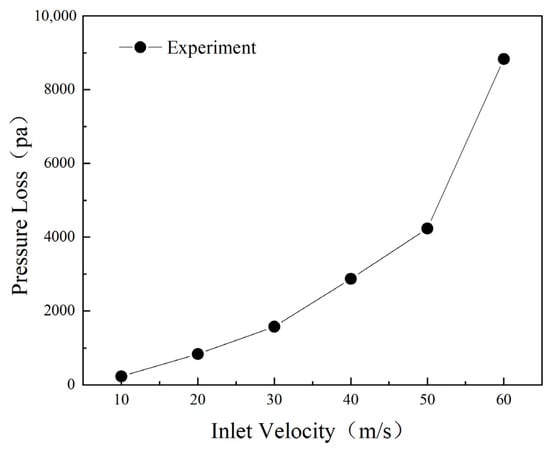
Figure 3.
Pressure loss of mufflers with different inlet flow rates.
The subject of this study is a small, air-cooled single-cylinder diesel engine. Due to its light weight, compact size, and economic advantages, it is primarily used in agricultural machinery to drive various farming tools. This paper analyzes the noise spectrum at its rated speed of 3000 r/min. Figure 4 shows that the exhaust noise of a diesel engine is a high-frequency noise covering the entire frequency band. Due to the characteristics of the single-cylinder diesel engine, the SPL of the exhaust noise exhibits irregular variations within the test frequency range, reaching a maximum of 112.3 dB at 1250 Hz. The original muffler produced some noise reduction effect within the 25–3150 Hz frequency range, but the overall noise reduction effect was not ideal.
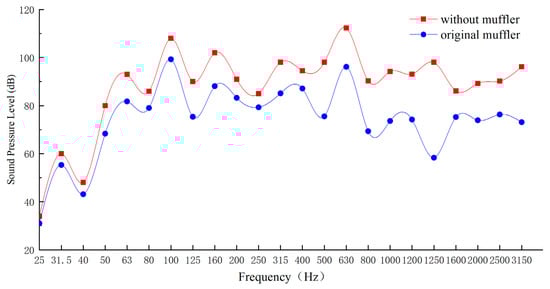
Figure 4.
SPL of noise spectrum at 3000 RPM.
2.2. Simulation Analysis
2.2.1. Grid Division
Before performing the finite element analysis on the muffler, the model needs to be discretized, which involves mesh generation. Since there are many perforated structures on the insert pipe and baffle in the exhaust muffler, an unstructured grid (by ICEM) is used in this paper. The global mesh size is set to 5 mm, the intake and exhaust pipes mesh sizes at 2 mm, and the dimensions of each hole in the cavity are 0.5 mm. This results in a standard mesh for the muffler. After mesh checking, it shows that the determinant of the grid cells is greater than 0.9, the min angle is greater than 18°, and the average mesh quality is 0.81. The mesh details are shown in Figure 5; the number of mesh nodes is 455,073, the total number of meshes is 2,540,419, and the overall mesh quality meets the requirement of calculation accuracy.
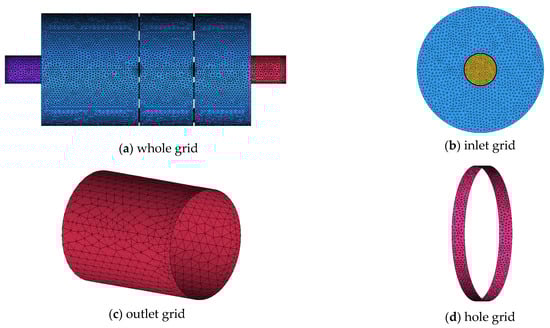
Figure 5.
Mesh diagram of muffler.
2.2.2. Pressure Simulation
When using the finite volume method for the numerical modeling of the flow field, due to the small size of the muffler studied in this paper and considering its application scenario in small diesel engine agricultural mufflers, appropriate simplifications were made for the internal fluid [12]:
- (1)
- The structural walls of the muffler are assumed to be rigid with no-slip boundaries;
- (2)
- The fluid within the muffler chamber is considered to be an ideal gas, and the outer wall is adiabatic;
- (3)
- The physical parameters of the muffler are constant and invariant, and the influence of gravity is not considered.
The boundary conditions select the velocity–pressure base solver, with the inlet boundary defined as a velocity inlet condition. The velocity value is determined based on the actual operating conditions measured for the diesel engine, and a second-order upwind discretization format is employed. The standard model is used for the turbulence model, and the pressure loss is calculated using Formula (1).
where , represents the average pressures at the inlet and outlet end faces of the muffler. The SIMPLE method is chosen for the solution process. Since the tail end outlet of the exhaust muffler directly leads to the atmosphere, the outlet boundary condition is defined as a pressure outlet, the relative pressure is 0, and the pressure nephogram is shown in Figure 6. The overall pressure in the chamber decreases in a stepped manner, reaching its maximum at the first perforated bulkhead. In the second chamber, the flow is affected by the perforations, resulting in a sudden change in flow area and causing pressure loss. Therefore, in subsequent optimizations and improvements, it is necessary to reasonably adjust the lengths of various structures to ensure the uniformity of the airflow, thereby enhancing the economic performance of the small diesel engine.
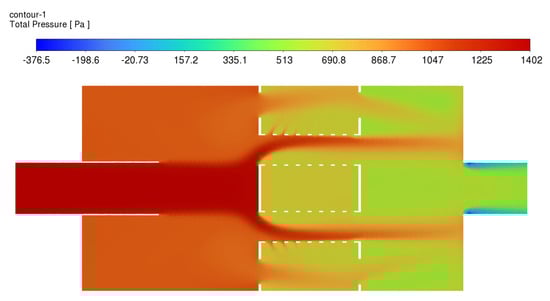
Figure 6.
Pressure nephogram.
2.2.3. Acoustic Simulation
In the acoustic simulation software, a unit velocity excitation is applied to the inlet of the diesel engine exhaust muffler. The fluid material is defined as air, and the wall boundary conditions are defined as rigid walls. The walls do not have any acoustic absorption properties, and the vibration velocity of the medium in the normal direction on the wall is zero. When defining the Automatic Matched Layer (AML) reflection-free boundary condition at the outlet, TL is the difference between the incident sound power level at the inlet end of the muffler and the transmitted sound power level at the outlet end, which is calculated as in Formulas (2)–(4):
where and are the incident sound powers at the inlet of the muffler and the reflected sound power at the inlet, respectively, S1 and S2 represent the cross-sectional areas at the inlet and outlet ends of the muffler, P is the medium density, C is the speed of sound, and M is the Mach number of the airflow. Figure 7 shows the muffler acoustic finite element mesh model and the SPL cloud diagram inside the structure at 430 Hz.
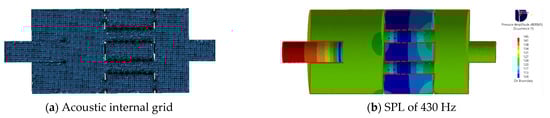
Figure 7.
Acoustical finite element mesh and sound pressure cloud diagram.
2.2.4. Model Validation
By using the FC2000 control system, the speed and torque of the diesel engine are changed. According to the flowmeter readings, different inlet velocities are obtained, and the pressure values at both ends of the muffler are recorded. As is shown in Figure 8, it can be seen that the trend in PL closely matches the simulation results, exhibiting a quadratic parabolic increase. The relative error is about 5.6% (when the inlet speed is below 40 m/s, the error is about 2.9%). The test results are slightly higher than the simulation results. This is because during the field test, a section of equal-length pipe is used to guide the exhaust gas out, and due to the roughness of the pipe wall and the resistance along the flow path, PL is caused. Additionally, under the high-speed air flow, regenerative air flow may be generated, resulting in a certain error in PL.
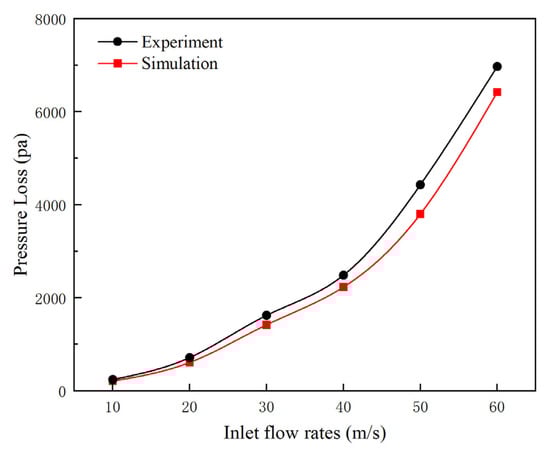
Figure 8.
Experiment and simulation comparison chart of the PL.
Prior to measuring insertion loss, the engine’s noise radiation is isolated using a custom-made protective enclosure lined with sound-absorbing material. After ensuring that the environmental background noise meets the testing criteria, the diesel engine is started. Next, we wait for the fuel consumption rate and cooling water temperature to reach stable values before starting to record data. The measurement in this paper is carried out at the rated speed. Each set of data needs to be recorded three times. Data collection and collection are performed when the error between the three data points is less than 0.5 dB, ensuring that the test data are reliable. Noise measurements with and without mufflers were made under the same conditions. Finally, the approximate conversion of TL is achieved using the conversion Formula (5) between the sound power level and SPL.
where r is the distance from the sound source to the test point; IL is the insertion loss; Lp1 and Lp2 are the SPL before and after the installation of the muffler, respectively; TL is the transmission loss; and LW1 and LW2 are the inlet sound power level and outlet sound power level, respectively.
Figure 9 shows the comparison between the simulation and experimental results of TL. In the frequency range of 25–3150 Hz, the overall trend of change between the experimental and simulation results is generally the same. However, at frequencies of 125, 500, 630, and 3150 Hz, the simulated values are greater than the experimental values. The maximum error occurs at 1250 Hz, with an error value of 4.5 dB. The reason for this phenomenon might be that there is airflow noise inside the muffler or that the engine’s exhaust tailpipe’s residual temperature affects the exhaust noise. In summary, the simulated values of the muffler have a small error with the experimental values, and the results show that the finite element model developed in this chapter can be used as an alternative model for the TL of the muffler.
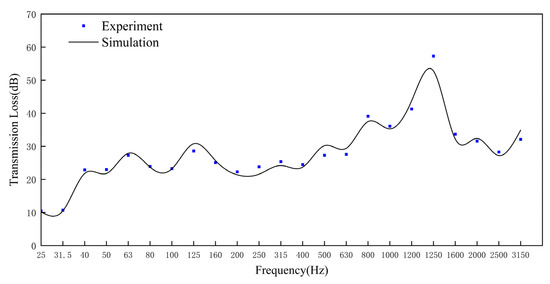
Figure 9.
Experiment and simulation comparison chart of the TL.
2.3. Experimental Design
2.3.1. Data Sampling
Due to the complex internal structure of mufflers, different structural parameters can lead to varying effects on their performance. Consequently, the optimization process of mufflers typically appears to be quite time-consuming. The Optimal Latin Hypercube Design (OLHD) is a type of Design of Experiments (DOE) approach. In this method, each dimension of the n-dimensional input parameter design space is divided into m equal-probability sub-intervals, ensuring that each level of a factor is studied only once. The OLHD ensures uniformity and orthogonality of the sampling points with a minimal number of samples, which has led to its widespread application [26]. Considering the spatial constraints when installing and using mufflers in practice and based on muffler design theory and practical computational efficiency, this study selected 30 sets of design variables for computation. Some of the data are presented in Table 2.
Table 2.
Boundary constraints of structural parameters.
2.3.2. Significance Analysis
Before conducting the structural optimization of the muffler, due to the large number of silencing units, it is necessary to investigate the primary and secondary effects of the parameters on the target values to simplify the model, thereby enhancing its performance and accuracy. A multivariate linear regression analysis was carried out to analyze the structural characteristics of the muffler, as expressed in Formula (6):
In the formula, represents the target variable, which is the TL or PL; and are design variables, which represent the structural parameters of the muffler; and denotes the regression coefficients, indicating the significance of the structural parameters on the target values. To eliminate the influence of different units among the structural parameters and to make the assessment of the model more intuitive, the relevant data were normalized. The formula for normalization is given by Formula (7):
Figure 10 illustrates the significance of the muffler’s structural parameters on the TL and PL. It can be observed that L2, L4, D2, and have a significant impact on both the TL and PL, while the other parameters have a relatively minor effect on the TL and PL (less than 5%). Therefore, to improve the efficiency of subsequent optimizations, the three parameters with minor impacts are disregarded, and four significant factors are taken as design variables for optimizing the muffler’s structural parameters.
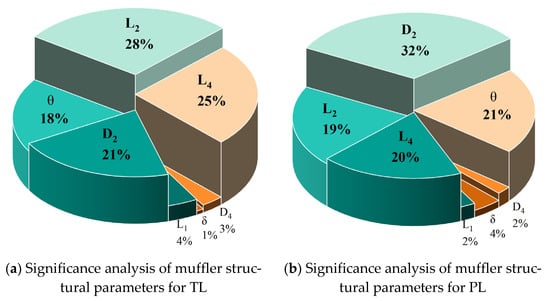
Figure 10.
Significance analysis of muffler parameters.
2.4. Kriging
2.4.1. Model Definition
The Kriging model is capable of interpolating and predicting by using the spatial correlation of known data points. It takes into account the spatial correlation properties of the described object, making the interpolation results more scientific and closer to the actual conditions [36]. The Kriging model consists of two parts: a basis function and a stationary stochastic process. In the Kriging model, it is assumed that the objective function is related to the design variables as expressed in Formula (8):
where is a vector of the regression polynomial basis function; is the vector of the design variables, which are the four structural parameters described in Section 3.2; represents the undetermined coefficients; and is the fitting error random process with a mean of 0 and a variance of , where its covariance is given by Formula (9):
where represents the unknown correlation parameters; refers to any two sets of independent design variables; and i, j = 1, 2, …, n, where n is the number of sample points. When a Gaussian stationary stochastic process is used, the correlation function can be expressed as Formula (10).
where is the distance between two points. The linear regression part uses the least squares method for calculation. The estimated values of the undetermined coefficients and variance are given by Formulas (11) and (12):
According to the above equations, the value of affects the prediction accuracy of the Kriging model. Based on the maximum likelihood estimation method, it can be calculated using Formula (13).
Therefore, for an unknown point , its correlation matrix with the sample points is denoted as , and its predicted value can be expressed as Formula (14):
2.4.2. Response Surface
The mapping relationship between the input parameters and output parameters was established using the Kriging model. By employing cross-validation error analysis, the data from the sampling table were substituted into the Kriging model. The RSM of the Kriging model is shown in Figure 11.
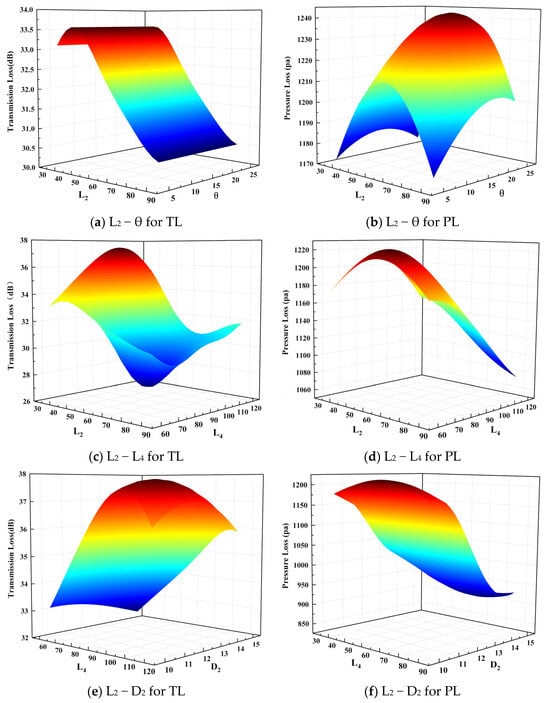
Figure 11.
Kriging response surface of muffler: (a–f).
As shown in Figure 11, L2 − L4 has a significant impact on the TL, while L4 − D2 has a major influence on the PL. Without altering the overall dimensions of the muffler, the influence of multiple structural parameters on the muffler performance is not merely a simple linear relationship, it can also reduce the error in the muffler performance caused by a single factor. By establishing the Kriging model response surface, the interdependent factors among structural parameters were revealed. This approach improves computational efficiency during muffler optimization and reduces experimental costs.
2.4.3. Accuracy Verification
To ensure the accuracy of the subsequent optimization model, it is necessary to perform a precision test on the approximate model once its construction is completed. Through error analysis, the limitations of the model can be understood, and the conditions under which the model can provide reliable predictions can be identified. Within the same range of constraints, an additional five points are selected from the Latin hypercube space, and finite element calculations are performed for each group. The computed PL and TL are shown in Table 3, where is the average transmission loss (TLA) obtained from acoustic FEM; is the TLA obtained from the Kriging model; is the PL obtained from computational fluid dynamics; is the PL obtained from the Kriging model; ; ; and is the relative error. From Table 3, it can be seen that the relative errors of the TLA and PL obtained from the two different methods are both within 5%, indicating that they are acceptable in practical engineering applications.
Table 3.
Experimental parameters and errors.
In order to further verify the accuracy of the established Kriging model, the root mean square error (RMSE) and determination coefficient (R2) were used to evaluate the predictive ability of the model. The calculation formulas are (15) and (16)
where is the true value of the response points; is the mean value of the response; and is the predicted value. Generally, the closer R2 is to 1, the more accurate the model is considered to be. From Table 4, it can be observed that the RMSE values for both PL and TL are below 0.1, while the R2 values are above 0.9. This indicates that the accuracy of the Kriging model established in this study meets the required standards.
Table 4.
Error analysis of Kriging model.
3. Optimization
3.1. Multi-Objective Optimization
Multi-objective optimization problems are common in many fields such as scientific research and engineering practice. In the optimization of mufflers, researchers focus on its aerodynamic performance and acoustic performance, and these two objectives are typically in conflict: as acoustic performance improves, exhaust back pressure tends to increase. The multi-objective optimization problem is generally described as Formula (17):
where is the optimization goal; is the number of optimization functions, and ; is the inequality constraint; is the equality constraint; is the design variable; and is the number of design variables.
When solving multi-objective optimization problems, a set of Pareto solutions will be obtained. However, there is no absolute optimal solution in this solution set. Decision makers can only choose a relatively optimal balanced solution based on their specific needs. This paper adopts an optimal compromise solution based on the distance indicator, and its principle is shown in Figure 12:
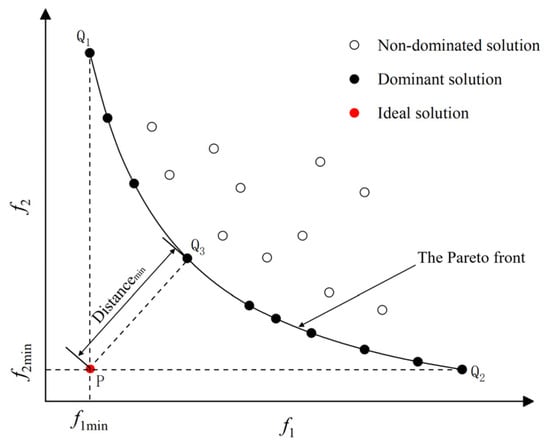
Figure 12.
Compromise optimal solution based on distance index.
Q1 and Q2 represent the optimal solutions on objectives f1 and f2; P is the optimal ideal solution in the target space. However, in many cases, the optimal ideal solution does not exist. Therefore, the distance degree is used to measure the closeness of the solution to the ideal solution in the target space, so as to avoid subjective errors.
3.2. CMOPSO
Multi-objective particle swarm optimization (MOPSO) is an intelligent search algorithm that simulates the predation behavior of birds. A competitive mechanism-based MOPSO (CMOPSO) introduces the idea of the competition mechanism, where particles compete with each other to solve highly nonlinear problems.
CMOPSO can better solve the problems of population convergence and balance, and at the same time, it combines the evolutionary strategy of the genetic algorithm (GA) to ensure the diversity of the particles in the search space. More details can be found in Zhang’s [37] paper. The particle learning strategy is shown in Figure 13.
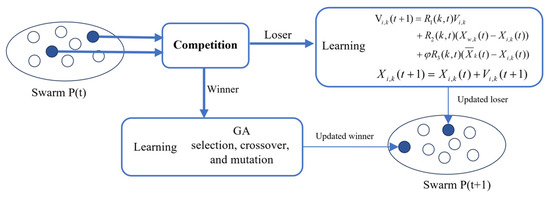
Figure 13.
Learning strategy of CMPOSO.
In the loser learning strategy, is a random number generated in [0, 1]; is the average position of all particles in the group, which is global; and is the parameter that controls the update of the loser position. The process diagram of applying CMOPSO in muffler optimization is shown in Figure 14.
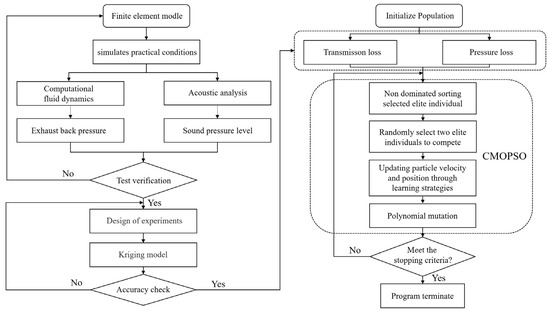
Figure 14.
Optimization framework of muffler.
3.3. Optimizing Case
In the optimization design of the exhaust muffler, the optimization goal is to reduce the exhaust back pressure as much as possible under the premise of improving the noise reduction. From the test results in Figure 14, it can be seen that the exhaust noise of the diesel engine is relatively large in the range of 100–3150 Hz. Therefore, this paper selects the TLA and PL in the range of 100–3150 Hz as the optimization target. In order to facilitate the subsequent optimization calculation, the TLA is taken as a negative value. Its mathematical model can be simply described as Equation (18)
CMOPSO is applied to the optimization model in this paper, and its constraint conditions are shown in Table 5, based on the Kriging response surface model in Section 2.4.2.
Table 5.
Constrained range of structural dimensions.
4. Results and Discussion
In this section, MOPSO and CMOPSO are used for multi-objective optimization. Under the condition of rated speed, the Pareto frontier obtained after executing the optimization program is shown in Figure 15. It can be seen from the figure that the PL of the muffler increases with the increase in the TL, which shows that the better the muffler performance, the higher the exhaust resistance is, and this reflects the inherent characteristics of the muffler.
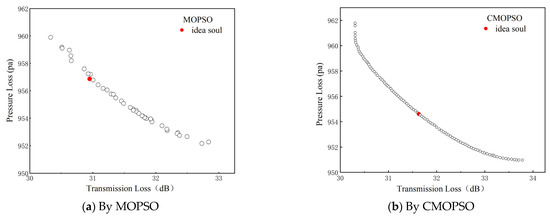
Figure 15.
Pareto front of muffler optimization by MOPSO and CMPOSO.
According to the above analysis, the solution set calculated by the CMOPSO algorithm has better convergence and diversity, and there are no overlapping solutions. It can be seen that the Pareto frontier of the CMOPSO optimization result is smoother and more uniform, and the distribution of solutions is more extensive. Table 6 compares the optimization results of the different strategies. When using MOPSO, TLA increases from 27.3 dB to 31.4 dB and 30.9 dB, while PL decreases from 1087 Pa to 956 Pa and 957 Pa, indicating that the results obtained through the weighted method exhibit better overall performance. After calculations using CMOPSO, TLA increases from 27.3 dB to 31.3 dB and 31.6 dB, while PL decreases from 1087 Pa to 956 Pa and 957 Pa. The optimization results obtained through the ideal point method are more pronounced, demonstrating that the overall performance of CMOPSO optimization is superior to that of MOPSO. Although the optimization results show improvements in both the acoustic and aerodynamic performance, the increase in the length of the inlet inter-tube may affect the internal stability of the structure. Therefore, considering the comprehensive performance from the three aspects while avoiding subjective bias, this paper selects NO.5 as the final solution for the deterministic optimization.
Table 6.
Multi-objective optimization results.
According to the above optimization results, the corresponding muffler was manufactured and the performance test was carried out. As shown in Figure 16, the exhaust noise of the optimized muffler has decreased in most frequency ranges, and the error between the experiment and the simulation calculation is small: the TL is 3.7% and the PL is 5.1%. The reason for the error may be that a long pipe was used to connect the engine exhaust to the test equipment in the test, resulting in additional energy loss. Without changing the overall size of the muffler, the PL was slightly reduced and the noise reduction was improved, proving that the overall performance of the optimized muffler was improved.
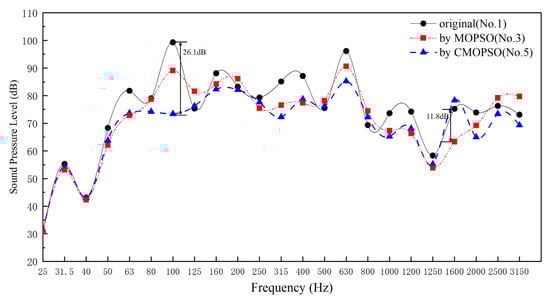
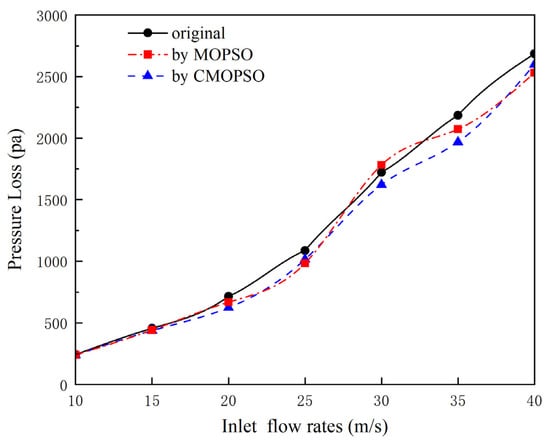
Figure 16.
Multi-objective optimization results of muffler performance.
5. Conclusions
This paper proposes a parallel perforated tube expansion-type small agricultural diesel engine muffler. The preliminary analysis of the muffler model was conducted using finite element methods. Combining the Kriging model with the CMOPSO algorithm, the multi-objective optimization of the muffler performance was performed, leading to the following conclusions:
- Using the optimized Latin hypercube sampling method helps us to identify the importance of multiple structural parameters on the muffler performance. Specifically, the parameters L2, L4, , and D2 significantly impact the performance indicators of the muffler. Therefore, prioritizing the optimization of these key parameters can simplify the model and enhance the overall efficiency of the optimization process.
- By establishing the Kriging model response surface, the influence of multiple structural parameters coupled on the muffler performance is revealed. Without changing the overall size of the exhaust muffler, reasonable adjustments of the structural parameters can improve the comprehensive performance of the muffler.
- The optimization results show that under the same rated working conditions, the pressure loss of the muffler decreased by about 134 Pa, and the average transmission loss within 0–3150 Hz increased by about 4.3 dB. Compared with MOPSO, the CMOPSO optimization result has a larger optimization range and better comprehensive performance.
- In the structural optimization design of the muffler, the ideal point method can more comprehensively explore the solution space and better evaluate the advantages and disadvantages of the different solutions. At the same time, decision-makers should consider the length of the internal structure of the muffler to ensure that the product achieves optimal overall performance. This paper can provide some ideas for the subsequent optimization design of the same type of mufflers.
Author Contributions
J.F. and W.Y.: conceptualization, methodology, and software. F.L.: data curation, writing—original draft, and writing—review and editing. Y.M.: supervision and validation. All authors have read and agreed to the published version of the manuscript.
Funding
This research was funded by the National Natural Science Foundation of China, grant number 52076141; the Hunan Provincial Natural Science Foundation of China, grant number 2022JJ50025; the Hunan Provincial Natural Science Foundation of China, grant number 2023JJ50262; and the Shaoyang University Research Special Project, grant number 24KYQD16.
Data Availability Statement
The data presented in this study are available on request from the corresponding author.
Conflicts of Interest
The authors declare no conflicts of interest.
References
- Luo, B.; E, J.; Chen, J.; Zhang, F.; Ding, J. Effect of NH3/H2/O2 premixed combustion on energy conversion enhancement and NOx emission reduction of the segmented nozzle micro-combustor in thermophotovoltaic system. Renew. Energy 2024, 228, 120682. [Google Scholar] [CrossRef]
- E, J.; Zhou, H.; Kou, C.; Feng, C.; Zou, Z. Effect analysis on the hydrocarbon adsorption performance enhancement of the different zeolite molecular sieves in the gasoline engine under the cold start process. Energy 2024, 305, 132212. [Google Scholar] [CrossRef]
- Princess Okimiji, O.; Tochukwu Okafor, A.; Iyabo Fasona, M.; Atoro, T.; Akintayo Aborisade, M.; Nyandansobi Simon, J. Proliferation of noise pollution: Implication on health and community perception in coastal slums. Appl. Acoust. 2023, 214, 109713. [Google Scholar] [CrossRef]
- Alisah, M.I.; Ooi, L.-E.; Ripin, Z.M.; Yahaya, A.F.; Ho, K. Acoustic Attenuation Performance Analysis and Optimisation of Expansion Chamber Coupled Micro-perforated Cylindrical Panel Using Response Surface Method. Arch. Acoust. 2023, 46, 507–517. [Google Scholar] [CrossRef]
- Li, R.; Zhou, Y.; Xue, Y.; Han, S. Local Structural Optimization Method Based on Orthogonal Analysis for a Resistant Muffler. IEEE Access 2021, 9, 40560–40569. [Google Scholar] [CrossRef]
- Li, R.; Zhou, Y.; Wei, C.; Mi, Y. Analysis of coupling effect between chambers of reactive muffler. Appl. Acoust. 2022, 191, 108679. [Google Scholar] [CrossRef]
- Ouédraogo, B.; Maréchal, R.; Ville, J.M.; Perrey-Debain, E. Broadband noise reduction by circular multi-cavity mufflers operating in multimodal propagation conditions. Appl. Acoust. 2016, 107, 19–26. [Google Scholar] [CrossRef]
- Shi, Q.-Q.; Yang, Y.-Z.; Zhao, Z.; An, B.-W.; Tian, P.-Y.; Jiang, C.-C.; Deng, K.; Jia, H.; Yang, J. Research and design of broadband muffler based on second-order Helmholtz resonators. Acta Phys. Sin. 2022, 71, 234301. [Google Scholar] [CrossRef]
- Fan, Y.; Ji, Z. Three-pass mufflers with perforated inlet/outlet tubes. Appl. Acoust. 2019, 156, 217–228. [Google Scholar] [CrossRef]
- Jang, G.W.; Lee, J.W. Optimal partition layout of expansion chamber muffler with offset inlet/outlet. Int. J. Automot. Technol. 2015, 16, 885–893. [Google Scholar] [CrossRef]
- Fu, J.; Zheng, W.; Xu, M.; Wang, W.; Huang, Y. Study on the influence of structure factors of diesel engine exhaust purification muffler on transmission loss in different frequency bands. Appl. Acoust. 2021, 180, 108147. [Google Scholar] [CrossRef]
- Jun, F.; ZengFeng, Z.; Wei, C.; Hong, M.; JianXing, L. Computational fluid dynamics simulations of the flow field characteristics in a novel exhaust purification muffler of diesel engine. J. Low Freq. Noise Vib. Act. Control 2018, 37, 816–833. [Google Scholar] [CrossRef]
- Fan, Y.; Ji, Z. Three-pass perforated tube muffler with perforated bulkheads. Adv. Mech. Eng. 2016, 8, 1687814016676767. [Google Scholar] [CrossRef]
- Denia, F.D.; Selamet, A.; Fuenmayor, F.J.; Kirby, R. Acoustic attenuation performance of perforated dissipative mufflers with empty inlet/outlet extensions. J. Sound Vib. 2007, 302, 1000–1017. [Google Scholar] [CrossRef]
- Liu, H.; Lin, J.; Hua, R.; Dong, L. Structural Optimization of a Muffler for a Marine Pumping System Based on Numerical Calculation. J. Mar. Sci. Eng. 2022, 10, 937. [Google Scholar] [CrossRef]
- Arslan, H.; Ranjbar, M.; Secgin, E.; Celik, V. Theoretical and experimental investigation of acoustic performance of multi-chamber reactive silencers. Appl. Acoust. 2020, 157, 106987. [Google Scholar] [CrossRef]
- Elsayed, A.; Bastien, C.; Jones, S.; Christensen, J.; Medina, H.; Kassem, H. Investigation of baffle configuration effect on the performance of exhaust mufflers. Case Stud. Therm. Eng. 2017, 10, 86–94. [Google Scholar] [CrossRef]
- Seçgin, E.; Arslan, H.; Birgören, B. A statistical design optimization study of a multi-chamber reactive type silencer using simplex centroid mixture design. J. Low Freq. Noise Vib. Act. Control 2020, 40, 623–638. [Google Scholar] [CrossRef]
- Xiang, L.; Zuo, S.; Zhang, M.; Hu, J.; Long, G. Study of micro-perforated tube mufflers with adjustable transmission loss. Proc. Mtgs. Acoust. 2013, 20, 030002. [Google Scholar] [CrossRef]
- Xiang, L.; Wang, G.; Zhu, C.; Shi, M.; Hu, J.; Luo, G. Ventilation barrier with space-coiling channels of varying cross-section for broadband sound insulation. Appl. Acoust. 2022, 201, 109110. [Google Scholar] [CrossRef]
- Gao, C.; Hu, C.; Mei, J.; Hou, B.; Zhang, X.; Du, Z.; Wen, W. Barrier-free duct muffler for low-frequency sound absorption. Front. Mater. 2022, 9, 991959. [Google Scholar] [CrossRef]
- Fang, Z.; Ji, Z.L.; Liu, C.Y. Acoustic attenuation analysis of silencers with multi-chamber by using coupling method based on subdomain division technique. Appl. Acoust. 2017, 116, 152–163. [Google Scholar] [CrossRef]
- Oh, K.S.; Lee, J.W. Topology optimization for enhancing the acoustical and thermal characteristics of acoustic devices simultaneously. J. Sound Vib. 2017, 401, 54–75. [Google Scholar] [CrossRef]
- Olsson, A.; Sandberg, G.; Dahlblom, O. On Latin hypercube sampling for structural reliability analysis. Struct. Saf. 2003, 25, 47–68. [Google Scholar] [CrossRef]
- Viana, F.A.C. A Tutorial on Latin Hypercube Design of Experiments. Qual. Reliab. Eng. Int. 2016, 32, 1975–1985. [Google Scholar] [CrossRef]
- Helton, J.C.; Davis, F.J. Latin hypercube sampling and the propagation of uncertainty in analyses of complex systems. Reliab. Eng. Syst. Saf. 2003, 81, 23–69. [Google Scholar] [CrossRef]
- Barbieri, R.; Barbieri, N.; de Lima, K.F. Some applications of the PSO for optimization of acoustic filters. Appl. Acoust. 2015, 89, 62–70. [Google Scholar] [CrossRef]
- Lu, C.; Chen, W.; Liu, Z.; Du, S.; Zhu, Y. Pilot study on compact wideband micro-perforated muffler with a serial-parallel coupling mode. Appl. Acoust. 2019, 148, 141–150. [Google Scholar] [CrossRef]
- Zuo, S.; Wei, K.; Wu, X. Multi-objective Optimization of a Multi-chamber Perforated Muffler Using an Approximate Model and Genetic Algorithm. Int. J. Acoust. Vib. 2016, 21, 152–163. [Google Scholar] [CrossRef]
- Wang, T.; Gao, J.; Bu, Y. Performance Analysis of Improved Vehicle Muffler. Mechanics 2018, 24, 751–756. [Google Scholar] [CrossRef]
- Chiu, M.-C.; Chang, Y.-C.; Wu, M.-R. Numerical Assessment of Automotive Mufflers Using FEM, Neural Networks, and a Genetic Algorithm. Arch. Acoust. 2023, 43, 517–529. [Google Scholar] [CrossRef] [PubMed]
- Altabey, W.A.; Noori, M.; Wu, Z.; Al-Moghazy, M.A.; Kouritem, S.A. Studying Acoustic Behavior of BFRP Laminated Composite in Dual-Chamber Muffler Application Using Deep Learning Algorithm. Materials 2022, 15, 8071. [Google Scholar] [CrossRef] [PubMed]
- Xie, X.-l.; Gao, F.; Huang, X.-y.; Huang, C.; Li, J. Numerical optimization of flow noises for mufflers based on the improved BP neural network. J. Vibroeng. 2016, 18, 2626–2640. [Google Scholar] [CrossRef]
- Ahmadian, H.; Najafi, G.; Ghobadian, B.; Reza Hassan-Beygi, S.; Bastiaans, R.J.M. Analytical and numerical modeling, sensitivity analysis, and multi-objective optimization of the acoustic performance of the herschel-quincke tube. Appl. Acoust. 2021, 180, 108096. [Google Scholar] [CrossRef]
- JB/T9869-2020; Exhaust Silencers of Internal Combustion for Construction Machinery. China Machine Press: Beijing, China, 2021.
- Bhosekar, A.; Ierapetritou, M. Advances in surrogate based modeling, feasibility analysis, and optimization: A review. Comput. Chem. Eng. 2018, 108, 250–267. [Google Scholar] [CrossRef]
- Zhang, X.; Zheng, X.; Cheng, R.; Qiu, J.; Jin, Y. A competitive mechanism based multi-objective particle swarm optimizer with fast convergence. Inf. Sci. 2018, 427, 63–76. [Google Scholar] [CrossRef]
Disclaimer/Publisher’s Note: The statements, opinions and data contained in all publications are solely those of the individual author(s) and contributor(s) and not of MDPI and/or the editor(s). MDPI and/or the editor(s) disclaim responsibility for any injury to people or property resulting from any ideas, methods, instructions or products referred to in the content. |
© 2024 by the authors. Licensee MDPI, Basel, Switzerland. This article is an open access article distributed under the terms and conditions of the Creative Commons Attribution (CC BY) license (https://creativecommons.org/licenses/by/4.0/).