Article

Preventive Maintenance Strategy Prediction of the Firewater Systems Based on the Pythagorean Fuzzy Cost–Benefit–Safety Analysis and Fuzzy Dematel

by
Samia Daas
1,* and
Fares Innal
2
1
Institute of Health and Safety, University of Batna 2, Batna 05000, Algeria
2
Automatic Laboratory of Skikda, Institute of Applied Sciences and Techniques, Université 20 Août 1955, Skikda 21000, Algeria
*
Author to whom correspondence should be addressed.
Processes 2024, 12(10), 2187; https://doi.org/10.3390/pr12102187
Submission received: 13 July 2024 / Revised: 19 August 2024 / Accepted: 24 August 2024 / Published: 9 October 2024
(This article belongs to the Section AI-Enabled Process Engineering)

Abstract

:
The firewater system is a complex system associated with the safety process of Hydrogen storage tanks. Predicting preventive maintenance strategies is essential to ensure the long-term reliability of this system. Therefore, it is necessary to evaluate the multistate reliability of the firewater system in order to predict preventive maintenance strategies and provide safety measures. A polymorphic fuzzy fault tree analysis (PFFTA) for the risk analysis of complex systems has attracted much attention because of its powerful evaluation capability and its ability to analyze relationships among basic events. However, obtaining multistate failure probability (MFP) data for basic events in PFFTA has always been a major challenge. It is also difficult to quantify the minimum cut set (MCS) in PFFTA and determine the critical components for selecting a preventive maintenance strategy. In this study, we propose the Pythagorean fuzzy cost–benefit–safety analysis by using the PFFTA, an improved consistency aggregation method (I-CAM), and fuzzy Dematel for a predictive preventive maintenance strategy. In the proposed approach, the I-CAM method was used to collect and aggregate weights of experts’ opinions to evaluate the MFP of basic events in PFFTA. As a result, a triptych cost–benefit–safety analysis based on Pythagorean fuzzy sets (PFSs) and the sum-product method (SPM) was estimated to reduce expert subjectivity, support an improved cost-effectiveness index to rank critical components, and fuzzy Dematel to evaluate influence of proposed preventive maintenance actions. To clarify the effectiveness and feasibility of the proposed methodology, a case study of the firewater system related to the plant is located in SONELGAZ electricity power plant (OUMACHE Unit) was demonstrated. Both evaluations of the cost–benefit–safety analysis of the critical component were performed, and selected the influence of preventive maintenance strategy of the firewater system was predicted.

1. Introduction

Storage processes are playing an increasingly important role in the electricity production industries worldwide to store large quantities of highly flammable, explosive, and combustible materials [1,2]. Hence, one of the harmful substances widely used in electricity production plants is Hydrogen. However, the storage of Hydrogen poses serious accident risks. These disasters can have serious consequences for people, property, and the environment.
Explosion accidents associated with Hydrogen storage have become a major problem in the Algerian industry, and a retrospective analysis of the incidents is needed to prevent similar incidents in the future. However, Hydrogen storage sites in Algeria have been identified [3]. In recent years, several serious accidents in the electricity power plant have highlighted the safety risks associated with the industry [4] and the need for effective firefighting systems to prevent and reduce fire hazards [5]. In October 2005, one significant major accident occurred in the Skikda industrial complex in Algeria, resulting in a loss of life and significant material damage related to LPG storage [6]. In addition, progress has been made in the area of prevent barriers for the petrochemical industry to address these risks. One notable advance is the development of quantitative risk assessment (QRA) guidelines by the American Institute of Chemical Engineers (AIChE) [7,8]. These references provide a systematic approach for assessing the risks associated with chemical processes and operations [9]. Therefore, firefighting systems play a key role in mitigating the risks associated with high-risk accidents in the petrochemical industry [10].
Process safety is necessary in industries that handle hazardous materials, such as Hydrogen storage tanks. Therefore, various strategies for hazard identification, analysis, risk assessment, and safety measures have been developed over the years to ensure the safety of workers and the surrounding environment. In recent years, the various electricity power plant have considered some storage tank risk-assessment applications to evaluate and prevent undesirable situations. As an example, the authors of [11] introduced a combination of expert systems and Layer of Protection Analysis (LOPA) to evaluate safety assurance in the chemical process industry. This proposed framework aims to simplify the process of accident scenario identification and risk-assessment process. Similarly, other authors questioned the sufficiency of traditional tools for hazard analysis and accident scenario definition, suggesting the need for more effective methods to address challenges in risk management [12]. In this context, this practice study focused on the evaluation of fire safety systems in the storage process of dangerous materials, highlighting the importance of targeted measures to effectively assess and manage fire risks [13].
Therefore, previous research has focused on various methods and technologies to improve firefighting capabilities and mitigate the effects of gas explosions [14]. Furthermore, other authors have discussed the combination of static component availability analysis with dynamic component reliability analysis, using the coastal industrial water flooding system as an example [15]. Multistate complex systems consisting of interconnected components and subsystems pose unique challenges in reliability analysis due to their complex structure and associated uncertainties. As a result, one of the key issues in the reliability assessment of these systems is the uncertainty surrounding the relationship between the failure states of the various components and the overall system, as well as the subjectivity of the associated failure data. The literature on multistate system reliability covers various aspects, including maintenance prevention approaches, risk assessment, and reliability assessment [16]. However, this study focuses on surveillance test intervals and introduces a multistate continuous-time Markov method to model various test and repair policies for components with changing technical specifications [17]. This approach addresses the limitations of Probabilistic Safety Assessment (PSA) methods and the problem of modeling maintenance strategies and component degradation using polymorphic Fault Tree Analysis (PFTA) [18]. In addition, this study proposed a new framework for assessing the degradation of safety barriers [19] in oil and gas systems using multistate Bayesian Networks [20]. A case study was conducted on preventive barriers against the release of flammable substances in oil and gas power plants. The results obtained demonstrate the ability of the model to accurately evaluate the functional performance of safety barriers. The findings highlight the effectiveness of the BN model in incorporating detailed health and failure probabilities of safety mechanisms into the complex operating conditions of oil and gas production facilities. These authors presented a model of a multistate warm standby system with preventive maintenance and an unspecified number of repairmen using the Markov Arrival Process (MAP) [21]. A multi-stage incomplete maintenance strategy for multistate systems with changing user requirements includes state-based maintenance and corrective maintenance activities at each stage of operation, as described by [22,23]. As a result, risk assessment and safety analysis of multistate maritime transportation systems, emphasizing the complexity and risks associated with human equipment and environmental factors, has been proposed by [24]. This proposed study [25] focuses on assessing the reliability of multistate systems over time by fusing multiple sources of imprecise information. Therefore, as described in [26], the nonlinear dynamic model of a pair of spur gears with multistate meshing considers the effect of system parameters on the safety tanks. Furthermore, the authors of [27] discussed multistate risk-based maintenance analysis of redundant safety systems using Markov models and fault tree analysis to evaluate the risk criterion for nuclear power plant safety systems. In addition, in this study [28], a dynamic evidence network model combining Dempster–Shafer theory and a dynamic Bayesian network was applied to the reliability of multistate systems in order to evaluate the availability of complex systems.
The fuzzy fault tree analysis (FFTA) is currently used as a common approach in reliability analysis and has attracted attention in the field of safety and risk analysis. Fault tree analysis (FTA) is a widely used method for analyzing the causes of failures in engineering systems and evaluating their safety and reliability [29,30]. Recent studies have proposed fuzzy fault tree analysis (FFTA) as an approach to address uncertainty in failure mechanisms and system reliability assessment. Therefore, based on fuzzy set theory and fuzzy fault tree, a fuzzy fault tree reliability evaluation model was created to describe the probability and degree of failure using fuzzy numbers [31]. Expert opinions play a vital role in the evaluation of system reliability [32]. In [33], fuzzy set theory (FST) was used to determine relative probabilities in assessing the reliability of fire alarm systems. In [34], a new approach using intuitionistic fuzzy fault tree analysis was proposed to evaluate the probability of system failure based on qualitative data on system component failures. Therefore, Fuzzy Probability Fault Tree Analysis (FPFTA) was introduced to address the uncertainty in the reliability assessment of the underlying events [35]. In addition, this study [36] uses a hybrid fuzzy FTA-AHP method to address ambiguity and sub-objectivity in determining criteria weights, focusing on risk decision-making in work system emergency response.
Other researchers [36] have proposed the improved Fuzzy Analytic Hierarchy Process (IFAHP) for failure analysis of ship power systems, emphasizing the need for a more advanced methodology in risk assessment. The purpose of this approach was to improve upon the traditional Analytic Hierarchy Process (AHP) by incorporating a fuzzy consistency assessment matrix and unification methods. A new methodology applied to transformer fault diagnosis models that integrates fault tree analysis and fuzzy set theory [37] highlights the potential of FFTA in transformer fault diagnosis. As described in [38], the usefulness of fuzzy set theory and the Analytic Hierarchy Process in probabilistic risk assessment, especially failure probability analysis, is emphasized. Furthermore, the authors of [39] extended FFTA by considering common cause failures and component dependencies to improve risk management. Overall, the integration of FFTA with methods such as AHP, fuzzy set theory, and Bayesian networks has shown promise in risk assessment, failure probability analysis, and decision-making processes in various industries. Therefore, the objective of this study focuses on the reliability analysis of multistate systems using fuzzy failure rates in fault tree analysis [40]. As a result, this approach solves the problem of evaluating system reliability when component and element data are unknown and provides a quantitative method of analyzing fault trees in the presence of uncertainty. Overall, the integration of fuzzy logic, possibility theory, and probabilistic methods into fault tree analysis provides a promising approach to reliability assessment in complex systems.
Evaluating costs, benefits, and safety in multistate reliability analysis is essential for complex systems [41]. Understanding degradation processes in the chemical industry is essential for failure prevention and loss prevention. Multistate models provide accurate modeling of the state distribution of a system, especially for systems operating at different performance levels. Calculating the reliability of multistate systems is challenging, but significant improvements to existing methods can improve efficiency and complexity. By integrating these findings, a comprehensive multistate reliability assessment framework can effectively evaluate system reliability; account for uncertainty and degradation at different performance levels; and inform the assessment of the costs, benefits, and safety of complex systems. In this context, a new multistate reliability assessment framework integrating fault tree analysis and Bayesian network has been developed to improve the cost–benefit assessment of complex equipment systems with uncertain data [42]. As a result, a new cost-effective method merges for evaluating the reliability of multistate flow networks [43,44] using multistate binary compared to existing algorithms [45].
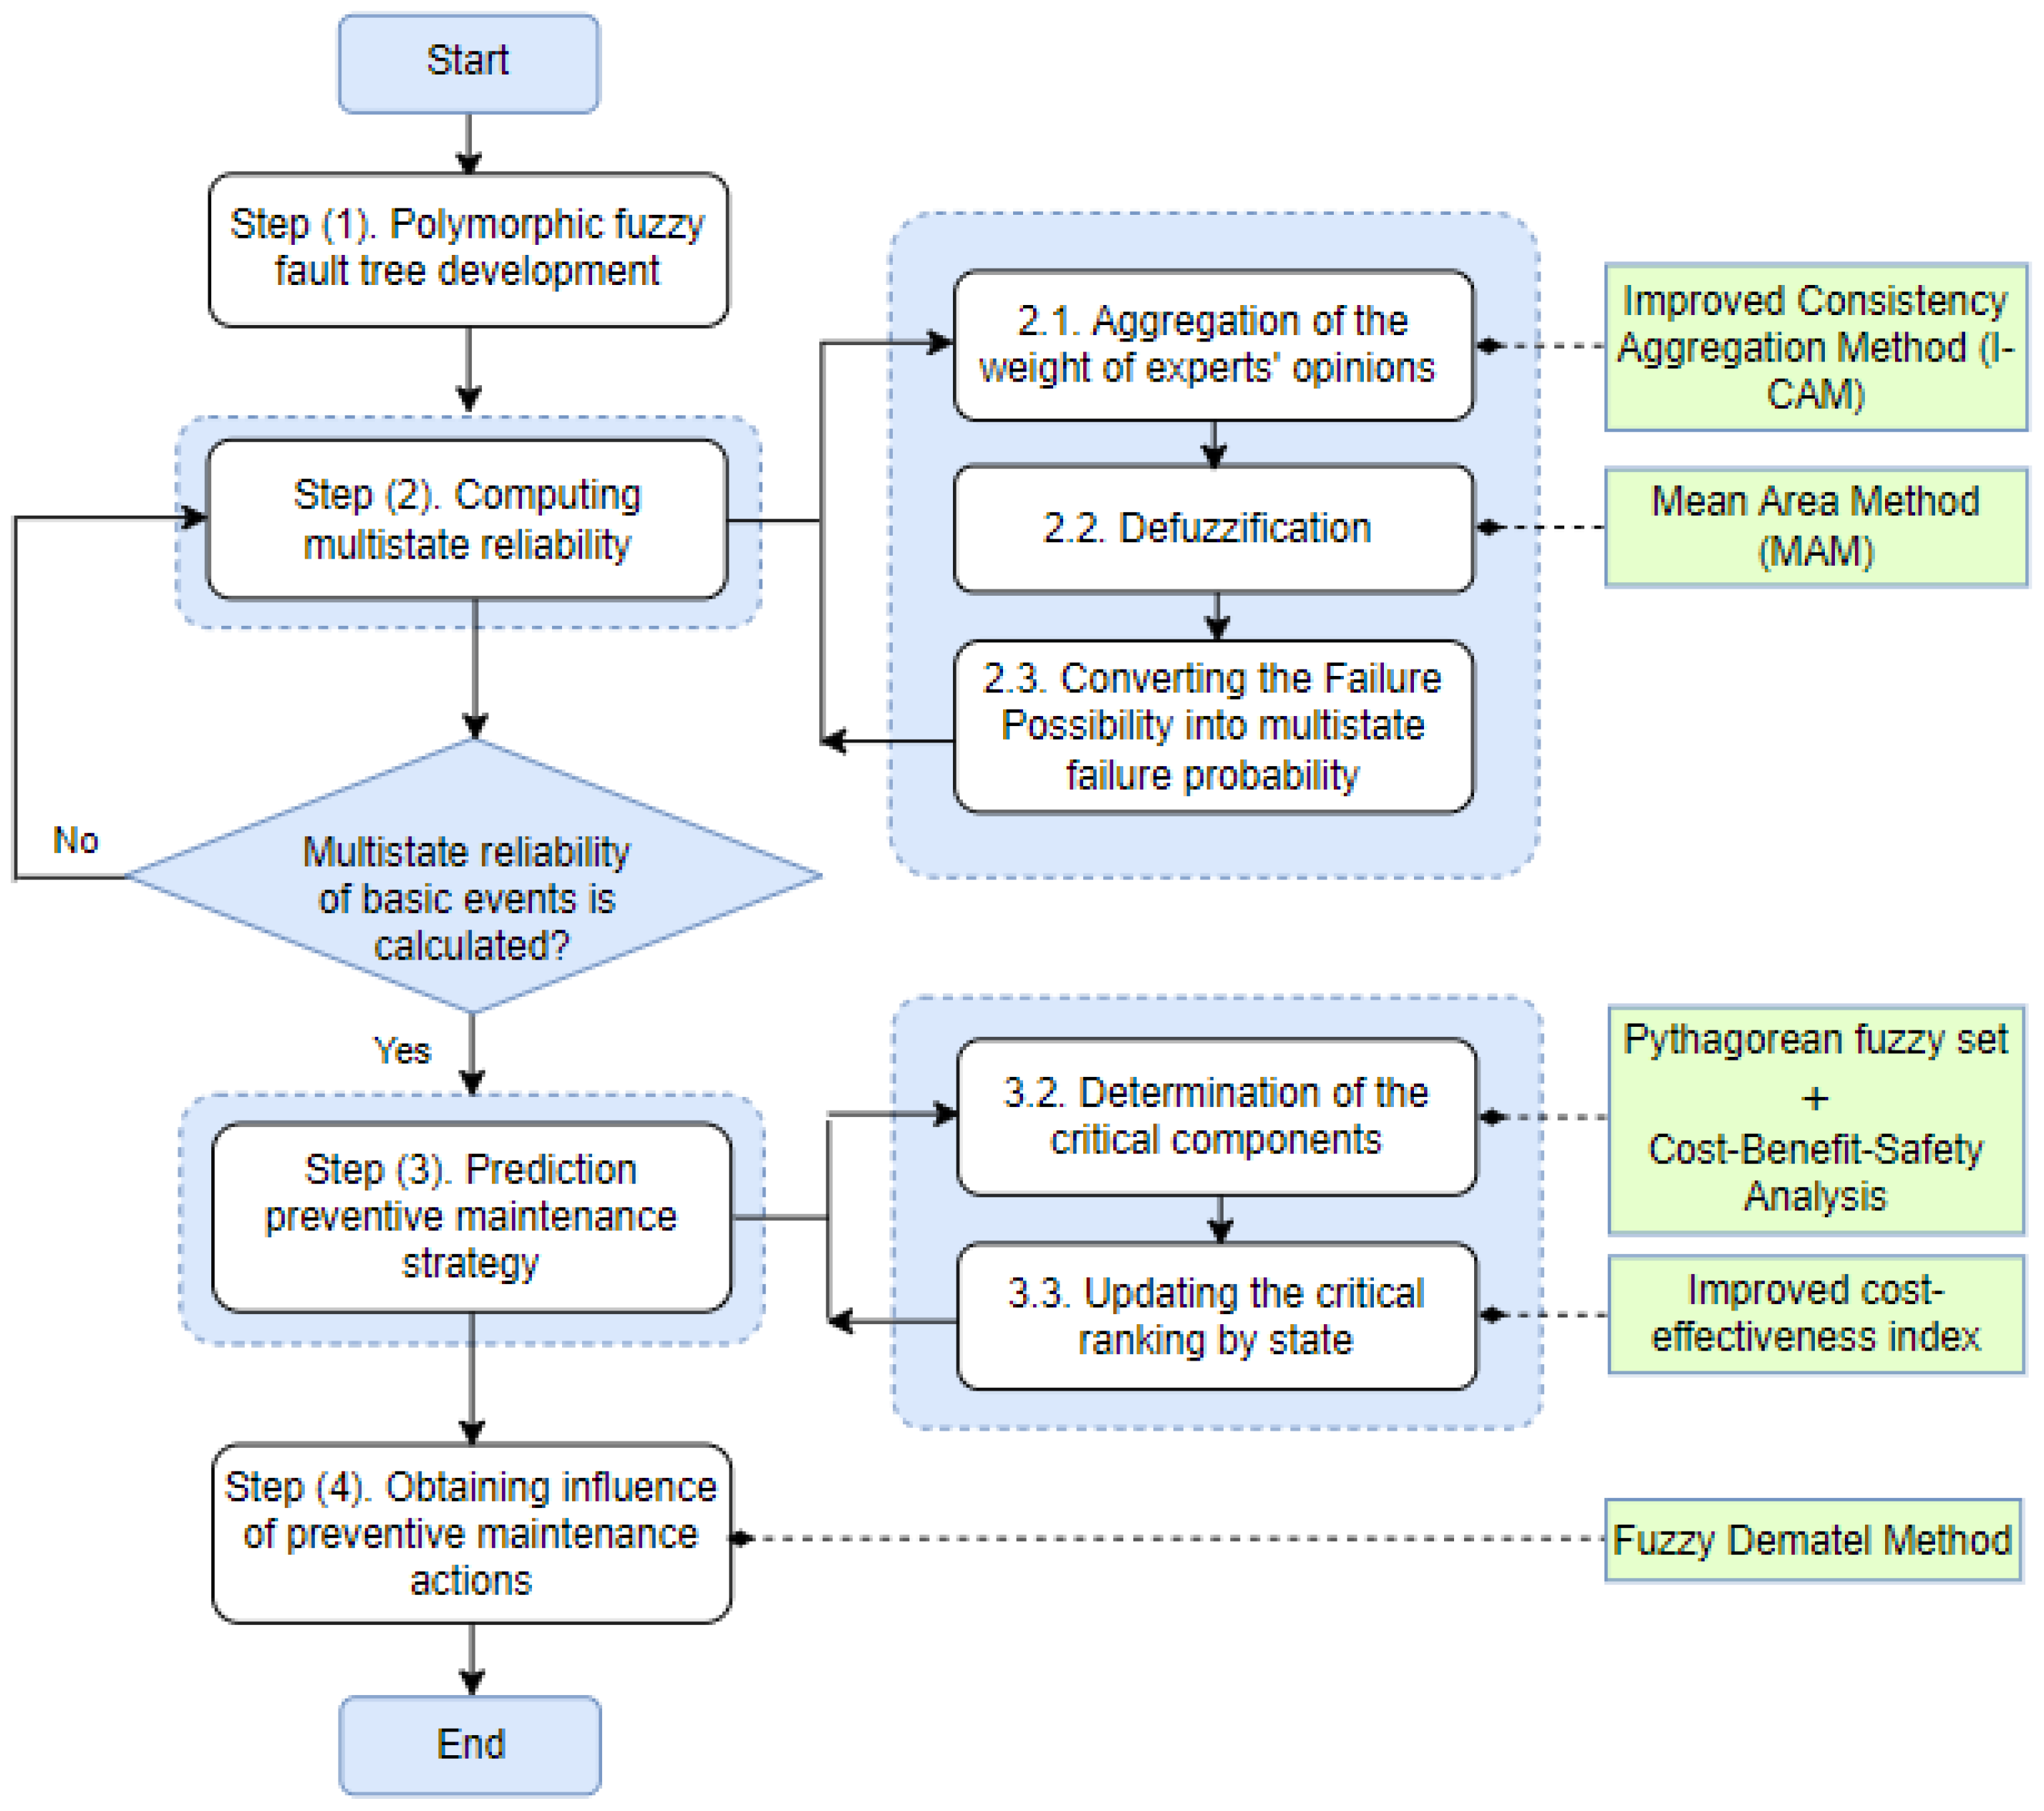
The main contributions of this paper are as follows: (1). The objective of this study is to propose a new framework integrating PFFTA, an improved consistency aggregation method, Pythagorean fuzzy cost–benefit–safety analysis, and fuzzy Dematel method for the prediction of preventive maintenance strategies related to firewater systems for Hydrogen storage tanks. (2). This framework uses an I-CAM that assigns expert weights using trapezoidal fuzzy numbers to reduce expert subjectivity and aggregate expert opinions. The combination of PFFTA and I-CAM can be used to estimate the MFP of the basic events in the three states by using an improved Onisawa formula [46]. (3). It is also difficult to quantify the minimum cut set (MCS) in PFFTA and determine the critical components for selecting a preventive maintenance strategy. To address this issue, preventive maintenance strategy prediction has been used to identify the most critical components and critical states of the firewater system. Preventive maintenance strategy prediction is based on the Pythagorean fuzzy cost–benefit–safety analysis. The Pythagorean fuzzy set can reduce the subjectivity associated with expert opinion. The fuzzy Dematel method can evaluate influence and select the best proposed preventive maintenance actions on the critical basic events. To demonstrate the effectiveness of the proposed methodology, a case study of a firewater system associated with a Hydrogen storage tank in an Algerian electricity power plant is presented.
Following the introduction in Section 1, the remainder of this paper is organized as follows. Section 2 presents the preliminaries of this study. Section 3 presents the proposed framework. Section 4 presents the case study of a firewater system installed at a Hydrogen storage facility in Algeria. Section 5 presents the results of the discussion. Section 6 presents the conclusion of this work.

2. Preliminaries

2.1. Pythagorean Fuzzy Set (PFS)

Pythagorean fuzzy sets (PFSs) have emerged as a new extension of intuitionistic fuzzy sets (IFSs), providing a more flexible way to handle uncertain information in decision-making processes. The development of novel operational laws for PFSs has been discussed, highlighting their desirable properties for multicriteria decision-making problems [47]. Hence, the authors of [48] presented PFSs to overcome this shortcoming. These types of sets are the generalized form of the IFSs, which can better deal with the uncertainty of the expert elicitation procedure. This approach allows PFS to possess much more flexibility to solve uncertain types of problems. The authors of [49] presented three basic concepts to develop Pythagorean membership grades.
Let us assume that a set X is a universe of discourse, and P is an object:
P = x ,   P ( μ P x ,       v P x ) | x X
where the function μ P : X 0 ,   1 specifies the membership degree and μ P : X 0 ,   1 denotes the non-membership degree of the x X to P , respectively, and for every x X , it retains that
( μ P x 2 + v P x 2 ) 2 1
For any PFS, P , and x X , π P x = 1 μ P 2 x v P 2 ( x ) is the degree of indeterminacy or hesitancy of x to P . To simplify the concept, P ( μ P x ,   v P x ) is called a Pythagorean Fuzzy Number (PFN) defined by
β = P ( μ P , v P ) ,   μ P   and   v P 0 , 1 ,   π β = 1 μ β 2 v β 2 ,   and   μ β 2 + v β 2 1 .
Some recent operations for PFNs are defined below based on the relationship between IFNs and PFNs given by the following Equations (3)–(6).
β 1 + β 2 = P ( μ β 1 2 + μ β 2 2 μ β 1 2 μ β 2 2     ,   v β 1 v β 2 )
β 1 + β 2 = P ( μ β 1 μ β 2 ,   v β 1 2 + v β 2 2 v β 1 2 v β 2 2     )
γ β = P 1 1 μ β 2 γ ,   v β γ ,   γ 0
β γ = P ( ( μ β ) γ ,   1 ( 1 v β 2 ) γ ,   γ 0

2.2. Polymorphic Fuzzy Fault Tree Analysis

The traditional FTA can be categorized into qualitative analysis and quantitative analysis based on its purpose [50]. Qualitative analysis in FTA aims to identify potential failure paths that result in the top event and pinpoint the weakest link in the system. It is assumed in FTA that each bottom event is independent of others and can only be in one of two states: occurring or not occurring. The analysis focuses on determining the minimum cut sets (MCSs) of the fault tree, where each M C S represents a combination of basic events that could lead to the top event. The presence of multiple M C S s indicates a higher level of risk for the system [51]. Consequently, quantitative analysis in FTA involves calculating the probability of the top event occurring if the failure probabilities of the basic events ( F P B E ) are known. Equations (7) and (8) serve as the fundamental computational formulas for FTA. Additionally, quantitative analysis can determine the importance of each bottom event, reflecting the extent of influence various parts or failure causes have on the occurrence of the top event.
F P o r = 1 i = 1 n ( 1 F P i )
F P a n d = i = 1 n F P i
The PFFTA is a powerful tool that can be effectively used to evaluate the multistate reliability of a system. Consequently, it is necessary to present the theory of multistate degradation used with FTA. Moreover, polymorphic events refer to the occurrence of multiple faults or errors that can manifest in various forms, leading to different failure modes within a logic gate.
X i ( i = 1 ,   2 ,   , n ) , with n being the polymorphic input events—that is, the input event satisfies S X i 0 ,   0.5 ,   1 , S X i (the normal state, degradation state, and failure state). Indeed, the top event U conforms to Equation (9):
S U = 0 ,                                                             i = 1 n S X i = 0 0.5 ,       S X i 0.5   a n d   i = 1 n S X i 0 1                                                                         O t h e r s
Equation (9) shows that the state of the output events is also normal for the normal input polymorphic events. Consequently, when the state of the input polymorphic events is in a degradation state or a combination of normal and degradation, the output events are also in a degradation state. When at least one input polymorphic event fails, the system fails.
System reliability characterizes the ability of a system or device to perform a required function under specified conditions during a specified time interval between zero and one. In our study, the time factor is not considered. The reliability of the system is determined by the following mathematical Equation (10).
R t = 1 M F P
where R ( t ) is the multistate reliability, and M F P is the multistate failure probability.

3. Proposed Model

3.1. General Framework

The proposed methodology is mainly used to evaluate the multistate failure probability of firewater systems, which consists of four steps.
(1). The construction of the PFFTA. In this study, three states are presented (the normal state, degradation state, and failure state). (2). Evaluate the multistate reliability of the firewater system. This step is composed of sub-steps. (2.1). The aggregation of experts’ opinions via the improved consistency aggregation method (I-CAM). (2.2). The defuzzification process by using the mean area method (MAM). (2.3). Converting failure possibility (FP) into multistate failure probability (MFP). (3). A prediction preventive maintenance strategy. This step is composed of sub-steps. (3.1). Determination of the critical components and critical states based on the Pythagorean fuzzy cost–benefit–safety analysis. (3.2). Select and update the critical ranking by using the improved cost-effectiveness index for the proposed preventive maintenance strategy. (4). Obtaining influence of proposed preventive maintenance actions based on the fuzzy Dematel method. The general methodology proposed is shown in the Figure 1. The specific proposed methodology is described in Section 3.2, Section 3.3 and Section 3.4.

3.2. Computing the Multistate Reliability

This step is focused on evaluating the multistate reliability of the process systems based on the PFFTA and an improved consistency aggregation method (I-CAM).

3.2.1. Aggregation of the Weight of Experts’ Opinions

In this study, it is necessary to determine the multistate failure probability (MFP) of basic events while considering of the linguistic terms expressed by the experts. The linguistic terms, representing the probability of a basic event, were proposed for three states (the normal state, degradation state, and failure state) scaled at seven levels: very low (VL), low (L), mildly low (ML), medium (M), mildly high (MH), high (H), and very high (VH). In this way, it was possible to obtain the corresponding fuzzy number for each linguistic term for the three states of the multistate system. Furthermore, it is necessary to aggregate the subjective weight opinions of experts on the identified basic events into a single opinion. Different techniques for aggregating expert opinions are available in the literature, such as sum-product, max product, similarity aggregation method, and improved dependent uncertain ordered weighted average operator. Consequently, our original contribution is to use an improved consistency aggregation method for three states. Hence, these three states’ linguistic terms of trapezoidal fuzzy number R ~ are presented in Table 1, Table 2 and Table 3.
(1)
The first step is to compute the similarity degree S ( R ~ i , R ~ j ) of opinions between each pair of experts. The opinions of experts E i and E j correspond to the trapezoidal fuzzy numbers given in Table 2 of A ~ i = ( a 1 ,   a 2 ,   a 3 ,   a 4 ) and B ~ j = ( b 1 ,   b 3 ,   b 3 ,   b 4 ) . The similarity aggregation of S ( A ~ i , B ~ j ) is given by Equation (11):
S A ~ i , B ~ j = 1 1 4 k = 1 4 a k b k
The function S A ~ i , B ~ j , which yields a value between 0 and 1, serves as the similarity measure for comparing two standard intuitionistic fuzzy numbers A ~ i and B ~ j . The variables E V i and E V j represent the expectancy evaluation of A ~ i and B ~ j , respectively.
S A ~ i , B ~ j = E V i E V j ,                 I f   E V i E V j E V j E V i ,                 I f   E V j E V i
The similarity matrix for a total of n experts is formally defined as
S M = 1 S 12     S 1 n S 21 S 22     S 2 n . . . S i 1 S i 2   S i n S n 1 a ~ ~ n 2   1
(2)
The second step is to calculate the distance D A ~ i , B ~ j between each pair of experts using Equations (14) and (15).
d A ~ i ,   B ~ j = 1 4 × a 1 b 1 + a 2 b 2 + a 3 b 3 + a 4 b 4
D A ~ i , B ~ j = d A ~ i , B ~ j i = 1 j = 1 n d A ~ i , B ~ j
where d A ~ i , B ~ j is the distance between A ~ i and B ~ j .
(3)
Given β 0 ,   1 , calculate the consistency degree r ( A ~ i ,   B ~ j ) between each pair of experts by Equation (16).
r A ~ i ,   B ~ j = β × S A ~ i , B ~ j + ( 1 β ) × ( 1 d A ~ i ,   B ~ j )
where the value of β needs to be predetermined by the decision makers according to their preferences, and β = 0.5 is chosen in this paper.
(4)
Calculate the weighted consistency degree C ( E i ) of each expert E i using Equation (17).
C E i = j = 1 n r A ~ i ,   B ~ j × w k
where r A ~ i ,   B ~ j is the consistency degree, and w k is the weight of each expert ( k = 1 , 2 , , i ) .
(5)
Calculate the aggregation weight w E i of each expert using Equation (18).
w E i = C E i j = 1 n C E j
(6)
Aggregate each fuzzy opinion into a group fuzzy opinion using Equation (19).
A R ~ = i = 1 n w E i × R ~ i

3.2.2. Defuzzification

Defuzzification aims to convert the overall trapezoidal or triangular fuzzy number into the failure possibility ( F P ) after its aggregation. Various techniques are commonly used for defuzzification, such as the fuzzy maximizing and minimizing sets [52], mean of maxima (MOM), the center of the area (CoA), and the α -weighted valuation. In this study, the mean area method (MAM) [53] defuzzification technique is employed.
R ~ = ( r 1 ,   r 2 ,   r 3 , r 4 )   and R ~ = ( r 1 ,   r 2 ,   r 3 )   is a standard trapezoidal and triangular fuzzy number respectively, and its membership functions are proposed as follows [54]:
μ R ~ x = 0 ,                                     x < r 1   x r 1 r 2 r 1 ,         r 1 x r 2 1 ,                               r 2 x r 3 x r 4 r 3 r 4 ,           r 3 x r 4 0 ,                                   x r 4 ,                 μ R ~ x = 0 ,                                     x < r 1 x r 1 r 2 r 1 ,         r 1 x r 2 r 3 x r 3 r 2 ,           r 2 x r 3 0 ,                                   x > r 3
The defuzzification process of trapezoidal fuzzy numbers respectively can be described in Equations (21) and (22):
F P = r 1 + 2 r 2 + 2 r 3 + r 4 4
F P = r 1 + 2 r 2 + r 3 4

3.2.3. Converting the Failure Possibility into Multistate Failure Probability

Combined with the process of defuzzification, this step is to convert the failure possibility ( F P ) obtained from the defuzzification process into the corresponding multistate failure probability ( M F P ) . The conversion method proposed by [55] is widely used in many research and uses the possibility score concept, but it is not suitable here due to the definition of fuzzy numbers of linguistic probability scales. Therefore, a modified formula Onisawa based on the fuzzy possibility concept is proposed in this study. The improved formula Onisawa is reliable in the failure probability values. In this way, the corresponding relationship between F P and M F P is illustrated by Equations (23) and (24):
F P = 1 10 k
k = 1 3 × ( C F P × 10 14 )
where k is a constant value, F P is the failure possibility, and M F P is the multistate failure probability for each basic event.

3.3. Prediction Preventive Maintenance Strategy

Component importance measurement is a tool for evaluating and ranking the impact of a component’s state on the overall system to select the perfect preventive maintenance strategy. In our work, we focused on determining the most critical basic events and the most critical states of the process systems based on a triptych cost–benefit safety analysis.
This step is decomposed into two sub-steps. The first sub-step on determining the most critical basic event based on the Pythagorean fuzzy set (PFS) and a triptych cost–benefit–safety analysis and sum-product method (SPM). The second sub-step is interested in updating the critical ranking by using the improved cost-effectiveness index.

3.3.1. Triptych Cost–Benefit–Safety Analysis

Several researchers have applied this technique to propose a new framework for effective safety management decision making based on an improved Dematel method and a cost–benefit approach [56]. Component importance measures are tools for assessing and ranking the impact of a component’s state on the overall system. In recent years, some studies have successfully applied the cost–benefit to the safety process associated with LPG storage tanks. In addition, some researchers have focused on the development of subjective safety analysis by incorporating fuzzy set theory, evidential reasoning theory [57], and expert opinions to handle the uncertainty in safety measures. Consequently, our original contribution is to propose a triptych cost–benefit–safety analysis for determining the most critical basic event and the most critical states in the firewater system. This new approach is based on the Pythagorean fuzzy set and expert opinion using the sum-product method (SPM). The Pythagorean fuzzy set is used to handle the subjectivity issues associated with expert opinions, while the sum-product method allows for evaluating the weight of expert opinions.
Therefore, the author proposed introducing a subsequent weighted averaging aggregation operator to aggregate PFNs [49].
Let β j = P ( μ β 1 , v β 1 ) , j = ( 1 , 2 , , n ) be a set of PFNs (Table 4), and w = ( w 1 , w 2 , , n ) T is the weight vector of β j , while w j 0 shows the importance degree of β j , satisfying w j 0 , j = 1 n w j = 1 , and Pythagorean fuzzy weighted averaging (PFWA): n :
P F W A = β 1 ,   β 2 ,   , β n = ( j = 1 n w j μ β j ,   j = 1 n w j v β j )
However, the main drawbacks of P F W A are that employing importance levels does not provide enough precision to be used in further calculation steps and that assigning different weights can reduce the effect of unreasonably large deviation on the aggregate results.
Expert opinions are aggregated using the Pythagorean fuzzy aggregated weighted average perator for any factor, F i = i = 1 ,   2 ,   , m .
α i j = P F A W A α i j 1 ,   α i j 2 , , α i j n = k = 1 n W F α i j k
α i j = 1 k = 1 n ( 1 ( μ i j k ) 2 ) W F , k = 1 n ( v i j k ) W F  
where α i j is the ultimate aggregated subjective viewpoint in terms of PFN, and α i j k = ( μ i j k ,   v i j k ) is the PFN that is moved by the related linguistic conditions based on the opinion of experts k , ( k = 1 ,   2 ,   , n ) . W F is the weight given to each expert according to a typical weighting method, which shows the significance of decision-making opinion on probability estimation, satisfying W F > 0 , ( k = 1 ,   2 , , n ) .
So, the cost, benefit, and safety analysis of the basic events was determined by using the Pythagorean fuzzy number and weight factor ( W F ) . The expert weight factor ( W F ) was calculated based on the organizational title, work experience, and education level, as illustrated in Table 5. The weight factor ( W F ) is given by Equation (28).
W F = W S i i = 1 n W S i ,   i = 1 , 2 , , n
where W F is the weight factor, and W S i is the weight score of each expert.

3.3.2. Computing an Improved Cost-Effectiveness Index

Once, the cost, benefit, and safety of each basic event are obtained, the output needs to be aggregated with the related risk reduction to offer a general evaluation of the safety measures related to the LPG storage tanks. Many indices can convey the effectiveness of a basic event.
It should be noted that ∆R (Equation (29)) is not calculated as the result of probability and consequence, because it is measured by the value calculated from the failure probability of failure of each basic event. The linguistic scale is given in Table 6 proposed by [56], including the fatalities y e a r 1 .
R = F P × C
where
R is risk measure (fatalities / y e a r 1 ) ,   F P is the failure probability of each basic event, and C is the failure consequence (fatalities/ y e a r 1 ) .
Table 6. Fatalities scale.
RowSeverityEffect on Human SafetyEquivalent Fatalities
1MinorSingle/minor injuries0.01
2SignificantMultiple/severe injuries0.1
3SevereSingle fatality/multiple severe injuries1
4CatastrophicMultiple fatalities10
Several researchers have successfully proposed a cost-effectiveness index based on the cost–benefit analysis [56]. Consequently, our original contribution is to propose an improved cost-effectiveness index based on the triptych cost–benefit–safety analysis. In our study, the improved cost-effectiveness index ( I N C A F ) is explained in Equation (30)
I N C A F = C B S R
where C is the cost of basic events ( B E s ) , and B is the economic benefit of the improved multistate reliability of the basic events. S is the measure of effectiveness of the improved multistate reliability of the basic events, and R is the risk of the basic events.
Here, two cases condition the improvement in the multistate reliability:
-
If I N C A F > 0.200 ,   1 , this means that the component of the basic events does not require the improvement in their multistate reliability.
-
If I N C A F < 0 ,   0.200 , this means that the component of the basic events requires improvement in their multistate reliability.

3.4. Obtaining Influence of Preventive Maintenance Actions

Once the most critical components have been selected, preventive maintenance actions must be identified. In this step, we are focus on the use of fuzzy Dematel to have influence on preventive maintenance actions for basic events in all states.
The Dematel method analyzes the logical relationship of elements of a complex system and studies the matrix of direct influence [57]. The aforementioned influence matrix includes the influence of two factors on each other in the system. In addition, the Dematel method can determine if the factor is cause or effect and does not require great information that proposes significant criteria that influence other criteria. The structure of the Dematel method and the associated calculation steps are as follows:
(1)
Design the fuzzy linguistic scale. After identifying the preventive maintenance actions in the previous step, the questionnaire was prepared and sent to the experts. The expert opinion was determined according to the linguistic expression shown in Table 7 using five linguistic terms ranging from “no influence” to “very strong influence” with corresponding triangular fuzzy numbers ( l i j ,   m i j ,   u i j ) .
(2)
Calculate the fuzzy direct influence matrix. To determine the internal relationships between the preventive maintenance actions that influence the multistate reliability of basic events, experts are invited to perform pairwise comparisons between the preventive maintenance actions that influence the multistate reliability of basic events taking into account the effect of the preventive maintenance action i of the row on the preventive maintenance action j of the matrix column.
Then, using the simple fuzzy averaging method to incorporate the expert opinion, the fuzzy direct correlation A ~ is formed.
A ~ = X ~ i j n × n
If there are several experts and each element of the fuzzy direct matrix is represented by X ~ i j calculated as follows:
X ~ i j = l i j n ,   m i j n ,   u i j n  
(3)
Normalized the fuzzy direct influence matrix. To normalize the values, u i j of each row must be calculated by dividing the elements of the matrix X ~ i j by the maximum values of u i j the fuzzy normal matrix N ~ be calculated.
k = j = 1 n u i j
N ~ = 1 k × X ~ i j
N ~ = e ~ i j n × n
where e ~ i j = e i j l , e i j m , e i j u .
(4)
Get the total fuzzy influence matrix T . To calculate the total relation, we first create an n × n homogeneous matrix. The normal matrix is multiplied by the resulting matrix to obtain the total fuzzy matrix T .
T = X ~ i j × ( I X ~ i j ) 1
where I is denoted as the identify matrix.
To produce the causal diagram, R , and D that are the summation of columns and rows respectively, are examined by following Equations (37)–(39).
T ~ = t ~ i j n × n
where t ~ i j = t i j l , t i j m , t i j u , i , j = 1 , 2 , , n
R = i = 1 n t i j 1 × n = t j 1 × n
D = i = 1 n t i j n × 1 = t i n × 1
(5)
Construct a cause and effect diagram. At this step, the importance of the risk influence ( R + D ) and the relationship between them ( R D ) are plotted. If the ( R D ) value is higher, the factor belongs to the cause group, and if the value of ( R D ) is lower, then it belongs to the effect group.

4. Application for Prediction Maintenance Strategy of the Firewater Systems

In this section, the effectiveness and feasibility of the proposed method are demonstrated using the example of a firewater system. Figure 2 illustrates the Hydrogen production and storage tanks process. First, in Algeria, several researchers have successfully applied the safety barriers to reduce gas explosions in the petrochemical industry with firewater systems associated with Hydrogen storage tanks. However, these works did not take into account the prediction preventive maintenance strategy based on the PFFTA, an I-CAM, and Pythagorean fuzzy cost–benefit–safety analysis [58]. In addition, the operations of Hydrogen production are composed of (1). Demineralized water comes from the water treatment then it gets stored in the demineralized water storage tank. (2). The generator is fueled by its inputs that produce Hydrogen and oxygen. (3). The produced O2 is vented out in the atmosphere, and the H2 is stored temporarily in the Hydrogen gas buffer storage tank. (4). H2 stored in the Hydrogen gas buffer storage tank is then compressed into a cylinder rack until they are full at the pressure of 160 bar.
Figure 3 show that the firewater system of the hydrogen production plant. It is necessary to carry out a risk analysis on the Hydrogen storage plant, due to the nature of hydrogen. The results of the HAZOP analysis, showing a fire hydrogen as the initiating event with a probability value as high as 3.632 × 10⁻⁵ highlights the significant risks in the operation of Hydrogen storage facilities. A fire Hydrogen can have serious consequences, including immediate ignition, delayed ignition, or explosion, leading to potential facility damage, injury to personnel, and environmental impact. The high probability values indicate that the likelihood of a fire Hydrogen occurring as the initiating event is relatively low but still exists. Furthermore, operators of Hydrogen storage facilities must take this risk seriously and implement robust safety measures to prevent such incidents and mitigate failure. In this context, the firewater systems must be reliable and effective over a long time to limit the severity of damage in fire accidents associated with Hydrogen storage tanks. As a result, maintenance strategy prediction based on the cost–benefit–safety analysis is necessary to determine the most critical basic event and the critical state of the firewater system.

4.1. Polymorphic Fuzzy Fault Tree Development

A PFFTA was developed to determine the adequacy and effectiveness of the proposed method as applied to the firewater system. Any complex system can be characterized by multiple states (normal state, degradation state, and failure state). In this study, the firewater systems are characterized by three states (normal state, degradation state, and failure state). The PFFTA was conducted after understanding the firewater system and interviewing several experts in the Hydrogen storage tanks. The adaptive polymorphic fault tree analysis in Figure 4 consists of 9 intermediate events and 15 basic events. These firewater system components are shown in Table 8, and the logical relationships between the basic events are represented by logical symbols using “And” and “Or” gates. Furthermore, these intermediate events contribute directly to the top event (firewater system failure) and are connected by the “Or” gate.
In this study, a group of four experts was formed to estimate the multistate failure probabilities of basic events based on the linguistic terms presented in Table 1, Table 2 and Table 3.

4.2. Computing the Multistate Reliability

In this study, four experts ( E 1 ,   E 2 ,   E 3 , a n d   E 4 ) were created to estimate the multistate failure probability of the basic events of the three states. Therefore, the improved consistency aggregation method (I-CAM) was performed using the 15 quantitative data obtained from the four experts. As an example, the judgment experts of the basic event x 1 in the normal state are very high (0.35, 0.40, 0.45, 0.50), high (0.30, 0.35, 0.40, 0.45), high (0.30, 0.35, 0.40, 0.45), and high (0.30, 0.35, 0.40, 0.45) respectively. Therefore, the judgment experts of the basic event x 1 in the degradation state are very high (0.65, 0.70, 0.75, 0.80), high (0.60, 0.65, 0.70, 0.75), high (0.60, 0.65, 0.70, 0.75), and high (0.60, 0.65, 0.70, 0.75) respectively. Finally, the judgment experts of the basic event x 1 in the degradation state are very high (0.85, 0.90, 0.95, 1), high (0.83, 0.85, 0.90, 0.95), high (0.83, 0.85, 0.90, 0.95), and high (0.83, 0.85, 0.90, 0.95) respectively.
As an example, the aggregation of the weight of experts’ opinions using I-CAM is the calculation of the basic event ( x 1 ) in the normal state. The linguistic terms given by the four experts were, respectively, very high (0.35, 0.40, 0.45, 0.50), high (0.30, 0.35, 0.40, 0.45), high (0.30, 0.35, 0.40, 0.45), and high (0.30, 0.35, 0.40, 0.45). According to Equations (11)–(24), the multistate failure probability value corresponding to the basic event ( x 1 ) is 6.540 × 10⁻³. The multistate failure probabilities of the three states for the basic event are shown in Table 9.
Figure 5 shows the values of the multistate failure probabilities for the three states associated with the firewater systems.
Table 10 shows the multistate reliability values of the firewater system. The minimum multistate reliability values for the normal state are basic events x 1 (failure of the pressure sensor), x 5 (failure of jokey pump A), x 8 (failure at jokey pumps A/B), and x 12 (Failure of jokey pump B) with a multistate reliability value is 0.993. The minimum multistate reliability value for the degraded state is the basic events x 5 (failure of jokey pump A) with multistate reliability values at 0.969. Finally, the minimum multistate reliability value for the firewater system in the failure state is the basic event x 5 (failure of jokey pump A), x 8 (failure at jokey pumps A/B), and x 12 (Failure of jokey pump B) with a multistate reliability value at 0.913, 0.911, and 0.913 respectively. According to the results obtained, the basic events common to the three states are x 5 and x 8 . In general, the most critical state for the basic events of a firewater system is the failure state.
Figure 6 shows the multistate reliability values for the normal state, degradation state, and failure state of the firewater system. The results show that the preventive maintenance strategy prediction for the firewater system is oriented toward basic event x 5 (failure of jokey pump A), x 8 (failure at jokey pumps A/B), and x 12 (Failure of jokey pump B), and further toward its failure state.

4.3. Preventive Maintenance Strategy Prediction

Once the multistate failure probability of the various states has been calculated, the most critical basic events need to be determined in order to predict preventive maintenance strategies for the firewater system. This requires a cost–benefit safety assessment. The cost–benefit–safety assessment selects the states for which preventive maintenance strategies are needed on a Pythagorean fuzzy set.
As an example, the cost–benefit–safety evaluation of the basic event ( x 1 ) in the normal state is shown below. Furthermore, based on Table 6, four experts were selected to estimate the weight score. Thus, the weight factor ( W F )   of four experts is 0.265. For the cost analysis, the linguistic terms given by the experts are very low (0.15, 0.85), those for the benefit analysis are very high (0.85, 0.15), and those for the safety analysis are moderately high (0.65, 0.35). According to the cost analysis and Equation (27), the Pythagorean fuzzy number for the cost, benefit, and safety analysis are α x 1 C o s t = ( 0.537 ,   0.605 ) , α x 1 B e n e f i t = ( 0.537 ,   0.605 ) , and α x 1 S a f e t y = ( 0.368 ,   0.757 ) . According to Equation (28), the Pythagorean fuzzy aggregated weighted averaging of the cost, benefit, and safety analysis are 0.466, 0.470, and 0.305 respectively.
Once, the cost, benefit, and safety analysis for the basic event ( x 1 ) in the normal state is obtained, and according to Equation (29), the risk value ( R ) associated with the fatalities scale ( C = 1 ) is 6.54 × 10⁻³. Furthermore, according to Equation (30), the cost-effectiveness index ( I N C A F ) for the basic event ( x 1 ) in the normal state is 1.359. Table 11, Table 12 and Table 13 show the cost, benefit, safety analysis, and risk measures for the basic events.
Table 14 shows the improved cost-effectiveness index of the firewater system. The components of the basic events that require improvement in their multistate reliability ( I N C A F < 0 ,   0.200 ) in the normal state are x 1 ,   x 5 , x 8 , and x 12 with a I N C A F value is 0 (ranking 13), 0.160 (ranking 12), 0.161 (ranking 11), and 0 (ranking 13) respectively. The components of the basic events that require improvement in their multistate reliability ( I N C A F < 0 ,   0.200 ) in the degraded state are x 1 , x 5 , x 8 , and x 12 with a I N C A F value is 0.159 (ranking 13), 0.183 (ranking 12), 0.195 (ranking 11), and 0 (ranking 14) respectively. Finally, the components of the basic events that require improvement in their multistate reliability ( I N C A F < 0 ,   0.200 ) in the failure state are x 1 ,   x 5 , x 8 , and x 12 with a I N C A F value is 0.142 (ranking 11), 0.128 (ranking 12), 0.122 (ranking 13), and 0 (ranking 14) respectively.
According to the results obtained from Table 11, Table 12, Table 13 and Table 14, the components of the basic events that require improvement in their multistate reliability in the three states are x 1 ,   x 5 , x 8 , and x 12 . Therefore, it is necessary to propose preventive maintenance actions. Table 15 illustrates the preventive maintenance actions. In this context, the fuzzy Dematel method proposed to evaluate the influence of preventive maintenance actions of the critical basic events ( x 1 ,   x 5 , x 8 , and x 12 ) of the firewater system in the three states.
According to Equations (31) and (32), the opinions of each expert are obtained from a direct relation matrix, which is an analysis of the relationship between the basic events and the preventive maintenance actions (MA) proposed with a scale of five linguistic terms (Table 7).
The total relation matrix is then calculated using Equation (36). The (D + R) and (D − R) values are calculated by using Equations (37) and (38) represented in Table 16.

5. Results and Discussions

In order to reliably predict maintenance strategies for complex systems, it is essential to implement robust strategies that address key factors such as cost minimization benefit maximization, and optimal safety measures. Such preventive maintenance strategies should incorporate techniques such as multistate system reliability models, which allow for a comprehensive analysis of the system and its components at various performance levels. Furthermore, it is difficult to quantify the minimum cut set of the PFFTA to determine the most critical components.
For Hydrogen process facilities, it is important to predict preventive maintenance strategies for firewater systems based on cost–benefit–safety analysis. This preventive maintenance strategy aims to identify the most critical components and the critical states to control risks and prevent occupational accidents in the long term. However, the prediction of the preventive maintenance strategies is based on a Pythagorean cost–benefit–safety analysis and the fuzzy Dematel method. The cost–benefit–safety analysis consists of determining the components or basic events of the firewater system that are most important for maintenance strategy prediction. The fuzzy Dematel method is used to evaluate influence of the preventive maintenance actions of the critical basic events x 1 ,   x 5 , x 8 , and x 12 .
Figure 7 shows the ranking of the improved cost-effectiveness index. According to the results obtained, the basic event x 1 (failure of the pressure sensor), x 5 (failure of jokey pump A), x 8 (failure at jokey pumps A/B), and x 12 (Failure of jokey pump B) are the most critical component of the normal state, degraded state, and failure state, with an I N C A F value is 0.159, 0.183, 0.195, and 0 respectively. Based on the results in Table 13, the predicted maintenance strategy of the basic events x 1 is based on the reduction risk value is 7.930 × 10⁻¹ with least maintenance cost (0.466), the benefit maintenance action (0.470), and the maximum efficiency (0.470) of the proposed safety measures related to Hydrogen storage tanks.
Figure 8 shows the causal diagram of the influence capability of preventive maintenance actions and basic events in a normal state. The results show that the preventive maintenance actions MA1, MA2, MA3, MA4, and MA5 only affect the improvement of the multistate reliability of the basic events x1 and x 8 .
Figure 9 shows the causal diagram of the influence capability of preventive maintenance actions and basic events in a degraded state. The results show that the preventive maintenance actions MA1, MA2, MA3, MA7, and MA8 only affect the improvement of the multistate reliability of the basic events x1 and x 8 .
Figure 10 shows the causal diagram of the influence capability of preventive maintenance actions and basic events in a failure state. The results show that the all preventive maintenance actions affect the improvement of the multistate reliability of the critical basic events x 1 ,   x 5 , x 8 , and x 12 .
Therefore, the firewater system is critical to the economics of personnel, the environment, and the Hydrogen storage system when it is in a failure state. Based on the results in Table 13, the predicted maintenance strategy of the critical basic events with least maintenance cost, the benefit maintenance action, and the maximum efficiency of the proposed safety measures related to the firewater system. In conclusion, the best prediction of a preventive maintenance strategy to improve the multistate reliability of the critical basic events is that on the failure state.

6. Conclusions

This study proposes a new framework for predicting preventive maintenance strategies for the firewater system associated with hydrogen storage tanks [59]. The improvements in the proposed method over previous methods are as follows:
The proposed method combines a PFFTA method with an I-CAM to provide an alternative method for determining the multistate failure probability of basic events.
Some proposed methods apply the AHP method [60,61], which evaluates the weight of experts’ opinions combined with the similarity aggregation method (SAM), to evaluate the failure probability of the basic event or root node. In our study, an I-CAM was proposed to quantify the linguistic terms of the trapezoidal fuzzy number to estimate the objective weights of the experts’ opinions. Furthermore, this I-CAM was used to evaluate the multistate failure probability of basic events of the firewater system.
The I-CAM can effectively aggregate expert opinions on the multistate failure probability of basic events and reduce the uncertainty associated with subjectivity judgment.
The fuzzy Dematel method can used to evaluate the influence of the preventive maintenance actions on the critical basic events and to select the best preventive maintenance strategy in order to improve the multistate reliability.
Maintenance strategy prediction using fault tree analysis and cost–benefit evaluation has also been successfully applied by several researchers. In our study, it is difficult to quantify the minimum cut set (MCS) in the PFTA to determine the critical components for selecting a maintenance strategy. To address this issue, the selection of the most critical components is based on a triptych cost–benefit–safety analysis and an improved cost-effectiveness index. Pythagorean fuzzy cost–benefit–safety analysis always identifies the most critical components and the most critical states, reducing the uncertainty of subjective judgment. The results show that the most critical basic events are the basic events x 1 (failure of the pressure sensor), x 5 (failure of jokey pump A), x 8 (failure at jokey pumps A/B), and x 12 (Failure of jokey pump B), and its most critical state is the failure state. Therefore, in order to minimize the risk of fire Hydrogen accidents, it is necessary to apply a preventive maintenance strategy selected in the failure state that ensures regular the ten preventive maintenance actions proposed. This study provides a theoretical and practical framework for other companies seeking to improve the maintenance strategy of their systems and the safety of Hydrogen storage facilities.
This research also has its limitations. The minimum cut set can be evaluated by multistate fault tree analysis to assess the effects of the most critical basic events on the other components. Therefore, the development of a polymorphic Bayesian network (PBN) for dynamic firewater systems using deep learning combined with the Markov chain [62,63] is a topic for future research.

Author Contributions

S.D.: her contribution is the proposed methodology and redaction of the paper. F.I.: his contribution is the validation of this work. All authors have read and agreed to the published version of the manuscript.

Funding

This research received no external funding.

Data Availability Statement

Data is available when requested.

Conflicts of Interest

The authors declare that they have no known competing financial interests of personal relationships that could have appeared to influence the work reposted in this paper.

References

  1. Djemai, Z.; Aissani, N.; Bekrar, A.; Lounis, Z. Risk analysis of petroleum storage tank based on uncertain data incorporated into mapped Bow-tie to Bayesian network. Process Saf. Environ. Prot. 2024, 90, 1202–1221. [Google Scholar] [CrossRef]
  2. Pan, J.; Deng, Y.; Yang, Y.; Zhang, Y. Location-allocation modelling for rational health planning: Applying a two-step optimization approach to evaluate the spatial accessibility improvement of newly added tertiary hospitals in a metropolitan city of China. Soc. Sci. Med. 2023, 338, 116296. [Google Scholar] [CrossRef]
  3. Boudries, R.; Dizene, R. Potentialities of hydrogen production in Algeria. Int. J. Hydrog. Energy 2008, 33, 4476–4487. [Google Scholar] [CrossRef]
  4. Himarosa, R.; Hariyanto, S.; Hasan, W. Failure analysis of platen superheater tube, water wall tube, and sealpot plate: A case study from electricity power plant in indonesia. Eng. Fail. Anal. 2022, 135, 106108. [Google Scholar] [CrossRef]
  5. Portarapillo, M.; Di Benedetto, A. Risk assessment of the large-scale hydrogen storage in salt caverns. Energies 2021, 14, 2856. [Google Scholar]
  6. Soltanzadeh, A.; Zarei, E.; Mahdinia, M.; Sadeghi-Yarandi, M. An integrated approach to assess safety and security risks in chemical process industries. J. Loss Prev. Process Ind. 2024, 90, 105344. [Google Scholar] [CrossRef]
  7. Dormohammadi, A.; Zarei, E.; Delkhosh, M.B.; Gholami, A. Risk analysis by means of a QRA approach on a LPG cylinder filling installation. Process Saf. Prog. 2014, 33, 77–84. [Google Scholar] [CrossRef]
  8. Hwang, I.; Zhou, P.; Jeong, B.; Wang, H.; Jang, H.; Palliparambil, M.P. Establishing safety zones for ammonia bunkering operations: A quantitative risk assessment. In Advances in Maritime Technology and Engineering; CRC Press: Boca Raton, FL, UAS, 2024; pp. 281–286. [Google Scholar]
  9. Qi, S.; Shuai, J.; Shi, L.; Li, Y.; Zhou, L. Quantitative risk assessment of leakage accident of crude oil storage tank based on fuzzy Bayesian network and improved AHP. J. Loss Prev. Process Ind. 2024, 90, 105341. [Google Scholar] [CrossRef]
  10. Kuznetsov, G.; Kopylov, N.; Sushkina, E.; Zhdanova, A. Adaptation of fire-fighting systems to localization of fires in the premises. Energies 2022, 15, 522. [Google Scholar] [CrossRef]
  11. Iddir, O. Evolutions of the LOPA method to a fully quantified method. Process Saf. Prog. 2023, 42, 290–298. [Google Scholar] [CrossRef]
  12. Cameron, I.; Mannan, S.; Németh, E.; Park, S.; Pasman, H.; Rogers, W.; Seligmann, B. Process hazard analysis, hazard identification and scenario definition: Are the conventional tools sufficient, or should and can we do much better? Process Saf. Environ. Prot. 2017, 110, 53–70. [Google Scholar] [CrossRef]
  13. Zhang, C. Analysis of fire safety system for storage enterprises of dangerous chemicals. Procedia Eng. 2018, 211, 986–995. [Google Scholar] [CrossRef]
  14. Laal, F.; Pouyakian, M.; Jafari, M.J.; Nourai, F.; Hosseini, A.A.; Khanteymoori, A. Technical, human, and organizational factors affecting failures of firefighting systems (FSs) of atmospheric storage tanks: Providing a risk assessment approach using Fuzzy Bayesian Network (FBN) and content validity indicators. J. Loss Prev. Process Ind. 2020, 65, 104157. [Google Scholar] [CrossRef]
  15. Meshkat, L.; Dugan, B.J.; Andrews, J. Analysis of safety systems with on-demand and dynamic failure modes. In Proceedings of the Annual Reliability and Maintainability Symposium. 2000 Proceedings. International Symposium on Product Quality and Integrity (Cat. No. 00CH37055), Los Angeles, CA, USA, 24–27 January 2000; pp. 14–21. [Google Scholar]
  16. LI, Y.-F.; Ding, Y.; Zio, E. Random fuzzy extension of the universal generating function approach for the reliability assessment of multi-state systems under aleatory and epistemic uncertainties. Trans. Reliab. 2014, 63, 13–25. [Google Scholar] [CrossRef]
  17. Mohammadhasani, F.; Pirouzmand, A. Multi-state unavailability analysis of safety system redundant components with aging effect under surveillance testing. Prog. Nucl. Energy 2020, 126, 103415. [Google Scholar] [CrossRef]
  18. Zheng, W.; Jiang, H.; Li, S.; Ma, Q. Reliability Analysis of High-Voltage Drive Motor Systems in Terms of the Polymorphic Bayesian Network. Mathematics 2023, 11, 2378. [Google Scholar] [CrossRef]
  19. Dimaio, F.; Scapinello, O.; Zio, E.; Ciarapica, C.; Cincotta, S.; Crivellari, A.; Decarli, L.; Larosa, L. Accounting for safety barriers degradation in the risk assessment of oil and gas systems by multistate Bayesian networks. Reliab. Eng. Syst. Saf. 2021, 216, 107943. [Google Scholar] [CrossRef]
  20. Chen, Y.; Wen, J.; Tian, Y.; Zheng, S.; Zhong, Q.; Chai, X. Dynamic reliability assessment method for a pantograph system based on a multistate TS fault tree, dynamic Bayesian. Appl. Sci. 2023, 13, 10711. [Google Scholar] [CrossRef]
  21. Ruiz-Castro, J.E.; Dawabsha, M. A multi-state warm standby system with preventive maintenance, loss of units and an indeterminate multiple number of repairpersons. Comput. Ind. Eng. 2020, 142, 106348. [Google Scholar] [CrossRef]
  22. Dong, J.; Hu, J.; Zhao, Y.; Peng, Y. Opinion formation analysis for Expressed and Private Opinions (EPOs) models: Reasoning private opinions from behaviors in group decision-making systems. Expert Syst. Appl. 2024, 236, 121292. [Google Scholar] [CrossRef]
  23. He, B.; Yin, L. Prediction modelling of cold chain logistics demand based on data mining algorithm. Math. Probl. Eng. 2021, 2021, 3421478. [Google Scholar] [CrossRef]
  24. Wang, S.; Yin, J.; Khan, R.U. The multi-state maritime transportation system risk assessment and safety analysis. Sustainability 2020, 12, 5728. [Google Scholar] [CrossRef]
  25. Xiahou, T.; Liu, Y. Reliability bounds for multi-state systems by fusing multiple sources of imprecise information. IISE Trans. 2020, 52, 1014–1031. [Google Scholar] [CrossRef]
  26. Zhu, L.; Li, Z.; Gou, X.; Shi, J. Analysis of safety characteristics by nonlinear dynamics and safety basin methods for the spur gear pair in the established teeth contact safety domain. Mech. Syst. Signal Process. 2021, 158, 107718. [Google Scholar] [CrossRef]
  27. Mohammadhasani, F.; Pirouzmand, A. Multi-state Risk-Based Maintenance Analysis of Redundant Safety Systems Using the Markov Model and Fault Tree Method. Front. Energy Res. 2021, 9, 685634. [Google Scholar] [CrossRef]
  28. Bougofa, M.; Bouafia, A.; Chakhrit, A.; Guetarni, I.H.M.; Baziz, A.; Aberkane, S.; Zerouali, B.; Kharzi, R.; Bellaouar, A. Dynamic availability assessment using dynamic evidential network: Water deluge system case study. Earth Environ. Sci. 2022, 1098, 012015. [Google Scholar] [CrossRef]
  29. Lu, M.; Jin, Y.; Lin, J.; Liu, Q.; Du, Y.; Yang, Y. Fuzzy fault tree analysis of EVAC system based on improved SAM-FFTA with butterfly optimization algorithm. Eng. Fail. Anal. 2023, 154, 107658. [Google Scholar] [CrossRef]
  30. Deswandri, D.; Sudarno, S.; Tyas, R.L.; Kumaraningrum, A.R.; Maerani, R.; Hidayatullah, I.M.; Sahlan, M.; Shariff, A.M.; Hermansyah, H. Risk identification of integral pressurized water reactor (IPWR) cooling system using a combination HAZOP, FMEA, and FTA methods. Process Saf. Prog. 2024, 43, S78–S89. [Google Scholar] [CrossRef]
  31. Daas, S.; Innal, F. Unavailability Assessment Based on Improved-Dependent Uncertain Ordered Weighted Averaging Operator and Fault Tree Analysis. Int. J. Reliab. Qual. Saf. Eng. 2023, 30, 1. [Google Scholar] [CrossRef]
  32. Dong, W.; Liu, S.; Bae, S.J.; Liu, Y. A multi-stage imperfect maintenance strategy for multi-state systems with variable user demands. Comput. Ind. Eng. 2020, 145, 106508. [Google Scholar] [CrossRef]
  33. Jafari, M.J.; Pouyakian, M.; Hanifi, S.M.; Khanteymoori, A. Reliability evaluation of fire alarm systems using dynamic Bayesian networks and fuzzy fault tree analysis. J. Loss Prev. Process Ind. 2020, 67, 104229. [Google Scholar] [CrossRef]
  34. Kumar, R.; Khan, A.I.; Abushark, Y.B.; Alam, M.M.; Agrawal, A.; Khan, R.A. A knowledge-based integrated system of hesitant fuzzy set, AHP and TOPSIS for evaluating security-durability of web applications. IEEE Access 2020, 8, 48870–48885. [Google Scholar] [CrossRef]
  35. Daas, S.; Innal, F. Failure probability assessment of emergency safety barriers integrating an extension of event tree analysis and Fuzzy type-2 analytic hierarchy process. Syst. Eng. 2023, 26, 641–659. [Google Scholar] [CrossRef]
  36. Zhou, J.; Shia, Y.; Sun, Z. A hybrid fuzzy FTA-AHP method for risk decision-making in accident emergency response of work system. J. Intell. Fuzzy Syst. 2015, 29, 1381–1393. [Google Scholar] [CrossRef]
  37. Zhang, K.; Guo, J.; Yuan, F. A novel transformer fault diagnosis model based on integration of fault tree and fuzzy set. In Proceedings of the 2015 11th International Conference on Semantics, Knowledge and Grids (SKG), Beijing, China, 19–21 August 2015; pp. 112–118. [Google Scholar]
  38. Yazdi, M. Hybrid probabilistic risk assessment using fuzzy FTA and fuzzy AHP in a process industry. J. Fail. Anal. Prev. 2017, 17, 756–764. [Google Scholar] [CrossRef]
  39. Yazdi, M.; Nikfar, F.; Nasrabadi, M. Failure probability analysis by employing fuzzy fault tree analysis. Int. J. Syst. Assur. Eng. Manag. 2017, 8, 1177–1193. [Google Scholar] [CrossRef]
  40. Nadjafi, M.; Farsi, M.A.; Jabbari, H. Reliability analysis of multi-state emergency detection system using simulation approach based on fuzzy failure rate. Int. J. Syst. Assur. Eng. Manag. 2017, 8, 532–541. [Google Scholar] [CrossRef]
  41. Luo, X.; Li, Y.; Bai, X.; Tang, R.; Jin, H. A novel approach based on fault tree analysis and Bayesian network for multi-state reliability analysis of complex equipment systems. J. Risk Reliab. 2024, 238, 812–838. [Google Scholar] [CrossRef]
  42. Sharma, V.; Mishra, R. Reliability analysis of multi-state networks using multi-state binary decision diagrams. In Proceedings of the 2020 IEEE Students Conference on Engineering & Systems (SCES), Prayagraj, India, 10–12 July 2020; pp. 1–6. [Google Scholar]
  43. Zhang, S.; Zhang, S.; Zhou, H.; Paik, K.-W.; Ding, T.; Long, W.; Zhong, S.; He, P. Preparation and characterization of Sn-3.0 Ag-0.5 Cu nano-solder paste and assessment of the reliability of joints fabricated by microwave hybrid heating. Mater. Charact. 2024, 207, 113512. [Google Scholar] [CrossRef]
  44. Frederiksen, R.D.; Bocewicz, G.; Radzki, G.; Banaszak, Z.; Nielsen, P. Cost-Effectiveness of Predictive Maintenance for Offshore Wind Farms: A Case Study. Energies 2024, 17, 3147. [Google Scholar] [CrossRef]
  45. Jianxing, Y.; Haicheng, C.; Yang, Y.; Zhenglong, Y. A weakest t-norm based fuzzy fault tree approach for leakage risk assessment of submarine pipeline. J. Loss Prev. Process Ind. 2019, 62, 103968. [Google Scholar] [CrossRef]
  46. Zhang, X.; Xu, Z. Extension of TOPSIS to multiple criteria decision making with Pythagorean fuzzy sets. Int. J. Intell. Syst. 2014, 29, 1061–1078. [Google Scholar] [CrossRef]
  47. Karasan, A.; Ilbahar, E.; Cebi, S.; Kahraman, C. A new risk assessment approach: Safety and Critical Effect Analysis (SCEA) and its extension with Pythagorean fuzzy sets. Saf. Sci. 2018, 108, 173–187. [Google Scholar] [CrossRef]
  48. Southgate, J.M.; Groth, K.; Sandborn, P.; Azarm, S. Cost-Benefit Analysis using Modular Dynamic Fault Tree Analysis and Monte Carlo Simulations for Condition-based Maintenance of Unmanned Systems. arXiv 2024, arXiv:2405.09519. [Google Scholar]
  49. Yager, R. Pythagorean membership grades in multicriteria decision making. IEEE Trans. Fuzzy Syst. 2013, 22, 958–965. [Google Scholar] [CrossRef]
  50. Samia, D.; Fares, I. Optimization the reliability of emergency safety barriers based on the subjective safety analysis and evidential reasoning theory. Case study. Int. J. Qual. Reliab. Manag. 2023, 41, 1–41. [Google Scholar] [CrossRef]
  51. Xing, L.; Amari, S.V. Handbook of Performability Engineering; Springer: Berlin/Heidelberg, Germany, 2008; pp. 595–620. [Google Scholar]
  52. Chou, S.; Dat, L.Q.; Vincent, F.Y. A revised method for ranking fuzzy numbers using maximizing set and minimizing set. Comput. Ind. Eng. 2011, 61, 1342–1348. [Google Scholar] [CrossRef]
  53. Veerraju, N.; Prasannam, V.L.; Rallabandi, L.N. Defuzzification index for ranking of fuzzy numbers on the basis of geometric mean. Int. J. Intell. Syst. Appl. 2020, 12, 13–24. [Google Scholar] [CrossRef]
  54. Banerjee, R.; Pal, S.K.; Pal, J.K. A decade of the Z-numbers. IEEE Trans. Fuzzy Syst. 2021, 30, 2800–2812. [Google Scholar] [CrossRef]
  55. Onisawa, T. A representation of human reliability using fuzzy concepts. Inf. Sci. 1988, 45, 153–173. [Google Scholar] [CrossRef]
  56. Yazdi, M.; Khan, F.; Abbassi, R.; Rusli, R. Improved DEMATEL methodology for effective safety management decision-making. Saf. Sci. 2020, 127, 104705. [Google Scholar] [CrossRef]
  57. Ahmadi, O.; Mortazavi, S.B.; Mahabadi, H.A. Development of a dynamic quantitative risk assessment methodology using fuzzy DEMATEL-BN and leading indicators. Process Saf. Environ. Prot. 2020, 142, 15–44. [Google Scholar] [CrossRef]
  58. Cai, C.; Wang, Y.; Wang, P.; Zou, H. Evidential-Reasoning-Type Multi-Attribute Large Group Decision-Making Method Based on Public Satisfaction. Axioms 2024, 13, 276. [Google Scholar] [CrossRef]
  59. Ma, K.; Yu, Y.; Yang, B.; Yang, J. Demand-side energy management considering price oscillations for residential building heating and ventilation systems. IEEE Trans. Ind. Inform. 2019, 15, 4742–4752. [Google Scholar] [CrossRef]
  60. Samia, D.; Innal, F. An Extension of the Failure Mode Effects and Criticality Analysis with Fuzzy Analytical Hierarchy Process Method to assess the Emergency Safety Barriers. Int. J. Ind. Eng. Theory Appl. Pract. 2023, 30, 474–490. [Google Scholar]
  61. Daas, S.; Innal, F. Reliability assessment of emergency safety barriers based on an intuitionistic fuzzy sets aggregation procedure and subjective safety analysis: A case study. Int. J. Syst. Assur. Eng. Manag. 2024, 15, 4143–4161. [Google Scholar] [CrossRef]
  62. Zhu, C. An adaptive agent decision model based on deep reinforcement learning and autonomous learning. J. Logist. Inform. Serv. Sci. 2023, 10, 107–118. [Google Scholar]
  63. Xiang, X.; Zhou, J.; Deng, Y.; Yang, X. Identifying the generator matrix of a stationary Markov chain using partially observable data. Chaos Interdiscip. J. Nonlinear Sci. 2024, 34, 023132. [Google Scholar] [CrossRef]
Figure 1. Flowchart of the proposed methodology.
Processes 12 02187 g001
Figure 2. Simplified flow diagram of the Hydrogen production plant.
Processes 12 02187 g002
Figure 3. Firewater systems of the hydrogen production plant.
Processes 12 02187 g003
Figure 4. Polymorphic fuzzy fault tree analysis of the firewater system.
Processes 12 02187 g004
Figure 5. Multistate failure probability values for all multistate firewater systems.
Processes 12 02187 g005
Figure 6. The multistate reliability value of the firewater system.
Processes 12 02187 g006
Figure 7. Ranking values of the improved cost-effectiveness index.
Processes 12 02187 g007
Figure 8. The causal diagram of influence capability of maintenance actions and basic events on the normal state.
Processes 12 02187 g008
Figure 9. The causal diagram of influence capability of maintenance actions and basic events on the degradation state.
Processes 12 02187 g009
Figure 10. The causal diagram of influence capability of maintenance actions and basic events on the failure state.
Processes 12 02187 g010
Table 1. Fuzzy number sets of the linguistic terms for the normal state.
Linguistic Terms Trapezoidal   Fuzzy   Number   R ~
r 1 r 2 r 3 r 4
Very Low (VL)00.100.150.20
Low (L)0.100.150.200.25
Mildly Low (ML)0.150.200.250.30
Medium (M)0.200.250.300.35
Mildly High (MH)0.250.300.350.40
High (H)0.300.350.400.45
Very High (VH)0.350.400.450.5
Table 2. Fuzzy number sets of the linguistic terms for the degradation state.
Linguistic Terms Trapezoidal   Fuzzy   Number   R ~
r 1 r 2 r 3 r 4
Very Low (VL)0.200.400.450.50
Low (L)0.400.450.500.55
Mildly Low (ML)0.450.500.550.60
Medium (M)0.500.550.600.65
Mildly High (MH)0.550.600.650.70
High (H)0.600.650.700.75
Very High (VH)0.650.700.750.80
Table 3. Fuzzy number sets of the linguistic terms for the failure state.
Linguistic Terms Trapezoidal   Fuzzy   Number   R ~
r 1 r 2 r 3 r 4
Very Low (VL)0.700.730.750.78
Low (L)0.430.750.780.80
Mildly Low (ML)0.750.780.800.83
Medium (M)0.780.800.830.85
Mildly High (MH)0.800.830.850.88
High (H)0.830.850.900.95
Very High (VH)0.850.900.951
Table 4. Pythagorean fuzzy linguistic scales.
Linguistic TermsPFS
Very Low (VL)(0.15, 0.85)
Low (L)(0.25, 0.75)
Moderately Low (ML)(0.35, 0.65)
Medium (M)(0.50, 0.45)
Moderately High (MH)(0.65, 0.35)
High (H)(0.75, 0.25)
Very High (VH)(0.85, 0.15)
Table 5. The weighting of selected experts in investigating the cost–benefit–safety analysis.
ConditionExperts
E 1 E 2 E 3 E 4
Organizational titleSafety supervisor (4)Master (3)Fire supervisor (4)Master (3)
Work experience (Years)18 (4)13 (3)16 (3)17 (3)
Level of educationBSc (3)MSc (4)BSc (3)MSc (4)
Age (years)46 (3)36 (2)39 (3)39 (2)
Weighted score of expert ( W S i ) 14121312
Weighted factor ( W F ) 0.280.240.260.24
Table 7. Linguistic expression used for pair matrix comparison.
Linguistic TermsTriangular Fuzzy Numbers
Definite NumberFuzzy Sets
No influence0(1, 1, 1)
Low influence1(2, 3, 4)
Moderate influence2(4, 5, 6)
High influence3(6, 7, 8)
Very High influence4(8, 9, 9)
Table 8. Description of the basic events, intermediate events, and top events.
BEsDescriptionBEsDescription
X1Failure of the pressure sensorX14Failure of electrical pump A/B
X2Diesel pump failureX15Failure of electrical motor B
X3Diesel pump fails to start on demandOr1 (TE)Failure in the firewater system
X4Failure of the diesel motorAnd1 (IE1)Jokey pump system failure
X5Failure of jokey pump AAnd2 (IE2)Electric pump system failure
X6Failure of the electrical motor AOr2 (IE3)Diesel pump system failure
X7Jokey pump 2 fails to start on demandOr3 (IE4)Jokey pump A failure
X8Failure at jokey pumps A/BOr4 (IE5)Jokey pump B failure
X9Failure of the electrical motor BOr5 (IE6)Electric pump system A failure
X10Electrical pump A fails to start on demand Or6 (IE7)Electric pump system B failure
X11Electrical pump B fails to start on demandOr7 (IE8)Electric pump A failure
X12Failure of jokey pump BOr8 (IE9)Electric pump B failure
X13Failure of the electrical motor B
Table 9. Multistate failure probability values for normal, degraded, and failure states.
B E s Multistate Failure Probability B E s Multistate Failure Probability
Normal StateDegradation StateFailure StateNormal StateDegradation StateFailure State
x 1 6.540 × 10−32.947 × 10−27.933 × 10−2 x 9 5.571 × 10−32.493 × 10−27.014 × 10−2
x 2 2.693 × 10−31.289 × 10−24.866 × 10−2 x 10 3.625 × 10−31.622 × 10−25.469 × 10−2
x 3 3.504 × 10−31.568 × 10−25.368 × 10−2 x 11 3.626 × 10−31.623 × 10−25.470 × 10−2
x 4 4.887 × 10−32.187 × 10−26.595 × 10−2 x 12 7.094 × 10−33.175 × 10−28.734 × 10−2
x 5 7.094 × 10−33.147 × 10−28.734 × 10−2 x 13 2.900 × 10−31.402 × 10−25.084 × 10−2
x 6 5.570 × 10−32.493 × 10−27.014 × 10−2 x 14 5.570 × 10−32.493 × 10−26.977 × 10−2
x 7 2.958 × 10−31.415 × 10−25.083 × 10−2 x 15 2.900 × 10−31.402 × 10−25.084 × 10−2
x 8 7.218 × 10−33.228 × 10−28.866 × 10⁻²
Table 10. Multistate reliability value of the firewater system.
B E s Multistate Reliability B E s Multistate Reliability
Normal StateDegradation StateFailure StateNormal StateDegradation StateFailure State
x 1 0.9930.9710.921 x 9 0.9940.9750.930
x 2 0.9970.9870.951 x 10 0.9960.9840.945
x 3 0.9960.9840.946 x 11 0.9960.9840.945
x 4 0.9950.9780.934 x 12 0.9930.9680.913
x 5 0.9930.9690.913 x 13 0.9970.9860.949
x 6 0.9940.9750.930 x 14 0.9940.9750.930
x 7 0.9970.9860.949 x 15 0.9970.9860.949
x 8 0.9930.9680.911
Table 11. Cost–benefit–safety and risk values of the normal state.
B E s CostBenefitSafetyRisk Value B E s CostBenefitSafetyRisk Value
x 1 0.4660.4700.4666.54 × 10−3 x 9 0.2310.3850.2145.57 × 10−2
x 2 0.4660.2670.3752.69 × 10−2 x 10 0.2310.3850.1463.63 × 10−4
x 3 0.3050.3470.1463.50 × 10−2 x 11 0.2310.3850.1463.63 × 10−4
x 4 0.3750.3120.4664.89 × 10−2 x 12 0.2310.3850.3057.09 × 10−2
x 5 0.1020.4490.5287.09 × 10−5 x 13 0.2310.3850.3052.90 × 10−2
x 6 0.2310.3850.3055.57 × 10−2 x 14 0.3750.3120.2315.57 × 10−5
x 7 0.4660.2670.3052.96 × 10−3 x 15 0.3750.3120.3052.90 × 10−4
x 8 0.1020.4490.5607.21 × 10−5
Table 12. Cost–benefit–safety and risk values of the degradation state.
B E s CostBenefitSafetyRisk Value B E s CostBenefitSafetyRisk Value
x 1 0.1020.4660.3052.95 × 10−2 x 9 0.2310.1460.2142.49 × 10−1
x 2 0.4660.1460.3751.29 × 10−1 x 10 0.1020.2310.1461.62 × 10−3
x 3 0.4220.3380.1461.57 × 10−1 x 11 0.1020.2310.1461.62 × 10−3
x 4 0.3750.3050.4662.19 × 10−1 x 12 0.2310.1020.3053.18 × 10−1
x 5 0.3040.3750.4663.15 × 10−3 x 13 0.2310.3750.3051.40 × 10−1
x 6 0.2310.3750.3052.49 × 10−1 x 14 0.3750.3050.2312.49 × 10−4
x 7 0.4660.3050.3051.42 × 10−2 x 15 0.4220.4660.2141.40 × 10−3
x 8 0.3050.4660.4663.23 × 10−3
Table 13. Cost–benefit–safety and risk values of the failure state.
B E s CostBenefitSafetyRisk Value B E s CostBenefitSafetyRisk Value
x 1 0.4660.1460.5287.93 × 10−1 x 9 0.4660.4660.2147.01 × 10−1
x 2 0.1020.1460.3754.87 × 10−1 x 10 0.1020.2310.1465.47 × 10−3
x 3 0.3750.4660.1465.37 × 10−2 x 11 0.1020.2310.1465.47 × 10−3
x 4 0.3750.3050.4666.60 × 10−1 x 12 0.3750.3380.3058.73 × 10−1
x 5 0.2310.3380.2148.73 × 10−4 x 13 0.2310.3750.3055.08 × 10−1
x 6 0.2310.2310.3057.01 × 10−1 x 14 0.3750.3050.2316.98 × 10−4
x 7 0.4660.3050.3055.08 × 10−2 x 15 0.2310.4660.3055.08 × 10−3
x 8 0.2310.3380.1468.87 × 10−1
Table 14. Improved cost-effectiveness index value and ranking of the firewater system.
B E s Normal StateDegradation StateFailure State
I N C A F Ranking I N C A F Ranking I N C A F Ranking
x 1 0.000130.159130.14211
x 2 0.91741.29752.8781
x 3 1.444215.12111.7352
x 4 0.168100.283100.3629
x 5 0.160120.183120.12812
x 6 0.57962.57830.3658
x 7 0.53170.55180.6306
x 8 0.161110.195110.12213
x 9 1.48816.59920.4827
x 10 0.88550.89260.9174
x 11 0.88550.89260.9174
x 12 0.000130.000140.00014
x 13 0.52380.87670.7135
x 14 0.30490.30490.30510
x 15 1.33131.33641.3523
Table 15. Proposed preventive maintenance actions.
Maintenance Actions (MA)Description
MA1Test the operation of pumps and pressure equipment.
MA2Provide preventive maintenance of pumps.
MA3Review maintenance procedures.
MA4Ensure availability procedures.
MA5Add anti-corrosion chemicals.
MA6Implementation of cyclic maintenance tests.
MA7Minimize repair time.
MA8Improve the observation process.
MA9Increase inspection scans.
MA10Increase the number of visits to the site.
Table 16. (D + R) and (D − R) values.
B E s / M A s D + RD − R B E s / M A s D + RD − R
x 1 0.355750.35575 x 14 0.0960410.096041
x 2 2.355752.35575 x 15 0.004520.00452
x 3 2.6940742.694074 M A 1 1−1
x 4 2.0960412.096041 M A 2 0.187445−0.187445
x 5 2.004522.00452 M A 3 0.209933−0.209933
x 6 1.3349641.334964 M A 4 0.164901−0.164901
x 7 1.355751.35575 M A 5 0.865862−0.865862
x 8 1.6940741.694074 M A 6 0.209933−0.209933
x 9 1.0960411.096041 M A 7 0.519156−0.519156
x 10 1.004521.00452 M A 8 0.969088−0.437658
x 11 0.3349640.334964 M A 9 1.14103−0.6096
x 12 0.355750.35575 M A 10 0.595581−0.595581
x 13 0.6940740.694074
Disclaimer/Publisher’s Note: The statements, opinions and data contained in all publications are solely those of the individual author(s) and contributor(s) and not of MDPI and/or the editor(s). MDPI and/or the editor(s) disclaim responsibility for any injury to people or property resulting from any ideas, methods, instructions or products referred to in the content.

