Article

Experimental and CFD Analysis of Hydrodynamics in Dual-Impeller Crystallizer at Different Off-Bottom Clearances

1
Department of Chemical Engineering, Faculty of Chemistry and Technology, University of Split, R. Boškovića 35, 21 000 Split, Croatia
2
Department of Mechanical Engineering: Heat Engines, Faculty of Electrical Engineering, Mechanical Engineering and Naval Architecture, University of Split, R. Boškovića 32, 21 000 Split, Croatia
*
Author to whom correspondence should be addressed.
Processes 2024, 12(10), 2183; https://doi.org/10.3390/pr12102183
Submission received: 5 July 2024 / Revised: 6 September 2024 / Accepted: 28 September 2024 / Published: 8 October 2024

Abstract

:
Producing tailor-made crystals demands knowledge of the influence of hydrodynamics and nucleation kinetics. In this paper, the hydrodynamic conditions in a dual-impeller crystallizer and their influence on the key nucleation parameters of the batch cooling crystallization of borax at different impeller off-bottom clearances were investigated. Two different impeller configurations were used—a dual pitched-blade turbine (2 PBT) and a dual straight-blade turbine (2 SBT). Hydrodynamics was analyzed in depth based on the developed computational fluid dynamics model. The experimental results on mixing time and power input were used to validate the numerical model. The results show that the properties of the final product are affected by the impeller position in both dual-impeller configurations. An increase in the impeller off-bottom clearance in both systems results in a decrease in the mean crystal size. The hydrodynamic conditions generated at C/D = 1 in the 2 PBT impeller system and at C/D = 0.6 in the 2 SBT impeller system favored an earlier onset of nucleation compared to other impeller positions. It was found that the eddy dissipation rate and the Kolmogorov length scale correlate highly with the mean crystal size, suggesting that the size is affected by the shear stress in the vessel, rather than the overall convective flow.

1. Introduction

Crystallization is one of the most important separation processes in the chemical, pharmaceutical, and food industries, performed with the aim of separating and purifying a product. It owes its popularity to the fact that it can be conducted at relatively low temperatures and that, by adjusting the process conditions, a crystal product of the desired characteristic can be manufactured, practically in one step. The characteristics of the end product of crystallization depend not only on the physico-chemical properties of the crystallizing substance, but the process conditions as well, including the conditions under which mixing is performed in the vessel.
Although mixing affects the crystallization kinetics, it is often performed without optimizing the hydrodynamic conditions in the crystallizer. Being unaware of the influence of mixing is mostly “hidden” by overmixing, which causes agglomeration and secondary nucleation, i.e., results in a wider crystal size distribution (CSD). In the pharmaceutical industry, for example, a wider CSD can have a negative impact on the final drug formulation, as such a product requires the application of additional unit operations, such as grinding, sieving, powder mixing, and granulation. In addition to the fact that the implementation of the mentioned operations requires the consumption of energy, it also causes a delay in the production process, which, overall, results in an increase in production costs. In addition, operations such as grinding and granulation can lead to a change in the polymorphic form, contamination of the product, and thermal degradation due to friction (grinding), which is certainly an undesirable outcome. Therefore, in order to achieve the maximum potential of crystallization, it is necessary first to analyze the influence of the mixing parameters on all stages of the batch crystallization process in order to conduct the process at such hydrodynamic conditions that will result in a product with the desired specification.
Although mixing affects the crystallization process, it is rarely analyzed in depth. This is especially the case with the dual-impeller crystallizers, which are seldom investigated. While these could offer enhanced mixing, which is a prerequisite for improved heat and mass transfer, the hydrodynamics within the dual-impeller crystallizer is often complex as a consequence of flow interaction between the two impellers.
Based on the available literature, it is evident that hydrodynamics is most commonly analyzed in inert, homogeneous, or heterogeneous systems [1,2,3]. Only the latest works are listed in the literature below, but there is a whole series of similar ones published in the last 10 years. What they have in common is the use of computational tools—Computational Fluid Dynamics (CFD), which is used to gain a deeper insight into the hydrodynamics within the vessel. It was found that CFD simulations accurately predict velocity profiles and flow characteristics in stirred vessels where different impeller designs are employed. These include anchor, saw-tooth, counter-flow, and Rushton turbine impellers [4].
For solid–liquid mixing in general, the effectiveness of the large blade impellers has been investigated recently. This in particular includes the Maxblend impeller. In the work by Montante et al. [1], it was demonstrated that large blade impellers are quite efficient for two-phase mixing in baffled vessels. Maxblend was used in other applications, such as in emulsifying [5], where it was found that an optimum rotational speed and energy consumption, as well as the size of the emulsion droplets, are achieved with this type of impeller. Another variant of the large blade impeller, the Intermig impeller, showed the potential to improve the mixing efficiency in a solid–liquid system [6]. Besides the large blade impellers, coaxial mixers have also shown improved mixing performance in solid–liquid systems. Xu et al. [7] developed numerical models for dense solid suspension in which coaxial mixers were used, while in the work by Yang et al. [8], micromixing characteristics of coaxial mixers were determined experimentally. In both papers, it was found that the outer impeller significantly improves the micromixing performance. Another study by Xu et al. [9] suggested that, with the help of an outer anchor, the up-pumping propeller could suspend solids more easily compared to the down-pumping one.
While these studies contribute to the ongoing improvement of multiphase mixing, the role of mixing in a solid–liquid system, i.e., in a suspension, vs. the role of mixing in the crystallization process differs, nonetheless. In the first part of the crystallization process, only the liquid phase is present in the crystallizer. Mixing here ensures a uniform distribution of the supersaturation of the mother liquor, which is the driving force of crystallization. At the moment of nucleation, crystals form and a single-phase system switches to a two-phase one. At that point, the role of mixing takes on a new dimension—that of achieving the optimal suspension state, i.e., ensuring that the surface of the growing crystals is fully exposed to the mother liquor and available for mass transfer. Mixing here also affects the thickness of the diffusion layer, formed around the crystal, which represents the main resistance to mass transfer. The resulting mechanisms and rates of heat and mass transfer determine the kinetics of nucleation and crystal growth, and therefore, the final shape, size, fluidity, and purity of the final crystal product.
Although the influence of mixing on the process of batch crystallization is obvious, it has been very modestly investigated [10,11,12,13,14]. Most of the research that deals with crystallization is carried out on a laboratory scale, with volumes up to 0.5 dm3 and mixing usually being employed by a magnetic stirrer [11,12]. Somewhat larger systems, of 1 and 5 dm3, have been investigated recently [13,14]. There are some research papers in which the relationship between hydrodynamics, observed trough CFD modeling, and crystallization is considered but these are mainly related to single-impeller crystallizers. Camacho Corzo et al. [15] presented a computational fluid dynamics methodology for modeling free-surface hydrodynamics in agitated batch cooling crystallizers. Oh et al. (2020) [16] demonstrated the application of their C-based software that simplifies CFD model development procedures and automatically generates UDF files for crystallization kinetics based on the user’s specification. CFD, coupled with population balance equations (PBEs), was also used for the prediction of particle size in semi-batch and continuous crystallizers for battery materials [17,18]. Additionally, there are papers in which advanced modeling is applied in the batch crystallization process, such as [19]. However, all of these papers present crystallization results that are obtained either exclusively numerically, or the crystallization has been carried out experimentally on a scale significantly smaller than an industrial one. Yet, on a larger scale, the hydrodynamic conditions in the crystallizer often change, since it is not possible to apply such a scale-up criterion, which results in completely identical hydrodynamic conditions. This change inevitably affects the nucleation and crystal growth kinetics. With this in mind, it can be said that there is still considerable potential for additional positive developments in this area. While the impeller types mentioned above offer improve mixing efficiency in solid–liquid systems, the idea of this work was to analyze the performance of two traditionally used, but hydrodynamically different impeller types: the pitched-blade turbine (PBT) and the straight-blade turbine (SBT). That is, the aim was to analyze the effect of different hydrodynamic conditions in a dual-impeller crystallizer (experimentally and numerically), on a scale larger than the laboratory one—in a 15 dm3 dual-impeller crystallizer; and to unveil its effect on nucleation kinetics and the final crystal size, which were experimentally determined in this paper.

2. Materials and Methods

The investigation was conducted in a 15 dm3 flat bottom crystallizer, shown in Figure 1. To accommodate the use of the dual-impeller system, the dimensionless crystallizer aspect ratio H/dT was equal to 1.3, where H represents the mother liquor height and dT the crystallizer diameter. Two types of impellers were used, pitched-blade turbine (PBT) and straight-blade turbine, in two dual-impeller configurations, 2 PBT and 2 SBT. The impellers were positioned on the same shaft, with dimensionless spacing S/D = 1, while the dimensionless impeller off-bottom clearance, C/D, varied from 0.2 to 1.3, where S represents the impeller spacing, C is the impeller off-bottom clearance, and D is the impeller diameter. The experiments were conducted at the just-suspended impeller speed, NJS, in order to ensure a state of complete suspension in the crystallizer at all impeller off-bottom clearances. The NJS values were determined based on the 0.9 H criterion, as previously described in [20]. At the same time, Zwietering’s 1 s criterion for off-bottom suspension was met as well. The complete process conditions are listed in Table 1.
The batch crystallization of borax decahydrate was conducted by the linear cooling (Lauda Proline RP855C X Edition thermostat) of mother liquor, which was prepared at 30 °C. To ensure that the solution was saturated, the salt was added in excess. After 2 h of stabilization, the solution was filtered through a sintered glass funnel by vacuum filtration, tempered again at 30 °C, and then cooled down at 6 °C/h, until reaching 14 °C. At the end of the process, the suspension was vacuum-filtered through filter paper (blue ribbon), and the crystals were left to dry at room temperature for 24 h.
The solution temperature and concentration were measured continuously in situ. The temperature was measured with a Pt-100 probe, while the concentration was determined potentiometrically—based on the measurements of the solution potential with a Methrom 913 pH meter with a polymer membrane sodium ion-selective electrode (Na-ISE) along with a Ag/AgCl reference electrode. The concentration was determined with a relative error under 3%. The driving force of the process was calculated by:
c = c c * .
where ∆c is the absolute supersaturation, while c and c* are the concentration and the equilibrium concentration (solubility of the salt), respectively, at a given temperature.

2.1. Experimental Determination of the Crystallization Parameters and Final Product Properties

A key nucleation kinetic parameter—the metastable zone width (MSZW)—was determined visually, as is generally accepted, based on the work of Nyvlt (1968) [21]. In this paper, MSZW was expressed as the maximum supersaturation—∆cmax. When the first visible nuclei appear, the solution temperature and potential are recorded and ∆cmax is calculated using Equation (1). It is worth noting that the MSZW determines the range of operating conditions within which the process should ultimately be conducted to avoid spontaneous nucleation. Based on the supersaturation profile, it was possible to determine the nucleation mechanism and rate, explained in detail in [20]. At the end of the crystallization process, the suspension was filtered, and the crystals were dried and sieved through a series of Fisher Scientific sieves, with a mesh size of 45–300 µm using a Retsch AS 200 control vibratory sieve shaker. Sieving was carried out for 20 min at a 3 mm amplitude.

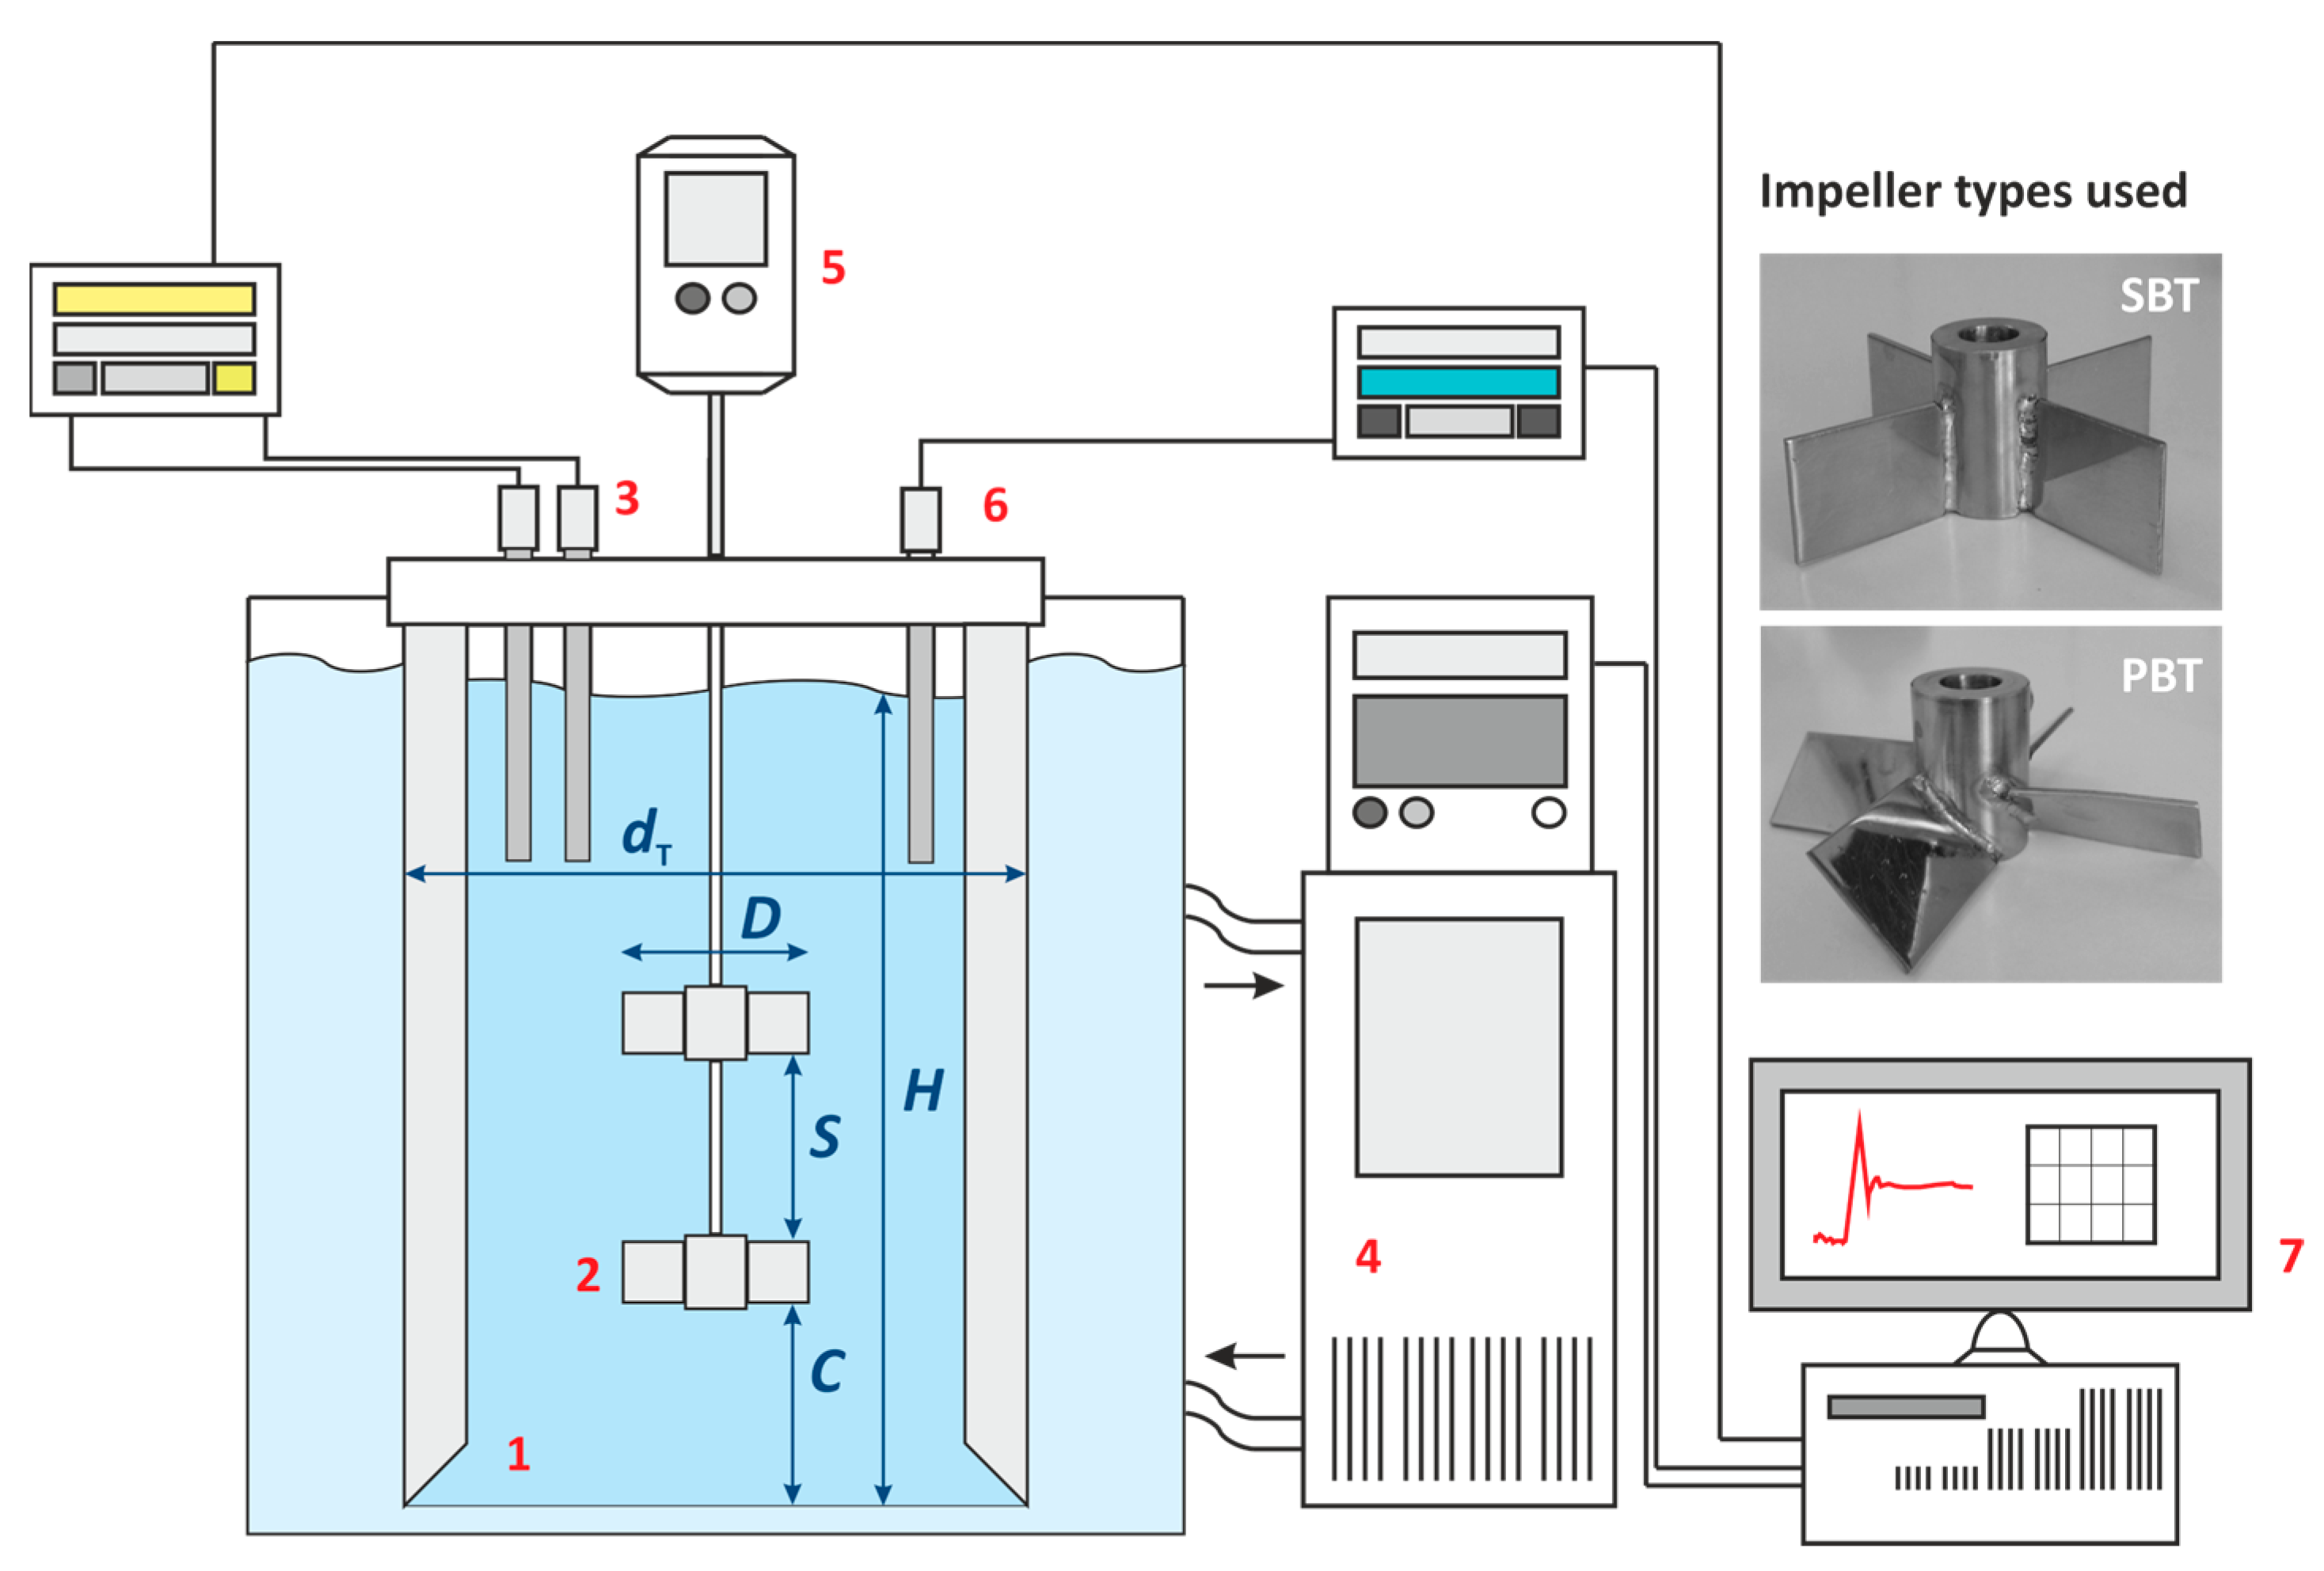
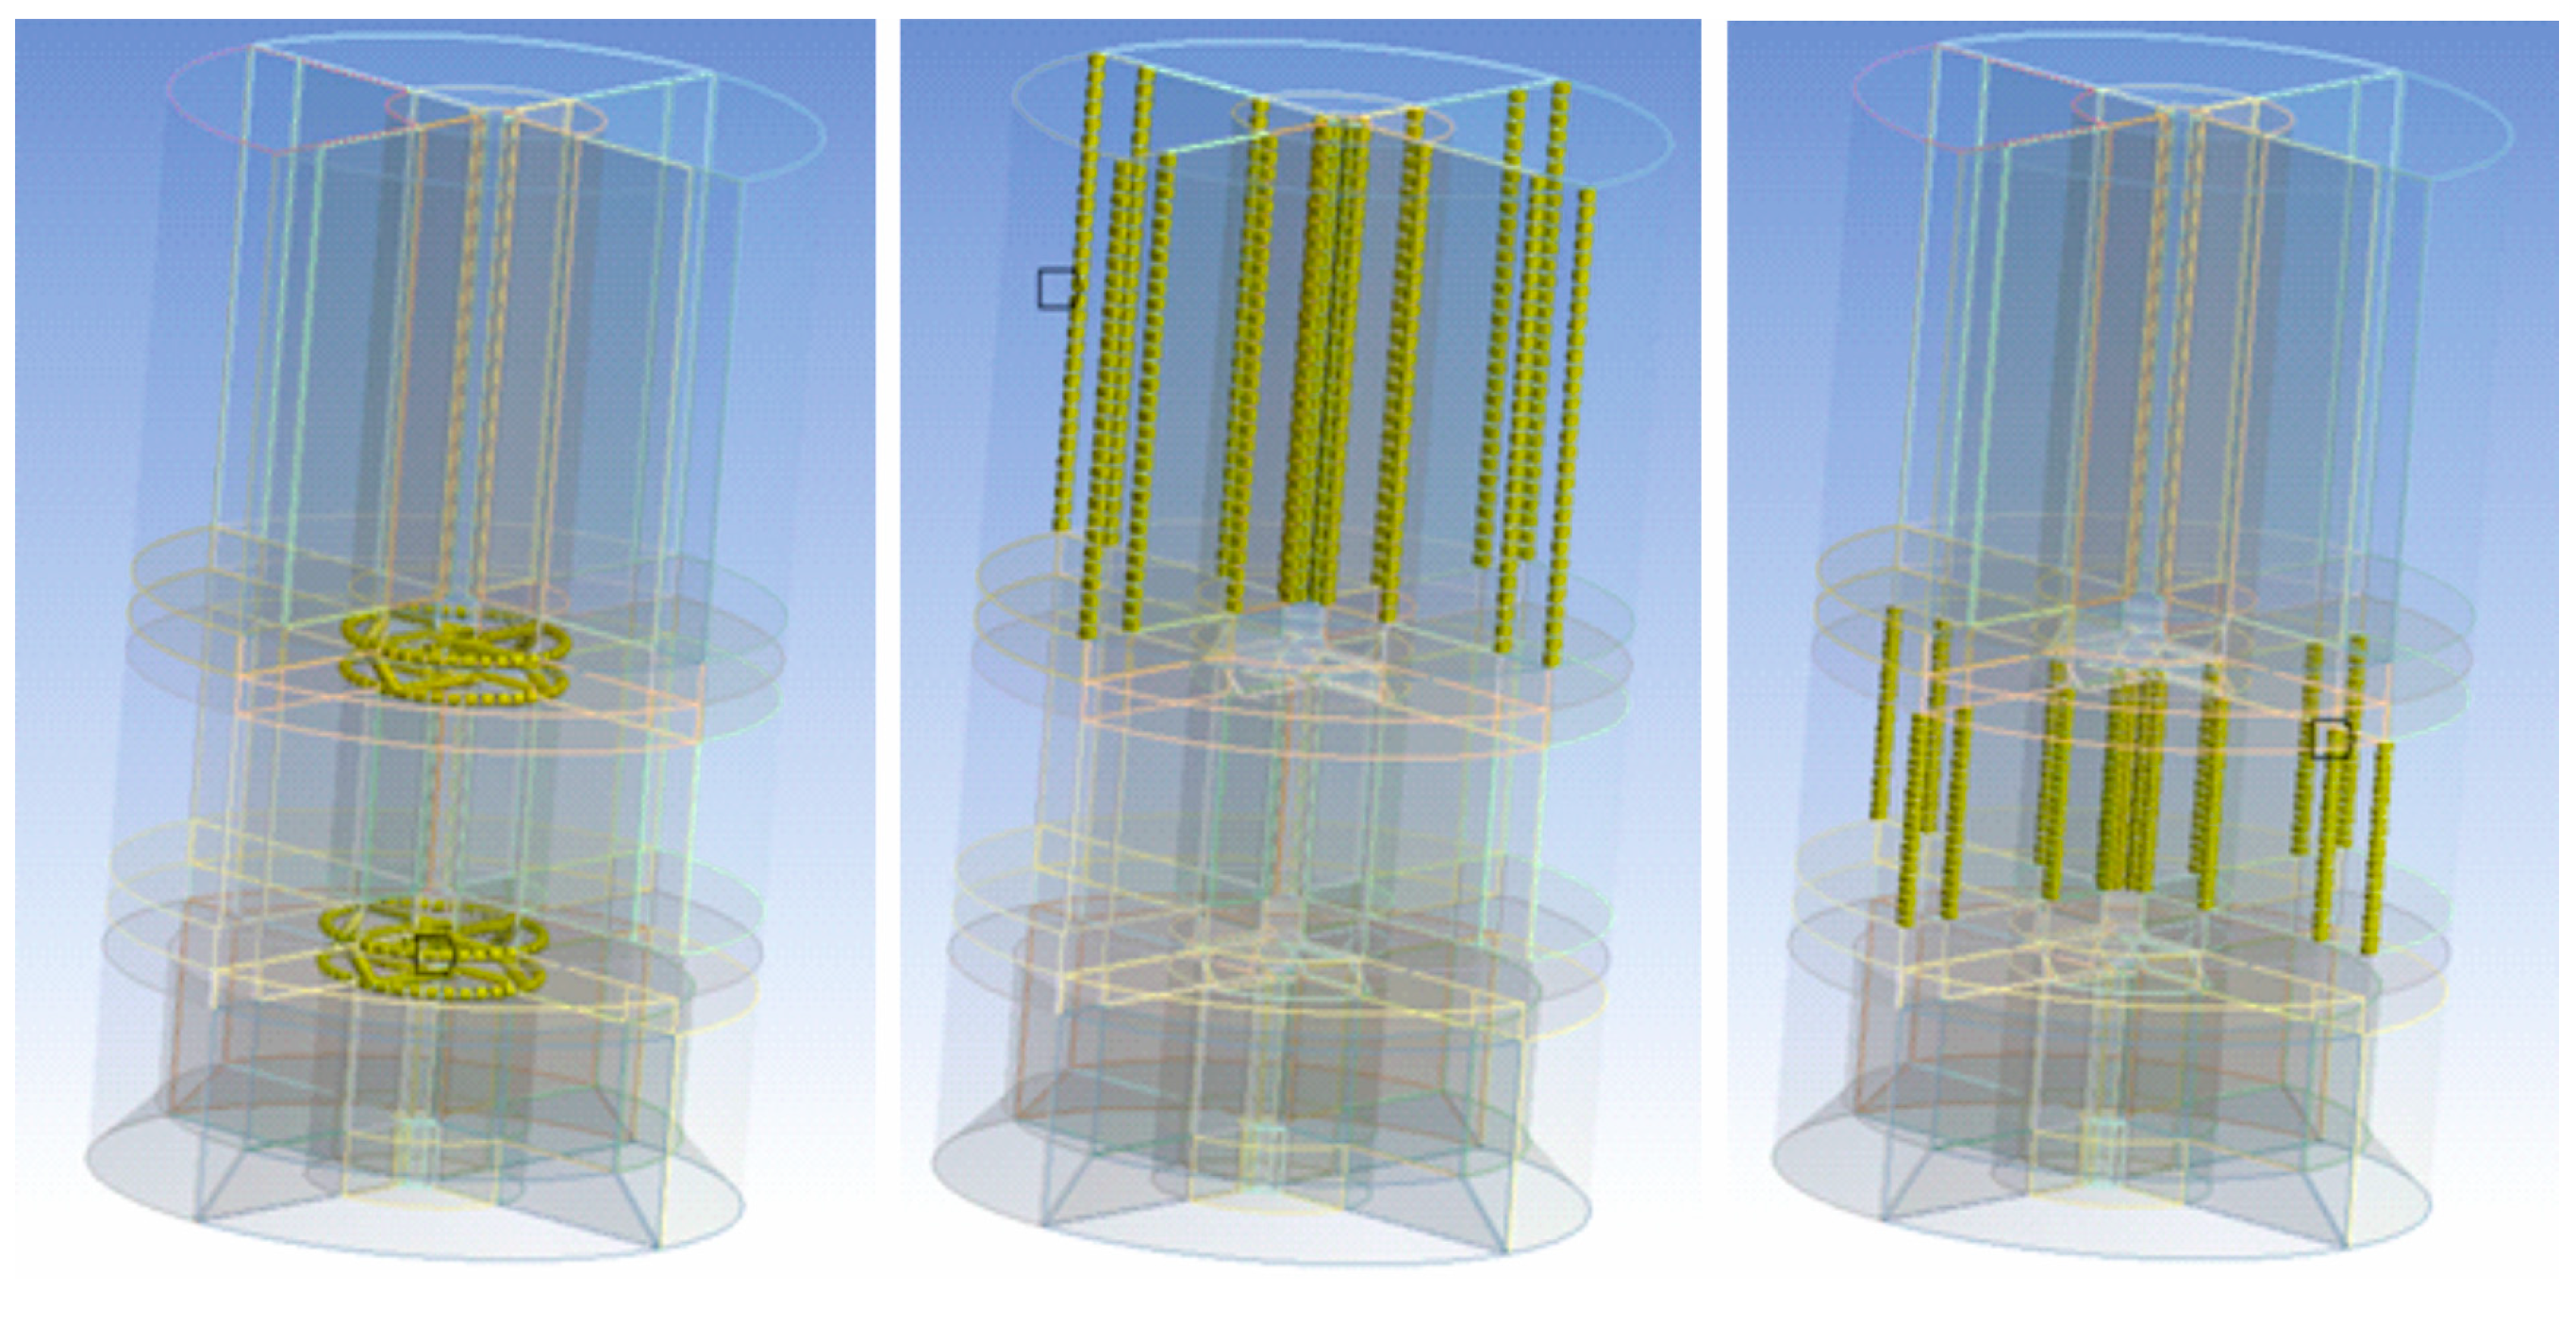
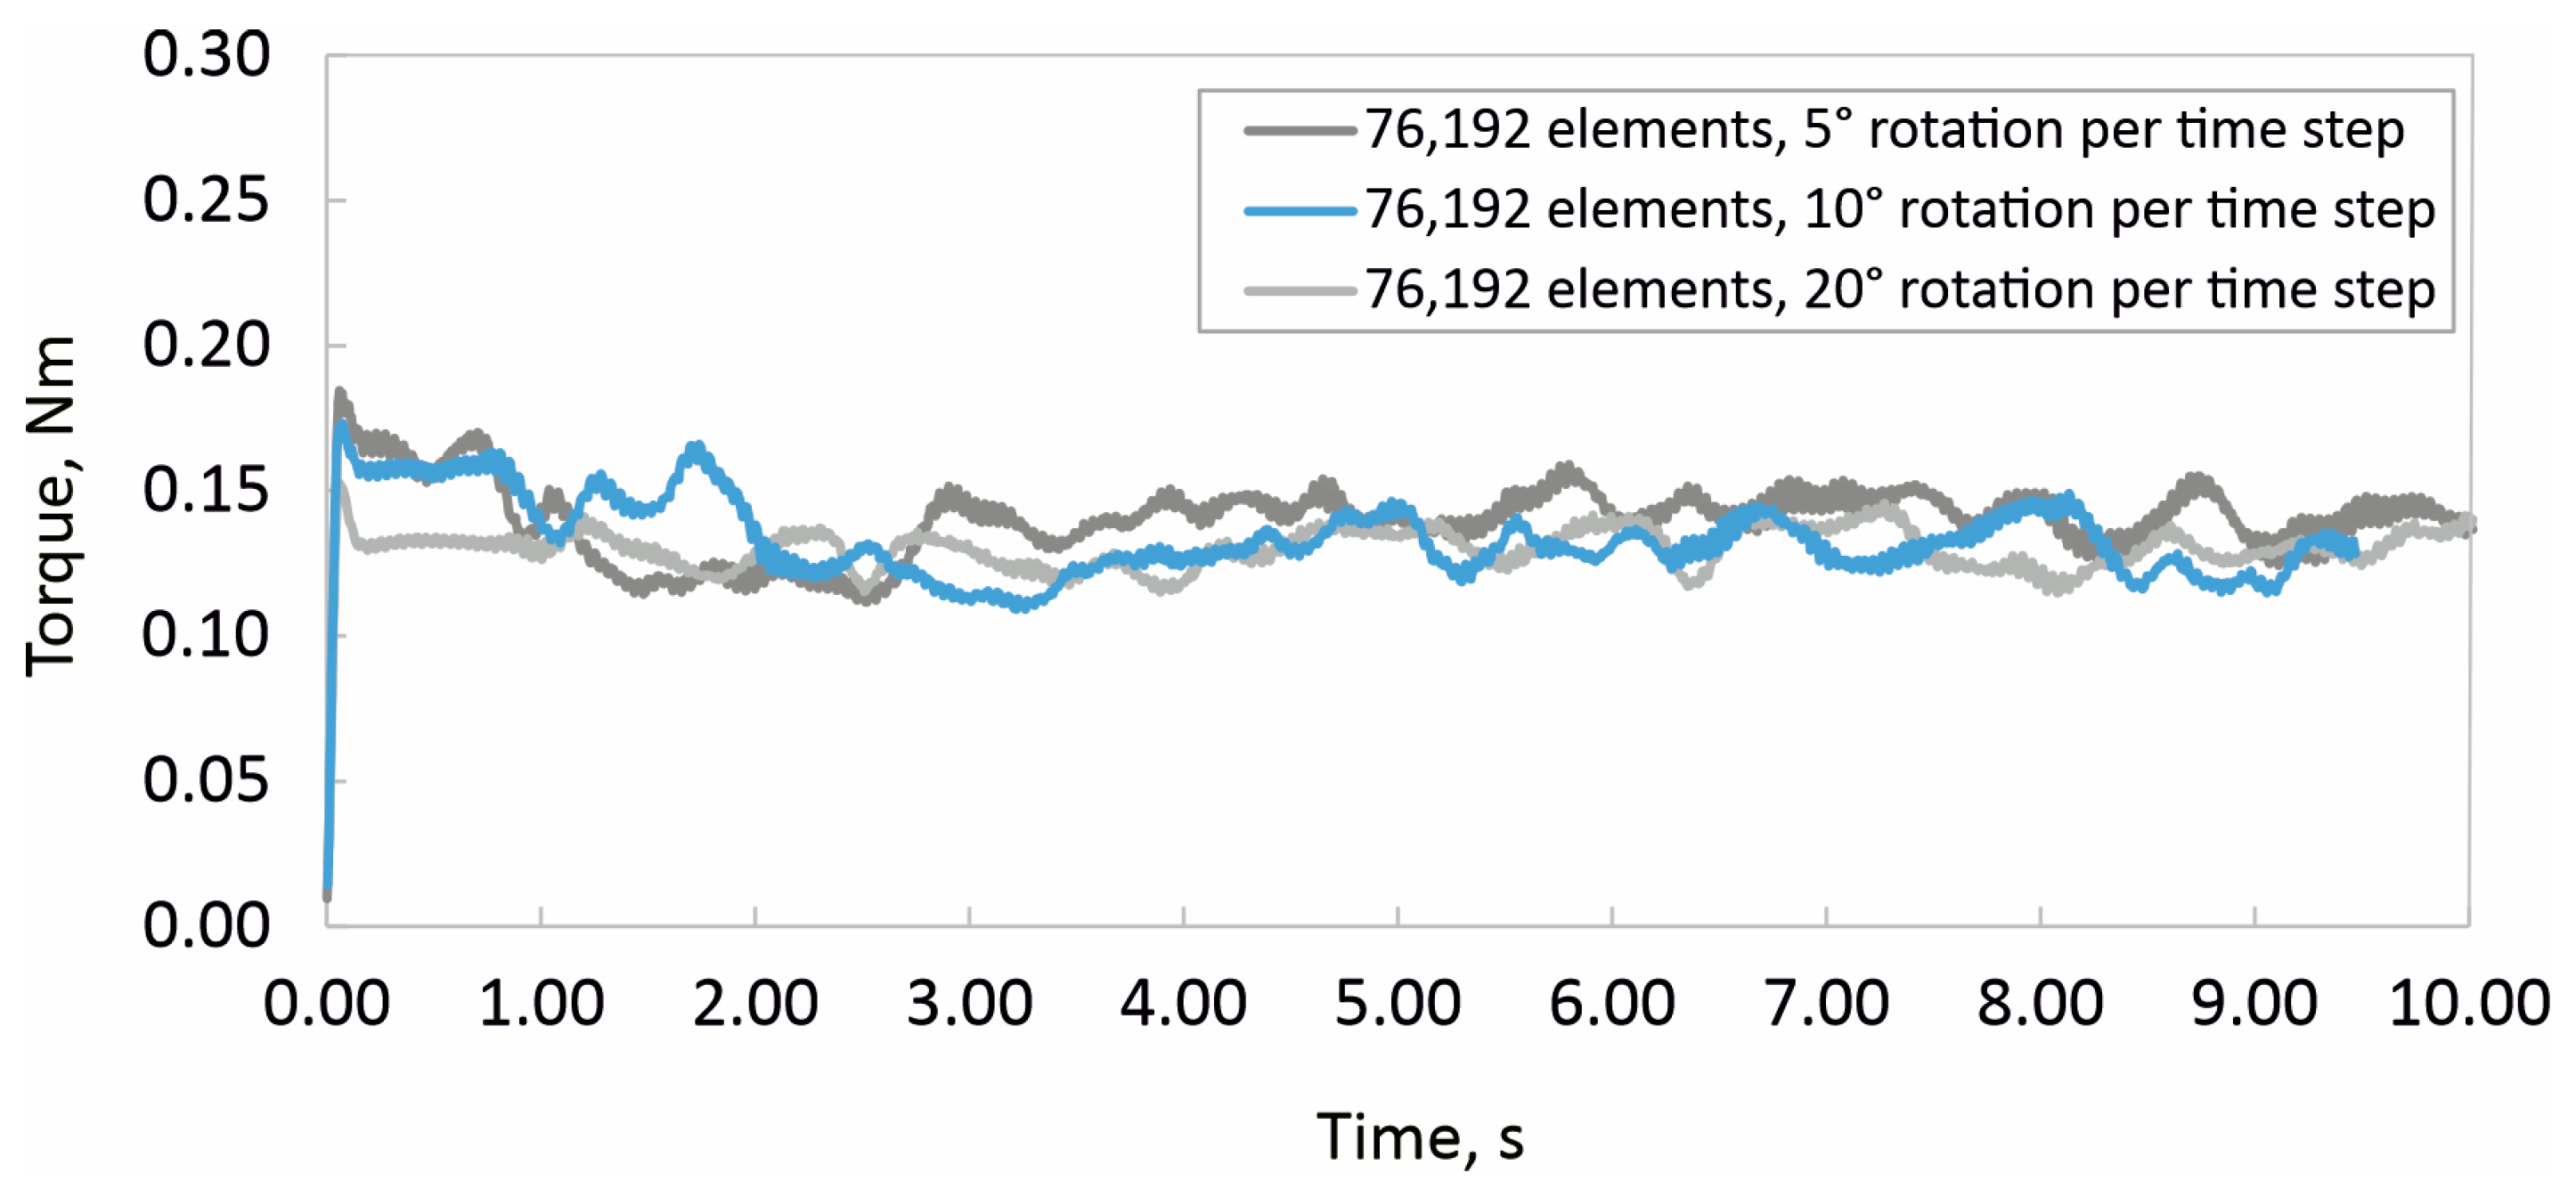
2.2. Experimental and Numerical Analyses of Hydrodynamics in the Crystallizer

Hydrodynamics in the crystallizer was analyzed experimentally by determining the mixing time and power input. The mixing time, t95, was defined in this paper as the time necessary for the system to reach and remain within ±5% of the of the new steady state value after the injection of a tracer (10 cm3 of 2 mol dm−3 NaCl solution) [22].
The power input was determined based on the measurement of torque imparted on the impeller shaft. The torque, τ, was measured by SPX Flow Lightnin LB2 LabMaster Mixer, L2U15U, with an accuracy of ±5%. Based on that data, power input was calculated according to the expression:
P = 2 π N τ
The complete experimental protocol to determine these parameters is extensively described in previously published papers [20,23].
A comprehensive understanding of the hydrodynamics in a dual-impeller system was carried out by developing a computational fluid dynamics (CFD) model using ANSYS™ Fluent v17.2. The calculations were executed utilizing an Intel Xeon(R) CPU E5-2680 v4 @ 2.40 GHz with 251.6 GB of RAM. Six processor cores were employed during the computations, and the convergence times varied based on the server load. The vessel geometry (Figure 2a) was created in ANSYS DesignModeler™, while discretization was conducted using the ANSYS Meshing™ software R17.2. Many problems in fluid mechanics, such as those described in this work, cannot be represented by a single frame of reference. For such types of calculations, the domain is discretized into multiple sub-domains with interfaces that separate the fluid domains. The regions encompassing the system’s moving components are defined as rotating reference frames, while the remainder of the sub-domains are set as stationary. The interfaces are then resolved using one of the two methods: (i) multiple reference frame (i.e., frozen rotor method) or (ii) sliding mesh methodology. The multiple reference frame method approximates the steady state, results in orders of magnitude faster convergence times (when compared to the sliding mesh method), and enables the setup of individual regions using different rotational or translational velocities. Flow equations are resolved in every reference coordinate frame. If the flow character is stationary, the equations are reduced to their stationary forms. On the interfaces between different reference frames, a local reference coordinate frame is defined to enable the utilization of variables of adjacent zones to calculate the flow variables on the interfaces corresponding to different reference frames. It can be noted that using multiple reference frames does not take into account the relative motion of the moving part in relation to the adjacent zones, which can be stationary or rotating, i.e., the finite volume mesh remains stationary at all times. This is analogous to freezing the rotating components in a specific position and monitoring the current flow variables; for this reason, this method is commonly referred to as the frozen rotor approach. This approximative method provides a reasonable prediction of flow variables for hydraulic machines where the interaction between the rotating and stationary frames is weak, and for a very simple flow distribution between the rotating and stationary domain. This approach is commonly used for mixing tanks where the interaction between the impeller and tank walls is relatively weak, and thus, non-stationary terms are negligible. However, in this work, the tank had baffles and the influence of baffles on the flow was non-negligible; therefore, the sliding mesh approach was used. The sliding mesh method uses two or more regions that are mutually connected using interfaces. The interfaces are mutually connected and overlap to a large extent, while the mesh elements are non-conformal. Through the interface, the relative motion of one mesh in relation to the other is enabled. Throughout computational calculations, two or more meshes rotate or slide relative to each other. While the meshes are moving, there is no requirement to couple the nodes at each step, since the interface serves this function. The drawback is that the relative motion must be of a sufficiently small step to ensure accurate results, leading to orders of magnitude higher calculation times when compared to the multiple reference frame approach. Considering that, in this work, the physical process was highly non-stationery, that the vessel (crystallizer) had baffles, and that different fluids were mixed and homogenization process was studied, the multiple reference frame method could not be applied because it only provides a steady-state solution. However, it can be used for cases where the mutual influence of the impeller(s) and tank is negligible.
Considering the stated above, the simulation case was set up by defining two fluid domains, the stationary (Figure 2b) and the rotating domains (Figure 2c). To extract the angular momentum on the blades of the impellers and the axis, a named selection was defined, shown in Figure 2d. To enable the utilization of the sliding mesh methodology, it was necessary to define the interfaces between the stationary and the rotating domains (Figure 2c) which overlap. The element sizing (Figure 3) on the interface was controlled to ensure that the difference in element size did not exceed a factor of 1.2, which is a common practice when using the sliding mesh method. The mesh between the stationary parts, as well as between the rotating parts, was conformal. However, the mesh between the stationary and rotating domains was not conformal and, since the sliding mesh approach was used, it was necessary to define the interfaces.
The rotation of the rotating domain was set up using mesh motion. The vertical axis was used as a reference and the rotating domains were set in motion. The rotating walls were set to revolve in the absolute reference frame with an angular velocity equal to the angular velocity of the rotating domains. Thus, they served as a boundary from which the resulting torque and mixing time were calculated.
To ensure precise calculations, the time step size was chosen to correlate to an angular motion of 5–20°, and the time step size and grid size were both tested to determine the required grid density and time step size to ensure accurate solution results.
Discretization, creating a suitable finite volume mesh, stands out as a crucial step in the simulation process since the convergence and accuracy of results of the differential equations (that describe the flow within the vessel) depend on it. Considering the vessel geometry was simple, a fully structured hexahedral instead of the tetrahedral mesh was generated in this paper to avoid unnecessarily high calculation times. Generally, when a tetrahedral mesh is used for this type of analysis, it is common to use over 1 million elements [23]. In this work, using the hexahedral mesh resulted in lower computational requirements and improved the solution accuracy, which was necessary due to the requirement for conducting the transient analyses. In the study, the mesh quality ranged between 0.93 and 1 (with a standard deviation of 0.12), where 1 represents a regular hexahedron. Smaller elements were required around the impellers due to the sudden changes in pressure gradient and velocity, which occur along the outer edge of the impeller blade. The smaller elements were also more densely distributed. In this work, the mesh consisted of 76,192 ± 5% elements. The number of elements was chosen based on the grid dependency study (shown in Figure 4).
A time-step dependency study was also performed for the selected grid density (Figure 5). A time step equal to the 10° rotation was used for all calculations for higher fidelity vs. 20°.
Both grid and time-step dependency studies were conducted for a randomly chosen SBT case, and the mesh setup (i.e., number of divisions) was used for all the remaining cases (i.e., impeller off-bottom clearances) investigated in this paper. It can be seen from Figure 4 that, for 46 k, 76 k, and 157 k elements, the averaged results after stabilization (after 5 s) are very close to each other, and the difference between 76 k and 157 k was lower than 5%. A similar was observed in the time-step dependency study at different time-step sizes. The finite volume mesh is shown in Figure 6. Given that the results were also experimentally validated (shown later in the text), the mesh quality can be considered satisfactory.
The transition shear stress transport (SST) model was adopted in this paper [24,25] (also known as γ - Reθ model). The transition SST model is one of the most used turbulence models. It is based on the coupling of the SST k - ω transport equations with transport equations for intermittency and transition onset criteria, in terms of momentum-thickness Reynolds number. The complete description of the model applied in this paper is available in a previous work [20] as well as in the Supplementary Materials.

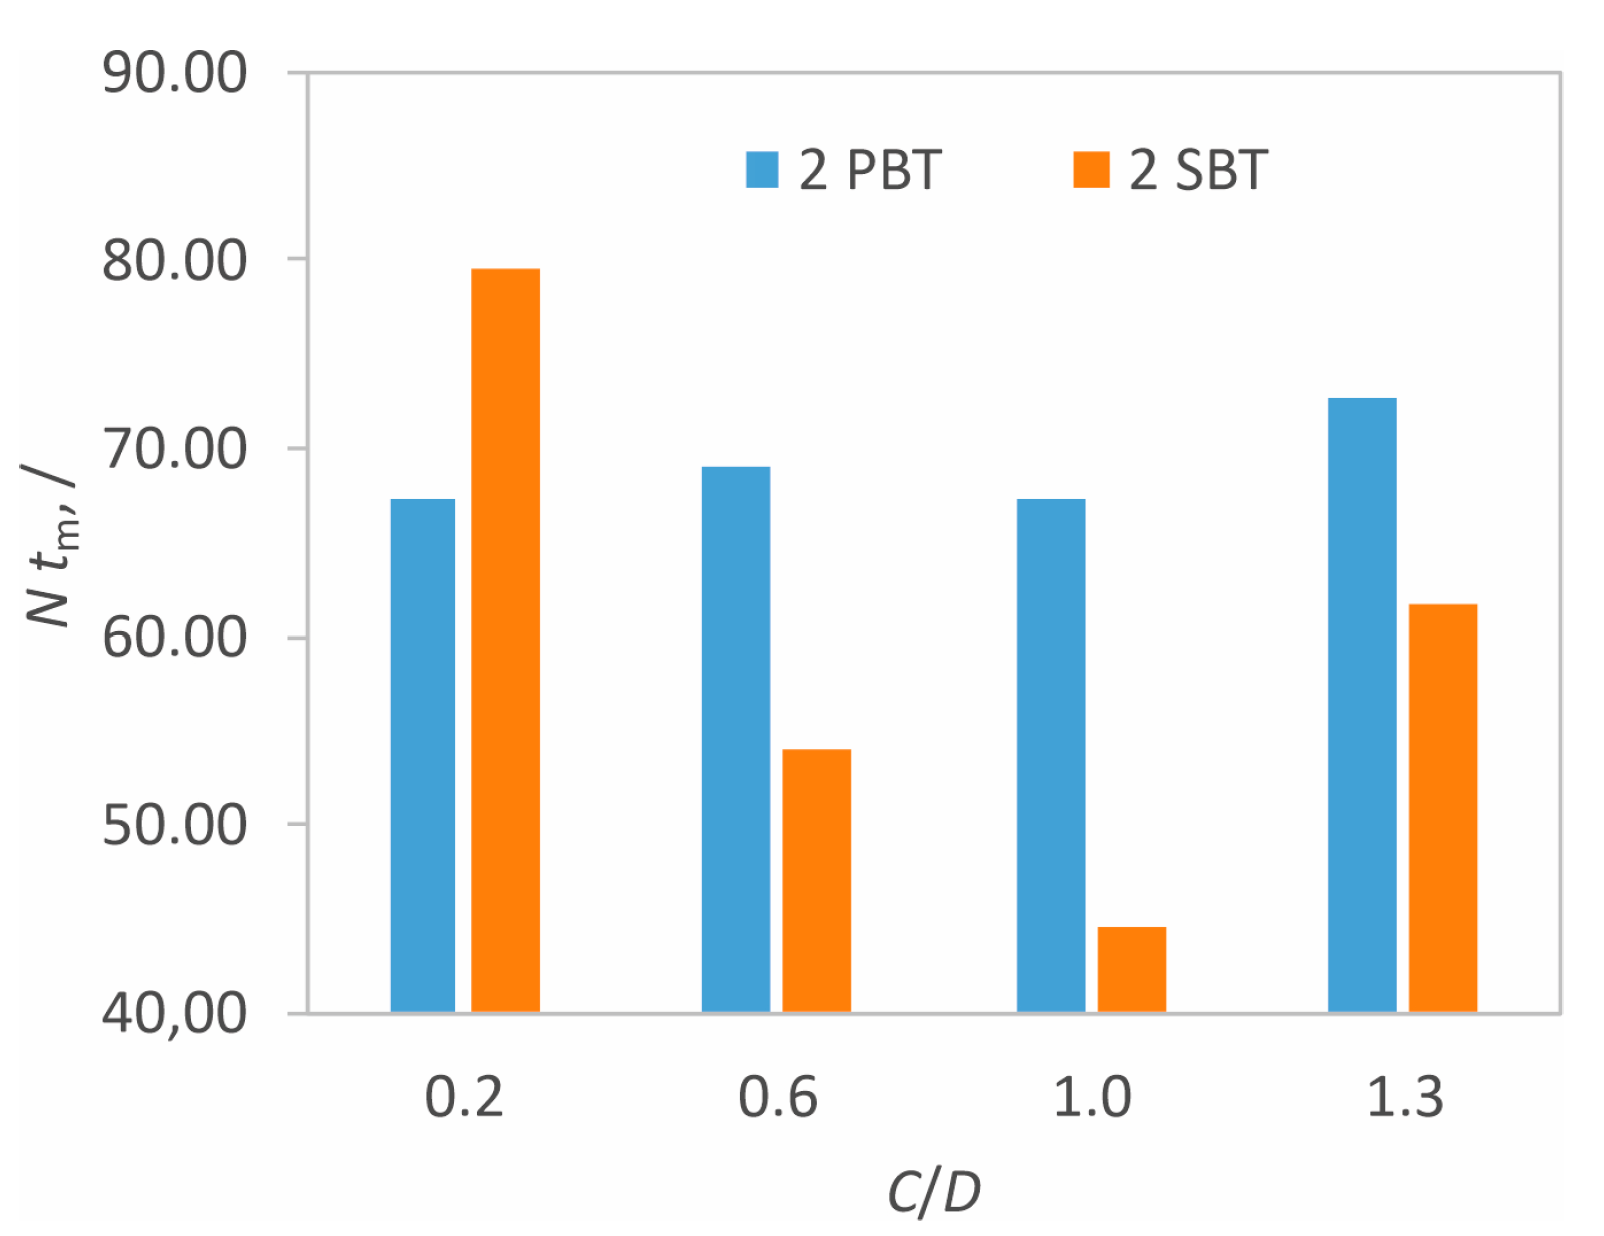
2.3. Experimental and Numerical Determinations of Mixing Time

The mixing time, t95, was determined in this paper as the time necessary for the system to reach and remain within ±5% of the new steady-state value after the injection of a tracer [26]. In this paper, a 10 cm3 of 2 mol dm−3 sodium chloride solution was used as a tracer, which was injected in the continuous phase just below the surface midway between the wall and the shaft. The change in potential of the solution was measured by a sodium ion-selective electrode, which was placed diametrically opposite to the injection point [27]. Based on this experimental setup, a CFD simulation was conducted by applying the volume of fluid method (for the details—please see the Supplementary Materials). Here, NaCl solution was injected in the form of a sphere/droplet, and its change in volume fraction in the opposite direction from the injected droplet was monitored across time, as shown in Figure 7.

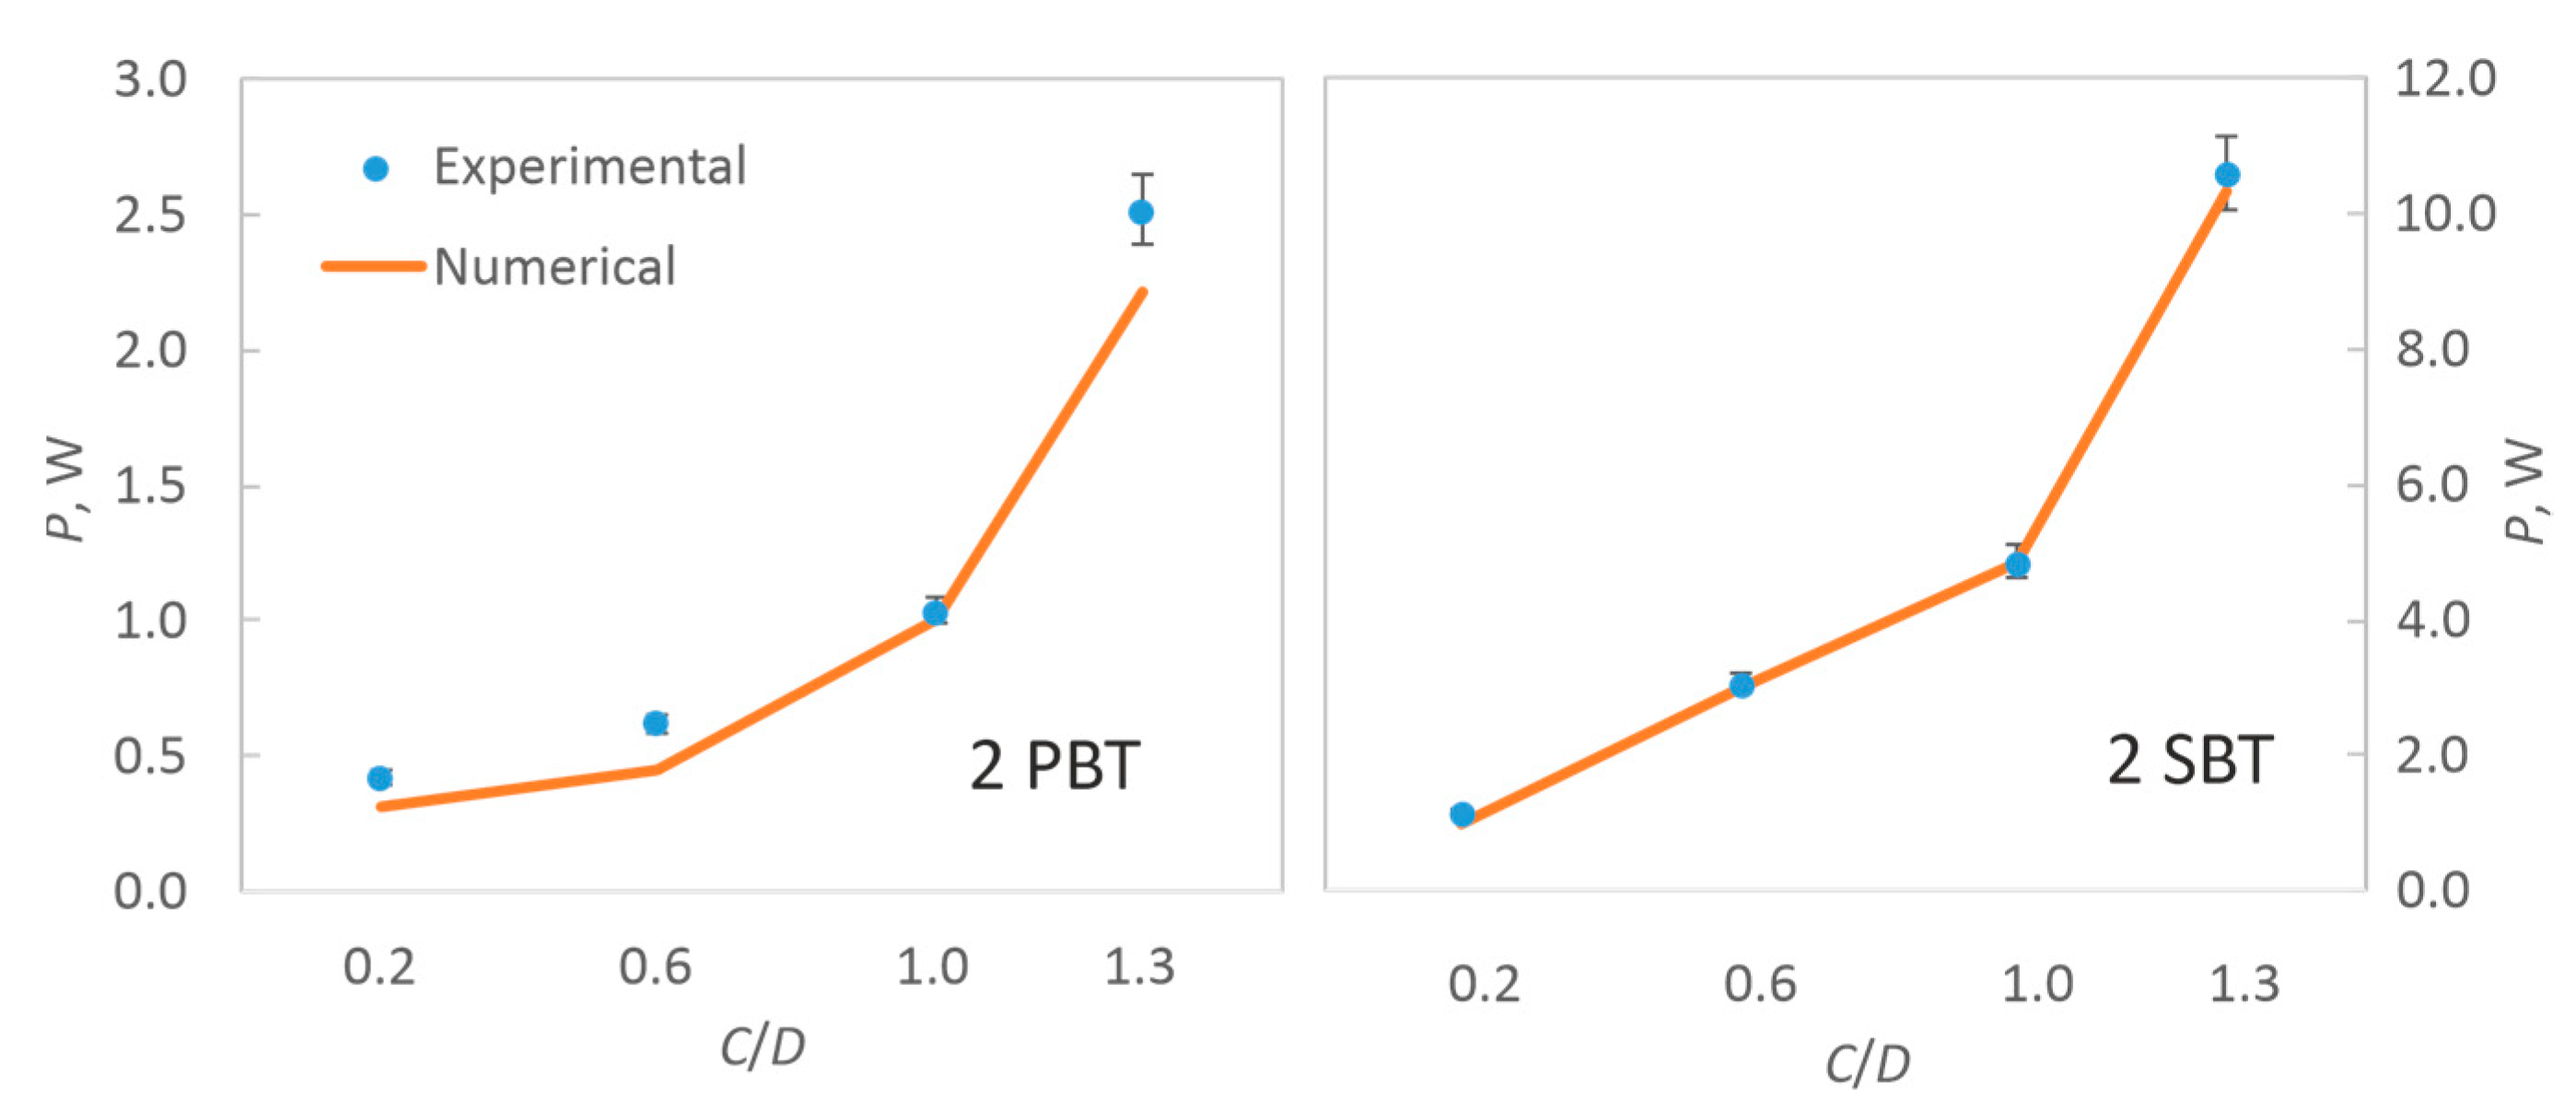
2.4. Experimental and Numerical Determinations of Power Input

A second mixing parameter that provided an insight into the nature of the mixing process in this system was power input. The power was experimentally determined based on the measurement of torque imparted on the impeller shaft. The torque, τ, was measured by Lightnin LB2 LabMaster Mixer, L2U15U, and the power input per unit mass (P/m) was calculated according to the expression:
P m = 2 π N τ m
Numerically, the torque was calculated according to the following expression:
C m = τ 1 2 ρ v 2 A L
where Cm is the momentum coefficient, which was determined by the CFD analysis. The values of density (2 kg m−3), velocity (1 m s−1), surface (1 m2), and length (1 m) in the denominator are the reference values set in the software.

3. Results and Discussion

Based on experimental and numerical investigations, it was possible to analyze the hydrodynamics in the vessel as well as its possible effect on nucleation kinetics and the properties of the final product of batch crystallization in a 15 dm3 dual-impeller crystallizer.

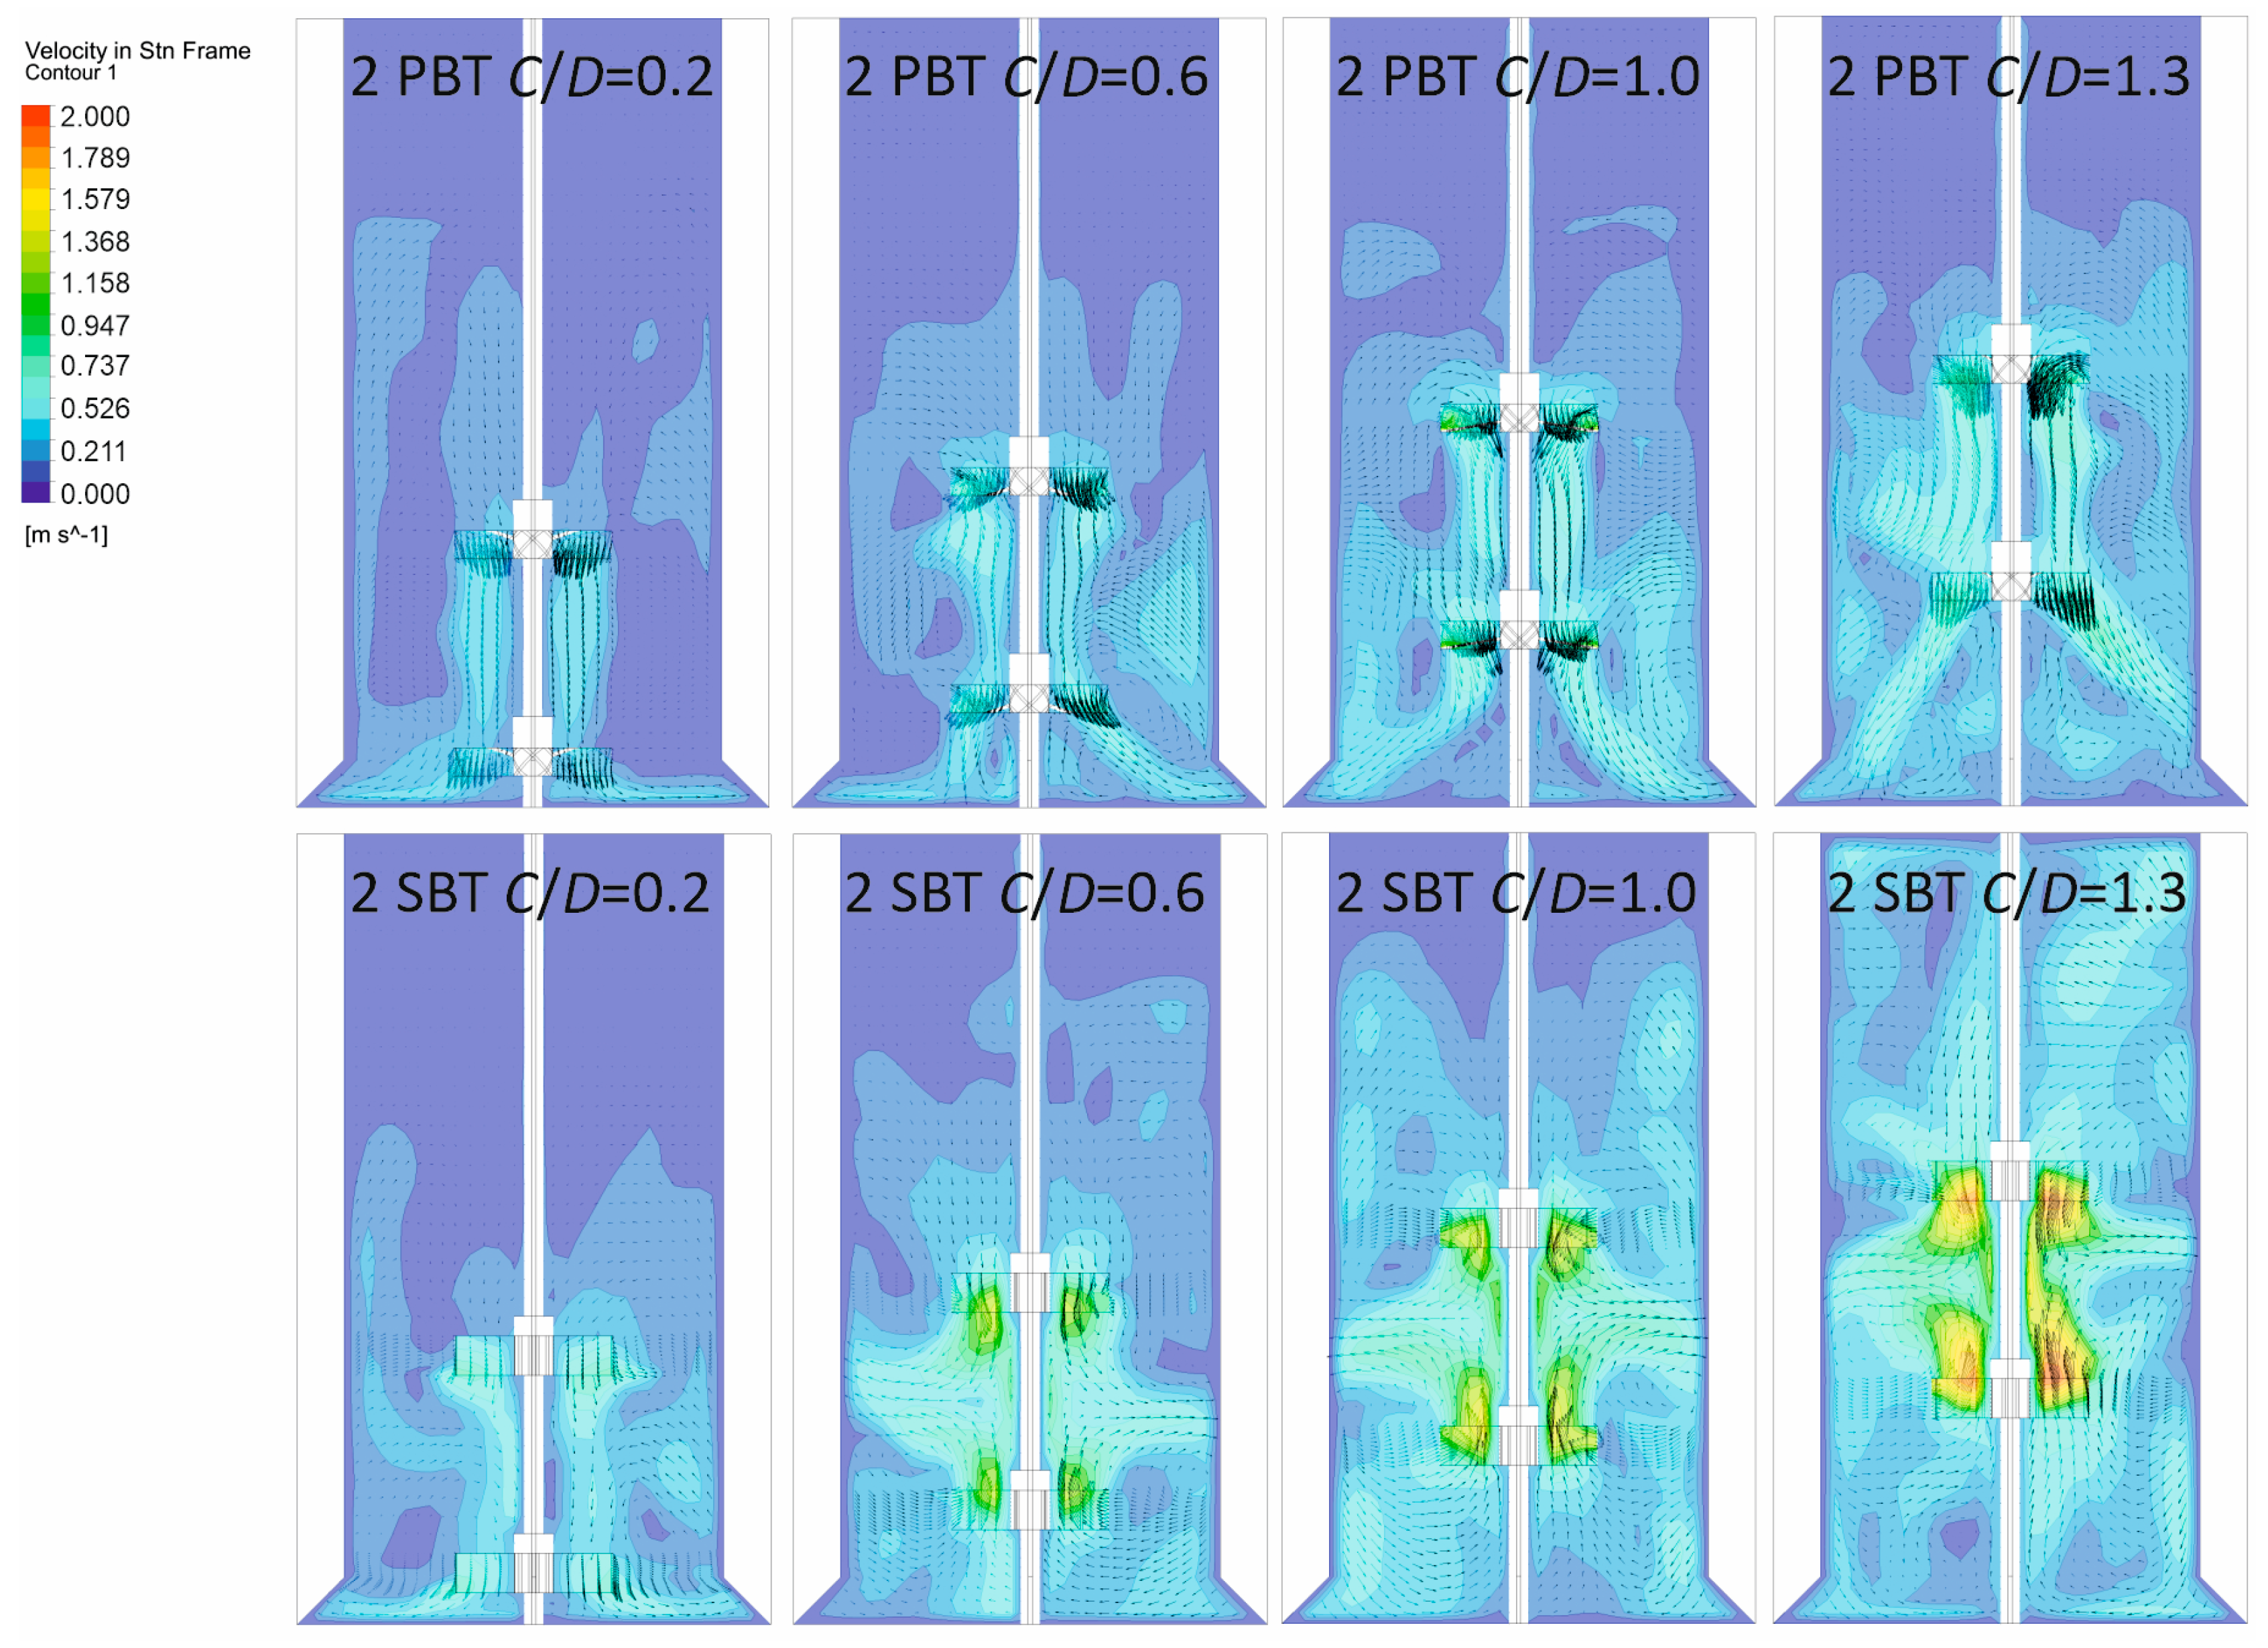
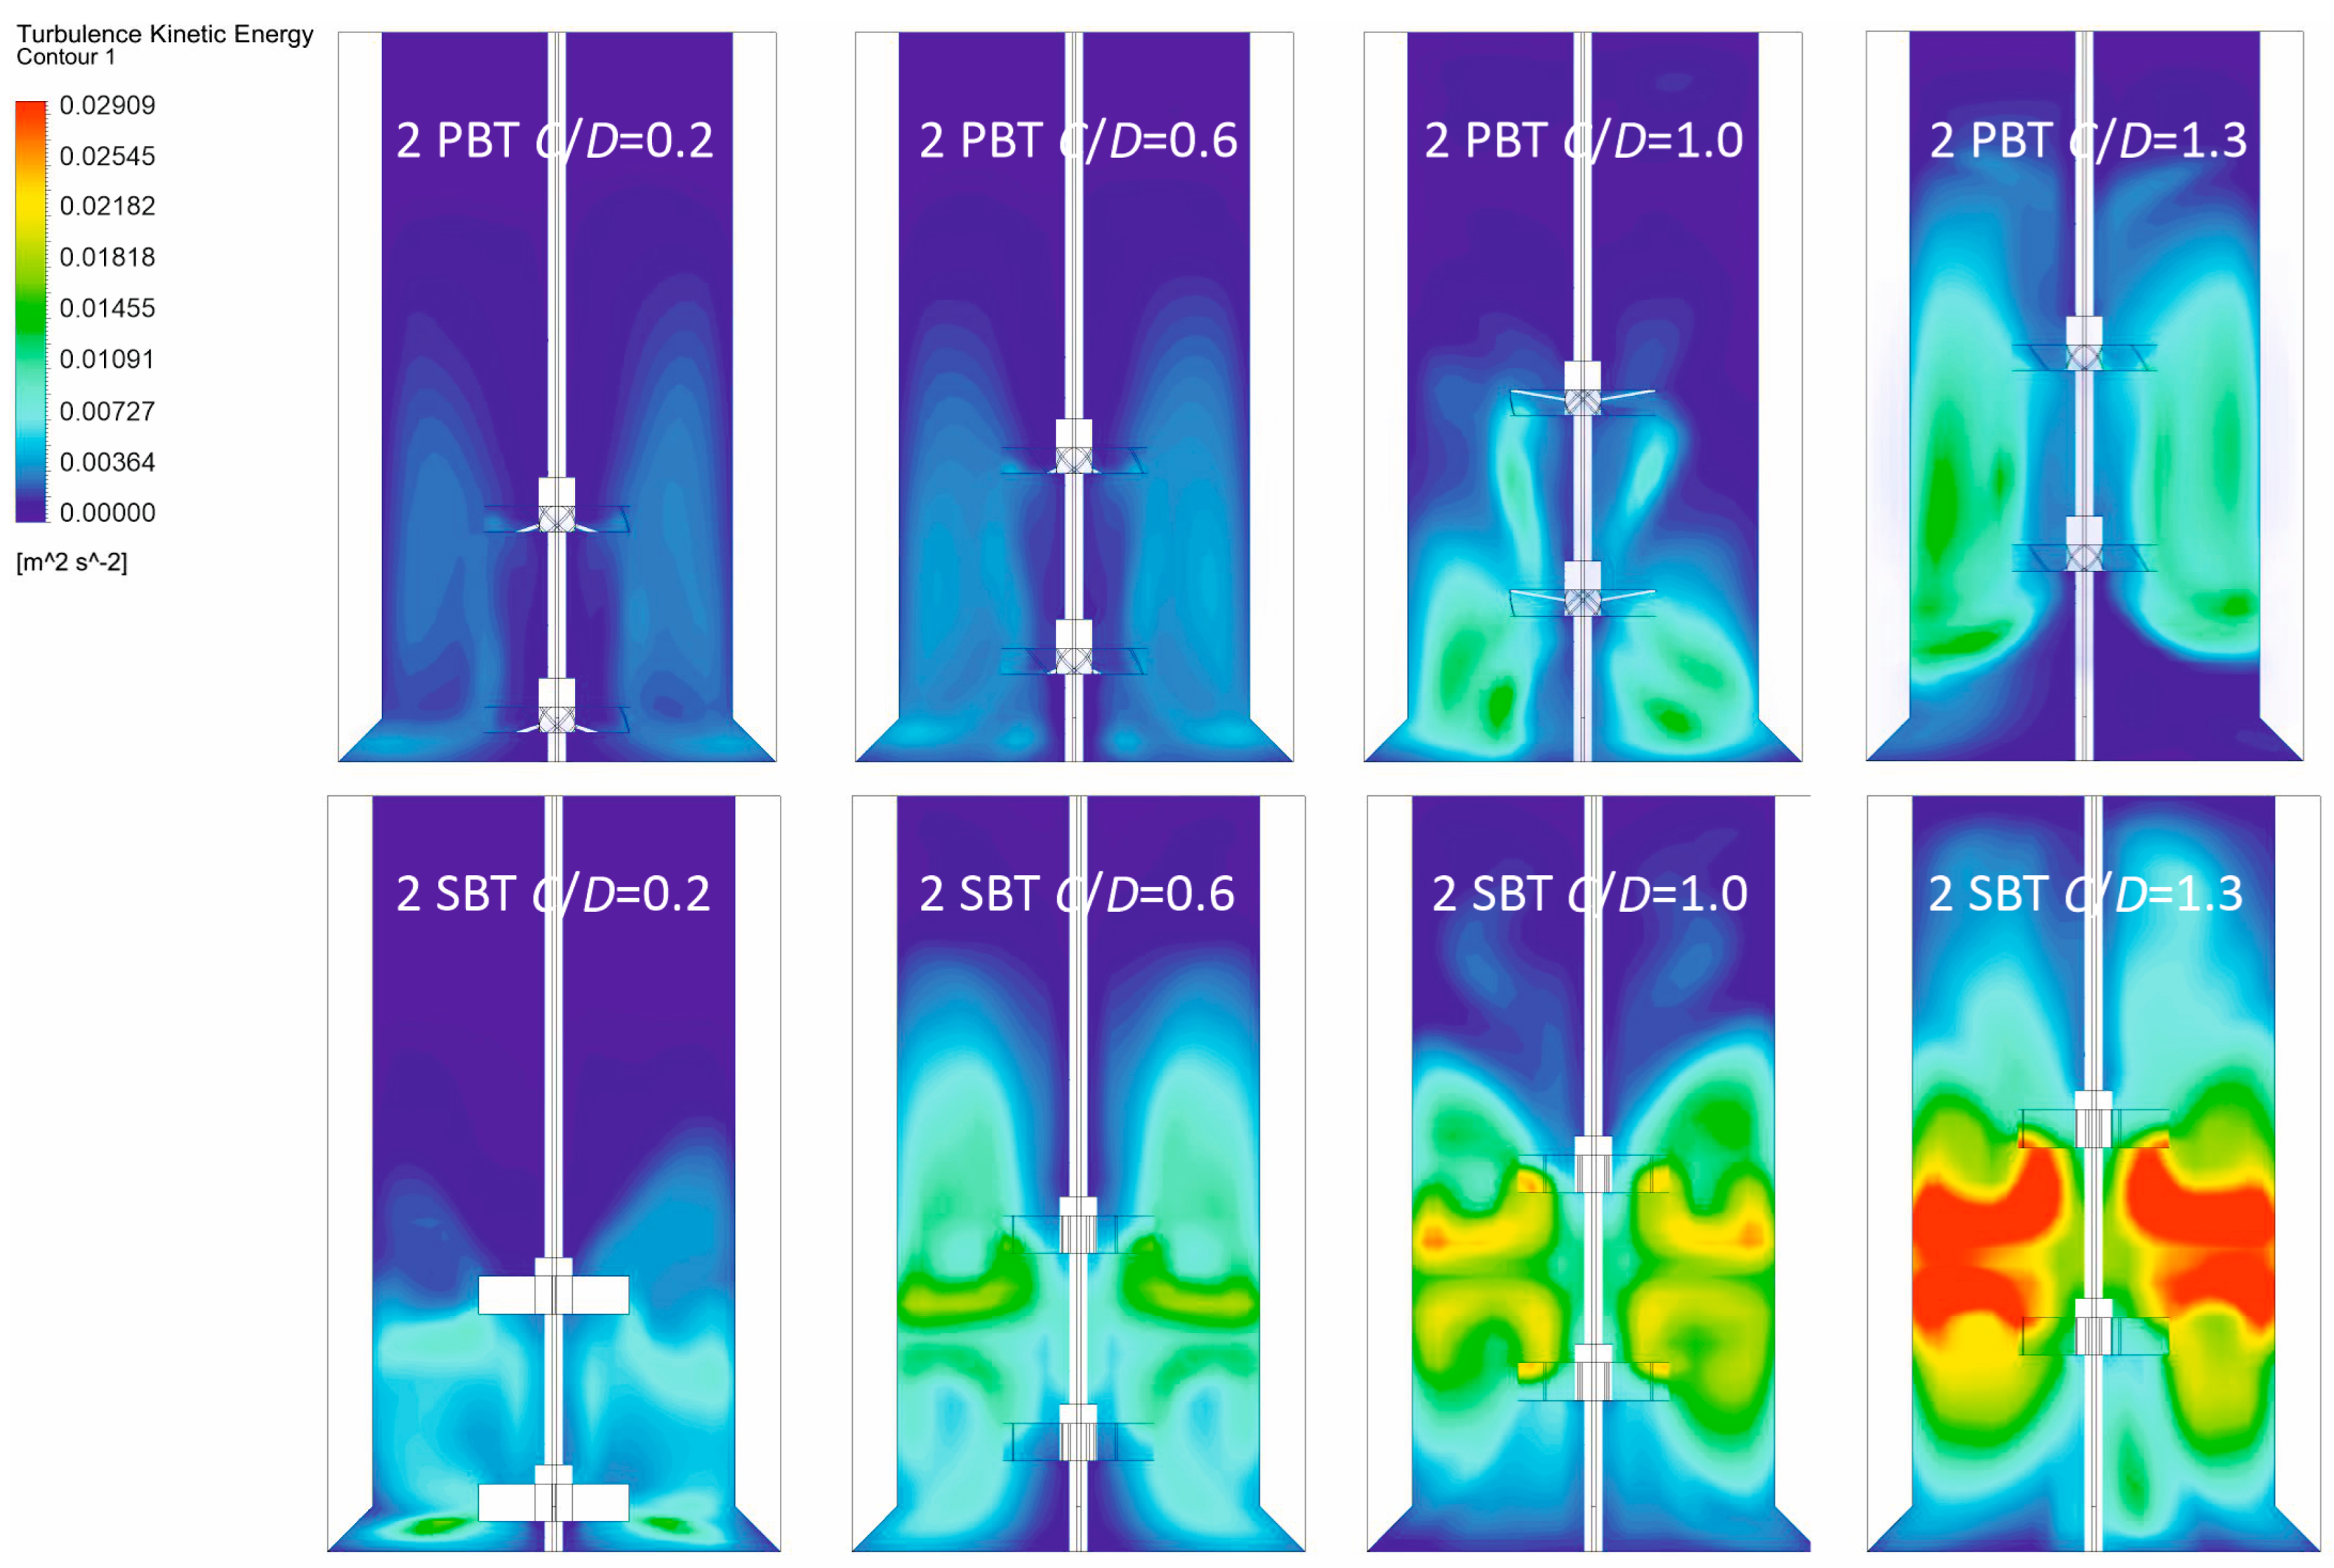
3.1. Hydrodynamic Conditions in the Vessel

The mixing time was used to quantitatively describe the bulk flow in the vessel. Figure 8 shows the experimentally determined mixing time values in the crystallizer. It is visible that, in both dual-impeller systems, the mixing time decreases with an increase in the impeller off-bottom clearance, indicating that the overall circulation generally improves at higher C/D.
While the mixing time in 2 PBT is almost perfectly linearly dependent on C/D, this was not the case in the 2 SBT impeller system. There, moving the impellers away from the vessel bottom decreased the mixing time value at C/D = 0.6 by approximately 50% compared to the C/D = 0.2. At the two higher positions (C/D = 1 and 1.3), the mixing time values were quite similar. If the dimensionless mixing time values are compared (Figure 9), it seems that the 2 SBT impellers have a better mixing effectiveness at almost all positions, compared to the 2 PBT configuration. Also, the impeller off-bottom clearance affects the dimensionless mixing time in the 2 SBT impeller system more than in the 2 PBT impeller system.
The second parameter, power input, was determined based on the measurement of the torque imparted on the impeller shaft. The results (Figure 10) show that the power input increases with an increase in the impeller off-bottom clearance. This was expected since, by distancing the impellers from the bottom of the crystallizer, higher impeller speeds (NJS) are required to achieve a state of complete suspension (see Table 1). A higher power input affects the hydrodynamic conditions in the vessel and, consequently, the properties of the final crystal product, which is discussed later in the text.
It should be noted that these two experimentally determined parameters describe the hydrodynamic conditions in the crystallizer only globally, by a single average value. But, in batch crystallization, the local gradients of fluid velocity, temperature, and supersaturation often play a key role [28]. Therefore, it is necessary to determine the contours or rather the distribution of the physical quantities of interest in the process area. This is why a CFD model was developed. The model was validated based on the experimental data on mixing time and power input, which are shown in Figure 8 and Figure 10, respectively. The model predicts the mixing time values with an average error of 2.49% in the 2 PBT impeller system and 6.14% in the 2 SBT impeller system. The power input is predicted with an average error of 16.9% in the 2 PBT impeller system and 4.96% in the 2 SBT impeller system. In both cases, the model predicts somewhat lower values of power input and mixing time, but considering the errors, it can be said that its accuracy is good and that it can be used to analyze hydrodynamics in a dual-impeller crystallizer. It should be noted that the model incorporates single-phase flow, considering that the aim of the work was to investigate the effect of hydrodynamics on nucleation kinetics. As is well known, crystals form by nucleation, when the mother liquor shifts from a homogeneous to heterogeneous fluid, i.e., suspension. However, the solid load at the moment of nucleation is negligible, since crystals take time to grow to the size visible by the naked eye. In these conditions, this happens approximately 10–15 min after nucleation, which is when the suspension becomes clouded. Up until that moment, the mother liquor appears as a single phase. Thus, a single-phase model was developed in this paper to describe the hydrodynamic conditions in the system until nucleation. In addition, it should be kept in mind that the model validation is based on the global variables, rather than the local ones as was conducted in previously published works by other authors [29,30]. While the validation could be performed by measuring local variables, for example, by employing the particle image velocimetry/laser-induced fluorescence (PIV/LIF) technique, or by the electrical resistance tomography (ERT), this was not feasible in this paper. Although this can be considered a limitation, this approach offers a relatively simple way to approximate the hydrodynamic conditions in the vessel with satisfactory accuracy, by simply measuring two basic global variables, and developing a CFD model that can be validated based on experimentally determined global values. This way, expensive and time-consuming experiments as well as the subsequent analysis can be replaced with a CFD model. Upon validation, the CFD model can be used to assess the local hydrodynamic conditions in order to find the suitable ones that will result in a crystal product of the desired properties.
Figure 11 shows the velocity contours in a stationary frame from which the fluid flow patterns can be analyzed. In the 2 PBT impeller system, at all investigated impeller positions the upper impeller directs the flow downwards where it is merged with the flow of the lower impeller. In all four cases, the highest velocities are observed around the impellers and along the shaft between the two impellers. The development of the secondary loop under the lower impeller is limited at C/D = 0.2, and at that position, large areas of lower velocities can be observed in the vessel. At C/D = 0.6, the lower impeller pumps the liquid at 45° to the vessel wall, causing the formation of two loops—the primary loop in which the fluid goes upwards, and the secondary loop in which the liquid recirculates underneath the lower impeller. A similar can be observed at C/D = 1.0 but with a better flow pattern where the areas of low fluid velocities are further decreased. At C/D = 1.3, a tertiary loop forms below the lower impeller, causing a reduction in the secondary one. The liquid recirculates in the tertiary loop, at the bottom of the vessel, causing an increase in the dimensionless mixing time.
In the 2 SBT impeller system, fluid velocities are generally higher than the ones observed in the 2 PBT. As the impellers are moved away from the bottom, the velocities increase. At C/D = 0.2, only one loop can be observed, and it seems that at this position the resulting flow pattern resembles the flow pattern created by one larger impeller. At all other positions, two loops are formed. The upper impeller loop is the biggest at C/D = 0.6 and tends to decrease as the off-bottom clearance is increased. The opposite is observed regarding the loop created by the lower impeller. Unlike in 2 PBT, in the 2 SBT impeller system, the upper and lower impeller streams are directed towards each other; they “collide” and redirect to the vessel wall.
Besides fluid flow patterns and velocity distribution, turbulence kinetic energy and eddy dissipation rate at different off-bottom clearances were analyzed in this paper as well. The sum of the three fluctuating velocity components in x, y, and z directions is summarized in turbulence kinetic energy (TKE):
T K E = 1 2 u 2 ¯ + v 2 ¯ + w 2 ¯
which respresents the mean kinetic energy expressed per unit mass. Turbulence kinetic energy contour plots are shown in Figure 12.
As can be seen, as the impeller off-bottom clearance increases, TKE increases in both dual-impeller systems. In 2 PBT, the lowest levels of TKE are observed when the impellers are positioned closer to the vessel bottom (C/D ≤ 0.6). At C/D = 1.0, the areas of higher TKE values are concentrated below the lower impeller. On the other hand, at C/D = 1.3, the bottom of the vessel is characterized by a lower TKE, while the region of highest TKE observed in 2 PBT is visible between the two impellers.
The 2 SBT impeller system is characterized by generally higher TKE values than the one observed in the 2 PBT impeller system at the same impeller off-bottom clearance. Here, TKE increases significantly at C/D ≥ 1.0, suggesting the highly chaotic and energy-dissipative nature of the flow in that area. It seems that TKE is distributed most evenly within the entire vessel at C/D = 0.6.
A higher TKE is usually associated with a higher shear stress, which needs to be taken into account, especially when suspensions that are being mixed are shear-sensitive. While crystallization as a process is not inherently considered shear-sensitive, shear forces can affect nucleation and crystal growth [31], ultimately affecting the properties of the final product. It should be noted that shearing action in a mixing vessel is a direct result of mixing. The energy that is being input by the impeller is transformed into TKE, which is then cascaded down to the Kolmogorov scale, the process known as turbulence energy cascade, where it dissipates as heat. Turbulence eddy dissipation contours are shown in Figure 13.
As can be seen, turbulence eddy dissipation increases with the increase in impeller off-bottom clearance. In 2 PBT, eddy dissipation is almost negligible at the two lower impeller positions (C/D < 1). At the highest off-bottom clearance investigated here, the dissipation of energy is negligible at the bottom of the vessel, which was not the case at 2 PBT C/D = 1. In 2 SBT energy dissipates mostly between the two impellers, with TED being significantly higher at C/D = 1.3 than at any other impeller off-bottom clearance. Turbulence eddy dissipation can be expressed by a global parameter, the eddy dissipation rate. Considering that the power was not distributed evenly throughout the entire vessel volume, but rather it was dissipated mostly around the impellers, the eddy dissipation rate was calculated by [31]:
ε = P ρ D 3
A comparison of the dissipation rate in both systems is shown in Figure 14. The eddy dissipation rate in 2 SBT impeller system is approximately 4× higher than that in 2 PBT at almost all positions. Overall, it can be said that turbulence kinetic energy (TKE) and turbulence eddy dissipation (TED) could be considered as indirect measures of shear stress in the vessel. This means that, in areas with high TKE and TED values, shear stress is likely to be high as well.

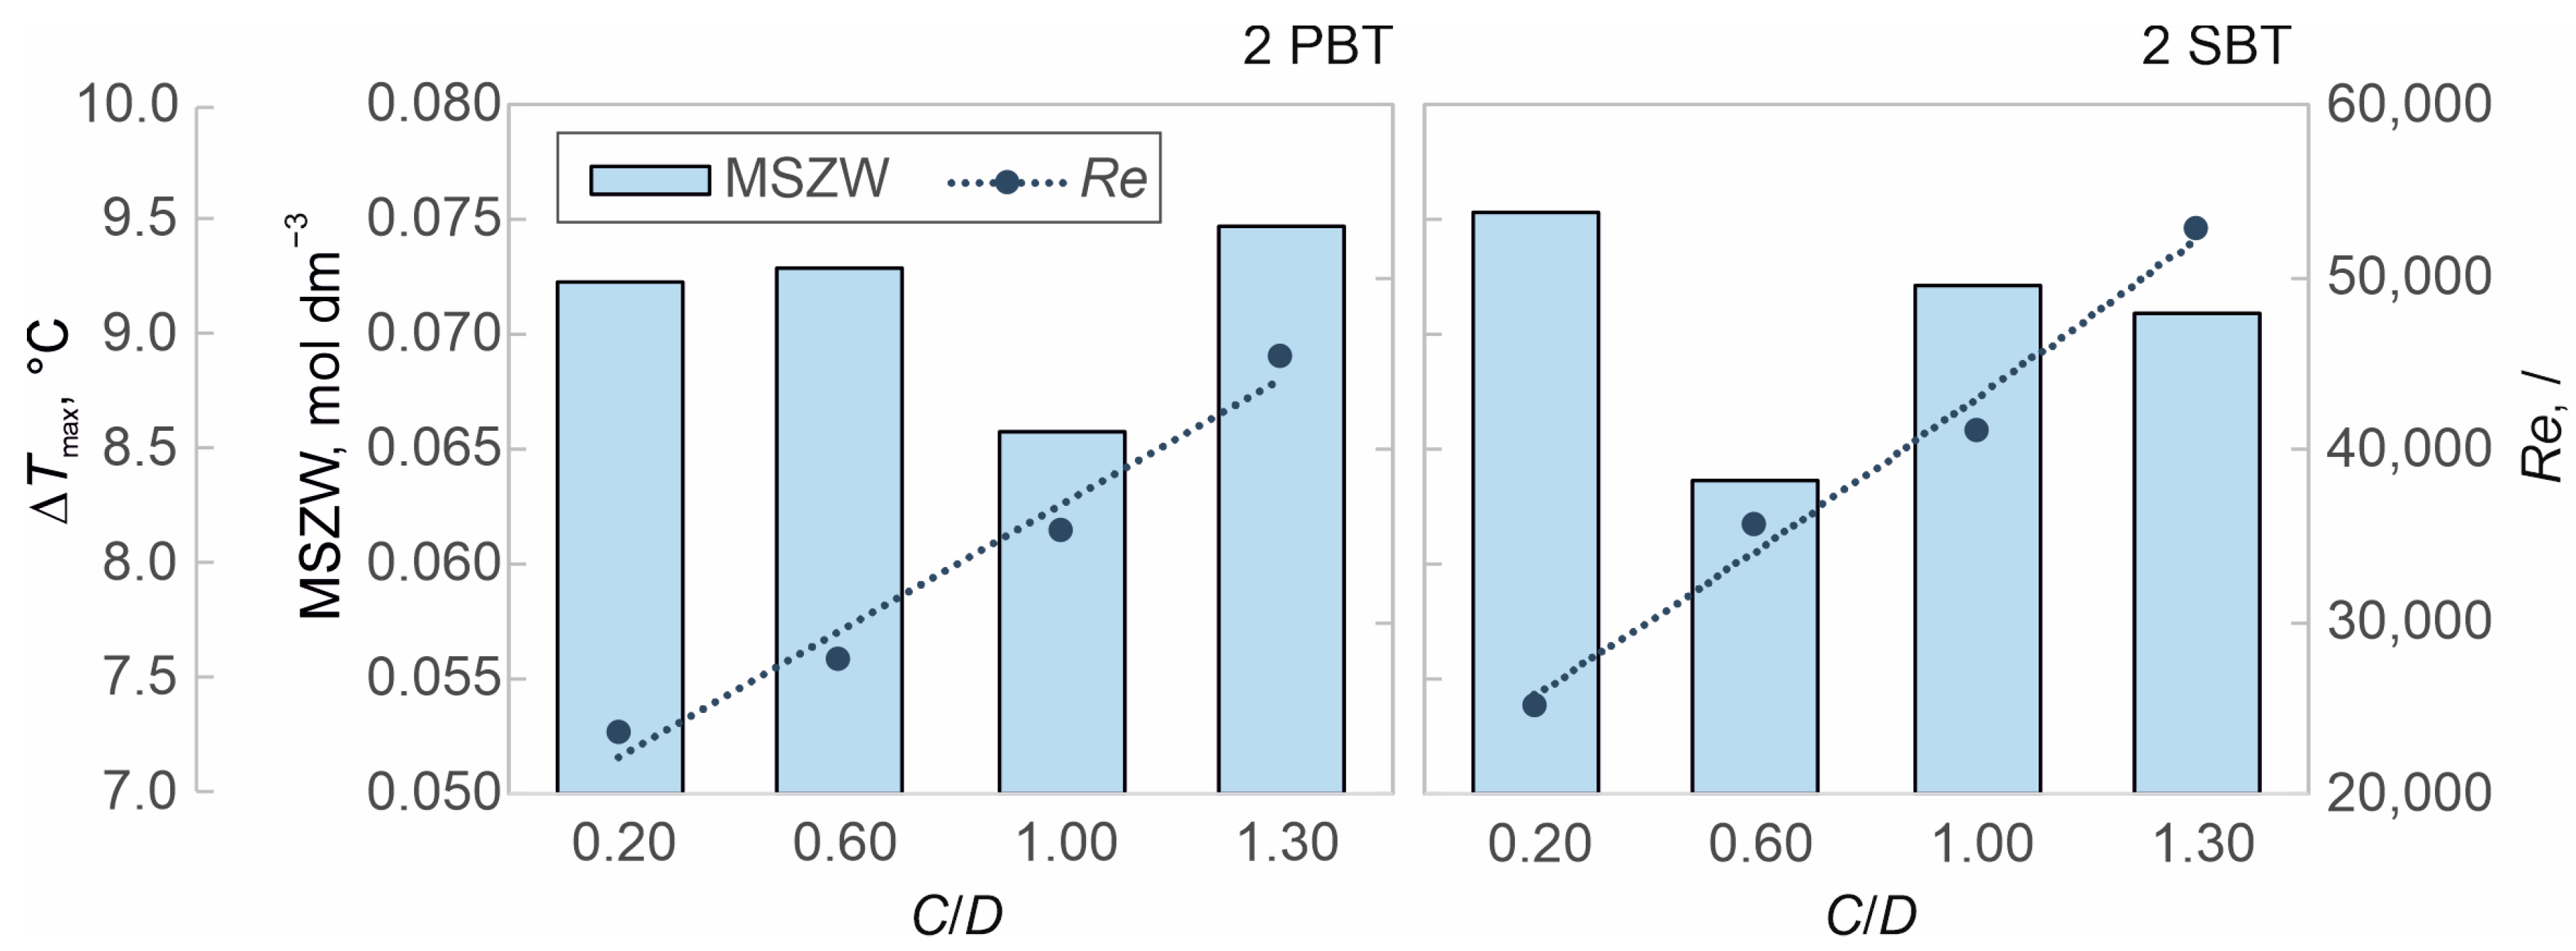
3.2. The Effect of Hydrodynamics on Nucleation Kinetics at Different Off-Bottom Clearances

The main goal of this paper was to assess a possible effect of hydrodynamics on nucleation kinetics and final product properties of borax decahydrate in dual-impeller crystallizer. As described earlier, crystallization was conducted by controlled cooling at 6 °C/h. It should also be noted that the crystallization was unseeded, and thus, nucleation occurred spontaneously.
In crystallization, supersaturation is the driving force, and monitoring the value of the driving force during process time is the very first step in ensuring a successful process control. Supersaturation is defined as the difference in chemical potential between supersaturated and saturated solutions, which can be expressed in solute activities [32]. But for simplicity, it is often approximated by absolute supersaturation, ∆c, which represents a difference in concentrations between saturated, c*, and supersaturated solution, c, as described before. The supersaturation profiles for all impeller clearances in 2 PBT and 2 SBT impeller systems are shown in Figure 15. The rise in supersaturation is not shown here, except provisionally (see supersaturation (full profile)), since the rise in supersaturation is affected solely by the cooling rate and salt solubility [33,34], both of which were kept constant in this work. As can be seen from the figure, after nucleation, supersaturation decreases over process time, and this occurs as a consequence of crystal growth.
If inspected closely, overall, supersaturation values are quite similar in 2 PBT at all impeller positions, except at C/D = 1. On the other hand, in 2 SBT, the effect of impeller off-bottom clearance was more pronounced. There, an increase in C/D resulted in the shift to the left-hand side, suggesting that ∆c is somewhat lower at higher off-bottom clearances. Varying the impeller off-bottom clearance also affected the maximum value of supersaturation, which corresponds to the metastable zone width (MSZW). MSZW represents one of the most important process parameters in batch crystallization since it defines the range of operating conditions under which the process should be conducted. MSZW was determined visually with a standard deviation within 0.16 °C (0.08–0.12 °C in 2 PBT and 0.05–0.16 °C in 2 SBT). It is shown in Figure 16, where it is also expressed in terms of the maximum supercooling, ∆Tmax.
The values of MSZW are shown along with the Reynolds number. It should be emphasized again that, considering that crystallization takes place in a suspension, all experiments were conducted at the same suspension state—i.e., the state of complete suspension, rather than at the same impeller speed. The Reynolds number is shown in Figure 16 since an increase in Re usually results in an earlier onset of nucleation, i.e., a narrower MSZW as reported for single-impeller systems [35,36]. However, in this investigation, an increase in the Reynolds number affected the MSZW differently in these two investigated systems. Based on the data shown in Figure 16, an increase in the impeller off-bottom clearance generally results in a slight increase in MSZW in 2 PBT, while it is the reverse in 2 SBT. Two exceptions to these rules are visible in both dual-impeller systems. Namely, at C/D = 1 in 2 PBT and at C/D = 0.6 in 2 SBT, metastable zone widths are narrower than expected, meaning that nucleation occurred earlier in the process time. At all other positions, except these two, nucleation occurs within 0.4 °C in 2 PBT and 0.7 °C in 2 SBT, which is quite close to each other. This suggests that hydrodynamic conditions at C/D = 1 in 2 PBT and at C/D = 0.6 in 2 SBT were such that they facilitated nucleation earlier in the process time.
In order to determine the nucleation rates, firstly, the nucleation mechanism was determined by the Mersmanns’ criterion explained in detail in a previous work [20]. In this paper, nucleation started by the heterogeneous nucleation mechanism, which is more common than the homogeneous one. The nucleation rate was then calculated by the formula proposed by Schubert and Mersmann [37]:
N h e t = 0.965 φ h e t D A B d m 5 c m a x c c 7 3 f ln c c c * exp 1.19 f ln c c c * 3 υ ln S 2 .
where ρhet is the heterogeneity factor [/], f is the correction factor [/], while DAB is the diffusivity constant [m2 s−1], dm is the diameter of molecule of borax [m], υ is the number of ions in a molecule of borax decahydrate [/], cc is crystal molar density [kmol m−3], c* is solubility at a given temperature [kmol m−3], and S is relative supersaturation ratio [/]. The diffusivity constant was calculated by the Stokes–Einstein law of diffusion in solutions. The nucleation rates for all investigated experimental conditions are presented in Table 2.
As can be seen from the figure, the nucleation rates (Nhet) follow a similar trend as observed with MSZW. An increase in C/D results in an increase in Nhet in 2 PBT, while it was the opposite in 2 SBT impeller system. Again, two exceptions to these rules are visible at at C/D = 1 in 2 PBT and at C/D = 0.6 in 2 SBT. Considering the range and standard deviation of Nhet values, it can be said that the effect of the impeller off-bottom clearance on the nucleation rate is more pronounced in the 2 SBT impeller system than in the 2 PBT impeller system. But, the question remains—why was the MSZW and, consequently the nucleation rates, lower at C/D = 1 in 2 PBT and at C/D = 0.6 in 2 SBT than at any other impeller position examined? Considering that all other process conditions were kept constant, it can be said that these were caused by the variability in the hydrodynamic conditions generated at different off-bottom clearances.
Even though the range of the examined C/D is limited in this pilot study, the acquired data suggest that the effect of hydrodynamics cannot be assessed only through one global parameter, such as the Reynolds number. In order to understand the effects of hydrodynamic, besides the global hydrodynamic values, their distribution within the vessel needs to be taken into account as well. In this work, these included the fluid flow velocities, turbulence kinetic energy (TKE), and turbulence eddy dissipation (TED) contours, which are extensively described above.
To explain why MSZW and Nhet values were lower at C/D = 1 in 2 PBT and at C/D = 0.6 in 2 SBT than at all other off-bottom clearance in both respective dual-impeller systems, all three investigated hydrodynamics factors (fluid velocities, TKE, and TED) were taken into account.
In the 2 PBT impeller system at C/D = 1, the velocity distribution was mostly uniform, without extreme values between the two impellers. Also, the mixing time values were among the lowest ones in the examined range of conditions, indicating that circulation in the vessel was good. While mixing time values were similar for C/D = 1 and C/D = 1.3, it should be noted that the power input (and consequently the eddy dissipation rate) is 2.5 × higher at C/D = 1.3 than at C/D = 1. In addition, TKE contours shown in Figure 12 suggest that the turbulence kinetic energy was distributed evenly, without the areas of low TKE between and below the impellers, when impellers were positioned at C/D = 1. It is important to emphasize again that the area between the impellers is interesting since it is assumed that the formation of a critical nucleus occurs exactly there. The assumption is based upon a fact that fluid velocities are the highest near the impellers, ensuring the fastest mass transfer rates, which is crucial in crystallization. Regarding the area at the bottom of the vessel, it is necessary to avoid a low velocity and TKE zones to ensure an appropriate level of mixing. Considering the eddy dissipation rate and TKE and TED distributions, which indicate the areas of high shear stress within the vessel, it can be said that, within the investigated range of off-bottom clearances, optimal hydrodynamic conditions were achieved at C/D = 1, which resulted in an earlier onset of nucleation than at any other position in the 2 PBT impeller system.
Similarly, in 2 SBT at C/D = 0.6, the mixing time was on the lower end range, indicating that, at that position, the circulation was among the best ones observed. Also, the TKE and TED contours suggest that the kinetic energy and shear stress were optimally distributed between and below the impellers without extreme values, which were observed at all other positions. Overall, it seems that a combination of all of these hydrodynamic parameters contributed to the generation of optimal conditions that favored the earlier onset of nucleation.

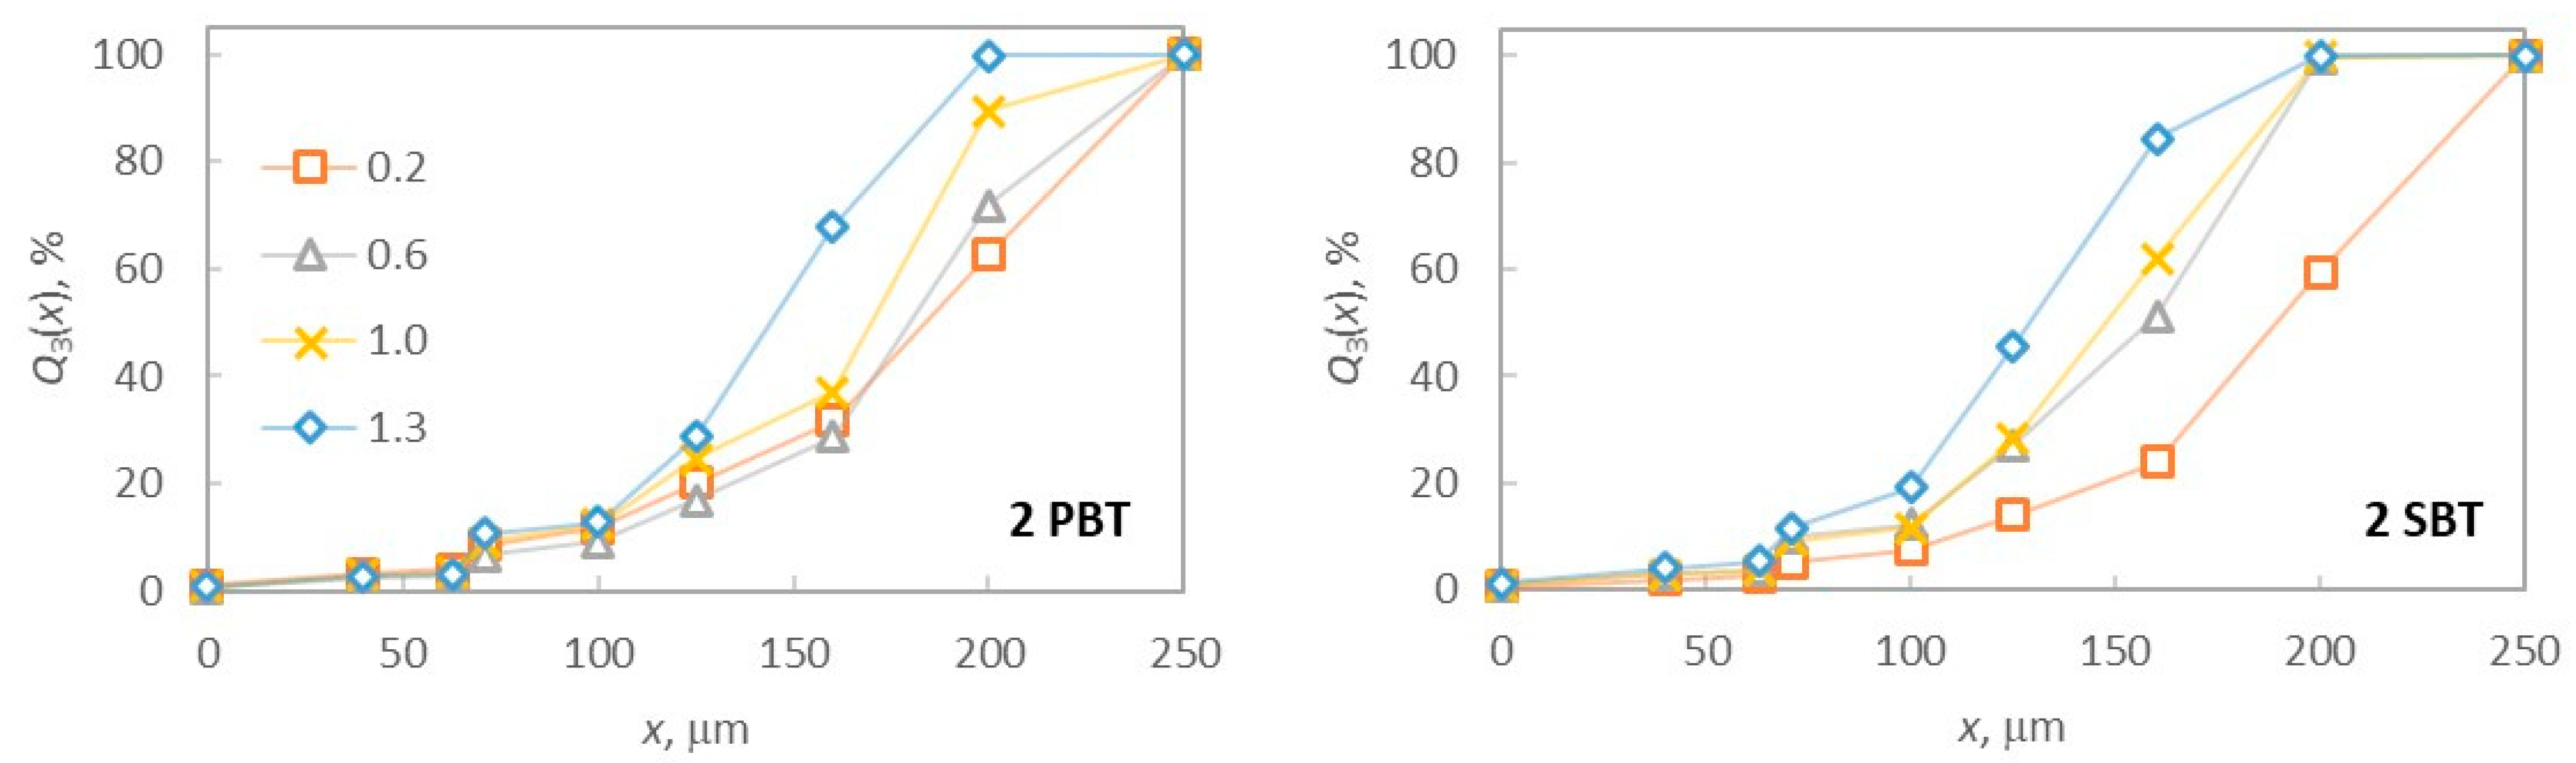
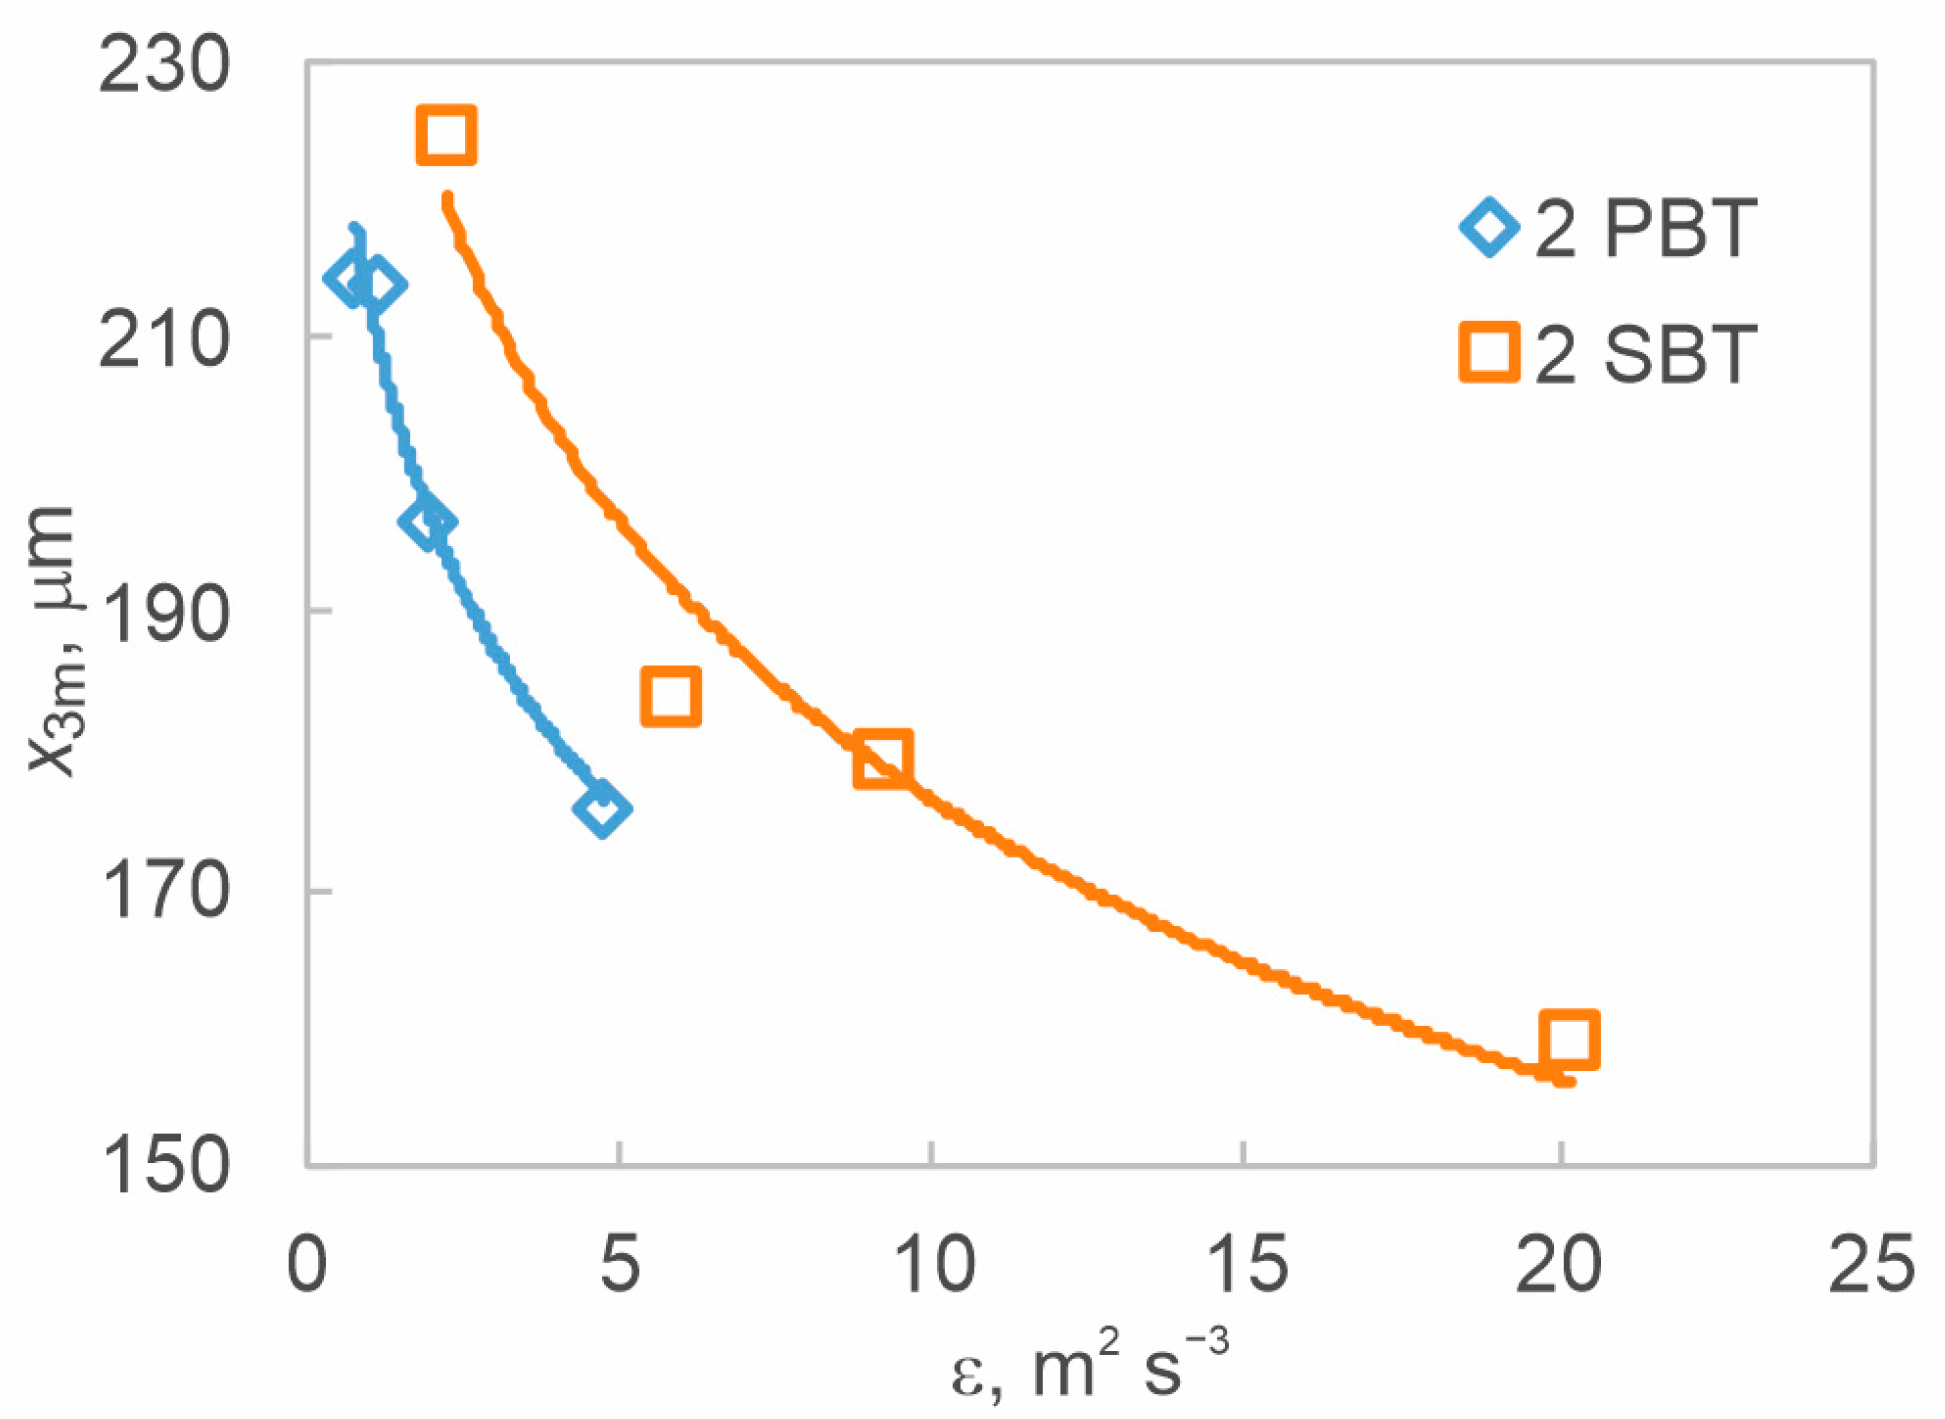
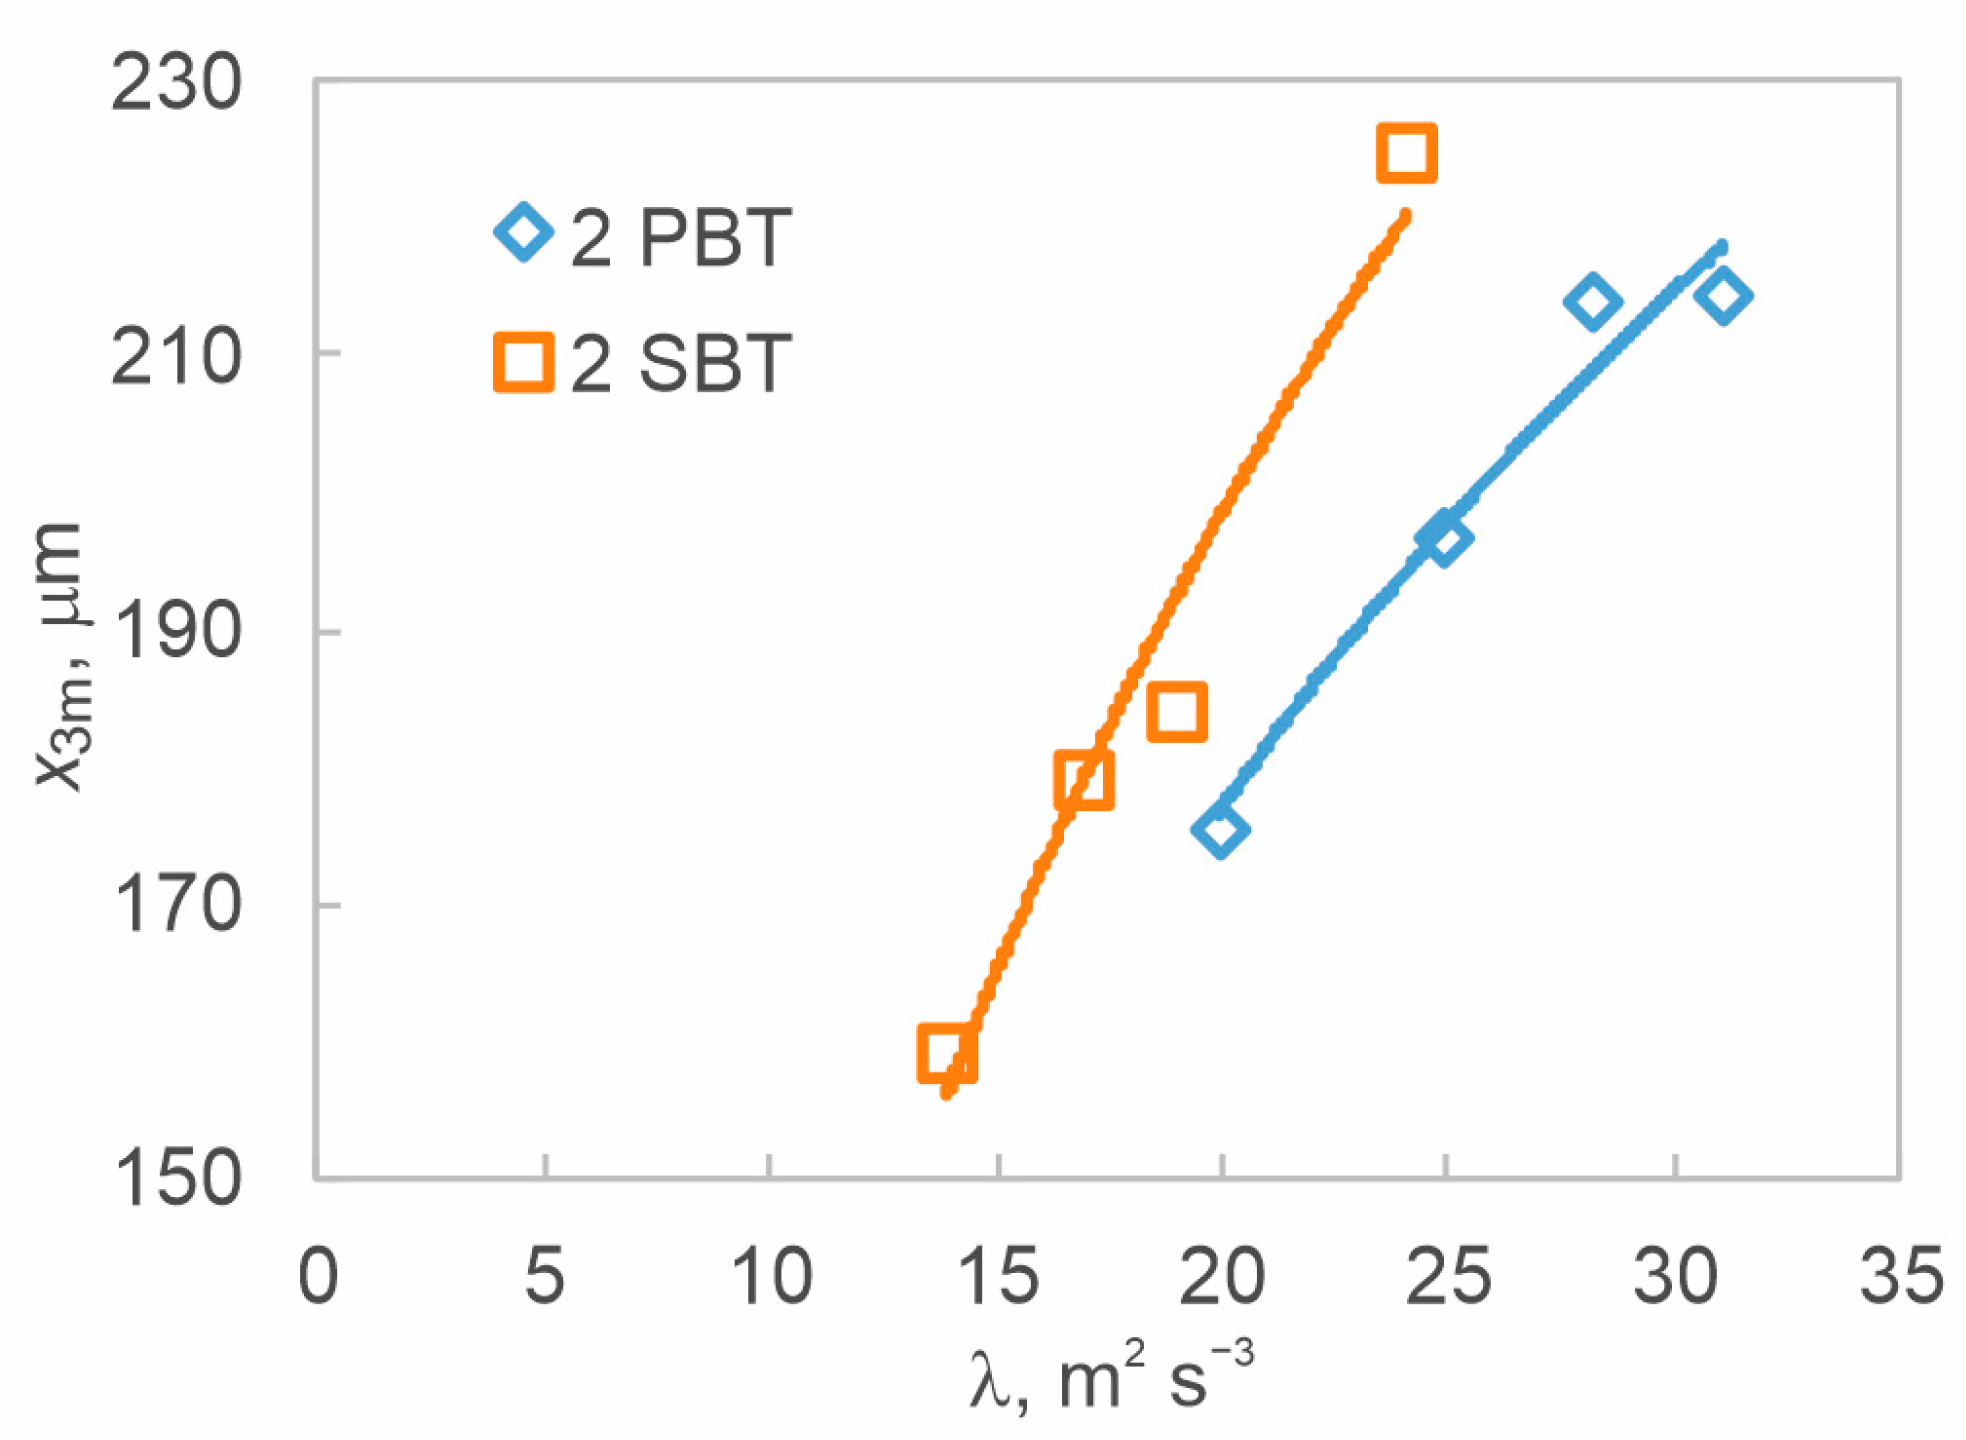
3.3. The Effect of Hydrodynamics on Final Product Properties at Different Off-Bottom Clearances

In the last part of this work, the influence of impeller off-bottom clearance on crystal size distribution was analyzed. The cumulative distribution functions are shown in Figure 17. As the impeller off-bottom increases, the curves noticeably move to the left, towards lower crystal sizes. Other final crystal product properties of interest can be seen in Table 3.
As can be seen from Table 3, the mean weight crystal size decreases as the impeller off-bottom clearance increases in both dual-impeller systems investigated in this paper. Also, it can be seen that the crystals are generally smaller in the 2 SBT impeller system than in the 2 PBT one, at almost all positions. Standard deviation decreases as well, suggesting that the crystal size distribution is narrower at a higher C/D. Regarding the yield, a significant change was not observed—it varied within 0.62% in 2 PBT and 1.26% in the 2 SBT impeller system at all positions; thus, it can be concluded that the C/D did not have a significant effect on the yield.
While the correlation of the mean crystal size and the dimensionless mixing time was examined, no clear connection was found that would imply an influence of the bulk flow on the end product size. However, the eddy dissipation rate (ε) as well as the Kolmogorov length scale (λ) were found to correlate highly with the mean crystal size, as is shown in Figure 18.
The Kolmogorov length scale determines the size of the smallest eddies in the systems, and it was calculated in this paper by:
λ = ν 3 ε 0.25
where ν is the kinematic viscosity of the fluid and ε is the eddy dissipation rate calculated by Equation (6).
The high correlation between the mean crystal size and eddy dissipation rate (Figure 18) and the Kolmogorov length scale (Figure 19) implies that the final properties of the crystals are affected by the fluid dynamics on the microscale of mixing—i.e., the dynamics on the dissipative end of the turbulence spectrum. Based on these findings in a dual-impeller system, it can be concluded that smaller crystals and a narrower crystal size distribution can be expected at higher dissipation rates and at a smaller Kolmogorov length scale value.

4. Conclusions

The aim of this work was to investigate the influence of hydrodynamics on nucleation kinetics and final crystal size in a 15 dm3 dual-impeller crystallizer. A crystallizer was equipped with two types of impellers, pitched-blade turbine (PBT) and straight-blade turbine (SBT), arranged in dual-impeller configurations, 2 PBT and 2 SBT. In both the 2 PBT and 2 SBT impeller systems, two key mixing parameters were experimentally determined—the mixing time and power input at different dimensionless off-bottom clearances, C/D. Experimentally determined values were used to validate the developed computational fluid dynamics (CFD) model. Considering the numerically predicted values satisfactorily matched those that were experimentally determined, it was found that the model is reliable enough to analyze hydrodynamics in a dual-impeller crystallizer until the onset of nucleation.
Based on the model, it was found that, within the range of the examined impeller off-bottom clearances, the hydrodynamic conditions at C/D = 1 in 2 PBT and C/D = 0.6 in 2 SBT impeller systems favored an earlier onset of nucleation, considering the lowest values of metastable zone width (MSZW) were observed at those two positions. At all others, in both respective dual-impeller systems, the combination of hydrodynamic conditions and delayed nucleation, either because of the low level of mixing, formed recirculation loops below the lower impeller or excessive TKE (turbulence kinetic energy) and TED (turbulence eddy dissipation) values, observed between/around the two impellers. Ultimately, the results suggest that smaller crystals with a narrower size distribution can be expected at higher dissipation rates and smaller Kolmogorov length scales, as evidenced by the strong correlation between the mean crystal size, eddy dissipation rate, and Kolmogorov length scale. This indicates that the final crystal properties are significantly influenced by fluid dynamics at the microscale of mixing, i.e., at the dissipative end of the turbulence spectrum.
Despite its limitations, compared to other more comprehensive studies, this pilot study offers a practical approach to approximate hydrodynamic conditions in the vessel with satisfactory accuracy. By simply measuring two basic mixing variables and developing a CFD model, the optimal hydrodynamic conditions can be determined without costly, time-consuming experiments, whether aiming at obtaining smaller or larger crystals.

Supplementary Materials

The following supporting information can be downloaded at: https://www.mdpi.com/article/10.3390/pr12102183/s1, Figure S1: Homogenization monitor (above) for 4 randomly chosen points with annotated NaCl volume fraction contours (below); Table S1: Constants of k-ω SST turbulence model.

Author Contributions

Conceptualization, A.Č., M.Ć. and N.K.; methodology, A.Č. and M.Ć.; software, Ž.P.; validation, A.Č.; formal analysis, A.Č.; investigation, A.Č.; resources, A.Č., M.Ć. and N.K.; data curation, A.Č.; writing—original draft preparation, A.Č.; writing—review and editing, A.Č., M.Ć., Ž.P. and N.K.; visualization, A.Č.; supervision, A.Č. and M.Ć.; project administration, A.Č., M.Ć. and N.K.; funding acquisition, N.K. All authors have read and agreed to the published version of the manuscript.

Funding

This research received no external funding.

Data Availability Statement

Data are contained within the article.

Conflicts of Interest

The authors declare no conflicts of interest.

References

  1. Montante, G.; Maluta, F.; Alberini, F.; Iwasawa, S.; Takenaka, K.; Paglianti, A. Large blade impeller application for turbulent liquid–liquid and solid–liquid mixing. Can. J. Chem. Eng. 2022, 100, 2230–2244. [Google Scholar] [CrossRef]
  2. Yao, Z.; Alberini, F.; Montante, G.; Paglianti, A. A new approach to evaluate 3D flow fields using an off-axis 2D PIV system: Investigation of a tubular reactor equipped with Kenics static mixers. Exp. Tech. 2023, 47, 1229–1245. [Google Scholar] [CrossRef]
  3. Nikku, M.; Myöhänen, K.; Ritvanen, J.; Hyppänen, T. Evaluation of mixing of a secondary solid phase in a circulating fluidized bed riser. Chem. Eng. Sci. 2023, 269, 118503. [Google Scholar] [CrossRef]
  4. Torotwa, I.; Ji, C. A Study of the Mixing Performance of Different Impeller Designs in Stirred Vessels Using Computational Fluid Dynamics. Designs 2018, 2, 10. [Google Scholar] [CrossRef]
  5. Avazpour, R.; Latifi, M.; Chaouki, J.; Fradette, L. A cleaner recovery of rare earth bearing minerals by Pickering emulsification: Improvement of processing conditions toward an economic operation. J. Environ. Chem. Eng. 2021, 9, 105449. [Google Scholar] [CrossRef]
  6. Li, X.; Zhao, H.; Zhang, Z.; Liu, Y.; Zhang, T. Numerical optimization for blades of Intermig impeller in solid–liquid stirred tank. Chin. J. Chem. Eng. 2021, 29, 57–66. [Google Scholar] [CrossRef]
  7. Xu, Z.; Yang, C.; Wan, L.; Liu, B. Numerical investigation on the intensification of coaxial slurry mixing systems. Chem. Eng. Process. 2023, 192, 109514. [Google Scholar] [CrossRef]
  8. Yang, C.; Sun, N.; Zhang, Z.; Liu, B. Experimental Study on Micromixing Characteristics of Coaxial Mixer in Solid–Liquid Systems. Ind. Eng. Chem. Res. 2021, 60, 14318–14328. [Google Scholar] [CrossRef]
  9. Xu, Z.; Wan, L.; Li, Z.; Liu, B. Numerical Study on the Synergistic Mechanism of Coaxial Mixers in Dense Solid–Liquid Mixing Systems. Ind. Eng. Chem. Res. 2023, 62, 11744–11755. [Google Scholar] [CrossRef]
  10. MS, A.; Hazra, D.; Steele, G.; Pal, S. Crystallization process modifications to address polymorphic and particle size challenges in early-stage development of an API salt. Chem. Eng. Res. Des. 2020, 164, 400–411. [Google Scholar] [CrossRef]
  11. Pukkella, A.K.; Vysyaraju, R.; Tammishetti, V.; Rai, B.; Subramanian, S. Improved mixing of solid suspensions in stirred tanks with interface baffles: CFD simulation and experimental validation. Chem. Eng. J. 2019, 358, 621–633. [Google Scholar] [CrossRef]
  12. Jacqueline, R.d.A.; Fabienne, E.; Letourneau, J.-J.; Inês, R.M. Antisolvent crystallization of a cardiotonic drug in ionic liquids: Effect of mixing on the crystal properties. J. Cryst. Growth 2017, 472, 29–34. [Google Scholar] [CrossRef]
  13. Li, X.; Heng, J.Y.Y. The critical role of agitation in moving from preliminary screening results to reproducible batch protein crystallisation. Chem. Eng. Res. Des. 2021, 173, 81–88. [Google Scholar] [CrossRef]
  14. Lenka, M.; Sarkar, D. Combined cooling and antisolvent crystallization of l-asparagine monohydrate. Powder Technol. 2018, 334, 106–116. [Google Scholar] [CrossRef]
  15. Camacho Corzo, D.M.; Ma, C.Y.; Mahmud, T.; Roberts, K.J. Digital Design of Batch Cooling Crystallization Processes: Computational Fluid Dynamics Methodology for Modeling Free-Surface Hydrodynamics in Agitated Crystallizers. Org. Process Res. Dev. 2020, 24, 2565–2582. [Google Scholar] [CrossRef]
  16. Oh, D.-H.; Jeon, R.-Y.; Adams, D.; Jung, W.-Y.; Shim, H.M.; Lee, C.-H.; Kim, K.-J. Software Platform for Computation Fluid Dynamics Simulation of Mixing and Crystallization in a Stirred Vessel. Cryst. Growth Des. 2020, 20, 1172–1185. [Google Scholar] [CrossRef]
  17. Tsuchioka, K.; Hayashi, K.; Misumi, R. Method for predicting the size of Ni1/3Mn1/3Co1/3(OH)2 particles precipitated in a stirred-tank semi-batch crystallizer using CFD and particle agglomeration models. Heliyon 2024, 10, e28710. [Google Scholar] [CrossRef]
  18. Shiea, M.; Querio, A.; Buffo, A.; Boccardo, G.; Marchisio, D. CFD-PBE modelling of continuous Ni-Mn-Co hydroxide co-precipitation for Li-ion batteries. Chem. Eng. Res. Des. 2022, 177, 461–472. [Google Scholar] [CrossRef]
  19. Szilagyi, B.; Eren, A.; Quon, J.L.; Papageorgiou, C.D.; Nagy, Z.K. Application of Model-Free and Model-Based Quality-by-Control (QbC) for the Efficient Design of Pharmaceutical Crystallization Processes. Cryst. Growth Des. 2020, 20, 3979–3996. [Google Scholar] [CrossRef]
  20. Čelan, A.; Ćosić, M.; Penga, Ž.; Kuzmanić, N. Connection of Hydrodynamics and Nucleation Kinetics in Dual-Impeller Crystallizers. Chem. Eng. Technol. 2021, 44, 914–923. [Google Scholar] [CrossRef]
  21. Nývlt, J. Kinetics of nucleation in solutions. J. Cryst. Growth 1968, 3–4, 377–383. [Google Scholar] [CrossRef]
  22. Harnby, N.; Edwards, M.F.; Nienow, A.W. Mixing in the Process Industries, 2nd ed.; Butterworth-Heinemann: Oxford, UK, 1992. [Google Scholar] [CrossRef]
  23. Čelan, A.; Ćosić, M.; Pehnec, I.; Kuzmanić, N. Influence of impeller diameter on crystal growth kinetics of borax in mixed dual impeller batch cooling crystallizer. Chem. Eng. Technol. 2019, 42, 788–796. [Google Scholar] [CrossRef]
  24. Menter, F.R. Two-equation eddy-viscosity turbulence models for engineering applications. AIAA J. 1994, 32, 1598–1605. [Google Scholar] [CrossRef]
  25. Menter, F. Zonal Two Equation k-w Turbulence Models for Aerodynamic Flows. AIAA J. 1993, 32, 1598–1605. [Google Scholar] [CrossRef]
  26. Jahoda, M.; Moštĕk, M.; Kukuková, A.; Machoň, V. CFD Modelling of Liquid Homogenization in Stirred Tanks with One and Two Impellers Using Large Eddy Simulation. Chem. Eng. Res. Des. 2007, 85, 616–625. [Google Scholar] [CrossRef]
  27. Green, D. Crystallizer Mixing. In Handbook of Industrial Crystallization, 3rd ed.; Myerson, A.S., Deniz, E., Lee, A.Y., Eds.; Butterworth-Heinemann: Boston, MA, USA, 2002; pp. 290–312. [Google Scholar]
  28. Amari, S.; Takahashi, R.; Hosokawa, M.; Takiyama, H. Improving the quality of crystalline particles and productivity during anti-solvent crystallization through continuous flow with high shear stress under low supersaturation condition. Adv. Powder Technol. 2024, 35, 104493. [Google Scholar] [CrossRef]
  29. Battaglia, G.; Romano, S.; Raponi, A.; Volpe, F.; Bellanca, L.; Ciofalo, M.; Marchisio, D.; Cipollina, A.; Micale, G.; Tamburini, A. Mixing phenomena in circular and rectangular cross-sectional T-mixers: Experimental and numerical assessment. Chem. Eng. Res. Des. 2024, 201, 228–241. [Google Scholar] [CrossRef]
  30. Tamburini, A.; Gagliano, G.; Micale, G.; Brucato, A. Direct numerical simulations of creeping to early turbulent flow in unbaffled and baffled stirred tanks. Chem. Eng. Sci. 2018, 192, 161–175. [Google Scholar] [CrossRef]
  31. Doran, P.M. Bioprocess Engineering Principles, 2nd ed.; Academic Press: Waltham, MA, USA; Oxford, UK, 2013; pp. 255–332. [Google Scholar]
  32. Mullin, J.W.; Söhnel, O. Expressions of supersaturation in crystallization studies. Chem. Eng. Sci. 1977, 32, 683–686. [Google Scholar] [CrossRef]
  33. Ćosic, M.; Pažin, A.; Čelan, A.; Kuzmanić, N. Influence of Cooling Rate on Crystallization of Borax in Stirred Batch Crystallizer. Chem. Eng. Trans. 2019, 74, 451–456. [Google Scholar]
  34. Yang, G.; Louhi-Kultanen, M.; Sha, Z.; Kubota, N.; Kallas, J. A Model for the Prediction of Supersaturation Level in Batch Cooling Crystallization. J. Chem. Eng. Jpn. 2006, 39, 426–436. [Google Scholar] [CrossRef]
  35. Ulrich, J.; Strege, C. Some aspects of the importance of metastable zone width and nucleation in industrial crystallizers. J. Cryst. Growth 2002, 237–239 Pt 3, 2130–2135. [Google Scholar] [CrossRef]
  36. Akrap, M.; Kuzmanić, N.; Prlić-Kardum, J. Effect of mixing on the crystal size distribution of borax decahydrate in a batch cooling crystallizer. J. Cryst. Growth 2010, 312, 3603–3608. [Google Scholar] [CrossRef]
  37. Schubert, H.; Mersmann, A. Determination of heterogeneous nucleation rates. Trans IChemE 1996, 74, 821–827. [Google Scholar]
Figure 1. Dual-impeller crystallizer along with the impeller types used (1—crystallizer, 2—impellers, 3—concentration measurement system, 4—thermostat, 5—electromotor, 6—temperature sensor, 7—PC).
Processes 12 02183 g001
Figure 2. Vessel geometry (a), stationary domain fluid body (b), rotating domain fluid body (red) with assigned interfaces (green) (c), rotating walls (d).
Processes 12 02183 g002
Figure 3. Element sizing on different domains.
Processes 12 02183 g003
Figure 4. Grid dependency study for a random 2 SBT off-bottom clearance.
Processes 12 02183 g004
Figure 5. Time-step dependency study for a random 2 SBT off-bottom clearance.
Processes 12 02183 g005
Figure 6. Example of the generated finite volume mesh for the 2 PBT impeller system.
Processes 12 02183 g006
Figure 7. Numerical determination of the mixing time values—injected droplet of a NaCl solution (a); NaCl solution volume fraction ca. 10 s after startup (b) and NaCl volume fraction for point at R = 0.05 m, H = 0.3 m in the opposite direction from the injected droplet of NaCl; (c) obtained results for a random impeller configuration.
Processes 12 02183 g007
Figure 8. Experimentally and numerically determined mixing times in the crystallizer.
Processes 12 02183 g008
Figure 9. Dimensionless mixing time in both investigated systems.
Processes 12 02183 g009
Figure 10. Experimentally and numerically determined power input values in the crystallizer.
Processes 12 02183 g010
Figure 11. Velocity contours in the stationary frame.
Processes 12 02183 g011
Figure 12. Turbulence kinetic energy contours in 2 PBT and 2 SBT systems.
Processes 12 02183 g012
Figure 13. Turbulence eddy dissipation contours in 2 PBT and 2 SBT systems.
Processes 12 02183 g013
Figure 14. Dissipation rate at different impeller off-bottom clearances.
Processes 12 02183 g014
Figure 15. Supersaturation profiles in 2 PBT and 2 SBT at different impeller off-bottom clearances.
Processes 12 02183 g015
Figure 16. Metastable zone width in 2 PBT and 2 SBT at different impeller off-bottom clearances.
Processes 12 02183 g016
Figure 17. Cumulative distribution functions in 2 PBT and 2 SBT dual-impeller systems at different off-bottom clearances.
Processes 12 02183 g017
Figure 18. Mean crystal size vs. dissipation rate in 2 PBT and 2 SBT dual-impeller systems.
Processes 12 02183 g018
Figure 19. Mean crystal size vs. Kolmogorov length scale in 2 PBT and 2 SBT dual-impeller systems.
Processes 12 02183 g019
Table 1. Impeller speed and Reynolds numbers at different impeller spacings (S/D = 1, N = NJS).
Impeller
Configuration
C/DNJS, rpmRe,/
2 PBT0.2020223715
0.6023827942
1.0030135338
1.3038845552
2 SBT0.2021525242
0.6030635925
1.0035241326
1.3045152949
Table 2. Nucleation rates.
Impeller
Configuration
C/DNhet ∙ 1019, m−3 s−1,
2 PBT0.204.9864
0.605.3865
1.002.0930
1.306.6177
2 SBT0.207.0794
0.601.5287
1.004.9864
1.304.2733
Table 3. Crystal size and yield in the dual-impeller crystallizer.
Impeller
Configuration
C/DMean Crystal Size, μmσ, μm Y, %
2 PBT0.20214.4364.8387.68
0.60214.0857.7387.94
1.00196.8256.4789.18
1.30175.7147.0288.84
2 SBT0.20224.7057.1387.08
0.60184.2050.3389.5
1.00179.3347.8690.47
1.30159.0745.7989.57
Disclaimer/Publisher’s Note: The statements, opinions and data contained in all publications are solely those of the individual author(s) and contributor(s) and not of MDPI and/or the editor(s). MDPI and/or the editor(s) disclaim responsibility for any injury to people or property resulting from any ideas, methods, instructions or products referred to in the content.

