Abstract
Gas leaks can cause disasters at process sites, including fires and explosions, and thus, effective gas-leak detection systems are required. This study investigated the limitations of conventional detectors and introduced an innovative ultrasonic sensor-based approach for continuous monitoring. A new configuration for a stationary remote ultrasonic gas-leak monitoring system is proposed. The selected material was 1-Butene. The detection probability was assessed through a simulation based on a gas-leak scenario, detailing the selection criteria for leak sites and simulation conditions. Computational fluid-dynamics (CFD) simulations were used to evaluate the detection capability of the existing system, whereas Monte Carlo simulations were used to compare it with the proposed ultrasonic system. The CFD simulation was performed by setting the lower detection limit of the concentration-measurement-type gas detector to 600 ppm, and the leak-detection time was approximately 8.895 s. A Monte Carlo simulation accounting for wind direction showed that the existing system’s average detection probability was 3.41%. By integrating the existing and new systems, the detection probability increased by 96.58% and 3.92% compared with that using only the concentration-measurement and ultrasonic measurement methods, respectively. These rates provide valuable insights for future applications in oil refining and petrochemical industries.
1. Introduction
Korea’s oil refining and petrochemical industries have been operating for over 40 years since their establishment, and accidents, wherein various hazardous substances leak owing to various defects in ageing facilities, are occurring. Oil refining and petrochemical plants are extremely dangerous, and even a single accident can cause large-scale casualties and property damage. Particularly, combustible gas leaks may lead to large-scale accidents, such as fires or explosions, which can significantly damage life and property [1,2]. Oil refining and petrochemical industries are national-based industries [3], so in the event of an accident due to a gas leak, subsequent effects arise owing to production interruption. Large-scale casualties have occurred as a result of various chemical-leak accidents, such as fires and explosions caused by hazardous chemical leaks [4,5,6]. Owing to the toxicity of these chemicals, spills can quickly escalate into major accidents, leading to the release of hazardous contaminants [7,8]. Environmental impacts, including air, water, and soil pollution, resulting from leaks and fires in the case of spills, can disrupt ecosystems and cause lasting damage [9]. Early detection and rapid response to chemical leaks are necessary to prevent major damage, and technologies to address these issues are being developed in various ways. According to a statistical survey by the National Institute of Chemical Safety, most chemical accidents have occurred on a large scale [10]. Fires caused by the leakage of combustible gases in chemicals continue to occur. In 2022, fire damage caused by gas leaks in Korea accounted for the largest amount of property loss in the past 10 years; apart from property loss, these casualties continue to occur as shown in Table 1 [11].

Table 1.
Status of fires caused by gas leaks.
Accidents occur owing to a variety of factors, including ageing infrastructure, inadequate safety procedures, human error, noncompliance, and lack of detection systems. Detection systems are particularly important. A well-equipped gas-leak detection system enables early response through fast and accurate detection. Ultimately, damage can be reduced by quickly detecting and responding to gas leaks. Ultrasonic detection systems have recently been in the spotlight, and advances have been made in terms of the precision of gas-leak detection [12,13]. In this study, we developed an ultrasonic detection technology and proposed a novel gas-leak detection system that can be applied to outdoor plants, such as oil refineries and petrochemical plants. A simulation verification was performed on gas-leak detection systems, including a detection system using ultrasonic technology.
2. Existing Gas-Leak Detection Systems
2.1. Literature Review of Gas-Leak Detection Systems
Chemical leaks from oil refineries and petrochemical plants pose serious safety hazards and environmental threats. Therefore, it is important to detect and measure leakage as early as possible [14]. The methods used to measure these leaks often involve sophisticated detection systems, some of which are fixed installations within a plant, while others are portable and can be used for routine inspections or emergencies [15]. The leak-detection and measurement methods currently in use are described below.
- Routine inspection and monitoring: regular visual inspection is often the first line of defence. This involves inspecting tanks, pipelines, pumps, and valves for signs of leakage. Additionally, nondestructive evaluation techniques are used to detect and monitor the growth of defects, with a focus on corrosion [16,17];
- Pressure monitoring: pipelines and vessels in petrochemical plants often undergo pressure changes. A sudden decrease in the pressure may indicate a leak. This method is primarily used in long-distance pipelines. Recent research has been conducted using artificial intelligence (AI) to identify leak characteristics and build models [18];
- Flow monitoring: this method involves measuring the flow of chemicals at various points in a system. This method is used in conjunction with pressure monitoring. For two-phase (gas–liquid) interactions, upstream pipeline pressure can serve as an important indicator of leaks. The downstream flow can be a key leak indicator, and flow monitoring can be used for leak detection. Discrepancies in the flow measurements can signal a potential leak [19];
- Concentration measurement: this is a traditional method that is widely used not only in oil refining and petrochemical plants but also in other factories, offices, and residential facilities. The gas-detection module determines whether the gas concentration in the proposed environment exceeds a specified range. This includes the use of gas detection systems to identify gases that may escape into the air [20];
- Thermal imaging: leaks can cause changes in temperature, and thermal cameras can identify hotspots. Infrared optical gas imaging (IOGI) enables sensitive remote sensing of toxic gases. This technique has been widely applied to leak detection, localisation, and visualisation [21,22,23];
- Acoustic sensing: acoustic sensors detect sounds generated by leaks, which can be high-frequency ultrasonic noises that are otherwise inaudible [21]. Recently, technologies have been developed to detect gas leaks in pipeline systems using acoustic methods. Wave propagation in pipelines is a major factor in acoustic methods when leaks occur, and the friction between the pipe walls creates a pressure balance in the pipe. Further tests and simulations must be performed to obtain rapid results and location estimates for leaks using acoustic methods [24]. This method detects gas leaks by adhering a sensor to a pipe, and some methods can detect leaks at a distance. The long-distance measurement method uses equipment that can receive ultrasonic waves, such as a microphone sensor, to measure gas leakage from a distance and even estimate the location of the leak [25]. According to our recent interviews with workers at oil refineries and petrochemical plants in Korea, the use of ultrasonic cameras to measure distances is increasing. However, ultrasonic cameras in plants are portable and require the expertise of skilled operators.
In previous studies, gas detection has primarily focused on traditional methods (pressure, flow, concentration, thermal imaging, etc.). The introduction of ultrasonic detectors capable of acoustic detection has been considered necessary. Although numerous studies have been conducted on fire detection, there is a need for progressive research on the detection of gas leaks that cause fires [26,27,28,29,30]. Currently, research on the detection of 1-butene leakage is lacking. Our study conducted simulations with 1-butene, which is used in petrochemical processes, as the leak target, and thus, it serves as a good reference. Several studies have been conducted on methods to ventilate combustible gases or enhance safety management and response systems. However, ventilation and management alone cannot completely eliminate the risk of explosions, and thus, advancements in the field of detection are necessary [31,32,33,34].
2.2. Spatial Adaptability
Oil refineries and petrochemical plants are so vast that contact-based gas detection involves significant effort and costs. Therefore, we believe that a technology that measures and localises ultrasonic waves generated by vortices during gas leakage [35] from a distance by receiving them with a microphone sensor array is highly applicable. In this study, we aim to advance the technology for detecting gas leaks in oil refineries and petrochemical plants by developing a system to receive ultrasonic waves from a distance and comparing it with the concentration-measurement method that is currently the most frequently used.
3. Ultrasonic Detection System
3.1. Theory
Ultrasonic measurement methods are used to detect the high-frequency sounds caused by leaks. This is particularly useful for identifying leakages in pressurised systems. Ultrasonic measurement methods are largely divided into methods of measuring by attaching a sensor to a pipe and methods of measuring with a sensor placed at a certain distance from the leak area. The database consists of features obtained from various locations, and the software parameterises the source locations [36,37]. In this study, we present an advanced gas-leak detection scheme based on ultrasonic sensing technology. We compared the proposed system with an existing system.
In this study, we used equipment that greatly improved usability by estimating the location of leakage using ultrasonic signals measured from multiple microphone sensors and visualising the location in images obtained from an optical camera. Ultrasonic measurements can be performed outdoors, where the wind blows and the air spreads quickly. It is difficult for gas sensors that operate according to the chemical reactions normally used in the field to operate in such environments. Ultrasonic measurements can be performed regardless of the type of gas used, such as a chemical. The location of the leak can be identified when a gap or hole occurs in a pressurised pipe, as shown in Figure 1. Gas leaks are due to the pressure inside the pipe, and a vortex phenomenon of gas occurs in the leak area [35]. The signal generated by this vortex phenomenon is received by the microphone sensor of the ultrasonic camera, as shown in Figure 1, and appears to be high in the ultrasonic band that humans cannot hear [38].
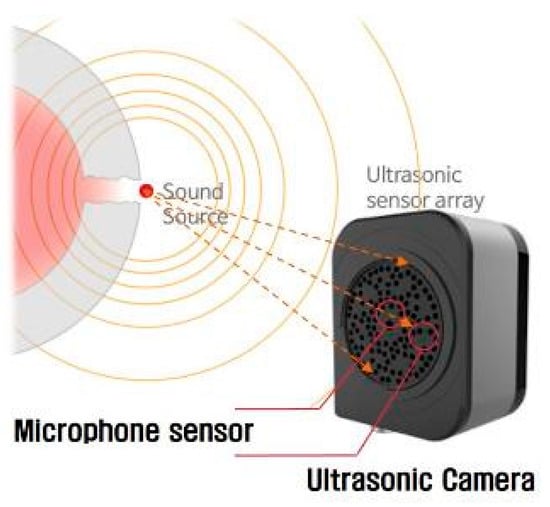
Figure 1.
Generation of leakage signals and measurement using sensor arrays.
These signals are transmitted through the air and reach the microphone sensor array in the ultrasonic camera. A sensor-array-based ultrasonic gas-leak location method is thus used to detect and locate the generated ultrasonic leaks. The location of the leak point can be determined using only the arrival-time difference between the leak point and the sensor [39].
3.2. Differences between Ultrasonic and Traditional Methods
Gas concentration-measurement methods used in oil refineries and petrochemical plants may have blind spots in the detection of plant leaks. In the case of oil refineries and petrochemical plants installed outside, there is a high possibility that the gas diffusion path is outside the installation range of the detector owing to outdoor air currents; in this case, leak detection is extremely difficult. Particularly, gases that are lighter than air tend to disperse into the atmosphere, making their accumulation and detection more difficult. Additionally, traditional concentration-measurement methods can only detect certain gases. As oil refineries and petrochemical plants handle various types of gas, it is difficult to detect all of them using traditional methods, which only detect specific gas types.
The ultrasonic detection method allows for monitoring a space from a distance and is suitable for detecting gas leaks in vast oil refineries and petrochemical plants, as explained in Section 2.2. As the ultrasonic waves generated in the event of a gas leak are received by the microphone sensor, indicating their location, the gas-leak site can be immediately identified. The traditional method cannot specify the location even if a gas leak is detected; therefore, additional confirmation of the cause of the surrounding leak is necessary. Ultrasonic detection does not require such procedures, thereby enabling a rapid response. In addition, regardless of the type of leaking gas, all gases that generate ultrasonic waves can be detected. Ultrasonic detection methods are currently developed only for portable use; therefore, building a fixed monitoring system would be a more effective gas-leak detection paradigm.
3.3. Development of a Fixed Gas-Leak Monitoring System Utilising Ultrasonic Technology
Figure 2a shows the 3D design and prototype of the ultrasonic camera. Ultrasonic cameras, which are an important element of gas-leak monitoring systems, are designed to minimise the product size for efficient space utilisation, as shown in Figure 2b. The dimensions of this prototype are approximately 148 mm × 188 mm × 60 mm (width × height × thickness), and it weighs approximately 1.6 kg.
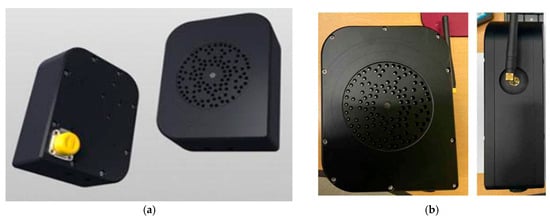
Figure 2.
Three-dimensional (3D) design of the ultrasonic camera prototype and actual shape. (a) 3D design of the prototype; (b) actual product of the developed prototype.
Because most oil refineries and petrochemical plants are installed outdoors, the camera has a waterproof design. It was developed and verified according to IEC 60529 standards to achieve an IP of 55 or higher, which is the highest waterproofing rating among current ultrasonic cameras. This development was intended to ensure that the device could withstand rain or snow when installed outdoors.
In this study, simulations were performed using a highly sensitive gas-leak detection sensor based on a 112-microphone array. Laboratory-scale gas-leak tests using this ultrasonic camera verified the high sensitivity of the sensor to detect minute gas leaks at a rate of less than 1.67 mL/s. When the leakage from an orifice was less than 1.67 mL/s, it was detected at a distance of approximately 5000 mm, with Φ 0.2 mm, satisfying the ASTM E 1002-11 standard [40]. The results of tests conducted at an outdoor-demonstration test site within the Fire Insurers Laboratories of Korea (FILK) in Yeoju-si, where gas-leak facilities (vessels, pipes, etc.) were installed and demonstration tests performed, confirmed that gas leakage can be detected from a distance using ultrasonic technology.
The portable ultrasonic gas-leak measurement equipment (camera) was used by inspectors and workers to identify leaks by observing the heat map displayed on a screen attached to the camera. The primary function of the camera in a fixed surveillance system is to receive ultrasonic waves through a microphone sensor array, and in this case, it excludes the camera screen, which is installed separately and connected to the camera using a wire. Unlike portable devices, constant monitoring is possible inside a control room using a monitor connected via a network. This system is currently in use in the gas-filled process pipelines at a polymer manufacturing plant in the Yeosu Petrochemical Industrial Complex. Constant surveillance in a control room that handles key management functions in oil refineries and petrochemical plants enables a more rapid response to leaks. This study predicts the detection probabilities of the conventional and ultrasonic gas-leak detectors and examines the feasibility of introducing a mixed detection system into oil refineries and petrochemical plants.
4. Methods
Based on the test facilities of a petrochemical plant, a simulation was performed considering 1-butene, which is a raw material as well as an intermediate and byproduct in the actual process of the Yeosu Petrochemical Plant. Under the same conditions, the detection performance of the ultrasonic monitoring system described in Section 3 was compared with that of existing concentration-measurement methods for 1-butene leaks. To compare and analyse the detection performance, the simulation utilised two tools: computational fluid dynamics (CFD) and system dynamics (Monte Carlo simulation). In addition, the detection performance of both technologies was derived and analysed. A comparison between the existing method and the proposed ultrasonic system will be a good reference when applying the technology to gas leakages in the future. In addition, the combination of the two systems can be realistically applied to oil refineries and petrochemical plants, and the analysis results can be used as a reference for actual applications.
The flowchart in Figure 3 illustrates the progress in the research on gas-leak detection methods. It begins by selecting the scope of analysis, which includes the traditional, ultrasonic, and combined detection techniques. Subsequently, a CFD simulation was conducted on the existing system by incorporating 3D modelling and numerical analysis. In the comparison phase, system-dynamics simulations were used to design the variables and parameters, which were further analysed using Monte Carlo simulations. Finally, the integrated performance of the conventional and ultrasonic gas detectors was evaluated to derive the research outcomes.
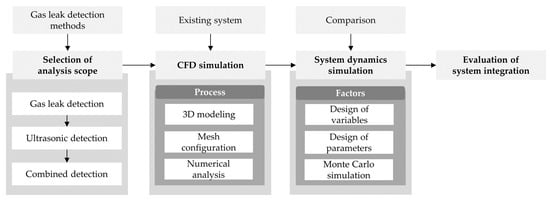
Figure 3.
Flowchart of the study.
4.1. Scenario Setup
4.1.1. Simulation-Application Facilities and Environment
We visited the Yeosu Petrochemical Complex, Korea’s representative petrochemical complex, and designed a gas-leak-verification test facility for simulation through on-site inspections and reviews. Oil refineries and petrochemical plants in Korea are installed outdoors, which can cause stress owing to thermal expansion in summer and contraction in winter, resulting in damage to pipes. In addition, curved pipelines are widely used to mitigate the damage caused by fluids within pipes [41]. Various bending shapes, such as elbows, were applied to the piping in the simulated facility. Therefore, we designed our test site in the form of an equipment layout for use in an actual petrochemical plant, as shown in Figure 4.
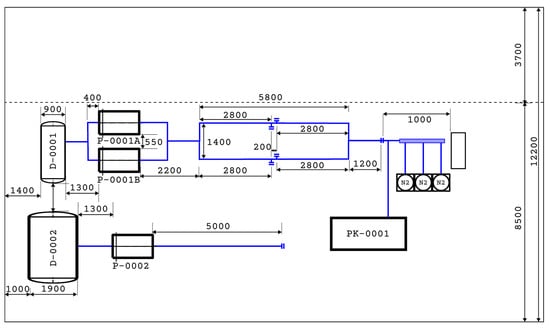
Figure 4.
Initial design of the equipment layout plan for the simulation.
Based on the initial simulation design shown in Figure 4, modifications and additions were included in the drawing by applying a gas-leak scenario, as shown in the 3D drawings in Figure 5, which were then used for the CFD simulation.
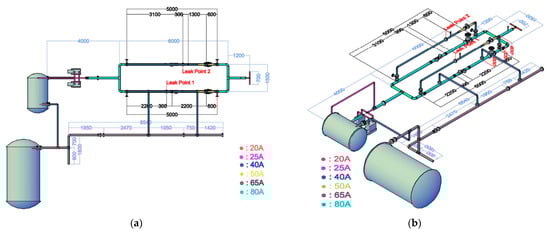
Figure 5.
Three-dimensional (3D) design for computational fluid dynamics (CFD) and system-dynamics simulation. (a) 3D design for the simulation viewed from the top; (b) 3D design for the simulation viewed from the top left.
The location was selected based on the outdoor-demonstration test site at the Fire Insurers Laboratories of Korea (FILK). The pressure inside the pipe where the leak occurred was 2.2 bar, the leak diameter was 6.9 mm, and the leak rate was 0.00217 kg/s. When the test was performed, the average wind direction and speed were approximately 1.2 m/s from the south, and the weather was clear. The ultrasonic gas-leak detection time was approximately 8 s, including a 3 s monitoring-video processing time for the integrated surveillance system and a 5 s leak-determination time. Simultaneously, ultrasonic waves were generated and immediately received by the microphone sensor, and the leak was immediately displayed on the screen. However, to determine whether it was a real leak or a surrounding obstacle that could temporarily generate ultrasonic waves, such as wind, the leak-detection decision time was arbitrarily set to 5 s. This is an expression of the intention to identify a leak if the ultrasonic waves generated from the pipe continue for 5 s. Depending on the site and situation, this time may be changed. For example, if the inspector is skilled in judging an onsite situation, the time required to determine a leak can be reduced or eliminated. Under these conditions, leak detection was possible up to approximately 23 m, a distance exceeding 20 m. Figure 6 shows a photograph of the test site within the FILK where gas leaks were detected at a distance. The outdoor-demonstration test site, shown in Figure 6, was constructed based on Figure 5.
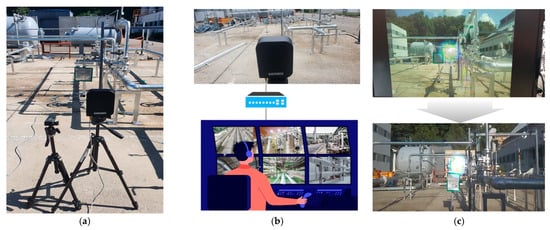
Figure 6.
Photograph of the gas-leak demonstration test site. (a) Placement of ultrasonic camera (sensor) and laser meter; (b) monitoring connected with the ultrasonic camera; (c) screen displayed on the system’s monitor.
Therefore, the ultrasonic detection system could cover up to approximately 20 m in any direction centred on the leak point of the relevant verification test facility.
4.1.2. Gas-Leak Scenario
On 17 July 2021, a leak occurred in a hydrochloric acid storage tank at the Ulsan Chemical Plant. In this accident, the stored hydrochloric acid leaked owing to the loosening of the pipe flange joint at the bottom of the outdoor hydrochloric acid storage tank. The hydrochloric acid leaked from the flange joint, where the thread thickness decreased owing to long-term chemical corrosion of the flange connection bolt. Eleven nearby residents received treatment at the hospital, but some forests and crops near the business site perished. Experts have advocated the use of acid-resistant materials in processes that handle corrosive substances and secure workspaces for maintenance as preventive measures. In addition, regular inspection of the flange joints is important. Similar gas leaks have occurred frequently in flanges during recent accidents. Table 2 presents the data from Korea’s National Fire Agency, showing gas-leak accidents that have occurred in petrochemical plants over the past five years [11]. Examining the causes of the accidents in Table 2, it can be observed that most leaks occurred in pipelines (including pipes and valves), and a significant number occurred in joints such as flanges.
Table 2.
Status of leakage accidents in petrochemical complexes.
Many pipes and connecting equipment in petrochemical plants leak from joints, such as flanges, valves, and connectors. In [42], researchers selected a specific petrochemical plant in Korea, analysed the frequency of leaks at that plant, and found that the frequency of flange leaks was the highest among the pipeline joints. For a comparative analysis of the detection probability of the ultrasonic detectors configured in the research area, the conventional gas leak and ultrasonic detectors were arranged as shown in Figure 7.
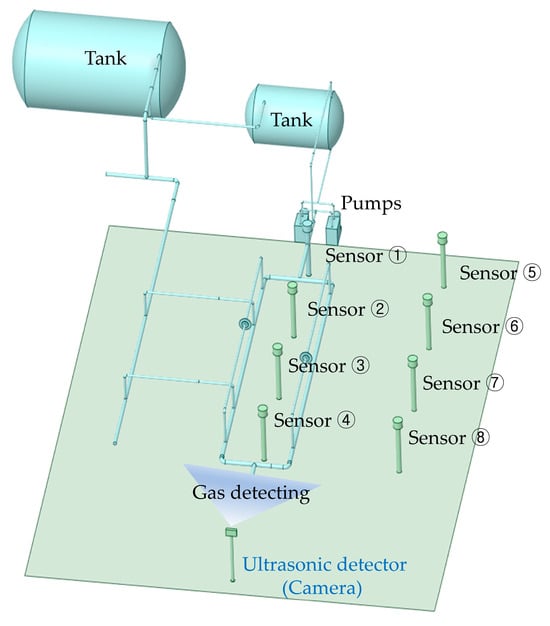
Figure 7.
Gas-leak monitoring system using ultrasonic technology.
4.1.3. Selected Material for Simulation
The Yeosu Industrial Complex was completed in 1979, and it is a comprehensive petrochemical industrial base located in Samil-dong, Yeosu-si, and Jeollanam-do. It is commonly called the Yeocheon or Yeosu Industrial Complex, and it is operated by the Korea Water Resources Corporation and the Korea Industrial Complex Corporation. It is a world-class petrochemical complex with many oil refining and petrochemical-related plants. More than 44 years have passed since construction was completed, and gas leaks and risks resulting from the ageing chemical plant are present; however, it is difficult to immediately identify when leaks occur. At the Yeosu Petrochemical Industrial Complex, 1-butene is widely used in the polymerisation process not only as a raw material but also as an intermediate and byproduct. However, in-depth studies that address the risks associated with 1-butene are scarce.
1-Butene is classified as an extremely flammable gas by the MSDS, and it is highly dangerous owing to the risk of explosion when heated. The flash point is very low at −80 °C, and hence, it is classified as the most hazardous substance according to the Korean insurance company’s classification of dangerous substances. A precautionary statement was issued stating all ignition sources, including ambient heat, sparks, open flames, and high temperatures, should be eliminated. Therefore, 1-butene present in the petrochemical process was selected and used in the simulation. Simulations performed on 1-butene are extremely rare and can serve as good references for future research.
4.2. Simulation Setup
Concentration-measuring gas detectors in petrochemical plants are installed adjacent to facilities with a high risk of leakage, in accordance with Korea’s ‘Technical Guidelines for Installation and Maintenance of Gas Leak Detection Alarms’ (Kosha Guide P-166-2020). Therefore, one or more gas-leak detection alarms should be installed. The detailed placement criteria were established based on the characteristics and risk levels of the facilities. It is stipulated that gas-leak detection alarms should be installed at least once per square meter, with a perimeter of 10–20 m around major facility areas [43]. In our simulation, we applied the most conservative and safe standards and placed the gas-leak detectors close to each other in all the areas subjected to the simulation, with at least one gas-leak detection alarm every 10 m in each area. CFD and Monte Carlo simulations were performed based on the gas-leak detectors arranged in this manner.
4.2.1. Computational Fluid Dynamics (CFD)
A facility geometry model was created using CFD software (Ansys Fluent 2022 R2). CFD simulations have been widely used to analyse gas flows [44,45,46], and we used this simulation to calculate the flow of gas leaks. The 1-butene accidental leak scenario was assumed to occur at two leak points (flanges), as shown in Figure 8a. Finally, after grid independence analysis and polyhedral mesh conversion, the grid number was 5,115,336, respectively. ANSYS Fluent was used to perform numerical calculations of the three-dimensional flow field, and the simulations were performed on a server with an Intel Xeon(R) Gold 6240 CPU (2.6 GHZ and 192 GB RAM). The average CPU time for one simulation for a leak time of 9.5 s was approximately 5 h. CFD relies on the principles of mass, momentum, and energy conservation, as described by Equations (1)–(3), respectively. Equation (1) for mass conservation is based on the continuity equation, which implies that the change in the fluid mass inside a control volume equals the mass flow across the control surface. Equation (2) reflects Newton’s second law adapted to fluid dynamics, integrating the forces acting on the fluid system and encompassing the body forces dependent on the mass and surface forces dependent on the area. This equation corresponds to the Navier–Stokes equation; however, it is more appropriately described as a law of momentum rather than strictly a law of momentum conservation. Equation (3) for energy conservation is derived from the first law of thermodynamics, which links the heat transfer, work rate, and kinetic energy in fluids.
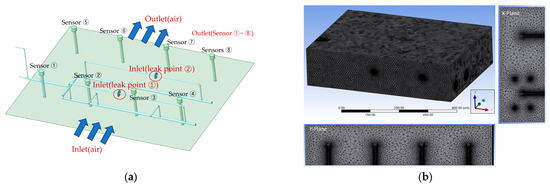
Figure 8.
Boundary conditions and mesh formation for the test environment. (a) Boundary conditions of the flow area; (b) mesh formation for the test environment.
Prior to conducting the numerical analysis, a grid was designed to discretise the continuum differential equations, thereby transforming them into a system of simultaneous equations. This implies that the resulting set of equations, representing various aspects of the physical model, are interdependent and must be solved together. Their solutions are not independent but interconnected, reflecting the comprehensive behaviour of the modelled system. This approach ensures a holistic and accurate representation of the dynamic interactions within the continuum. To obtain accurate results from the numerical analysis, both the model and mesh forms must be carefully considered. The types of meshes included hexa (hexahedral) and tetra (tetrahedral). Although hexa has the advantage of improving the simulation speed, it is more challenging to form a mesh with it. By contrast, tetra, although less advantageous in terms of simulation speed, allows for easier mesh formation. Figure 8b illustrates the mesh formation in the test environment, focusing on the actual flow area where the fluid dynamics occur. In this process, the tetra technique was employed to expedite the mesh formation. The mesh was carefully designed by extracting only the regions where fluid flow occurred, specifically excluding the areas occupied by major equipment, such as gas-leak detectors, pipelines, and pumps. This approach ensured that the mesh accurately represented the areas of interest in the test environment, thereby improving the reliability of the numerical analysis. Figure 8a shows the boundary conditions of the flow area. The air inlet was assumed to have a southerly wind, and the inlet conditions were set for the leakage of 1-butene from two leak points. The sides of eight gas-leak detectors, designated as sensors, were configured as outlets in our CFD model. This setup allowed for the simulation of gas passing through these outlets, enabling us to measure and analyse the volume (concentration) of the gas detected by these sensors. This arrangement in the CFD model mirrors the actual experimental setup, in which the gas flows towards these detectors, and thus, reflects realistic scenarios. The purpose was to simulate and quantify the gas concentrations detected by each sensor, thereby providing insight into the effectiveness of the detection system under various leakage scenarios.
4.2.2. Monte Carlo Simulations (System Dynamics)
Monte Carlo simulation is a mathematical method used to model stochastic phenomena and is particularly effective in scenarios where direct estimation is challenging. In this context, this method was applied to model complex phenomena within the experimental setup. ‘Problems that are difficult to estimate’ refer to the challenges in predicting the behaviour and interactions in complex systems, especially with numerous and probabilistic variables. Monte Carlo simulations were used to address these complexities by enabling a more accurate and detailed analysis of the system under study [47,48,49,50]. A risk assessment was performed by capturing the uncertainty of risk and analysing the probability of risk [51,52]. The Monte Carlo simulations produced two types of results. The first one estimated the ‘detection probability’ through Monte Carlo integration, which is a method of calculating the average of the model results based on the random variables in Figure 9a, as shown in Figure 9b. Sensitivity indicates the extent to which the results are affected by a specific factor. The analysed value of the variable (gas-detection probability) was obtained from the mean sensitivity (statistical range of the gas-detection probability). Using the mean sensitivity value, which indicates the statistical range of the gas-detection probability, the major measures to prevent gas leaks in oil refineries and petrochemical plants can be determined. This includes calculating both the ‘detection probability for each system’ and the ‘probability of combining the two systems’, thereby enhancing the overall effectiveness in detecting gas leaks.
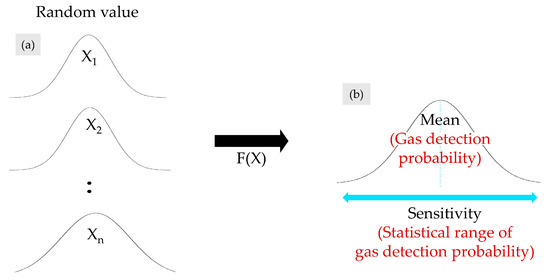
Figure 9.
Schematic of the Monte Carlo simulation procedure. (a) Example of random variables; (b) example of Monte Carlo integration and Monte Carlo sensitivity analysis.
5. Simulation
5.1. CFD
5.1.1. Analysis Conditions in CFD
Table 3 lists the conditions for the gas-leak flow analysis. A pressure-based solver was used for the transient analysis, which is a technique that simulates the flow over time by dividing it into time units and converging residuals. The turbulence model employed was the k-omega shear stress transport (SST), assuming an air inlet speed of 1.2 m/s. The k-omega SST model is a hybrid model that combines the free-flow-appropriate k-epsilon and wall-analysis-suited k-omega models. At the leak point, the inlet was set as a mass-flow inlet aligned with the real test conditions at 0.00217 kg/s. For the initialisation, the pressure, velocity, and turbulent kinetic energy were set to zero. The calculation settings for the analysis included a Courant number of one and an initial time step of 0.5 for the analysis.
Table 3.
Conditions for gas-leak flow analysis.
5.1.2. Results of CFD Analysis
Figure 10 shows the flow of the leaked gas, primarily obtained by monitoring the sensors within the flow region. The gas flow was represented by a volume of 0.0001 or higher, which corresponds to a concentration of approximately 0.01% (approximately 100 ppm). As shown in Figure 10a, the smoke was predicted to move northward owing to the southerly winds. Additionally, as shown in Figure 10b, it was visually confirmed that sensor 7 was included in the flow of 1-butene.
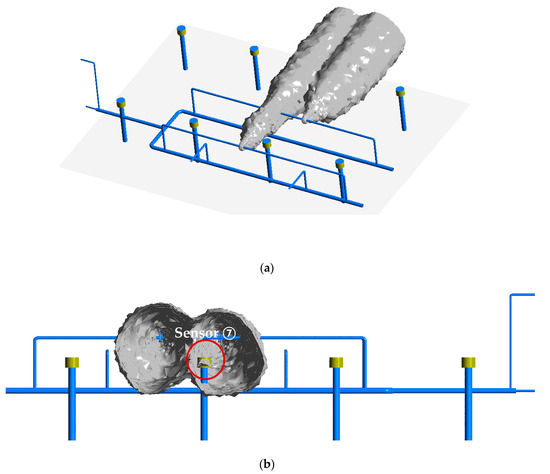
Figure 10.
Visualisation of sensor detection due to leaked gas flow. (a) Leak range viewed from above; (b) leak range and sensor detection viewed from the front.
The mass fraction of 1-butene detected by gas-leak sensor 7 was approximately 0.0006, and the contour graph, which represents the process from the leak to the smoke reaching the sensor, is shown in Figure 11. A maximum mass fraction of 0.0006 was detected; when converted to a concentration, it was 0.06% (~600 ppm).
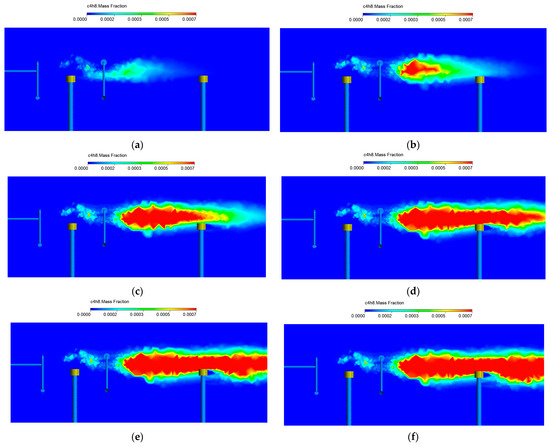
Figure 11.
Contour graph of the process until 1-butene reaches gas-leak detector number 7 after a leak: (a) 1 s; (b) 2 s; (c) 3 s; (d) 4 s; (e) 5 s; (f) ≥6 s.
The trends shown in Figure 11 correspond to the results detected over time by gas-leak detector 7 (sensor 7). Figure 12 presents the results of detecting the mass fraction of 1-butene over time, with an average of 0.00036 and a maximum value of 0.00061 over approximately 9.5 s. The maximum value of 0.00061, when converted to concentration, was 0.06%, as mentioned previously, which equates to approximately 600 ppm. The sensor range used for modelling was (0–2000) ppm, and the 600 ppm detected in the simulation was considered a level that could be reliably detected. Moreover, the remaining gas-leak detectors (numbers 1–6 and 8) detected nearly zero volumes, largely because of the constant southward winds. This wind prevents the gas from reaching the detectors, thereby affecting their detection capabilities. This phenomenon was influenced more by environmental conditions than by the shortcomings of the detectors. The detection time showed a significant increase, from 3.5 to 5 s, after which the rate of increase slowed and stabilised at approximately 6.5 s. 1-Butene was detected at 8.875 s when the concentration reached 600 ppm.
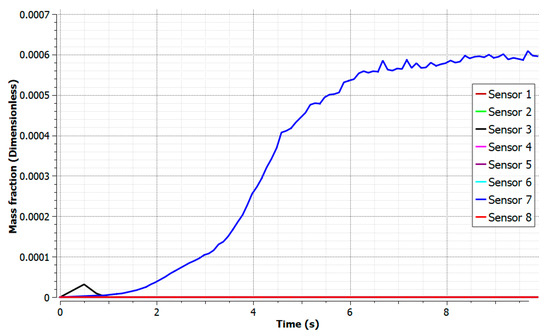
Figure 12.
Time-based graph of the mass fraction of 1-butene.
5.2. Monte Carlo Simulation
In this study, we employed a Monte Carlo simulation to analyse the detection probabilities of the concentration-measurement, ultrasonic, and combined gas-leak detection systems. The objective of utilising a Monte Carlo simulation was to approximate the detection probabilities of these specific sensors by incorporating random variables, such as wind direction, to reduce the risk of leak incidents. This methodology provides a detailed understanding of the performance of concentration-measurement, ultrasonic, and combined gas-leak detection systems under various environmental conditions, particularly concerning wind impact.
5.2.1. Gas-Leak Detection Probability Prediction Model
Table 4 lists the factors of the gas-leak detection probability prediction model. The input parameters comprise the wind direction, random seed, and seed value, which served as random variables in the Monte Carlo simulations. These factors are broadly categorised as common, concentration-measurement, ultrasonic, and combined gas-leak detection factors. The parameters include the maximum detection standard, minimum detection standard, and azimuth, which represent the maximum and minimum values of the wind direction and azimuth of the sensors relative to the leak point, respectively. Sensor detection probabilities 1, 2, and 3 represent the detection probabilities of the concentration-measurement, ultrasonic, and combined gas-leak detectors, respectively. The Poisson distribution, a probability distribution based on the likelihood of certain events occurring within a specific time period [53,54,55,56], was applied to the combined detector model in our study. Here, ‘events’ refer to instances where smoke is undetected. Specifically, in the combined detector model, which includes the ultrasonic detector, we assume that events of gas-leak nondetection occur once every 24 h. This statistical approach aids in understanding and predicting the detection capabilities of the combined system under various conditions.
Table 4.
List of parameters for gas-leak detection probability prediction model.
We defined the maximum detection standard as the upper limit at which the sensor detection was considered reliable. The sensor detection probability measures the likelihood of accurately detecting a gas leak under various conditions. The role of the Poisson distribution, particularly in its application to the combined detector model, was also elucidated. This statistical approach was employed to model the frequency of gas-leak non-detection events based on the average occurrence rate in the combined detector system.
Figure 13 shows the azimuthal configuration. It shows the azimuth (A) and distance (D, m) between sensors 1 and 8 and leak points 1 and 2. The azimuth from leak point 1 to sensors 1–8 ranges from 3.60 to 334.81, while that from leak point 2 to sensors 1–8 ranges from 30.73 to 343.50. If the wind direction and azimuth fall within a certain range, the algorithm processes them as if the sensor detects a gas leak.
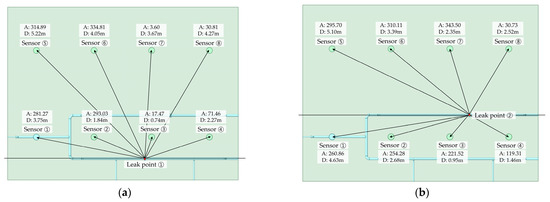
Figure 13.
Azimuth and distance between the leak point and the sensors. (a) Information between leak point 1 and sensors; (b) information between leak point 2 and the sensors.
Figure 14 shows the causality map for the parameters of the gas-leak detection probability model. The purpose of the causality map is to illuminate the overall flow of the system and the causal relationships between factors for the analysis of sensor detection probability. The map delineates the flow of model parameters and their interrelationships, where a plus sign (+) indicates direct proportionality and a minus sign (−) indicates inverse proportionality between variables. The figure emphasises the interactions between the various sensor detection probabilities. In the model, sensor detection probability 1 (SD1) is influenced by wind direction, which is modelled using the Monte Carlo method with a random seed. The random seed provided a fixed starting point in the simulations, ensuring that the same sequence of random numbers was produced, which was crucial for the reproducibility of the simulation outcomes. Different random seeds were applied to a normal distribution that was a part of the wind-direction parameters, allowing for various Monte Carlo simulations. The Poisson distribution, a statistical tool that predicts the probability of a given number of events occurring in a fixed interval of time or space, was used to determine sensor detection probability 2 (SD2). This distribution was incorporated into the model to simulate the detection probability of ultrasonic detectors using the Monte Carlo method and random seeding. The causality map also includes the maximum and minimum detection standards, which are likely thresholds for the sensor detection capabilities. These thresholds, along with the azimuth, which represents the orientation of the sensor relative to the leak source, determine the likelihood of detecting a gas leak.
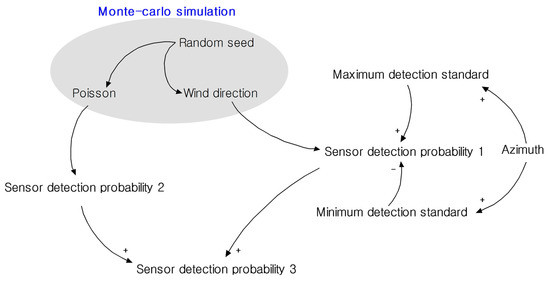
Figure 14.
Causal map of gas-leak detection probability model parameters.
The description provided in the text also mentions the use of normal distribution formulas and Poisson distributions in Monte Carlo simulations, which are common methods for simulating random events and are especially useful in complex systems where exact solutions are not feasible. This figure represents the complex interplay of the statistical and physical parameters that collectively form the backbone of the studied gas-leak detection model.
Equation (4) pertains to wind direction. ‘Normal ()’ is a random-number generation algorithm based on the normal distribution, ‘m’ is the statistical mean of wind direction, and ‘st’ signifies the standard deviation. The mean ‘m’ was determined to be 157.93 based on the study area, the Fire Insurer Laboratories of Korea (FILK), and the standard deviation was calculated to be 124.92, both of which were then input into the Monte Carlo model. Equation (5) relates to the SD1 estimates for gas-leak detectors and represents the percentage ratio of detected occurrences at the final time of 720 h. ‘Wt’ refers to the wind direction over time, ‘Min’ is the minimum detection standard, and ‘Max’ is the maximum detection standard. ‘Min’ and ‘Max’ are depicted as values of plus or minus 5–10, based on the wind angles shown in Figure 13a,b.
Equation (6) relates to the SD2 estimates for the ultrasonic detectors. ‘P’ stands for Poisson (distribution), and an expectation of 1/24 is assigned to assume an average of one ultrasonic detector recognition error per day. This assumption was based on a scenario in which the camera angle changed, causing the ultrasonic waves hidden by the pipe to remain undetected by the vision system. When P is one, it is assumed to be a recognition error situation, returning a value of zero; when P is zero, it signifies normal detection, returning a value of one. Equation (7) considers Poisson () as a random-number generation algorithm based on a Poisson distribution. ‘M’ is the expected value, for which 1/24 is input, and ‘R’ signifies the random seed. Equation (8) is the formula for the Poisson distribution, based on which the Poisson () algorithm generates random numbers determined by the expected value.
Equation (9) represents SD3, and the sensor detection probability is estimated for the combined detectors. It returns a value of 1, signifying successful detection, when ‘Wt’ is equal to or greater than ‘Min’ and less than or equal to ‘Max’, or when the value of ‘P’ is not one. Under other conditions, for example, when the value of ‘P’ is one, it returns zero. As more conditions return to one, SD3 is expected to exhibit a higher tendency than SD1 or SD2.
5.2.2. Prediction Results and Comparative Analysis of Detection Probability
Figure 15 shows the sensitivity and windrose graphs for the wind direction. The vertical span of the graph represents the sensitivity and indicates the statistical range (5–95%) for the wind direction. At the final time of 720 min, the average was 144.43°, and the sensitivity was 342.47°. Windrose is primarily used in meteorology and indicates the direction in which wind is blowing. Based on the Janghowon observation station, the average wind speed was 1.6 m/s, and the average wind direction was north (NNW).
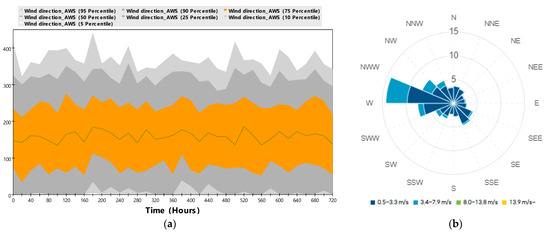
Figure 15.
Wind-velocity prediction results and windrose graph. (a) Wind-velocity prediction results; (b) windrose graph.
Figure 16 shows a sensitivity graph of the detection rates of the eight sensors when gas leaked from leak point 1. The average detection probabilities for sensors 1–8 over 720 h were 2.92%, 2.64%, 2.54%, 3.89%, 2.19%, 1.80%, 11.85%, and 2.83%, respectively. The vertical span in Figure 16 represents the sensitivity and shows the statistical range of detection probabilities, covering values between 5% and 95% of the total percentage. The sensitivities, representing the difference between the top 95% and 5% values, were calculated as 1.95%, 1.94%, 1.94%, 2.64%, 1.94%, 1.81%, 4.03%, and 2.07%, respectively.
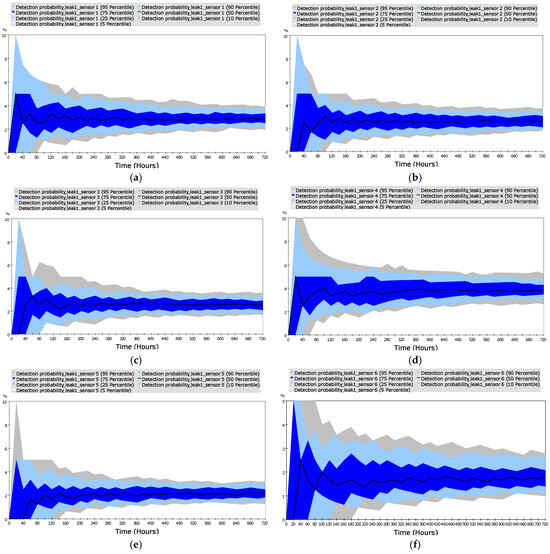
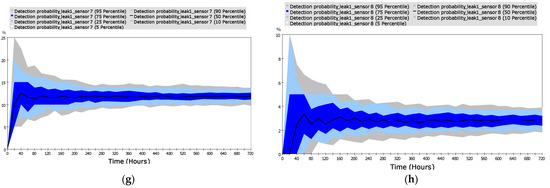
Figure 16.
Analysis results of concentration-measurement type gas-leak detection probability (from leak 1 to the indicated sensor): (a) leak 1 to sensor 1; (b) leak 1 to sensor 2; (c) leak 1 to sensor 3; (d) leak 1 to sensor 4; (e) leak 1 to sensor 5; (f) leak 1 to sensor 6; (g) leak 1 to sensor 7; (h) leak 1 to sensor 8.
Figure 17 shows a sensitivity graph of the detection rates of the eight sensors when gas leaked from leak point 2. The average detection rates for sensors 1–8 over 720 h were 3.44%, 3.60%, 4.18%, 4.65%, 2.58%, 2.24%, 1.61%, and 2.84%, respectively. The vertical span in Figure 17 represents the sensitivity and shows the statistical range of detection probabilities, covering values between 5% and 95% of the total percentage. The corresponding sensitivities were 2.50%, 2.22%, 2.36%, 2.36%, 1.66%, 1.80%, 1.53%, and 1.94%.
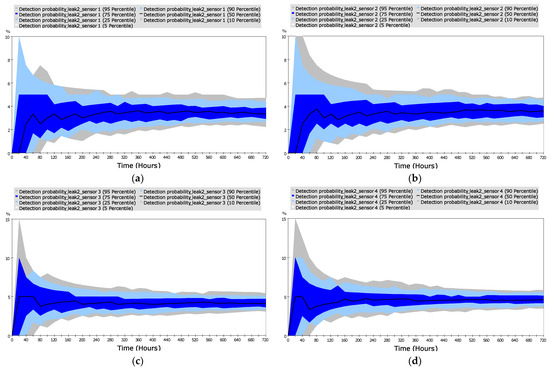
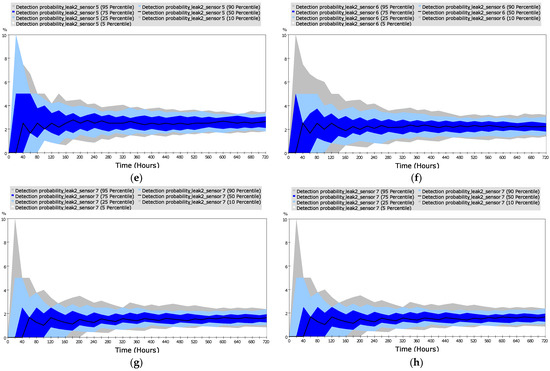
Figure 17.
Analysis results of concentration-measurement type gas-leak detection probability (leak 2 to the indicated sensor): (a) leak 2 to sensor 1; (b) leak 2 to sensor 2; (c) leak 2 to sensor 3; (d) leak 2 to sensor 4; (e) leak 2 to sensor 5; (f) leak 2 to sensor 6; (g) leak 2 to sensor 7; (h) leak 2 to sensor 8.
Figure 18 shows the sensitivity of the detection rate of the ultrasonic sensor. The analysed detection probability calculated from the average sensitivity was 96.07%, and the sensitivity was 2.36%.
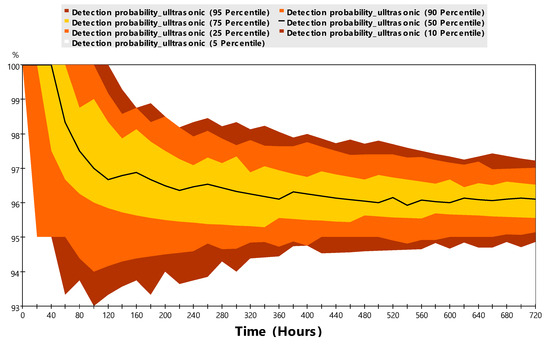
Figure 18.
Analysis results of ultrasonic detection probability.
Figure 19 compares the analysed detection probabilities for concentration-measurement, ultrasonic, and combined gas-leak detectors. When converged to 99.99%, the ultrasonic detector converged to 96.07%, and the average detection probability for each sensor of the concentration-measurement type gas-leak detector was 3.78% for leak point 1 and 3.04% for leak point 2. Upon analysing leak point 1, which exhibited a higher detection probability, it was determined that the efficiency of the ultrasonic detector was approximately 25.42 times that of the concentration-measurement gas-leak detector. This factor was calculated by dividing the detection probability of the former by that of the latter. Similarly, the efficiency of the combined detector was approximately 26.45 times greater than that of the concentration-measurement gas-leak detector, which was determined by dividing the detection probability of the former by that of the latter. The average of leak points 1 and 2 was 3.41%; in this case, the ultrasonic detector was approximately 28.17 times more efficient than the concentration-measurement gas-leak detector, and the combined detector was approximately 29.32 times more efficient.
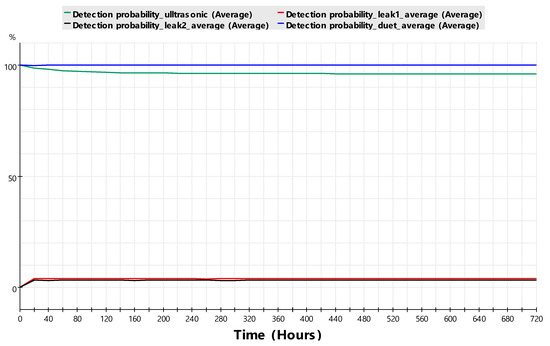
Figure 19.
Comparative graph of the detection rates for the concentration-measurement, ultrasonic, and combined gas-leak detectors.
These probabilities are based on simulations targeting the verification test site built within the Fire Insurers Laboratories of Korea (FILK) and are limited to cases where the structures of piping and vessels are simple, and all the expected leakage areas can be seen by the ultrasonic camera in one direction. Petrochemical plants have complex installations with multiple pipes and structures, making it difficult to monitor all leaks from one direction. Therefore, a gas-leak detection method must be selected and applied efficiently, according to the structure and conditions of each area within each petrochemical plant. The model can be appropriately utilised if the detection range of the ultrasonic camera is clearly identified according to the characteristics of the area, and a comparative simulation of the area is performed.
6. Discussion
Monte Carlo simulations confirmed that the leakage detection system using ultrasonic waves has a higher probability of detection performance than the existing concentration-measurement methods. However, it is realistically impossible to remove all the gas-leak detectors using the concentration-measurement method installed in oil refineries and petrochemical plants and to replace them with ultrasonic detection methods. Instead, it is more realistic to maintain the existing system and add an ultrasonic detection system. When the two systems were combined, the detection probability was 96.58% higher than that attained when the concentration-measurement method was used alone, and 3.92% higher than that when the ultrasonic measurement method was used alone. If the two systems are used interchangeably, the concept of failure safety, which can detect gas leaks in another system even if one system breaks down, can be introduced into the workplace. Safety against failure is a basic and important concept. This study suggests a direction for advanced gas-leak detection systems in future oil refining and petrochemical plants. In addition, applications in places where large amounts of gas are used, such as workplaces, buildings, residential facilities, and sales facilities in other industries, as well as in the oil refining and petrochemical industries, can be considered. However, it is difficult to apply it uniformly to all spaces. First, it is necessary to determine the suitability of each space by identifying its characteristics and leaking materials and performing simulations. In addition, optimal placement of ultrasonic and concentration-measurement gas-leak detectors is required, considering the characteristics of each region. The optimal placement includes a discussion of camera placement issues when the expected gas-leak area is obscured by pipes or structures. If a fixed ultrasound camera can rotate up, down, left, and right, it can detect more areas, and the development of this technology will increase its utility. Ultrasonic detection technology is more prone to misidentification owing to ambient noise than because of the ultrasonic waves generated by leakage. Further research is required to overcome the misperceptions caused by ambient noise. Additional research requires the incorporation of artificial intelligence, and the use of convolutional neural networks may be a solution.
7. Conclusions
In this study, we propose an ultrasonic gas-leak monitoring system for quick and accurate detection of gas leaks, which is one of the major risks in oil refining and petrochemical plants. We built a demonstration test facility that simulated oil refining and petrochemical plants and conducted tests to verify the system. To compare and analyse this verified ultrasonic gas-leak monitoring system with existing systems, detection performance parameters, such as detection time and detection probability, were calculated and quantified through CFD and Monte Carlo simulations.
- (1)
- A fixed ultrasonic gas-leak monitoring system was proposed. The performance of the ultrasonic camera was enhanced, including securing the detection performance in the case of microleakage and strengthening the waterproofing function. To confirm the performance of the ultrasonic camera, a laboratory-scale test was conducted following the ASTM E 1002-11 standard, and gas leakage was detected even when the camera was 5 m away from the leak source under a microleakage condition of 1.67 mL/s. The waterproofing performance of the ultrasonic camera exhibited an IP of 55 or higher;
- (2)
- We individually visited oil refining and petrochemical plants to review drawings and conduct field investigations. Layouts and 3D drawings were created through field and literature research. Based on these drawings, a demonstration test facility simulating oil refining and petrochemical plants within the FILK was built. The literature related to gas leaks and frequencies was investigated, and a test scenario was established through an analysis of accident cases;
- (3)
- The performance of the ultrasonic gas-leak monitoring system was verified through demonstration tests that reflected the environment of oil refining and petrochemical plants. It was confirmed that gas-leak detection was possible up to approximately 23 m under the conditions of internal piping pressure of 2.2 bar, leak diameter of 6.9 mm, and leak rate of 0.00217 kg/s. The ultrasonic gas-leak detection time was approximately 8 s, including 3 s for the integrated surveillance system monitoring image processing time and 5 s for leak determination;
- (4)
- Using CFD, we visually expressed the flow owing to gas diffusion and the phenomenon of reaching a concentration that could be detected by concentration-measuring gas detectors, calculated the gas-leak detection time, and compared it with that of an ultrasonic gas-leak monitoring system. The CFD results indicated that the gas-leak detection time of the existing system was 8.895 s. This is slightly longer than the 8 s leak detection time of the ultrasonic gas-leak monitoring system;
- (5)
- As a result of the Monte Carlo simulation, it was calculated that, when the two systems were combined, the detection probability was 96.58% higher than that achieved when the concentration-measurement method was used alone and 3.92% higher than that attained when the ultrasonic measurement method was used alone. The combination of the two systems exhibited the best performance.
Author Contributions
Conceptualisation, J.H.L.; methodology, H.S.Y.; software, S.B.H.; validation, Y.K.; formal analysis, I.K.; investigation, Y.K.; resources, I.K.; data curation, S.B.H.; writing—original draft, J.H.L.; writing—review and editing, S.B.H.; visualisation, J.H.L.; supervision, H.S.Y.; project administration, J.H.L.; funding acquisition, Y.K. All authors have read and agreed to the published version of the manuscript.
Funding
This study was funded by Korea Planning & Evaluation Institute of Industrial Technology (KEIT) under the ‘Development of leakage detection technology based on sound/video fusion to prevent pipe accidents in medium and low pressure in the petrochemical industries’ (grant number 20022223).
Data Availability Statement
Data are available upon reasonable request with permission from the corresponding author and the data management institution.
Conflicts of Interest
Authors Youngsik Kim and Inkwon Kim were employed by the companies Stratio, Inc. and SM Instruments, Inc. The remaining authors declare that the research was conducted in the absence of any commercial or financial relationships that could be construed as a potential conflict of interest.
References
- Gómez-Mares, M.; Muñoz, M.; Casal, J. Axial Temperature Distribution in Vertical Jet Fires. J. Hazard. Mater. 2009, 172, 54–60. [Google Scholar] [CrossRef]
- Ogle, R.A.; Megerle, M.V.; Morrison, D.R.; Carpenter, A.R. Explosion Caused by Flashing Liquid in a Process Vessel. J. Hazard. Mater. 2004, 115, 133–140. [Google Scholar] [CrossRef]
- Zhang, Y.; Cui, Z.; Wang, M.; Liu, B.; Fan, X.; Tian, W. An Energy-Efficiency Prediction Method in Crude Distillation Process Based on Long Short-Term Memory Network. Processes 2023, 11, 1257. [Google Scholar] [CrossRef]
- Jonathan, E.; Sugiarto, S. Risk Analysis of Gas Dispersion, Fire and Explosion Due to Gas Pipeline Leak at Onshore Receiving Facility of PT XYZ in Muara Karang Using Aloha Software 5.4. Int. J. Eng. Bus. Soc. Sci. 2023, 1, 186–198. [Google Scholar] [CrossRef]
- Dadkani, P.; Noorzai, E.; Ghanbari, A.H.; Gharib, A. Risk Analysis of Gas Leakage in Gas Pressure Reduction Station and Its Consequences: A Case Study for Zahedan. Heliyon 2021, 7, e06911. [Google Scholar] [CrossRef]
- Satterfield, T. Advocacy after Bhopal: Environmentalism, Disaster, New Global Orders. Kim Fortun J. Anthropol. Res. 2003, 59, 284–286. [Google Scholar] [CrossRef]
- da Silva, I.G.S.; Pappalardo, J.R.; da Rocha e Silva, N.M.P.; Converti, A.; de Almeida, F.C.G.; Sarubbo, L.A. Treatment of Motor Oil-Contaminated Soil with Green Surfactant Using a Mobile Remediation System. Processes 2023, 11, 1081. [Google Scholar] [CrossRef]
- French McCay, D.P.; Whittier, N.; Ward, M.; Santos, C. Spill Hazard Evaluation for Chemicals Shipped in Bulk Using Modeling. Environ. Model. Softw. 2006, 21, 156–169. [Google Scholar] [CrossRef]
- Singh, S.; Chakma, S.; Alawa, B.; Kalyanasundaram, M.; Diwan, V. Identification, Characterization, and Implications of Microplastics in Soil—A Case Study of Bhopal, Central India. J. Hazard. Mater. Adv. 2023, 9, 100225. [Google Scholar] [CrossRef]
- NICS Integrated Chemical Information System (ICIS). Available online: https://www.icis.me.go.kr/ (accessed on 4 July 2023).
- National Fire Agency National Fire Data System (NFDS). Available online: https://www.nfds.go.kr (accessed on 3 July 2023).
- Seo, W.; Im, S.; Lee, G. Characteristics of the Received Signal of an Ultrasonic Sensor Installed in a Chamber with Micro-Leakage. Mech. Sci. 2021, 12, 1051–1060. [Google Scholar] [CrossRef]
- Li, J.; Wan, J.; Wang, T.; Yuan, G.; Jurado, M.J.; He, Q. Leakage Simulation and Acoustic Characteristics Based on Acoustic Logging by Ultrasonic Detection. Adv. Geo-Energy Res. 2022, 6, 181–191. [Google Scholar] [CrossRef]
- Naranjo, E. The Monitor-Monitoring Large Hydrogen Sulfide Releases: Why Sensor Recovery Time Is Important. Available online: https://www.damonhydro.com (accessed on 26 November 2023).
- Ramya, V. Embedded System for Hazardous Gas Detection and Alerting. Int. J. Distrib. Parallel Syst. 2012, 3, 287–300. [Google Scholar] [CrossRef]
- Jarvis, R.; Cawley, P.; Nagy, P.B. Current Deflection NDE for the Inspection and Monitoring of Pipes. NDT E Int. 2016, 81, 46–59. [Google Scholar] [CrossRef]
- Fang, J.; Xiang, J.; Ma, L.; Liu, H.; Wang, C.; Liang, S. Gas-Driven Endoscopic Robot for Visual Inspection of Corrosion Defects Inside Gas Pipelines. Processes 2023, 11, 1098. [Google Scholar] [CrossRef]
- Wang, T.K.; Lin, Y.H.; Shen, J.Y. Developing and Implementing an AI-Based Leak Detection System in a Long-Distance Gas Pipeline. Adv. Technol. Innov. 2022, 7, 169–180. [Google Scholar] [CrossRef]
- Adegboye, M.A.; Karnik, A.; Fung, W.K. Numerical Study of Pipeline Leak Detection for Gas-Liquid Stratified Flow. J. Nat. Gas. Sci. Eng. 2021, 94, 104054. [Google Scholar] [CrossRef]
- Ishak, A.J.; Mahmood, S.N.; Hussain, A.S.T. GSM Based Gas Leak Monitoring System. Period. Eng. Nat. Sci. 2019, 7, 670–678. [Google Scholar] [CrossRef]
- Meribout, M.; Khezzar, L.; Azzi, A.; Ghendour, N. Leak Detection Systems in Oil and Gas Fields: Present Trends and Future Prospects. Flow Meas. Instrum. 2020, 75, 101772. [Google Scholar] [CrossRef]
- Kang, R.; Liatsis, P.; Kyritsis, D.C. Emission Quantification via Passive Infrared Optical Gas Imaging: A Review. Energies 2022, 15, 3304. [Google Scholar] [CrossRef]
- Olbrycht, R. A Novel Method for Sensitivity Modelling of Optical Gas Imaging Thermal Cameras with Warm Filters. Quant. Infrared Thermogr. J. 2022, 19, 331–346. [Google Scholar] [CrossRef]
- Adnan, N.F.; Ghazali, M.F.; Amin, M.M.; Hamat, A.M.A. Leak Detection in Gas Pipeline by Acoustic and Signal Processing—A Review. IOP Conf. Ser. Mater. Sci. Eng. 2015, 100, 012013. [Google Scholar] [CrossRef]
- Li, J.; Li, Y.; Huang, X.; Ren, J.; Feng, H.; Zhang, Y.; Yang, X. High-Sensitivity Gas Leak Detection Sensor Based on a Compact Microphone Array. Measurement 2021, 174, 109017. [Google Scholar] [CrossRef]
- Diaconu, B.M. Recent Advances and Emerging Directions in Fire Detection Systems Based on Machine Learning Algorithms. Fire 2023, 6, 441. [Google Scholar] [CrossRef]
- Martinka, J.; Rantuch, P.; Martinka, F.; Wachter, I.; Štefko, T. Improvement of Heat Release Rate Measurement from Woods Based on Their Combustion Products Temperature Rise. Processes 2023, 11, 1206. [Google Scholar] [CrossRef]
- Mahalingam, A.; Naayagi, R.T.; Mastorakis, N.E. Design and Implementation of an Economic Gas Leakage Detector. Recent. Res. Appl. Electr. Comput. Eng. 2012, 3. [Google Scholar]
- Khan, M.M. Sensor-Based Gas Leakage Detector System. Eng. Proc. 2020, 2. [Google Scholar] [CrossRef]
- Meribout, M. Gas Leak-Detection and Measurement Systems: Prospects and Future Trends. IEEE Trans. Instrum. Meas. 2021, 70. [Google Scholar] [CrossRef]
- Kim, S.-R.; Moon, H.-S.; Jeong, P.-H. Optimal Ventilation Design for Flammable Gas Leaking from Gas Box Used in Semiconductor Manufacturing: Case Study on Korean Semiconductor Industry. Fire 2023, 6, 432. [Google Scholar] [CrossRef]
- Ou, J.; Wang, X.; Ming, Y.; Sun, X. Study on the Influence of Ventilation Speed on Smoke and Temperature Characteristics of Complex Underground Spaces. Fire 2023, 6, 436. [Google Scholar] [CrossRef]
- Reddy, D.B.M. Gas Leakage with Auto Ventilation and Smart Management System Using IOT. Int. J. Sci. Res. Eng. Manag. 2022, 6. [Google Scholar] [CrossRef]
- Hadlock, C.R.; Woolford, S.W. Optimizing Management of Emergency Gas Leaks: A Case Study in Business Analytics. J. Bus. Anal. 2019, 2, 88–99. [Google Scholar] [CrossRef]
- Bandes, A.S. Operations & Maintenance: Detect Leaks with Ultrasound. Chem. Eng. 2002, 109. [Google Scholar]
- Freiberger, K. Development and Evaluation of Source Localization Algorithms for Coincident Microphone Arrays; Graz University of Technology: Graz, Austria, 2010. [Google Scholar]
- Dibiase, J.H. A High-Accuracy, Low-Latency Technique for Talker Localization in Reverberant Environments Using Microphone Arrays; Brown University: Providence, RI, USA, 2000. [Google Scholar]
- SM Instruments Inc. Ultrasonic Camera. Available online: https://www.smins.co.kr (accessed on 29 June 2023).
- Xu, M.; Tao, W. Study on Gas Leakage Localization Method Based on Ultrasonic Sensor Area Array. In Proceedings of the IEEE/ASME International Conference on Advanced Intelligent Mechatronics, Munich, Germany, 3–7 July 2017; AIM: Cranberry Township, PA, USA, 2017. [Google Scholar]
- ASTM International ASTM E1002-11, Standard Practice for Leaks Using Ultrasonics. Available online: http://www.astm.org/Standards/ (accessed on 21 June 2023).
- KFPA KFS (Korea Fire Safety) 700-2018 Standards: Standard on Fire Protection for Petroleum and Petrochemical Plants. Available online: https://kfs.kfpa.or.kr/ (accessed on 21 June 2023).
- Ku, C.; An, S.; Ma, B. Analysis Characteristic of Non-Point Source in Petrochemical. KIGAS 2022, 26. [Google Scholar] [CrossRef]
- KOSHA Technical Guidelines for Installation and Maintenance of Gas Leak Detector (Kosha Guide P-166-2020). Available online: https://www.kosha.or.kr/ (accessed on 21 June 2023).
- Rong, Y.; Peng, J.; Gao, J.; Zhang, X.; Li, X.; Pan, X.; Chen, J.; Chen, S. Numerical Investigation on the Liquid Hydrogen Leakage and Protection Strategy. Processes 2023, 11, 1173. [Google Scholar] [CrossRef]
- Li, G.; Yang, X.; Dai, G. CFD Simulation of Effects of the Configuration of Gas Distributors on Gas-Liquid Flow and Mixing in a Bubble Column. Chem. Eng. Sci. 2009, 64, 5104–5116. [Google Scholar] [CrossRef]
- Tauseef, S.M.; Rashtchian, D.; Abbasi, S.A. CFD-Based Simulation of Dense Gas Dispersion in Presence of Obstacles. J. Loss Prev. Process Ind. 2011, 24, 371–376. [Google Scholar] [CrossRef]
- Grumbach, F.; Müller, A.; Reusch, P.; Trojahn, S. Robustness Prediction in Dynamic Production Processes—A New Surrogate Measure Based on Regression Machine Learning. Processes 2023, 11, 1267. [Google Scholar] [CrossRef]
- Pokorádi, L. Monte-Carlo Simulation-Based Accessibility Analysis of Temporal Systems. Symmetry 2022, 14, 303. [Google Scholar] [CrossRef]
- Bird, G.A. Monte carlo simulation of gas flows. Annu. Rev. Fluid. Mech. 1978, 114, 11–31. [Google Scholar] [CrossRef]
- Kim, J.; Smit, B. Efficient Monte Carlo Simulations of Gas Molecules inside Porous Materials. J. Chem. Theory Comput. 2012, 8, 2336–2343. [Google Scholar] [CrossRef]
- Qazi, A.; Simsekler, M.C.E. Risk Assessment of Construction Projects Using Monte Carlo Simulation. Int. J. Manag. Proj. Bus. 2021, 14, 1202–1218. [Google Scholar] [CrossRef]
- Ming, X.; Liang, Q.; Dawson, R.; Xia, X.; Hou, J. A Quantitative Multi-Hazard Risk Assessment Framework for Compound Flooding Considering Hazard Inter-Dependencies and Interactions. J. Hydrol. 2022, 607, 127477. [Google Scholar] [CrossRef]
- El-Dawoody, M.; Eliwa, M.S.; El-Morshedy, M. An Extension of the Poisson Distribution: Features and Application for Medical Data Modeling. Processes 2023, 11, 1195. [Google Scholar] [CrossRef]
- Sahai, H.; Khurshid, A. Confidence Intervals for the Mean of a Poisson Distribution: A Review. Biom. J. 1993, 35, 857–867. [Google Scholar] [CrossRef]
- Mijburgh, P.A.; Visagie, I.J.H. An Overview of Goodness-of-Fit Tests for the Poisson Distribution. S. Afr. Stat. J. 2020, 54, 207–230. [Google Scholar] [CrossRef]
- Bidounga, R.; Batsindila Nganga, P.C.; Niéré, L.; Mizère, D. A Note on the (Weighted) Bivariate Poisson Distribution. Eur. J. Pure Appl. Math. 2021, 14, 192–203. [Google Scholar] [CrossRef]
Disclaimer/Publisher’s Note: The statements, opinions and data contained in all publications are solely those of the individual author(s) and contributor(s) and not of MDPI and/or the editor(s). MDPI and/or the editor(s) disclaim responsibility for any injury to people or property resulting from any ideas, methods, instructions or products referred to in the content. |
© 2023 by the authors. Licensee MDPI, Basel, Switzerland. This article is an open access article distributed under the terms and conditions of the Creative Commons Attribution (CC BY) license (https://creativecommons.org/licenses/by/4.0/).