
Investigating the Microwave-Assisted Extraction Conditions and Antioxidative and Anti-Inflammatory Capacities of Symphytum officinale WL Leaves


Abstract
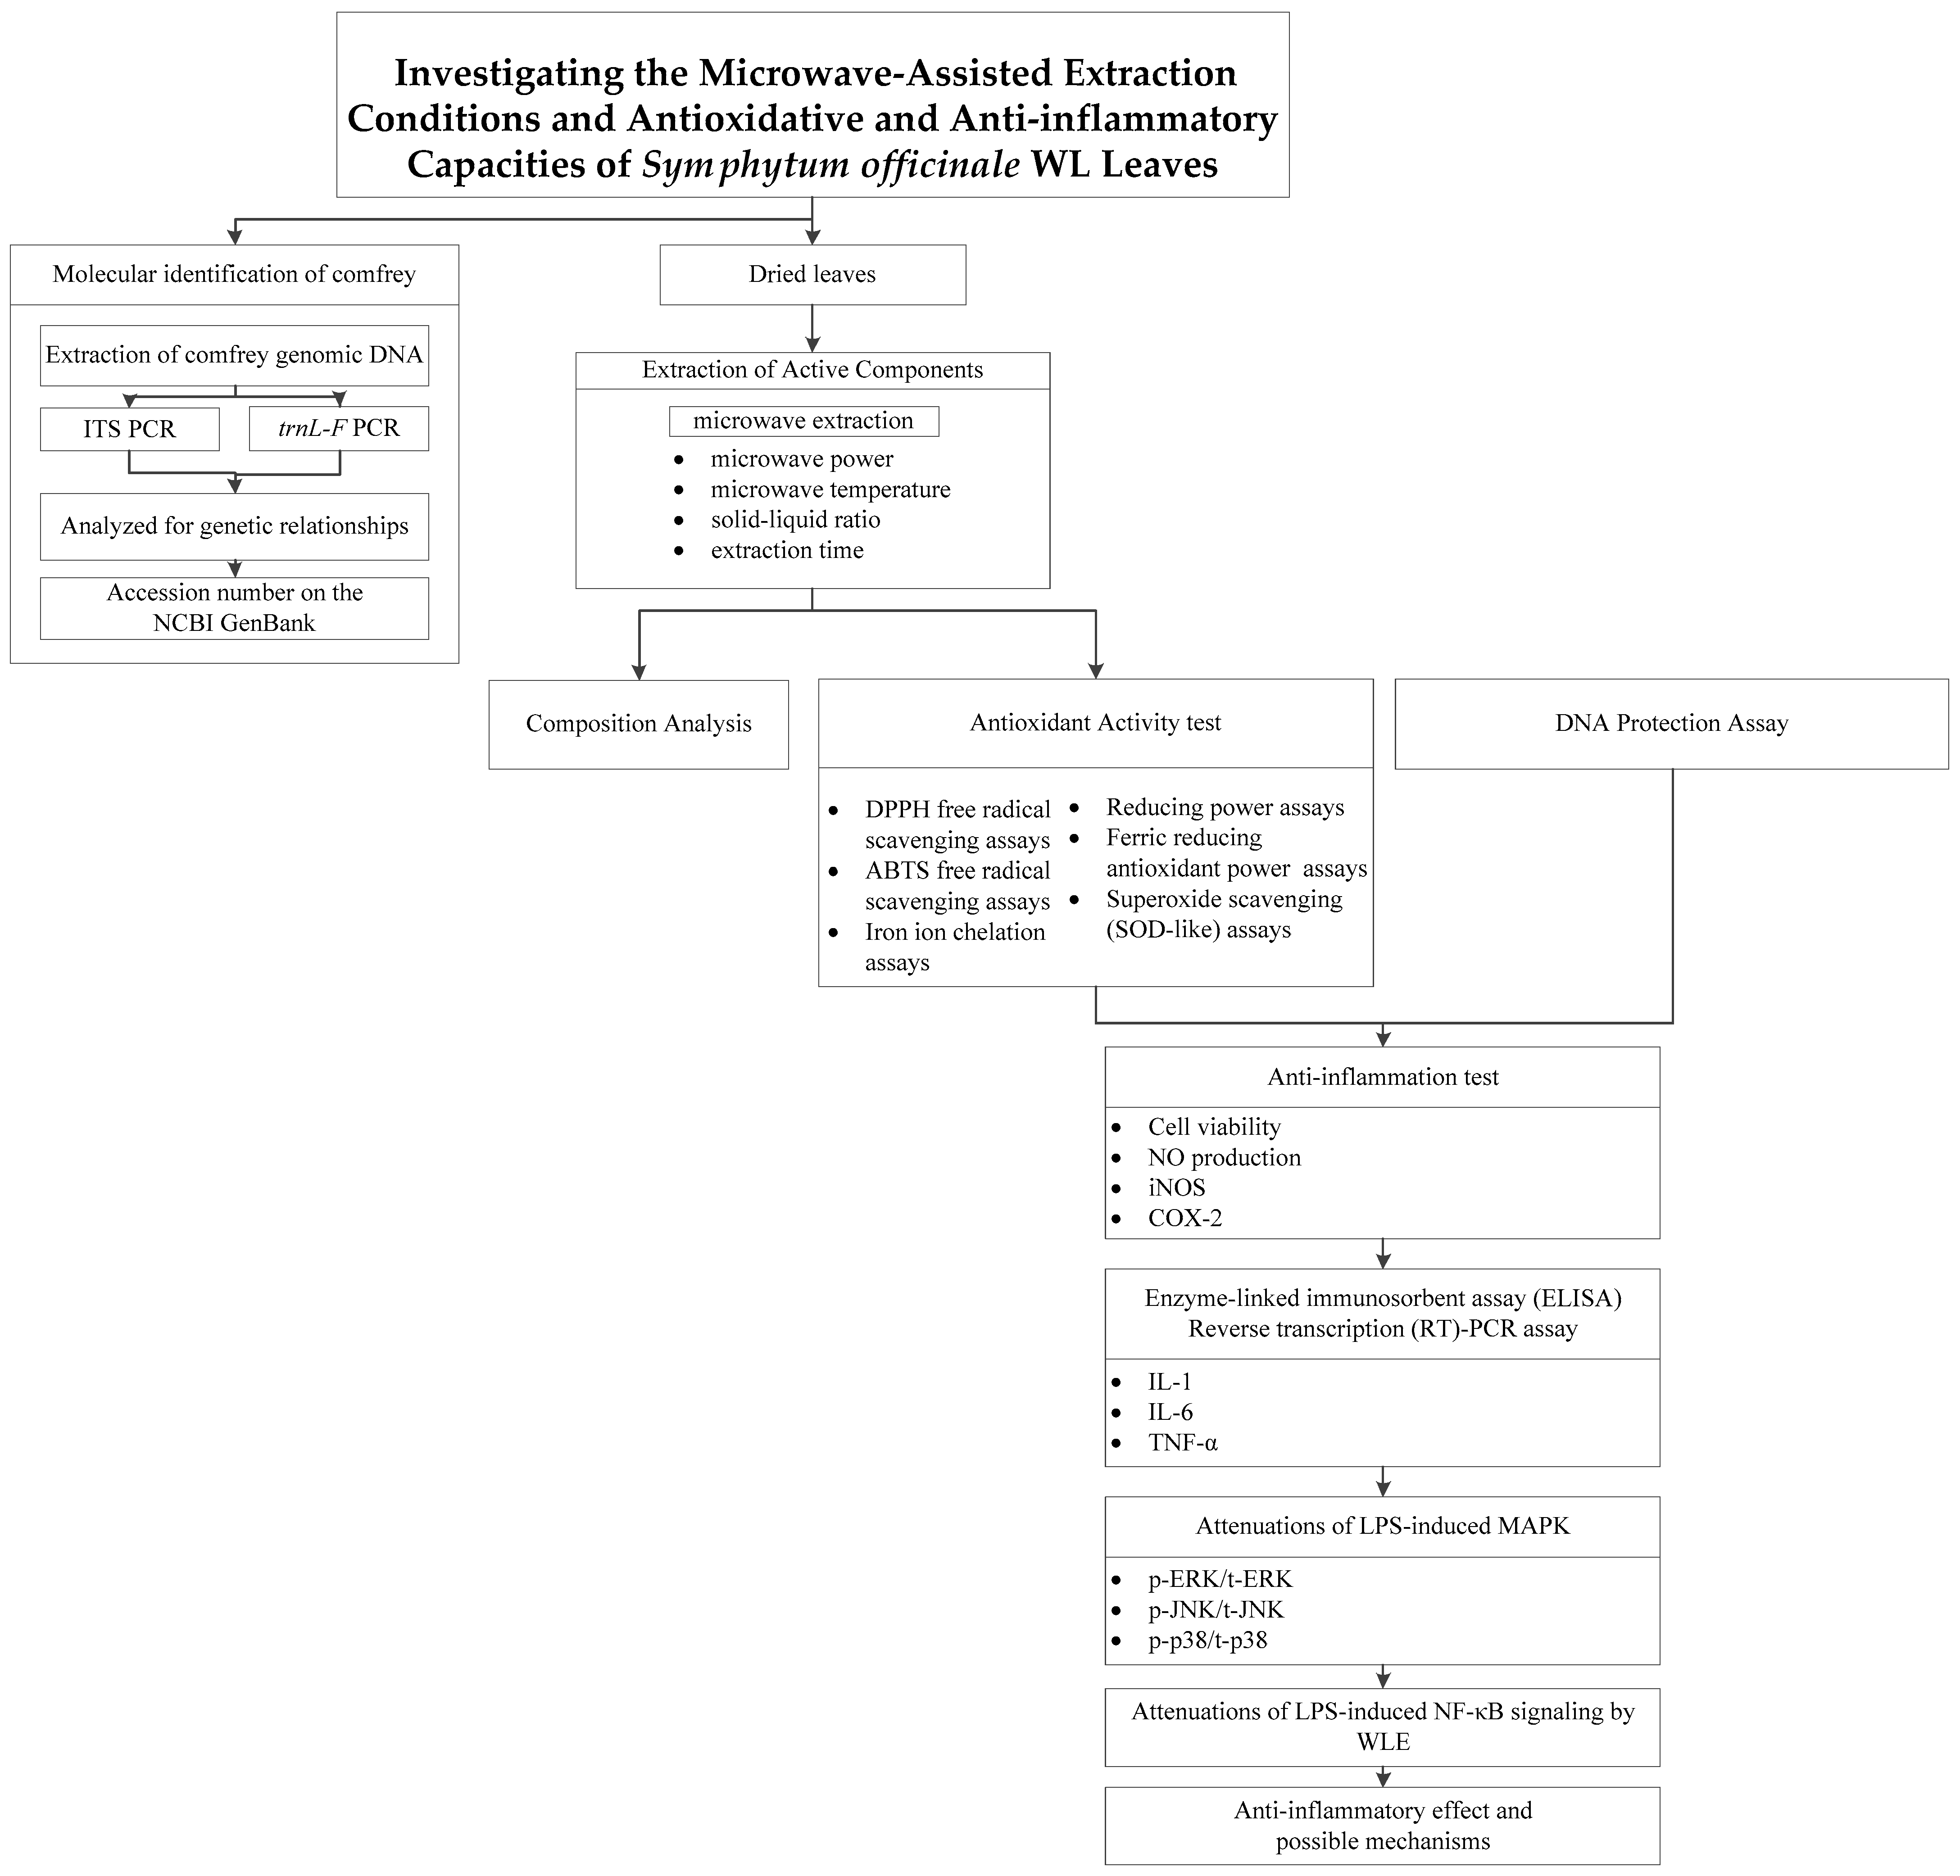
:1. Introduction
2. Materials and Methods
2.1. Materials (Plant and Chemicals)
2.2. Extraction of Comfrey Genomic DNA
2.3. Molecular Identification of Comfrey
2.4. Assays of Suitable MAE Conditions
2.5. Assays of Extraction Yield
2.6. Assays of Total Phenolic and Flavonoid Contents
2.7. DPPH Free Radical Scavenging Assay
2.8. ABTS Free Radical Scavenging Assay
2.9. Iron Ion Chelation Assay
2.10. Reducing Power Assay
2.11. Ferric Reducing Antioxidant Power (FRAP) Assay
2.12. Superoxide Scavenging (SOD-Like) Assay
2.13. DNA Protection Assay
2.14. HPLC Assays
2.15. Cell Culture
2.16. Cell Viability Assay
2.17. Nitrite Determination
2.18. Reverse Transcription (RT)-PCR Assay
2.19. Enzyme-Linked Immunosorbent Assay (ELISA)
2.20. Western Blots
2.21. NF-κB Nuclear Translocation Assay
2.22. Statistical Analyses
3. Results and Discussion
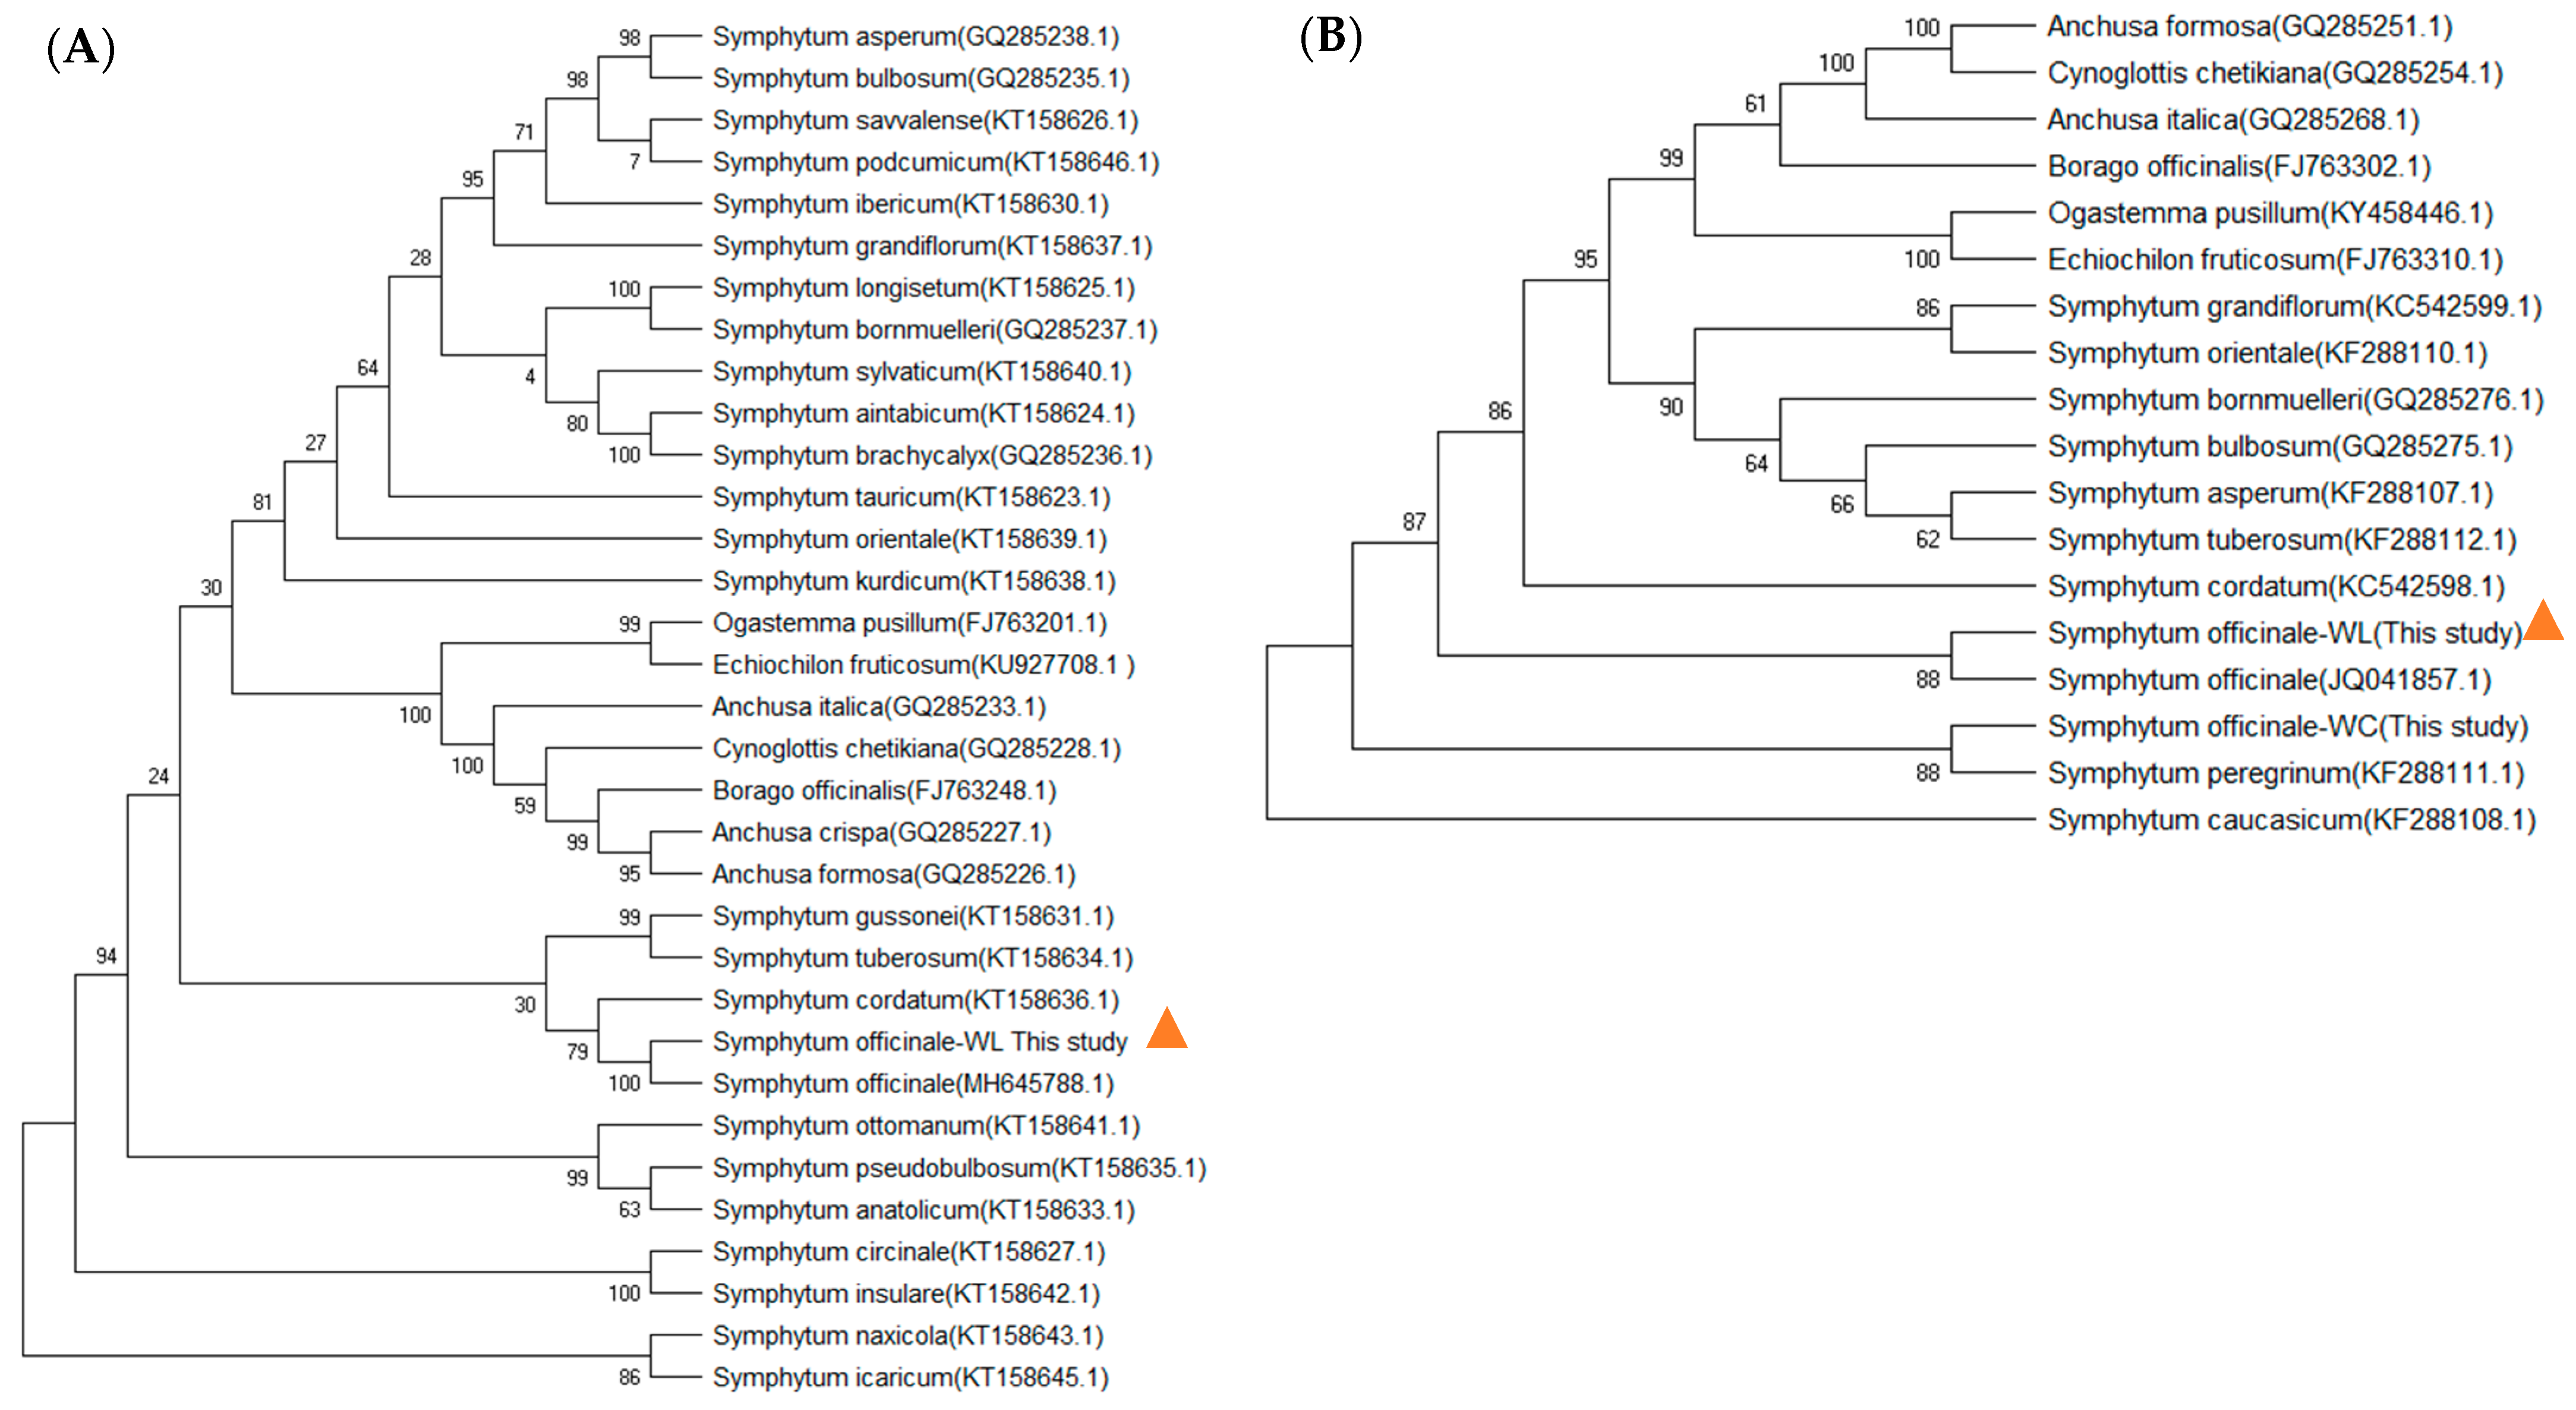
3.1. Molecular Identification of Native Comfrey Species
3.2. The Suitable MAE Conditions of WLE
3.2.1. The Microwave Radiation Power
3.2.2. The Microwave Temperature
3.2.3. The Aqueous Methanol Concentration
3.2.4. The Solid-to-Solvent Ratio
3.2.5. The Extraction Time
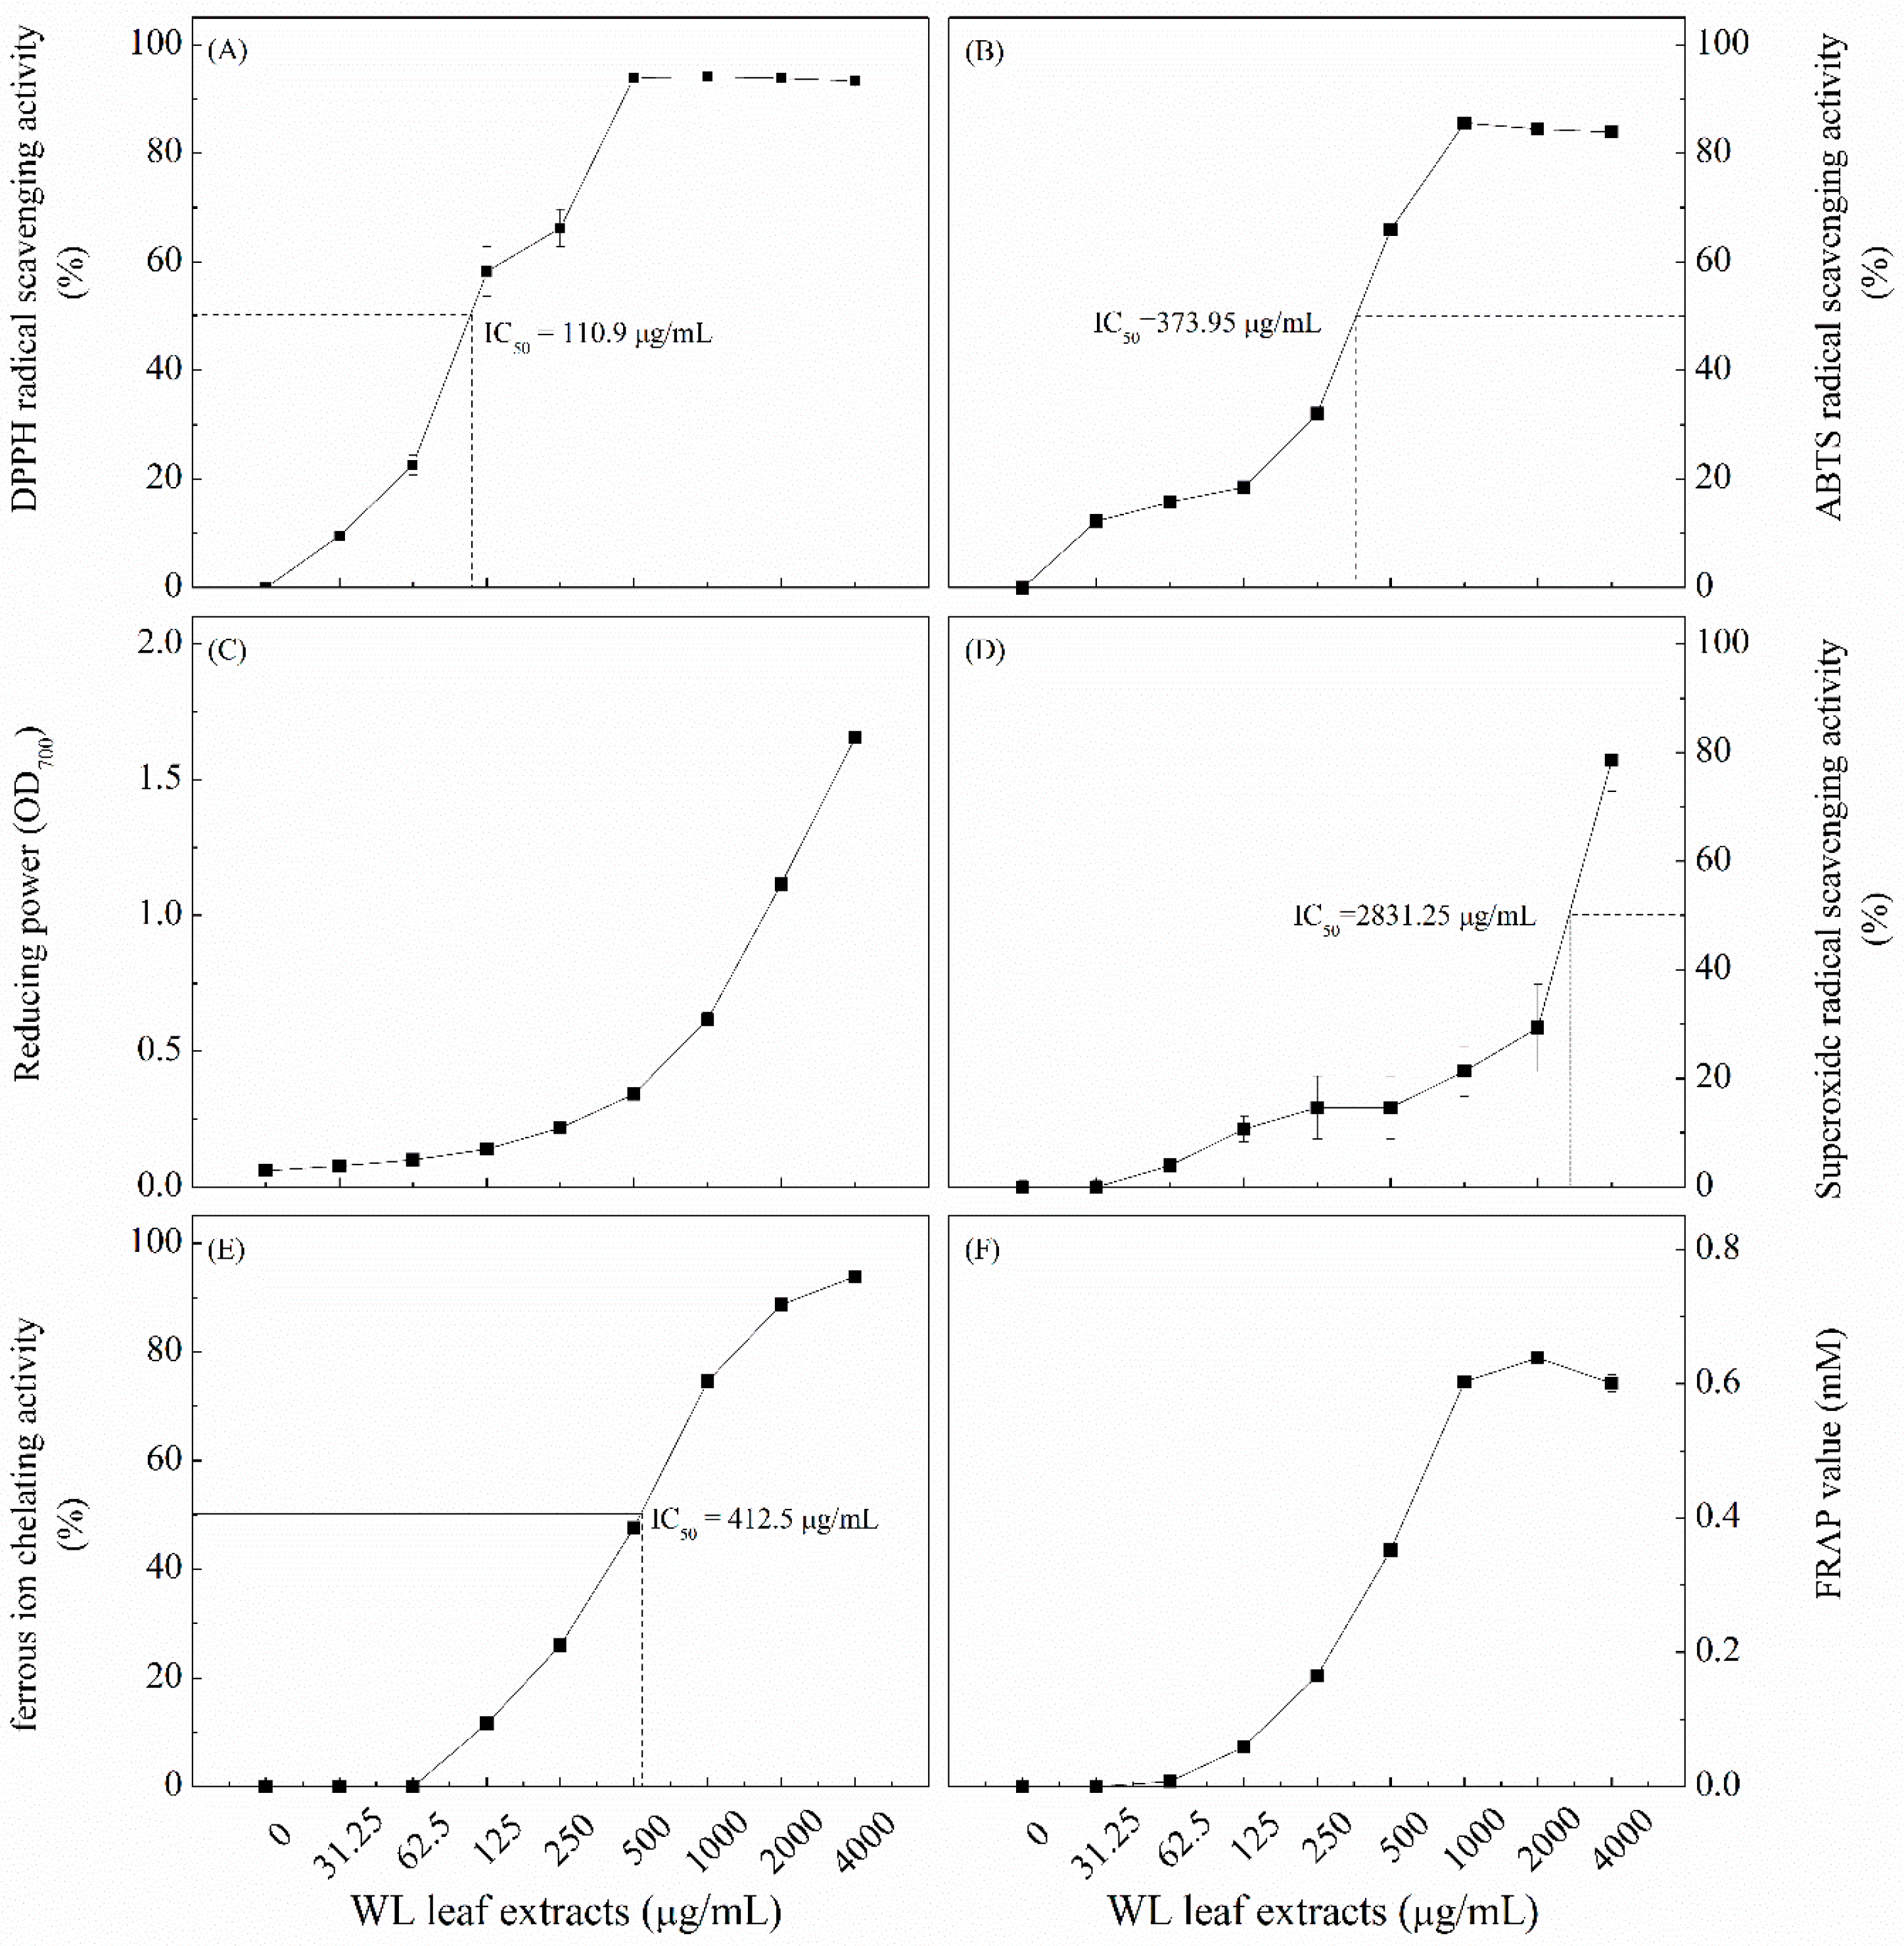
3.3. Antioxidant Capacity of WLE
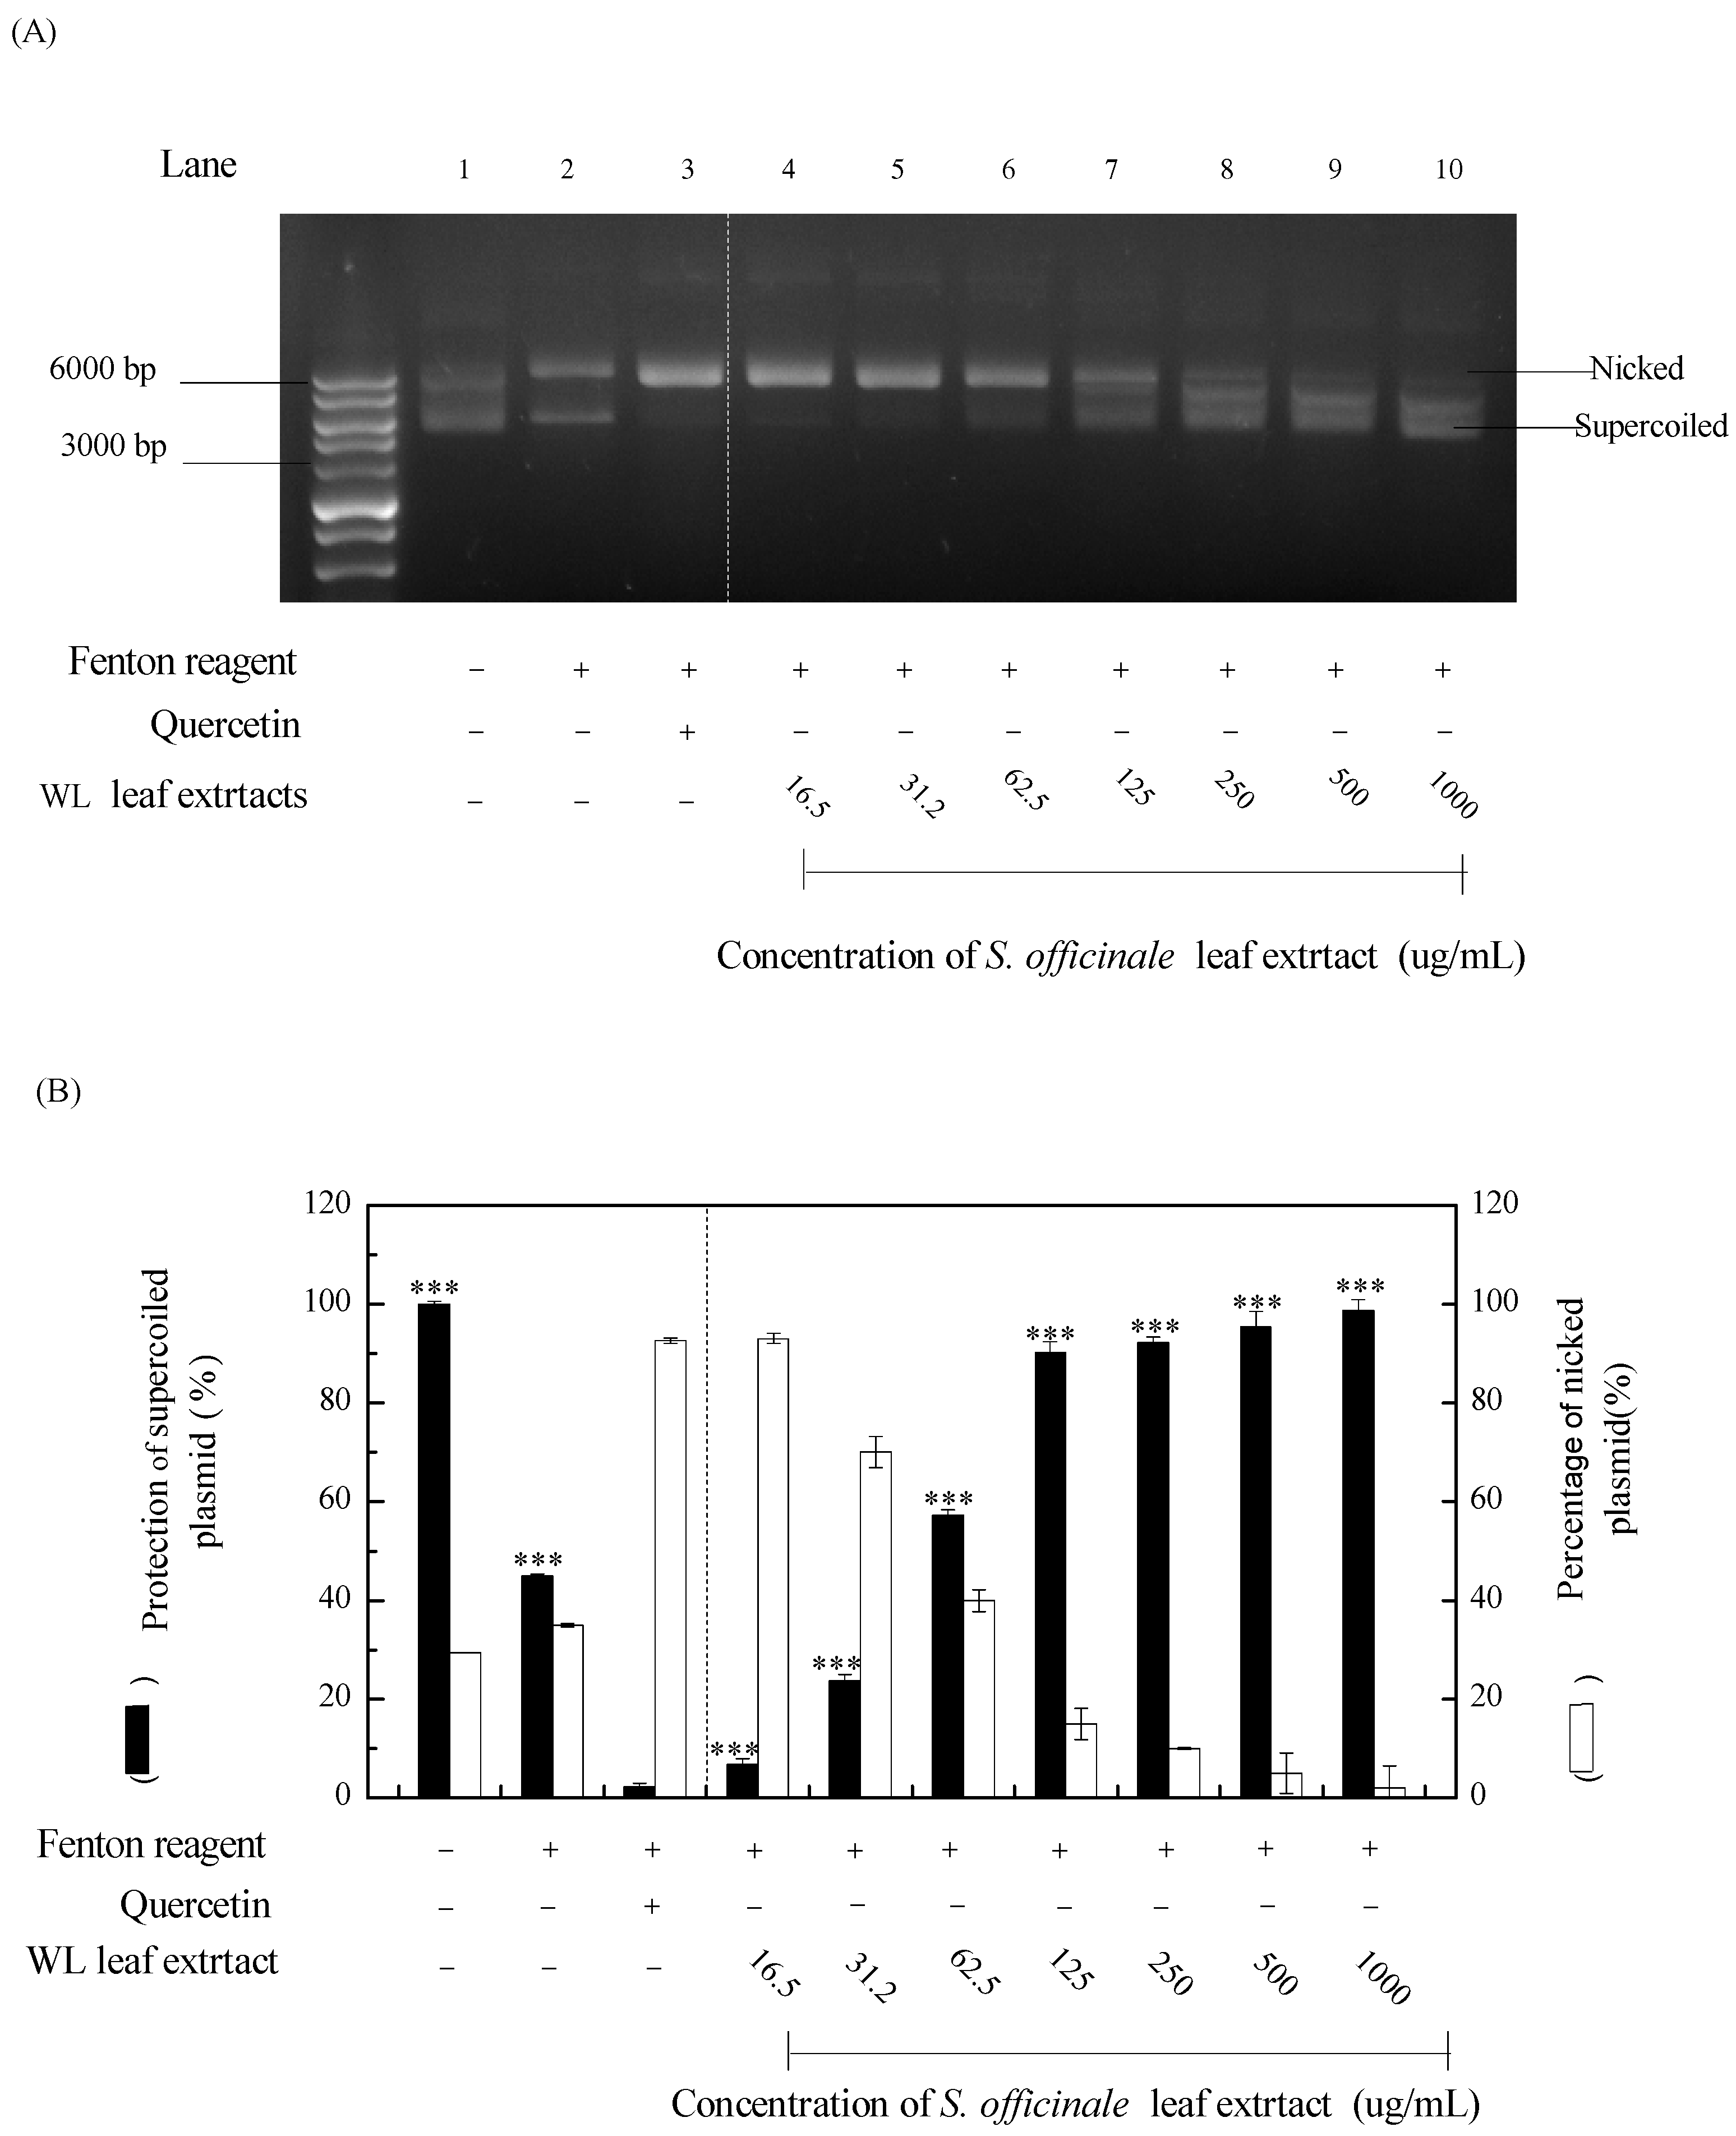
3.4. DNA Protective Assay of WLE
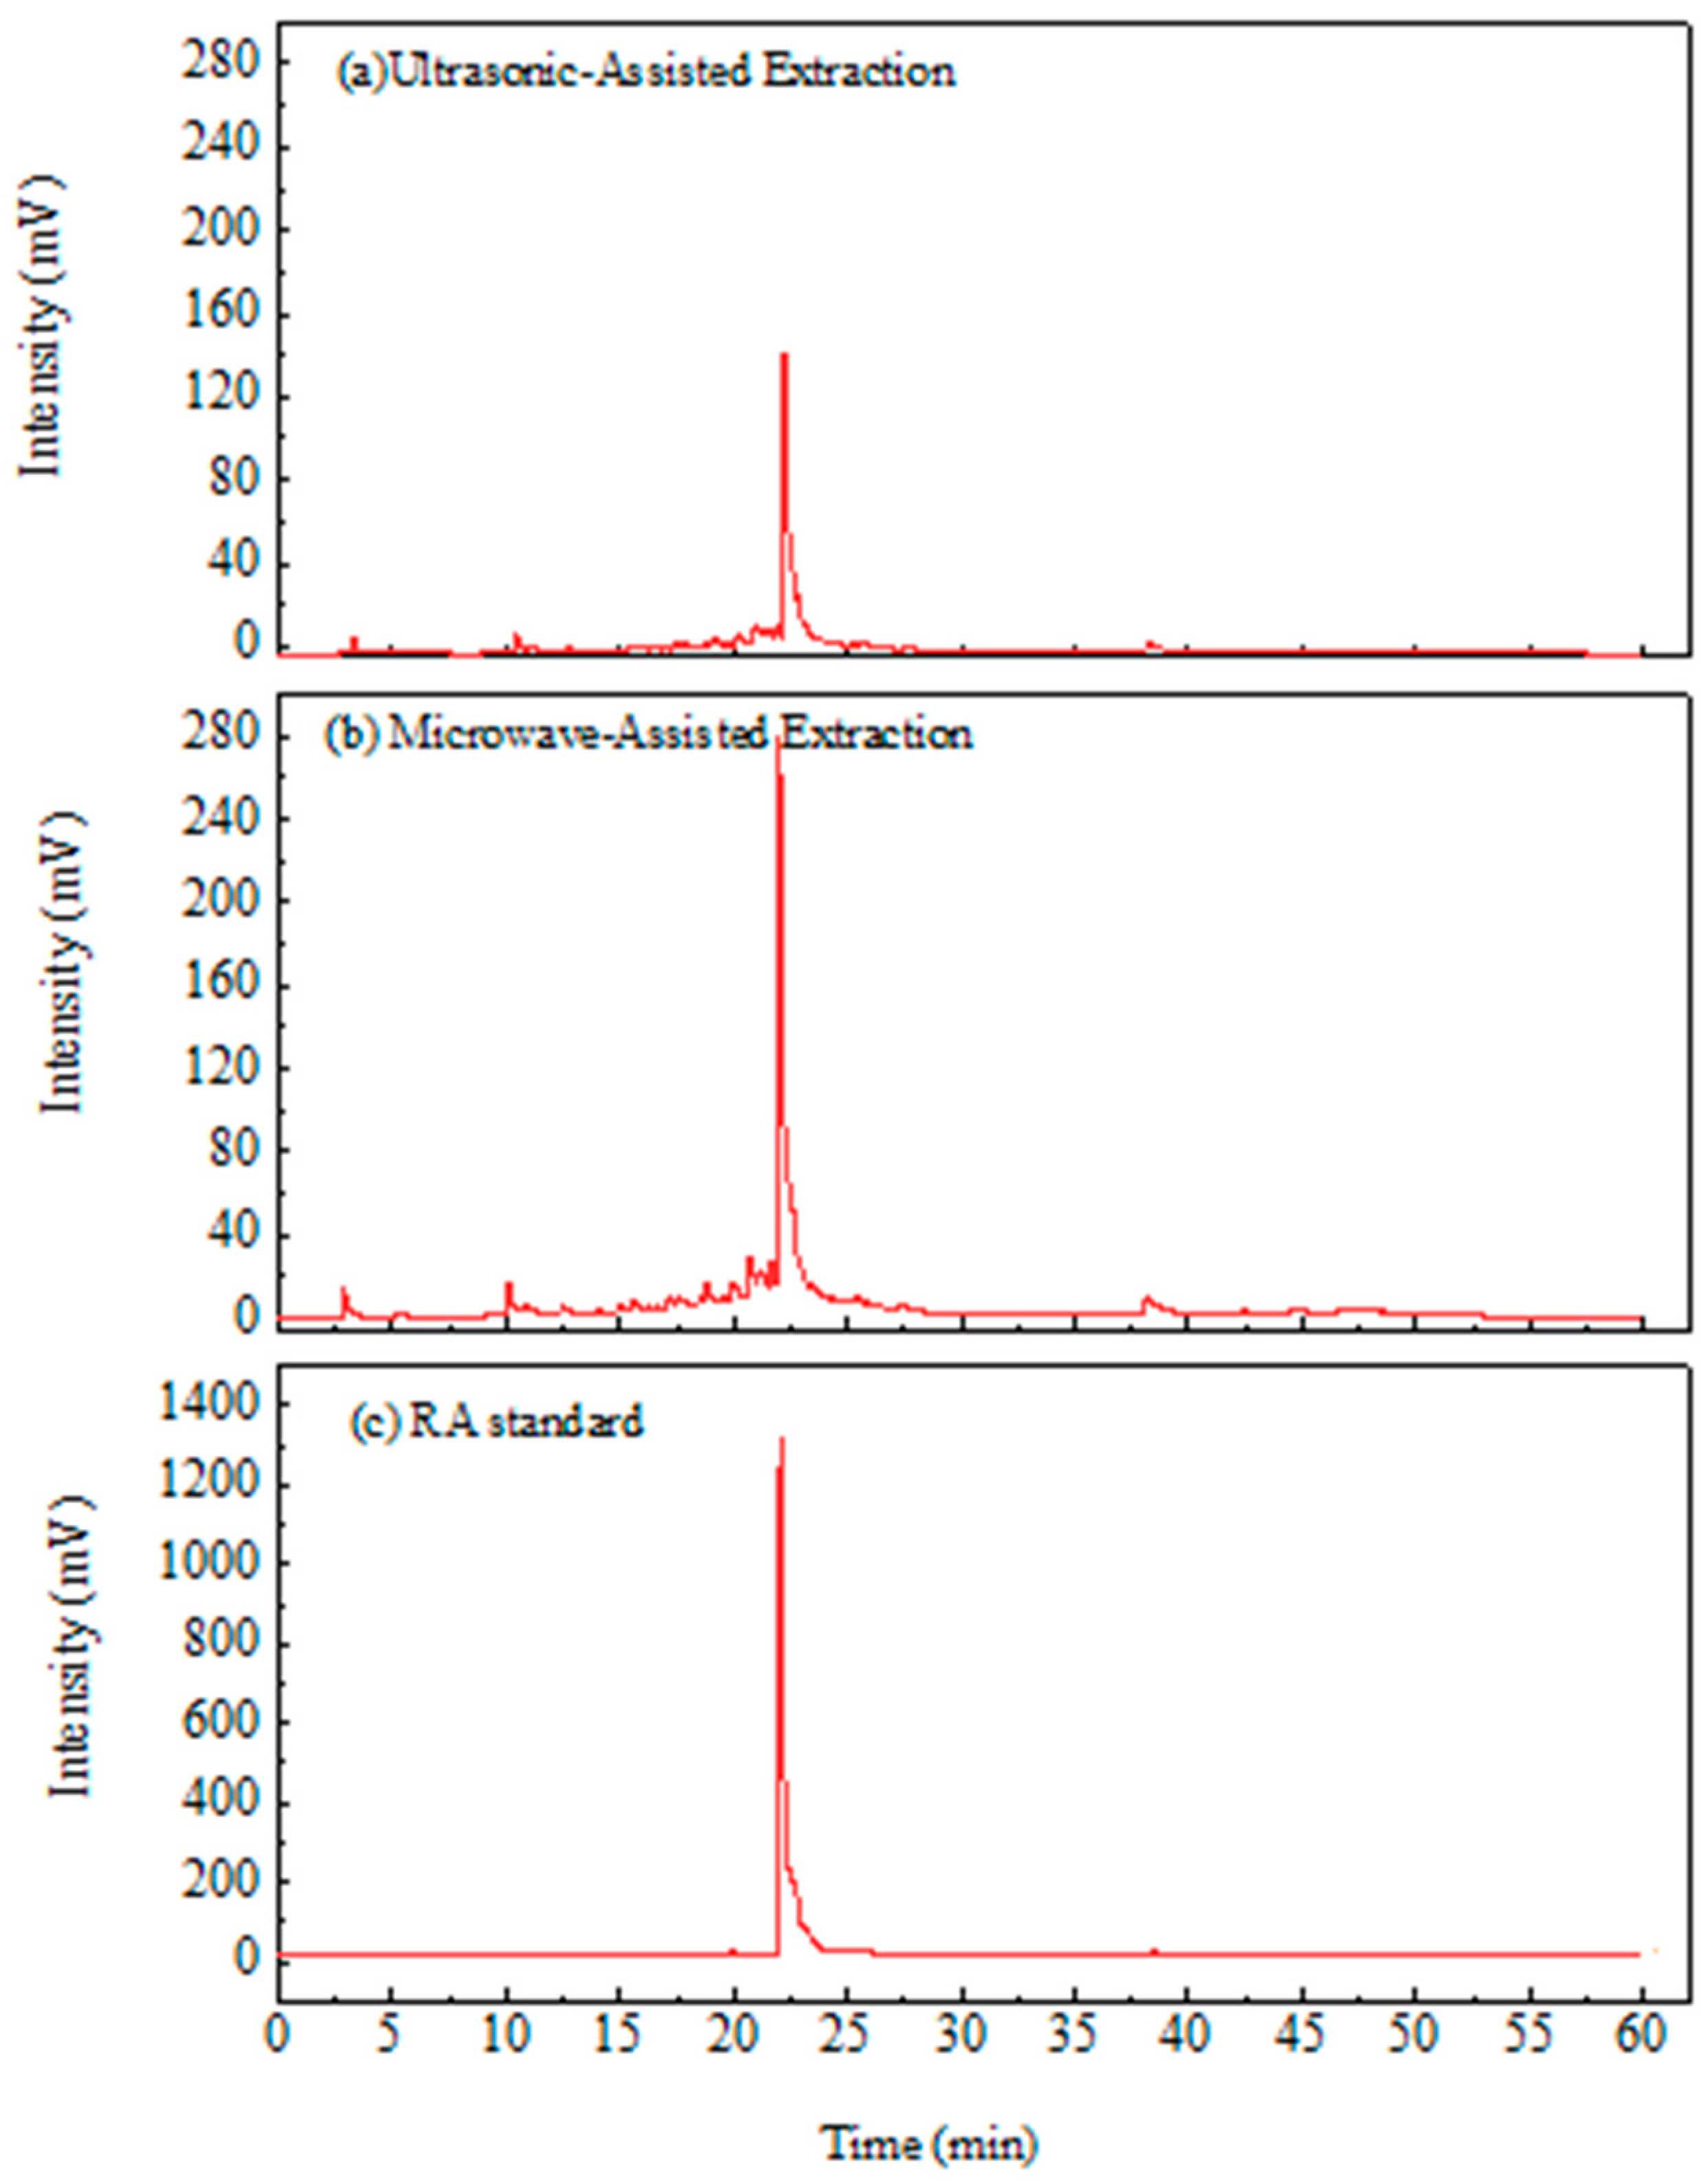
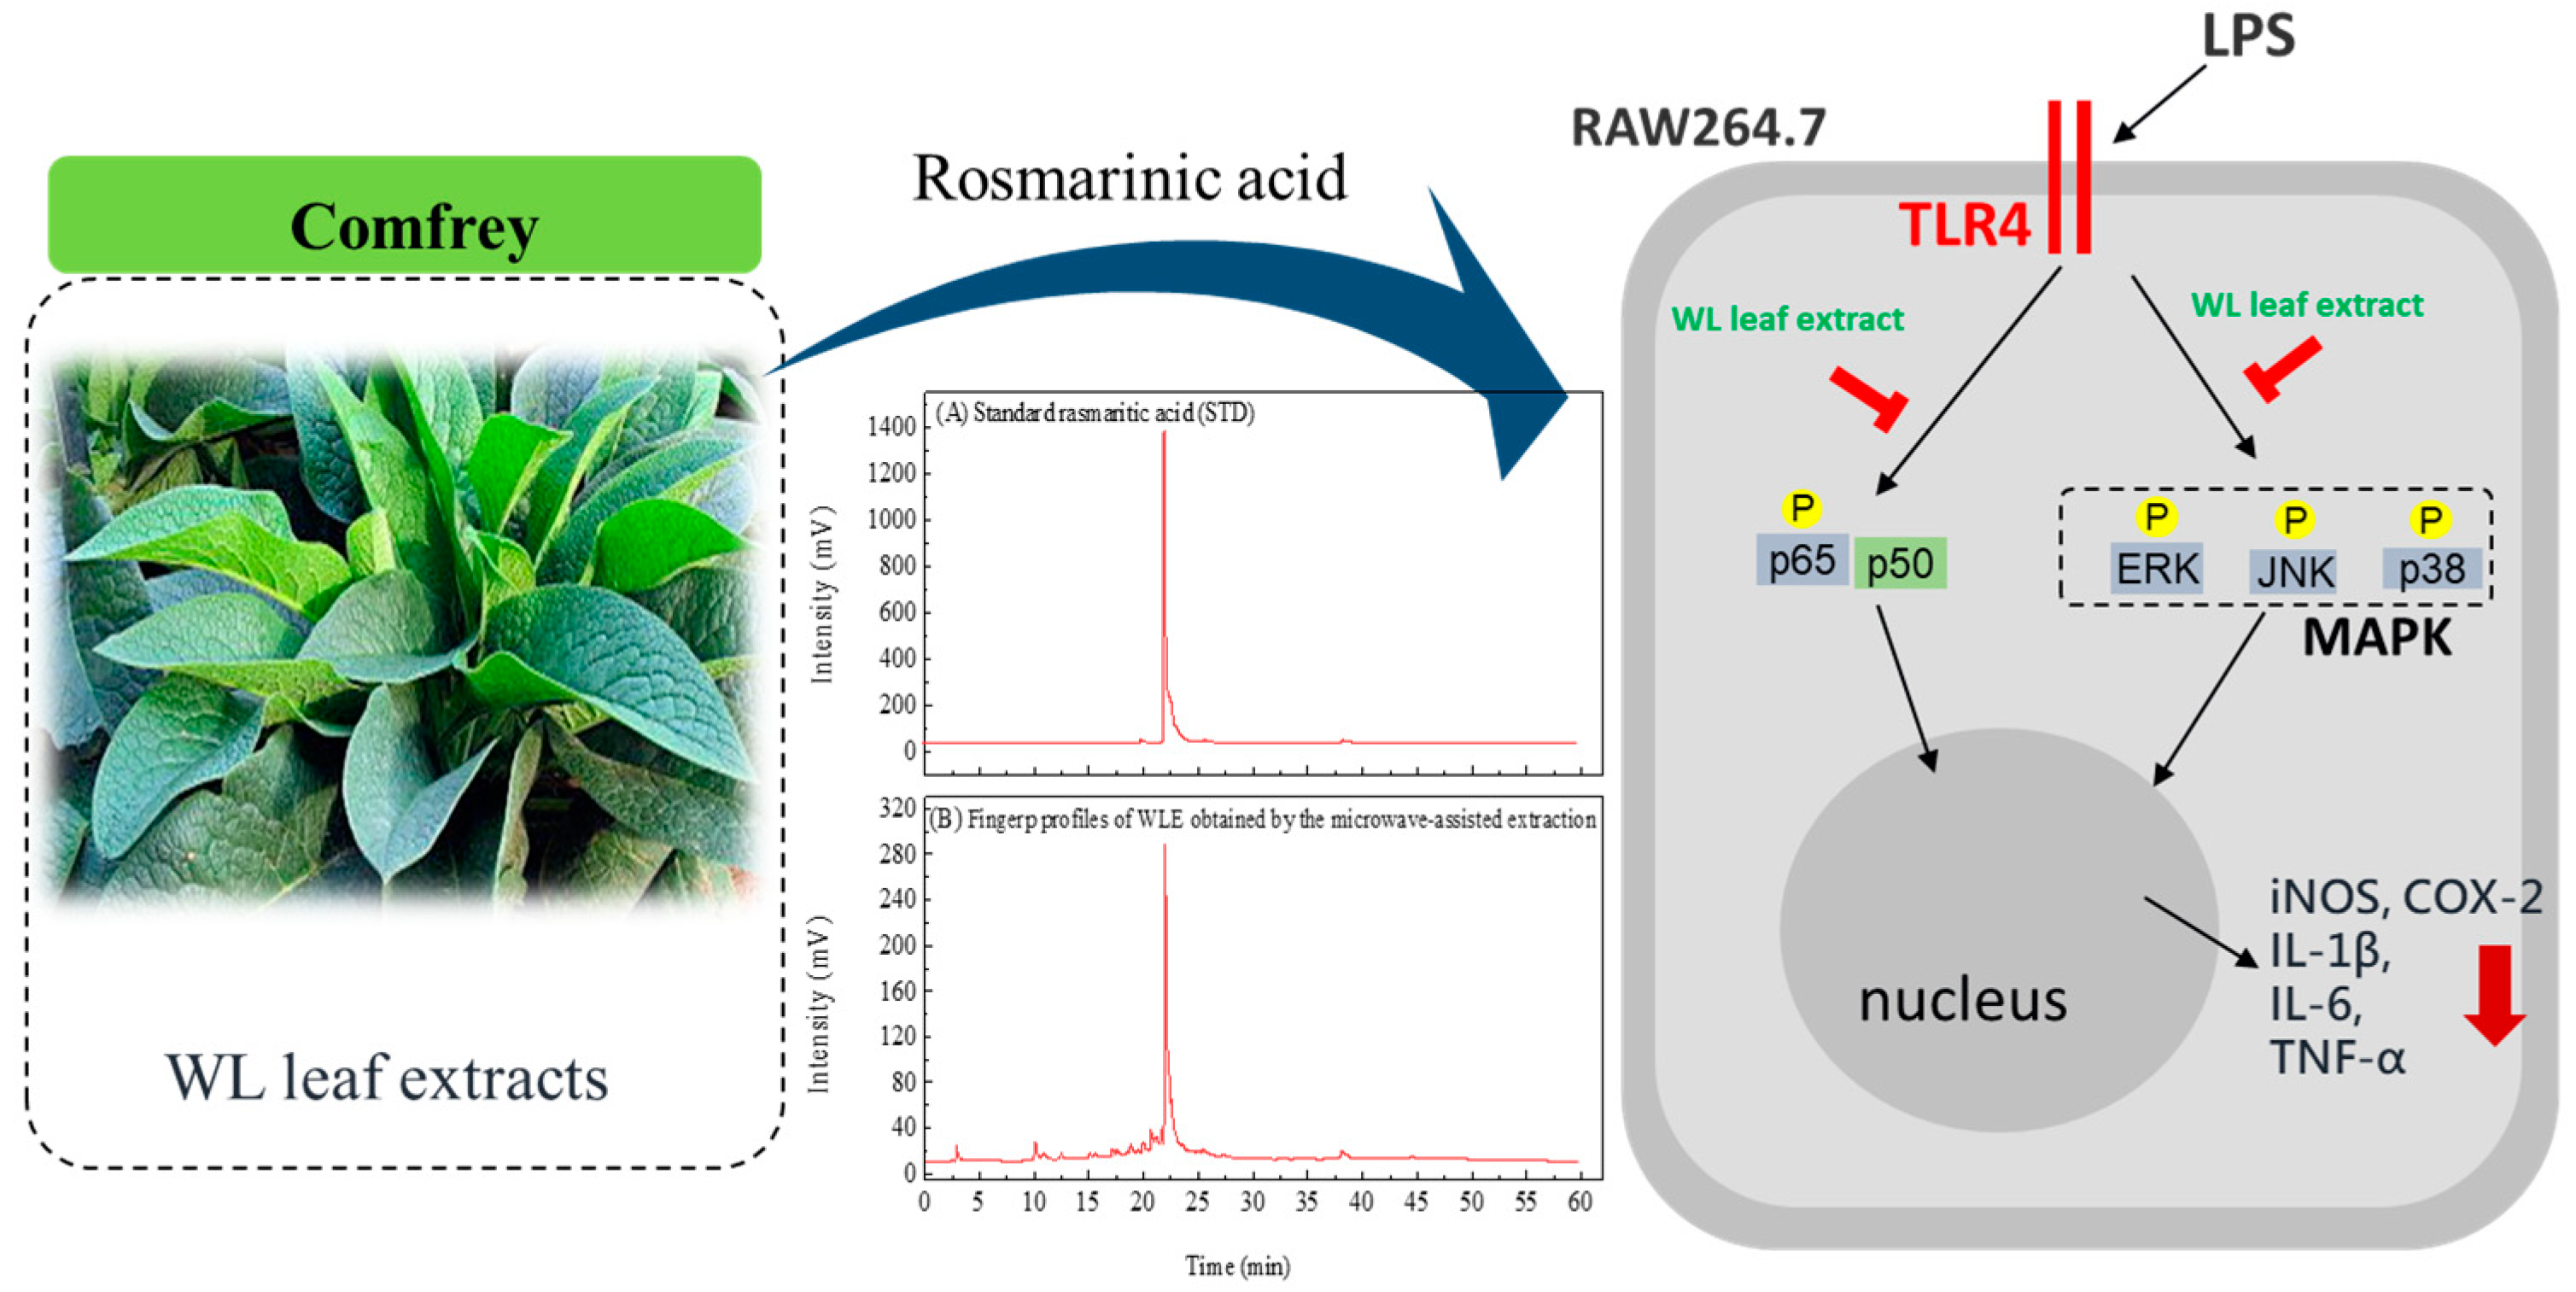
3.5. Composition Analysis of WLE
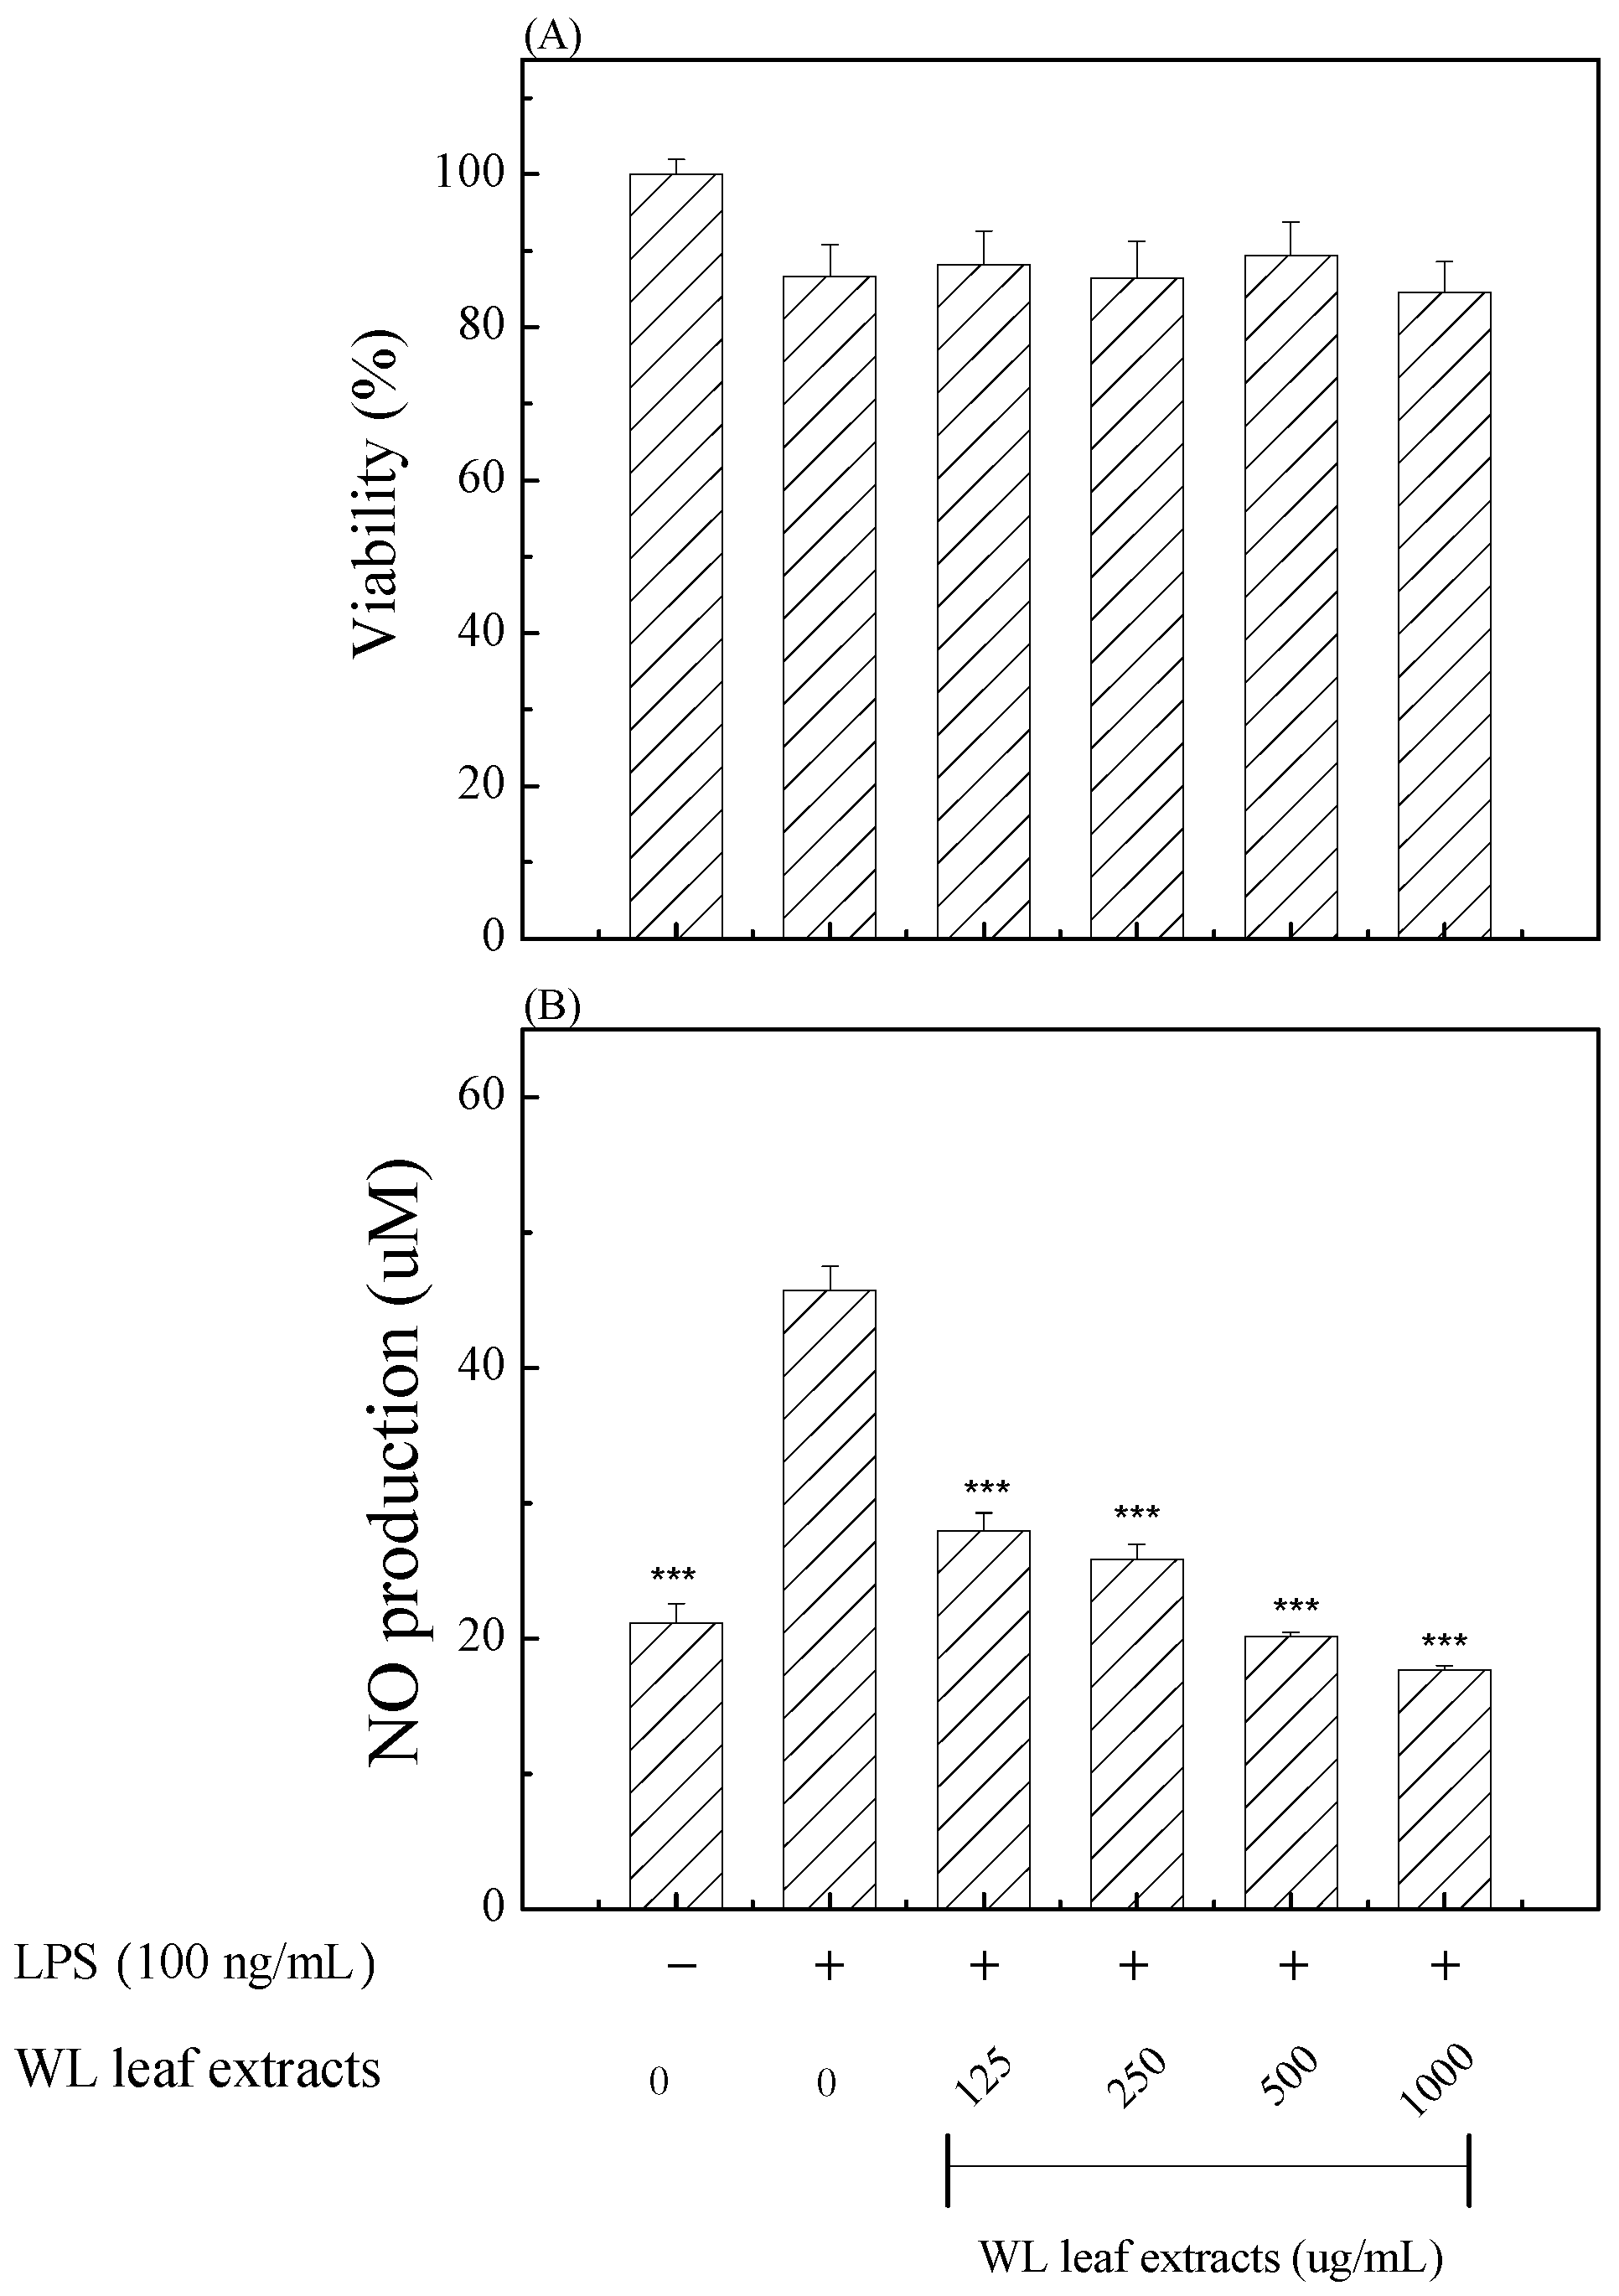
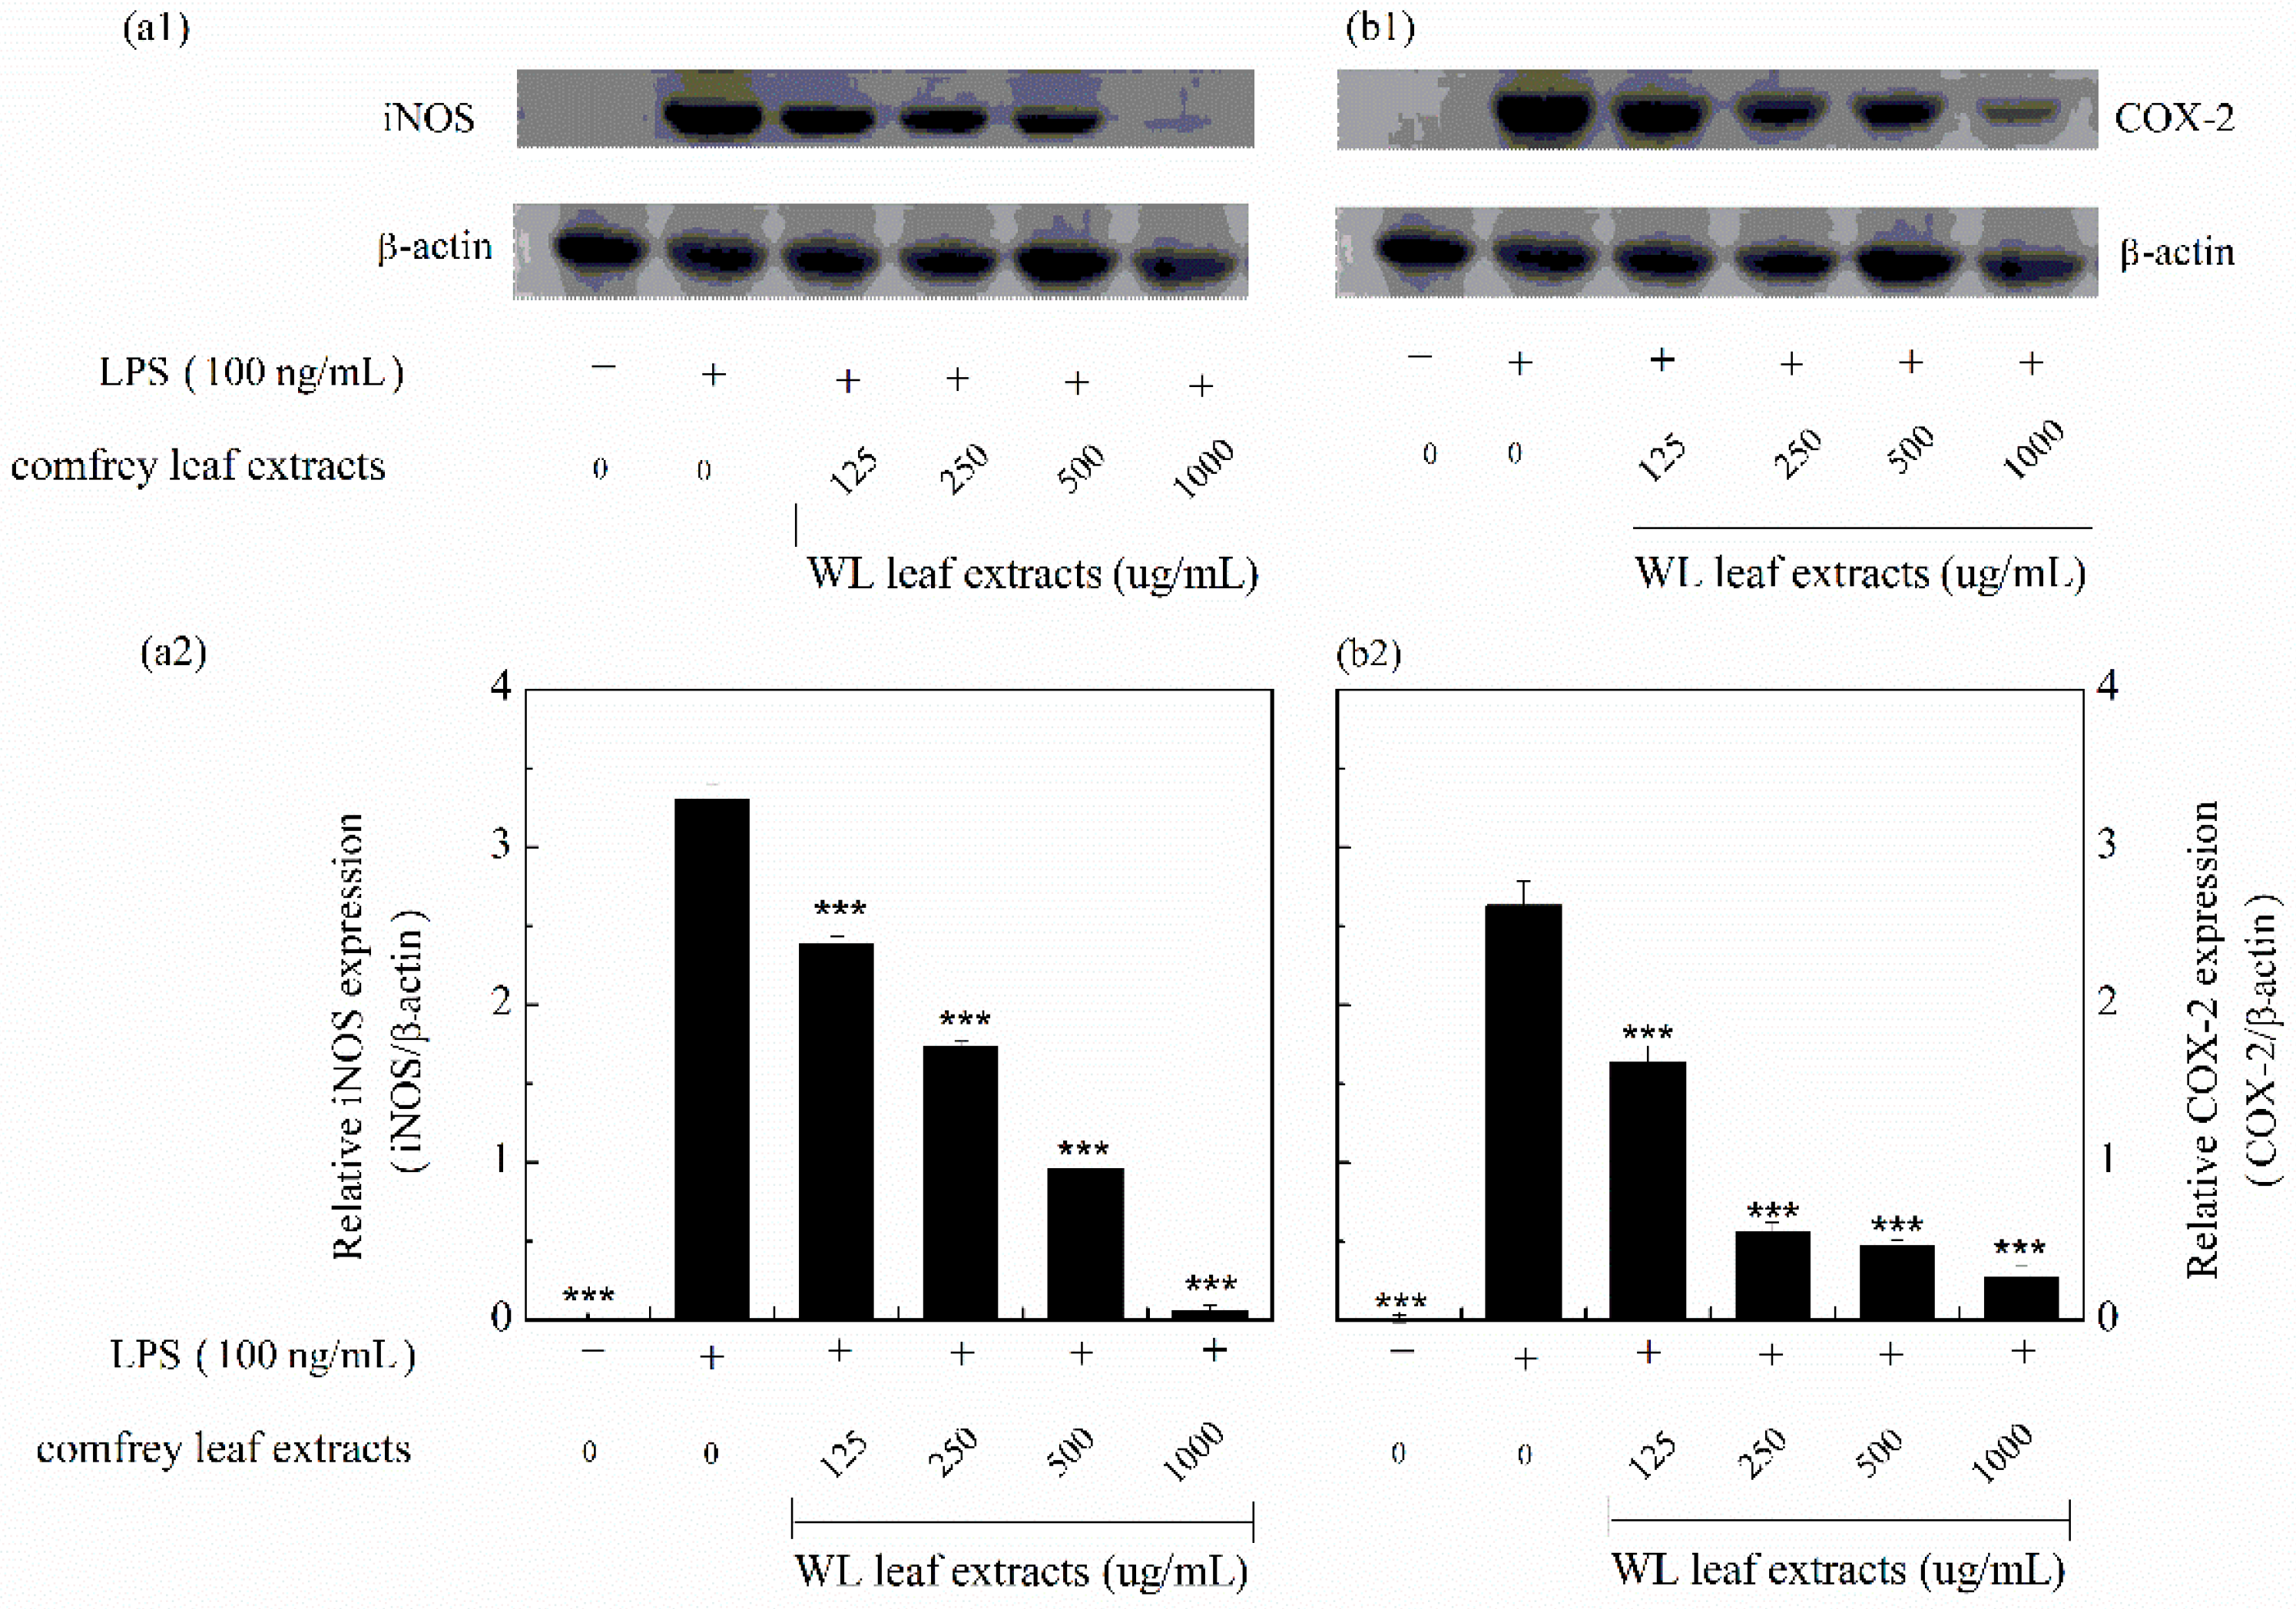
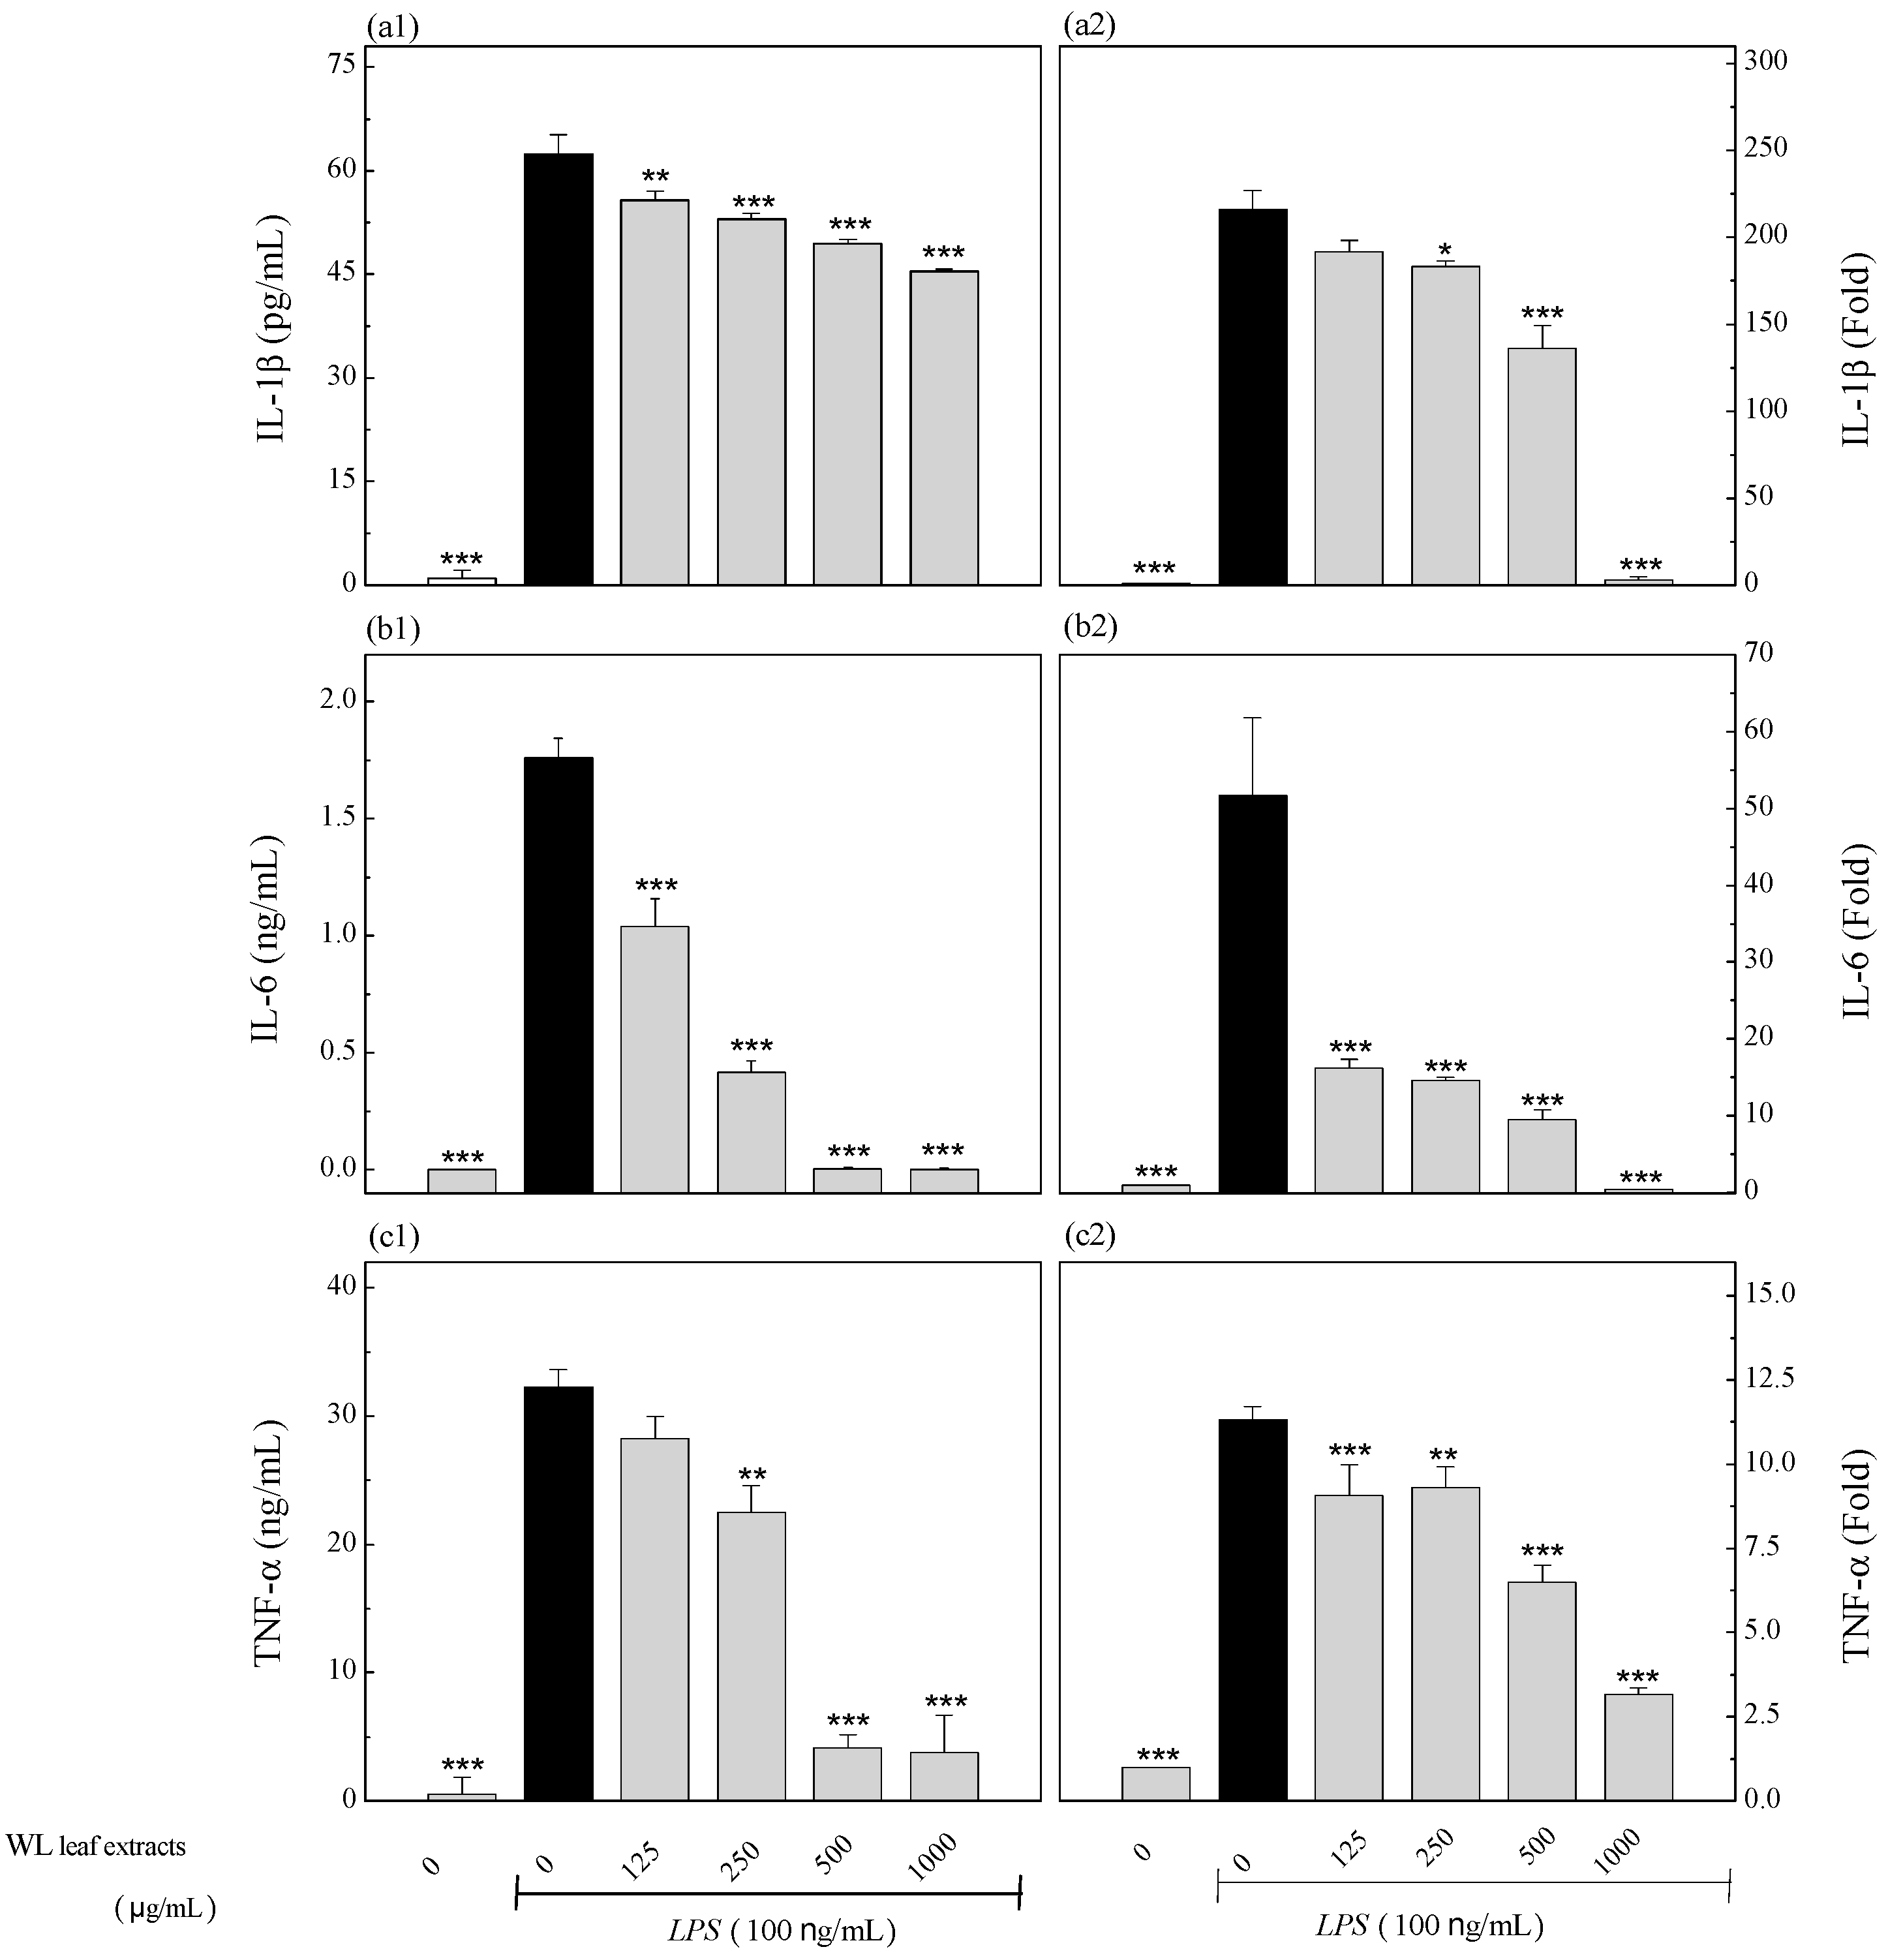
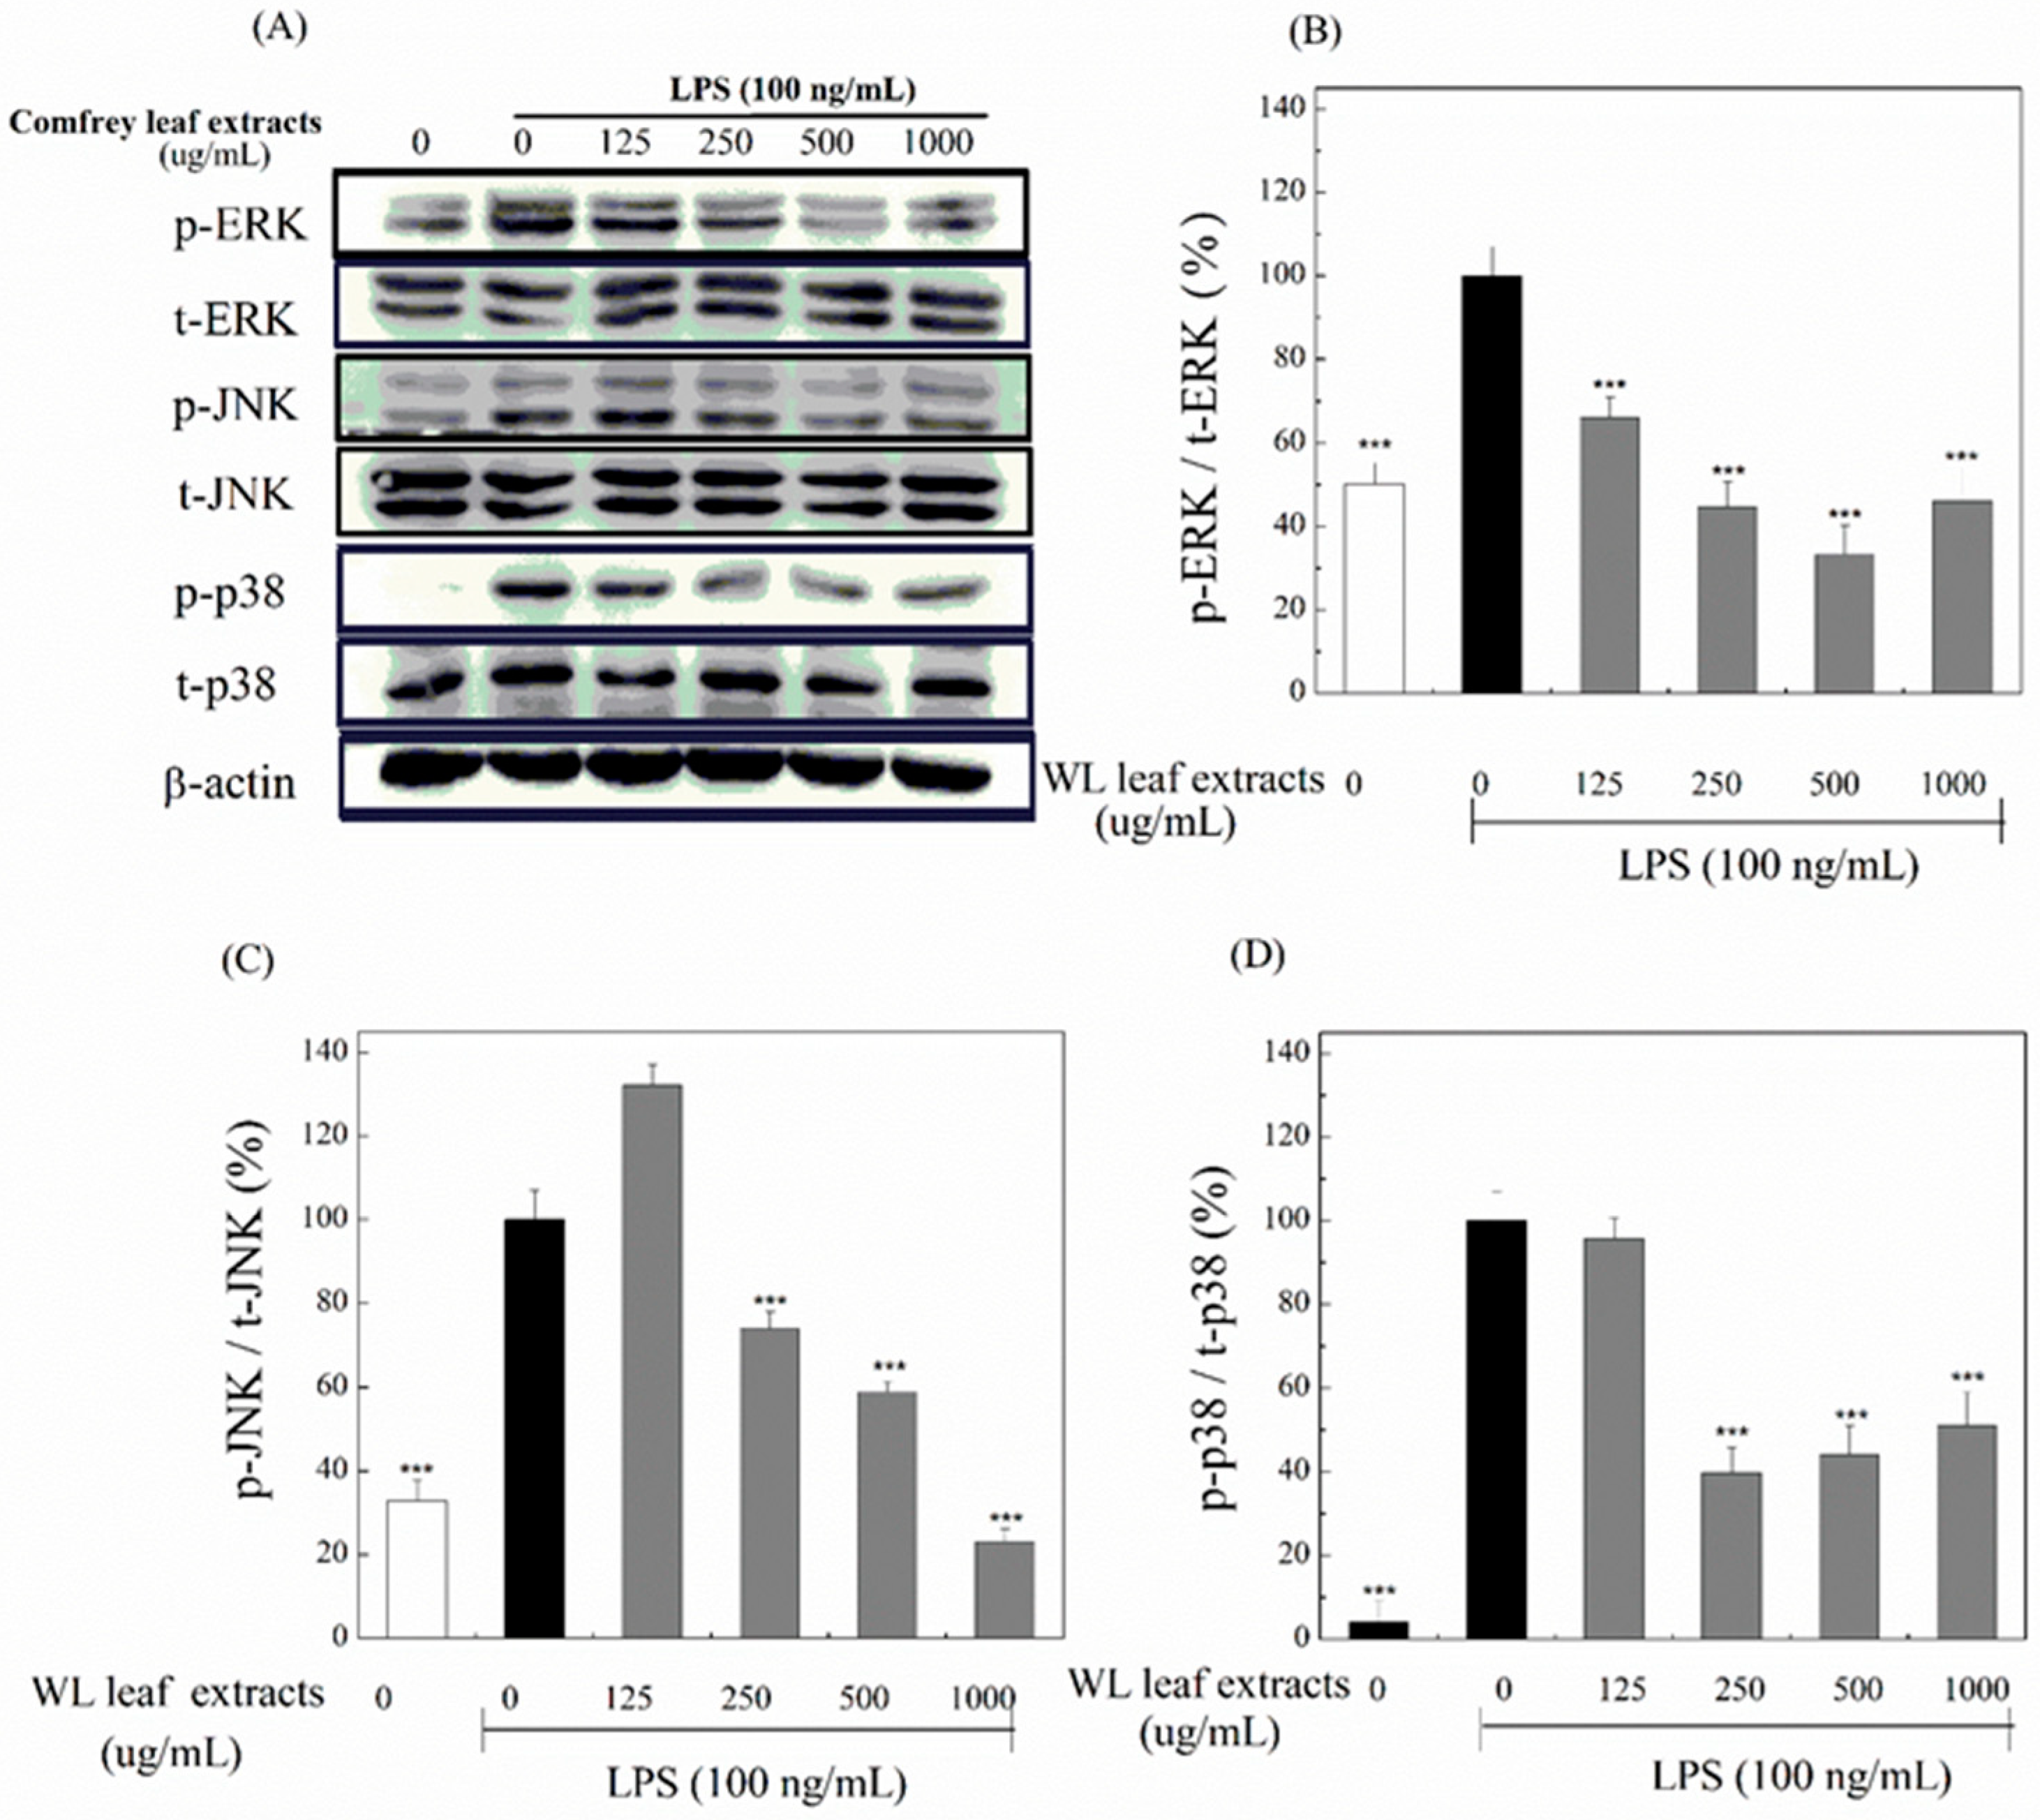
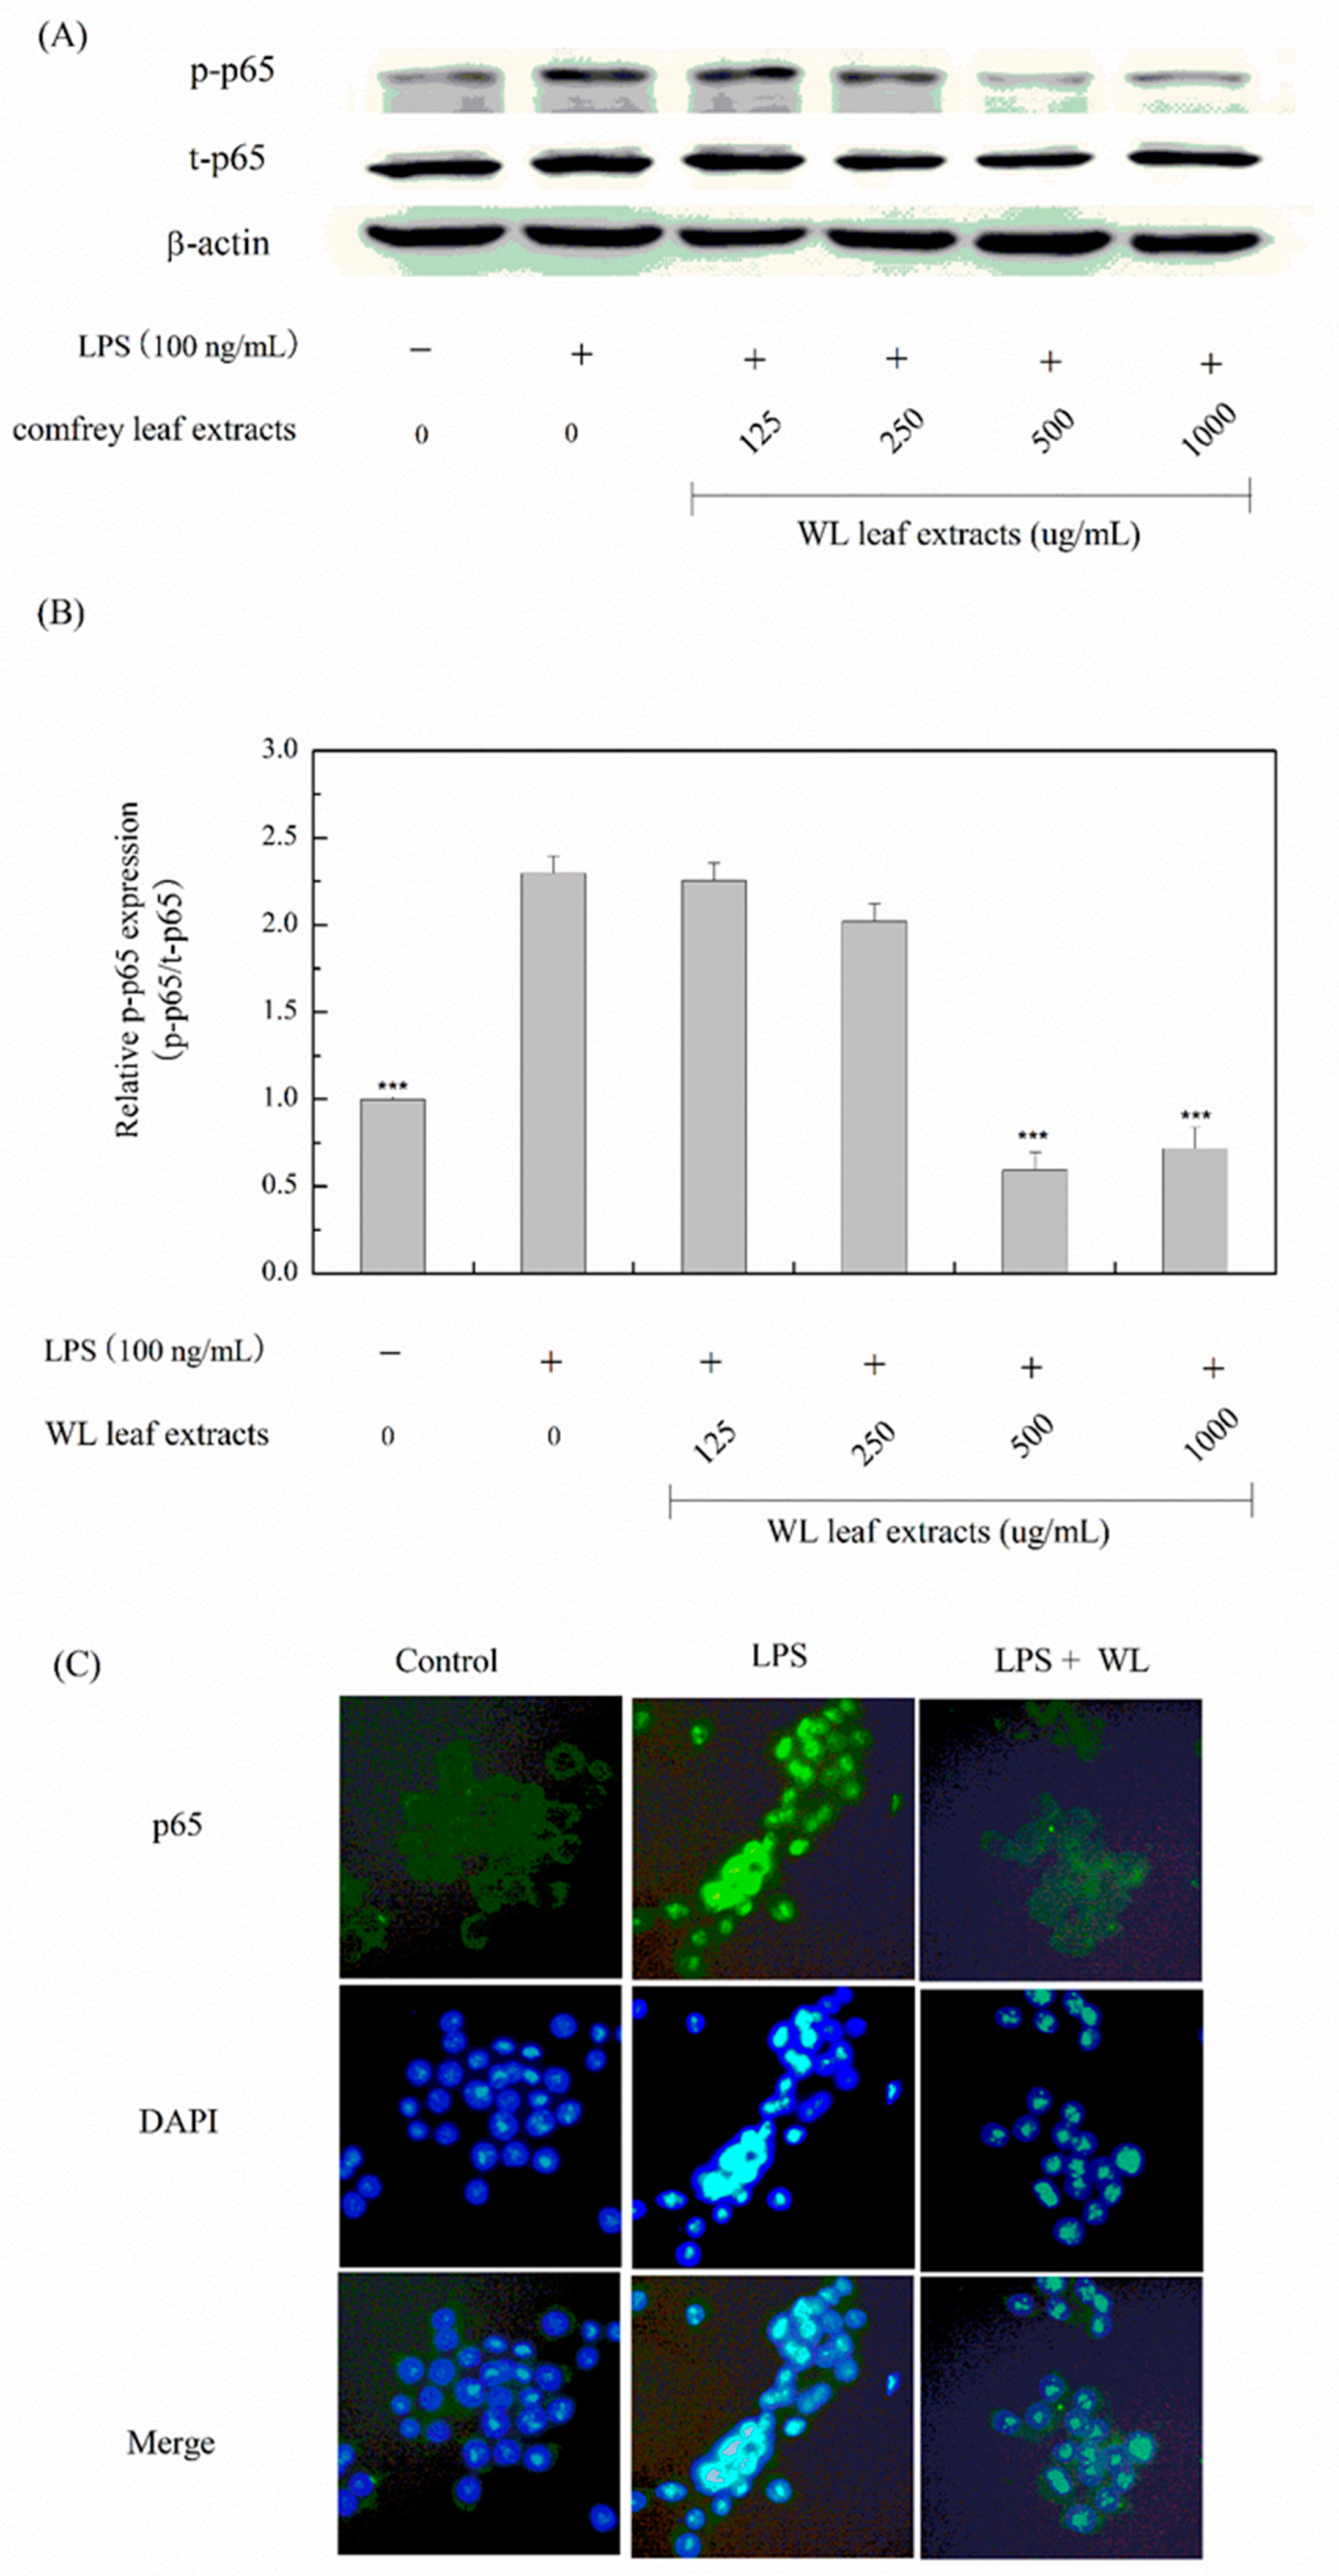
3.6. Anti-Inflammatory Effects of WLE
4. Conclusions
Author Contributions
Funding
Data Availability Statement
Conflicts of Interest
References
- DerMarderosian, A.H.; Beutler, J.A. The Review of Natural Products: The Most Complete Source of Natural Product Information; Facts and Comparisons: St. Louis, MO, USA, 2002. [Google Scholar]
- Kadereit, J.W.; Bittrich, V. Eudicots: Aquifoliales, Boraginales, Bruniales, Dipsacales, Escalloniales, Garryales, Paracryphiales, Solanales (except Convolvulaceae), Icacinaceae, Metteniusaceae, Vahliaceae. In Flowering Plants, 1st ed.; Kadereit, J.W., Bittrich, V., Eds.; Springer International Publishing: Cham, Switzerland, 2016; pp. 41–102. [Google Scholar] [CrossRef]
- Mahmoudzadeh, E.; Nazemiyeh, H.; Hamedeyazdan, S. Anti-inflammatory Properties of the Genus Symphytum L.: A Review. Iran. J. Pharm. Res. 2022, 21, e123949. [Google Scholar] [CrossRef] [PubMed]
- Englert, K.; Mayer, J.G.; Staiger, C. Symphytum officinale L.—der Beinwell in der europäischen Pharmazie-und Medizingeschichte. Z. Phytother. 2005, 26, 158–168. [Google Scholar] [CrossRef]
- Seigner, J.; Junker-Samek, M.; Plaza, A.; D’Urso, G.; Masullo, M.; Piacente, S.; Holper-Schichl, Y.M.; de Martin, R. A Symphytum officinale Root Extract Exerts Anti-inflammatory Properties by Affecting Two Distinct Steps of NF-κB Signaling. Front. Pharmacol. 2019, 10, 289. [Google Scholar] [CrossRef]
- Sowa, I.; Paduch, R.; Strzemski, M.; Zielińska, S.; Rydzik-Strzemska, E.; Sawicki, J.; Kocjan, R.; Polkowski, J.; Matkowski, A.; Latalski, M.; et al. Proliferative and antioxidant activity of Symphytum officinale root extract. Nat. Prod. Res. 2018, 32, 605–609. [Google Scholar] [CrossRef] [PubMed]
- Smith, D.B.; Jacobson, B.H. Effect of a blend of comfrey root extract (Symphytum officinale L.) and tannic acid creams in the treatment of osteoarthritis of the knee: Randomized, placebo-controlled, double-blind, multiclinical trials. J. Chiropr. Med. 2011, 10, 147–156. [Google Scholar] [CrossRef]
- Neagu, E.; Roman, G.P.; Radu, G.L. Antioxidant capacity of some Symphytum officinalis extracts processed by ultrafiltration. Rom. Biotechnol. Lett. 2010, 15, 5505–5511. [Google Scholar]
- Savic, V.L.; Savić, S.; Nikolić, V.; Nikolić, L.; Najman, S.J.; Lazarević, J.S.; Djordjevic, A. The identification and quantification of bioactive compounds from the aqueous extract of comfrey root by UHPLC-DAD-HESI-MS method and its microbial activity. Hem. Ind. 2015, 69, 1–8. [Google Scholar] [CrossRef]
- Salehi, B.; Sharopov, F.; Boyunegmez Tumer, T.; Ozleyen, A.; Rodríguez-Pérez, C.; Ezzat, S.M.; Azzini, E.; Hosseinabadi, T.; Butnariu, M.; Sarac, I.; et al. Symphytum Species: A Comprehensive Review on Chemical Composition, Food Applications and Phytopharmacology. Molecules 2019, 24, 2272. [Google Scholar] [CrossRef]
- Trifan, A.; Opitz, S.E.W.; Josuran, R.; Grubelnik, A.; Esslinger, N.; Peter, S.; Bräm, S.; Meier, N.; Wolfram, E. Is comfrey root more than toxic pyrrolizidine alkaloids? Salvianolic acids among antioxidant polyphenols in comfrey (Symphytum officinale L.) roots. Food Chem. Toxicol. 2018, 112, 178–187. [Google Scholar] [CrossRef]
- E.S.C.O. Symphyti radix, Comfrey root. In E/S/C/O/P Monographs: The Scientific Foundation for Herbal Medicinal Products. Supplement 2009, 2nd ed.; European Scientific Cooperative on Phytotherapy: Devon, UK, 2009; pp. 249–254. [Google Scholar]
- Frost, R.; MacPherson, H.; O’Meara, S. A critical scoping review of external uses of comfrey (Symphytum spp.). Complement. Ther. Med. 2013, 21, 724–745. [Google Scholar] [CrossRef]
- Frost, R.; O’Meara, S.; MacPherson, H. The external use of comfrey: A practitioner survey. Complement. Ther. Clin. Pract. 2014, 20, 347–355. [Google Scholar] [CrossRef]
- Syarifah, A.N.; Suryadi, H.; Hayun, H.; Simamora, A.; Mun’im, A. Detoxification of comfrey (Symphytum officinale L.) extract using natural deep eutectic solvent (NADES) and evaluation of its anti-inflammatory, antioxidant, and hepatoprotective properties. Front. Pharmacol. 2023, 14, 1012716. [Google Scholar] [CrossRef]
- Elez Garofulić, I.; Dragović-Uzelac, V.; Režek Jambrak, A.; Jukić, M. The effect of microwave assisted extraction on the isolation of anthocyanins and phenolic acids from sour cherry Marasca (Prunus cerasus var. Marasca). J. Food Eng. 2013, 117, 437–442. [Google Scholar] [CrossRef]
- Tanongkankit, Y.; Sablani, S.S.; Chiewchan, N.; Devahastin, S. Microwave-assisted extraction of sulforaphane from white cabbages: Effects of extraction condition, solvent and sample pretreatment. J. Food Eng. 2013, 117, 151–157. [Google Scholar] [CrossRef]
- Karavaev, V.A.; Solntsev, M.K.; Iurina, T.P.; Iurina, E.V.; Poliakova, I.B.; Kuznetsov, A.M. Antifungal activity of aqueous extracts from the leaf of cowparsnip and comfrey. Izv. Akad. Nauk. Ser. Biol. 2001, 4, 435–441. [Google Scholar]
- Sumathi, S.; Kumar, S.S.; Bai, A.L.G. Evaluation of Phytochemical Constituents and Antibacterial Activities of Symphytum officinale L. J. Pure Appl. Microbiol. 2011, 5, 323–328. [Google Scholar]
- Sumathi, S.; Kumar, S.; Bharathi, V.; Sathish, S. Antibacterial activity of the plant extract of Symphytum officinale L. against selected pathogenic bacteria. Int. J. Res. Pharm. Sci. 2011, 2, 92–94. [Google Scholar]
- Araújo, L.U.; Reis, P.G.; Barbosa, L.C.; Saúde-Guimarães, D.A.; Grabe-Guimarães, A.; Mosqueira, V.C.; Carneiro, C.M.; Silva-Barcellos, N.M. In Vivo wound healing effects of Symphytum officinale L. leaves extract in different topical formulations. Pharmazie 2012, 67, 355–360. [Google Scholar] [PubMed]
- Oberlies, N.H.; Kim, N.C.; Brine, D.R.; Collins, B.J.; Handy, R.W.; Sparacino, C.M.; Wani, M.C.; Wall, M.E. Analysis of herbal teas made from the leaves of comfrey (Symphytum officinale): Reduction of N-oxides results in order of magnitude increases in the measurable concentration of pyrrolizidine alkaloids. Public Health Nutr. 2004, 7, 919–924. [Google Scholar] [CrossRef]
- Dresler, S.; Szymczak, G.; Wójcik, M. Comparison of some secondary metabolite content in the seventeen species of the Boraginaceae family. Pharm. Biol. 2017, 55, 691–695. [Google Scholar] [CrossRef]
- Neagu, E.; Paun, G.; Albu, C.; Eremia, S.A.V.; Radu, G.L. Artemisia abrotanum and Symphytum officinale Polyphenolic Compounds-Rich Extracts with Potential Application in Diabetes Management. Metabolites 2023, 13, 354. [Google Scholar] [CrossRef] [PubMed]
- Khanuja, S.P.S.; Shasany, A.K.; Darokar, M.P.; Kumar, S. Rapid Isolation of DNA from Dry and Fresh Samples of Plants Producing Large Amounts of Secondary Metabolites and Essential Oils. Plant Mol. Biol. Rep. 1999, 17, 74. [Google Scholar] [CrossRef]
- Hacioğlu, B.; Erik, S. Phylogeny of Symphytum L. (Boraginaceae) with special emphasis on Turkish species. Afr. J. Biotechnol. 2011, 10, 15483–15493. [Google Scholar] [CrossRef]
- Kähkönen, M.P.; Hopia, A.I.; Vuorela, H.J.; Rauha, J.P.; Pihlaja, K.; Kujala, T.S.; Heinonen, M. Antioxidant activity of plant extracts containing phenolic compounds. J. Agric. Food Chem. 1999, 47, 3954–3962. [Google Scholar] [CrossRef] [PubMed]
- Chang, C.C.; Yang, M.H.; Wen, H.M.; Chern, J.C. Estimation of Total Flavonoid Content in Propolis by Two Complementary Colorimetric Methods. J. Food Drug Anal. 2002, 10, 178–182. [Google Scholar] [CrossRef]
- Lee, J.Y.; Cho, Y.R.; Park, J.H.; Ahn, E.K.; Jeong, W.; Shin, H.S.; Kim, M.S.; Yang, S.H.; Oh, J.S. Anti-melanogenic and anti-oxidant activities of ethanol extract of Kummerowia striata: Kummerowia striata regulate anti-melanogenic activity through down-regulation of TRP-1, TRP-2 and MITF expression. Toxicol. Rep. 2019, 6, 10–17. [Google Scholar] [CrossRef]
- Re, R.; Pellegrini, N.; Proteggente, A.; Pannala, A.; Yang, M.; Rice-Evans, C. Antioxidant activity applying an improved ABTS radical cation decolorization assay. Free Radic. Biol. Med. 1999, 26, 1231–1237. [Google Scholar] [CrossRef]
- Singh, N.; Rajini, P.S. Free radical scavenging activity of an aqueous extract of potato peel. Food Chem. 2004, 85, 611–616. [Google Scholar] [CrossRef]
- Zhao, H.; Fan, W.; Dong, J.; Lu, J.; Chen, J.; Shan, L.; Lin, Y.; Kong, W. Evaluation of antioxidant activities and total phenolic contents of typical malting barley varieties. Food Chem. 2008, 107, 296–304. [Google Scholar] [CrossRef]
- Kumar, V.; Rani, A.; Dixit, A.K.; Pratap, D.; Bhatnagar, D. A comparative assessment of total phenolic content, ferric reducing-anti-oxidative power, free radical-scavenging activity, vitamin C and isoflavones content in soybean with varying seed coat colour. Food Res. Int. 2010, 43, 323–328. [Google Scholar] [CrossRef]
- Li, X. Improved pyrogallol autoxidation method: A reliable and cheap superoxide-scavenging assay suitable for all antioxidants. J. Agric. Food Chem. 2012, 60, 6418–6424. [Google Scholar] [CrossRef] [PubMed]
- Jothy, S.L.; Chen, Y.; Kanwar, J.R.; Sasidharan, S. Evaluation of the Genotoxic Potential against H2O2-Radical-Mediated DNA Damage and Acute Oral Toxicity of Standardized Extract of Polyalthia longifolia Leaf. Evid. Based Complement. Altern. Med. 2013, 2013, 925380. [Google Scholar] [CrossRef] [PubMed]
- Li, C.Y.; Cheng, S.E.; Wang, S.H.; Wu, J.Y.; Hsieh, C.W.; Tsou, H.K.; Tsai, M.S. The Anti-inflammatory Effects of the Bioactive Compounds Isolated from Alpinia officinarum Hance Mediated by the Suppression of NF-kappaB and MAPK Signaling. Chin. J. Physiol. 2021, 64, 32–42. [Google Scholar] [CrossRef]
- Ruenroengklin, N.; Zhong, J.; Duan, X.; Yang, B.; Li, J.; Jiang, Y. Effects of various temperatures and pH values on the extraction yield of phenolics from litchi fruit pericarp tissue and the antioxidant activity of the extracted anthocyanins. Int. J. Mol. Sci. 2008, 9, 1333–1341. [Google Scholar] [CrossRef] [PubMed]
- Rajaei, A.; Barzegar, M.; Hamidi Esfahani, Z.; Sahari, M.A. Optimization of Extraction Conditions of Phenolic Compounds from Pistachio (Pistachia vera) Green Hull through Response Surface Method. J. Agric. Sci. Tech. 2010, 12, 605–615. [Google Scholar]
- Tsao, R.; Deng, Z. Separation procedures for naturally occurring antioxidant phytochemicals. J. Chromatogr. B 2004, 812, 85–99. [Google Scholar] [CrossRef]
- Kurucu, S.; Kartal, M.; Choudary, M.I.; Topcu, G. Pyrrolizidine Alkaloids from Symphytum sylvaticum Boiss. subsp. sepulcrale. (Boiss. & Bal.) Greuter & Burdet var. sepulcrale and Symphytum aintabicum Hub.-Mor. & Wickens. Turk. J. Chem. 2002, 26, 195–199. [Google Scholar]
- Drużyńska, B.; Stepniewska, A.; Wołosiak, R. The influence of time and type of solvent on efficiency of the extraction of polyphenols from green tea and antioxidant properties obtained extracts. Acta Sci. Pol. Technol. Aliment. 2007, 6, 27–36. [Google Scholar]
- Khoddami, A.; Wilkes, M.A.; Roberts, T.H. Techniques for analysis of plant phenolic compounds. Molecules 2013, 18, 2328–2375. [Google Scholar] [CrossRef]
- Üstün Alkan, F.; Anlas, C.; Ustuner, O.; Bakırel, T.; Sari, A. Antioxidant and proliferative effects of aqueous and ethanolic extracts of Symphytum officinale on 3T3 Swiss albino mouse fibroblast cell line. Asian J. Plant Sci. Res. 2014, 4, 62–68. [Google Scholar]
- Goldstein, S.; Meyerstein, D.; Czapski, G. The Fenton reagents. Free Radic. Biol. Med. 1993, 15, 435–445. [Google Scholar] [CrossRef] [PubMed]
- Burrows, C.J.; Muller, J.G. Oxidative Nucleobase Modifications Leading to Strand Scission. Chem. Rev. 1998, 98, 1109–1152. [Google Scholar] [CrossRef] [PubMed]
- Spotheim-Maurizot, M.; Franchet, J.; Sabattier, R.; Charlier, M. DNA radiolysis by fast neutrons. II. Oxygen, thiols and ionic strength effects. Int. J. Radiat. Biol. 1991, 59, 1313–1324. [Google Scholar] [CrossRef]
- Sestili, P.; Guidarelli, A.; Dachà, M.; Cantoni, O. Quercetin Prevents DNA Single Strand Breakage and Cytotoxicity Caused By tert-Butylhydroperoxide: Free Radical Scavenging Versus Iron Chelating Mechanism. Free Radic. Biol. Med. 1998, 25, 196–200. [Google Scholar] [CrossRef]
- Ho, Y.S.; Wu, J.Y.; Chang, C.Y. A New Natural Antioxidant Biomaterial from Cinnamomum osmophloeum Kanehira Leaves Represses Melanogenesis and Protects against DNA Damage. Antioxidants 2019, 8, 474. [Google Scholar] [CrossRef] [PubMed]
- Wang, W.-T.; Liao, S.-F.; Wu, Z.-L.; Chang, C.-W.; Wu, J.-Y. Simultaneous study of antioxidant activity, DNA protection and anti-inflammatory effect of Vernonia amygdalina leaves extracts. PLoS ONE 2020, 15, e0235717. [Google Scholar] [CrossRef]
- Nastić, N.; Borrás-Linares, I.; Lozano-Sánchez, J.; Švarc-Gajić, J.; Segura-Carretero, A. Comparative Assessment of Phytochemical Profiles of Comfrey (Symphytum officinale L.) Root Extracts Obtained by Different Extraction Techniques. Molecules 2020, 25, 837. [Google Scholar] [CrossRef]
- Surh, Y.J.; Chun, K.S.; Cha, H.H.; Han, S.S.; Keum, Y.S.; Park, K.K.; Lee, S.S. Molecular mechanisms underlying chemopreventive activities of anti-inflammatory phytochemicals: Down-regulation of COX-2 and iNOS through suppression of NF-kappa B activation. Mutat. Res. 2001, 480–481, 243–268. [Google Scholar] [CrossRef]
- Feldmann, M. Cytokine networks: Do we understand them well enough to facilitate clinical benefits? Eur. Cytokine Netw. 1991, 2, 5–9. [Google Scholar]
- Guha, M.; Mackman, N. LPS induction of gene expression in human monocytes. Cell Signal. 2001, 13, 85–94. [Google Scholar] [CrossRef]
- Saklatvala, J. Inflammatory signaling in cartilage: MAPK and NF-kappaB pathways in chondrocytes and the use of inhibitors for research into pathogenesis and therapy of osteoarthritis. Curr. Drug Targets 2007, 8, 305–313. [Google Scholar] [CrossRef] [PubMed]
- Hehner, S.P.; Hofmann, T.G.; Ratter, F.; Dumont, A.; Dröge, W.; Schmitz, M.L. Tumor necrosis factor-alpha-induced cell killing and activation of transcription factor NF-kappaB are uncoupled in L929 cells. J. Biol. Chem. 1998, 273, 18117–18121. [Google Scholar] [CrossRef] [PubMed]
- Saha, R.N.; Jana, M.; Pahan, K. MAPK p38 regulates transcriptional activity of NF-kappaB in primary human astrocytes via acetylation of p65. J. Immunol. 2007, 179, 7101–7109. [Google Scholar] [CrossRef] [PubMed]
- Guo, W.; Sun, J.; Jiang, L.; Duan, L.; Huo, M.; Chen, N.; Zhong, W.; Wassy, L.; Yang, Z.; Feng, H. Imperatorin attenuates LPS-induced inflammation by suppressing NF-κB and MAPKs activation in RAW 264.7 macrophages. Inflammation 2012, 35, 1764–1772. [Google Scholar] [CrossRef] [PubMed]
- Reddy, D.B.; Reddanna, P. Chebulagic acid (CA) attenuates LPS-induced inflammation by suppressing NF-κB and MAPK activation in RAW 264.7 macrophages. Biochem. Biophys. Res. Commun. 2009, 381, 112–117. [Google Scholar] [CrossRef] [PubMed]
- Chen, L.; Teng, H.; Xie, Z.; Cao, H.; Cheang, W.S.; Skalicka-Woniak, K.; Georgiev, M.I.; Xiao, J. Modifications of dietary flavonoids towards improved bioactivity: An update on structure-activity relationship. Crit. Rev. Food. Sci. Nutr. 2018, 58, 513–527. [Google Scholar] [CrossRef]
- Kučera, M.; Barna, M.; Horáček, O.; Kováriková, J.; Kučera, A. Efficacy and safety of topically applied Symphytum herb extract cream in the treatment of ankle distortion: Results of a randomized controlled clinical double-blind study. Wien. Med. Wochenschr. 2004, 154, 498–507. [Google Scholar] [CrossRef]

| Gene or Fragment Name | Primer Name | Sequence | Length (bp) |
|---|---|---|---|
| IL-1β | IL-1β-mF | 5′-GGGCTGCTTCCAAACCTTTG | 20 |
| IL-1β-mR | 5′-GCTTGGGATCCACACTCTCC | 20 | |
| IL-6 | IL-6-mF | 5′-TCCAGTTGCCTTCTTGGGAC | 20 |
| IL-6-mR | 5′-GTGTAATTAAGCCTCCGACTTG | 22 | |
| TNF-α | TNF-α-mF | 5′-TCTCATCAGTTCTATGGCCC | 20 |
| TNF-α-mR | 5′-GGGAGTAGACAAGGTACAAC | 20 | |
| β-actin | β-act-mF | 5′-GTGGGCCGCCCTAGGCACCAG | 21 |
| β-act-mR | 5′-GGAGGAAGAGGATGCGGCAGT | 21 | |
| ITS | ITS5-F | GGAAGTAAAAGTCGTAACAAGG | 22 |
| ITS4-R | TCCTCCGCTTATTGATATGC | 20 | |
| trnL–trnF | trnL-trnF-F | CGAAATCGGTAGACGCTACG | 20 |
| trnL-trnF-R | ATTTGAACTGGTGACACGAG | 20 |
| Extraction Condition | Suitable Condition | Yield (%) | Total Phenols 1 (mg/g) | Total Flavonoids 2 (mg/g) |
|---|---|---|---|---|
| Microwave power (W) | 750 | 12.50 ± 0.42 | 7.39 ± 0.21 | 44.70 ± 1.38 |
| Temperature (°C) | 50 | 13.72 ± 0.65 | 9.12 ± 0.01 | 60.08 ± 0.50 |
| Methanol concentration (%) | 75 | 14.43 ± 0.09 | 8.44 ± 0.08 | 66.98 ± 0.80 |
| Solid-to-solvent ratio (w/v) | 1:10 | 13.58 ± 0.01 | 9.09 ± 0.12 | 55.38 ± 0.72 |
| Time (min) | 15 | 16.38 ± 0.57 | 13.14 ± 0.17 | 64.23 ± 0.00 |
Disclaimer/Publisher’s Note: The statements, opinions and data contained in all publications are solely those of the individual author(s) and contributor(s) and not of MDPI and/or the editor(s). MDPI and/or the editor(s) disclaim responsibility for any injury to people or property resulting from any ideas, methods, instructions or products referred to in the content. |
© 2023 by the authors. Licensee MDPI, Basel, Switzerland. This article is an open access article distributed under the terms and conditions of the Creative Commons Attribution (CC BY) license (https://creativecommons.org/licenses/by/4.0/).
Share and Cite
Lou, K.-H.; Tsai, M.-S.; Wu, J.-Y. Investigating the Microwave-Assisted Extraction Conditions and Antioxidative and Anti-Inflammatory Capacities of Symphytum officinale WL Leaves. Processes 2023, 11, 2750. https://doi.org/10.3390/pr11092750
Lou K-H, Tsai M-S, Wu J-Y. Investigating the Microwave-Assisted Extraction Conditions and Antioxidative and Anti-Inflammatory Capacities of Symphytum officinale WL Leaves. Processes. 2023; 11(9):2750. https://doi.org/10.3390/pr11092750
Chicago/Turabian StyleLou, Kuo-Hao, Ming-Shiun Tsai, and Jane-Yii Wu. 2023. "Investigating the Microwave-Assisted Extraction Conditions and Antioxidative and Anti-Inflammatory Capacities of Symphytum officinale WL Leaves" Processes 11, no. 9: 2750. https://doi.org/10.3390/pr11092750
APA StyleLou, K.-H., Tsai, M.-S., & Wu, J.-Y. (2023). Investigating the Microwave-Assisted Extraction Conditions and Antioxidative and Anti-Inflammatory Capacities of Symphytum officinale WL Leaves. Processes, 11(9), 2750. https://doi.org/10.3390/pr11092750