Article

Automated Shape and Process Parameter Optimization for Scaling Up Geometrically Non-Similar Bioreactors

1
Institute of Chemistry and Biotechnology, School of Life Sciences and Facility Management, ZHAW Zurich University of Applied Sciences, 8820 Wädenswil, Switzerland
2
Institute of Chemical and Process Engineering, Technische Universität Berlin, 10623 Berlin, Germany
*
Author to whom correspondence should be addressed.
Processes 2023, 11(9), 2703; https://doi.org/10.3390/pr11092703
Submission received: 15 August 2023 / Revised: 6 September 2023 / Accepted: 8 September 2023 / Published: 10 September 2023
(This article belongs to the Special Issue Modeling and Analysis of Bioprocesses)

Abstract

:
Scaling bioprocesses remains a major challenge. Since it is physically impossible to increase all process parameters equally, a suitable scale-up strategy must be selected for a successful bioprocess. One of the most widely used criteria when scaling up bioprocesses is the specific power input. However, this represents only an average value. This study aims to determine the Kolmogorov length scale distribution by means of computational fluid dynamics (CFD) and to use it as an alternative scale-up criterion for geometrically non-similar bioreactors for the first time. In order to obtain a comparable Kolmogorov length scale distribution, an automated geometry and process parameter optimization was carried out using the open-source tools OpenFOAM and DAKOTA. The Kolmogorov–Smirnov test statistic was used for optimization. A HEK293-F cell expansion (batch mode) from benchtop (Infors Minifors 2 with 4 L working volume) to pilot scale (D-DCU from Sartorius with 30 L working volume) was carried out. As a reference cultivation, the classical scale-up approach with constant specific power input (233 W m−3) was used, where a maximum viable cell density (VCD max ) of 5.02 · 10 6 cells mL−1 was achieved (VCD max at laboratory scale 5.77 · 10 6 cells mL−1). Through the automated optimization of the stirrer geometry (three parameters), position and speed, comparable cultivation results were achieved as in the small scale with a maximum VCD of 5.60 · 10 6 cells mL−1. In addition, even on the pilot scale, cell aggregate size distribution was seen to strictly follow a geometric distribution and can be predicted with the help of CFD with the previously published correlation.

1. Introduction

Biopharmaceuticals are a multi-billion-dollar business with a continuously increasing market value [1]. The production of such biopharmaceuticals traditionally takes place in stirred bioreactors on a cubic meter scale [2]. Even though process intensification is an important market trend, the challenge of transferring the optimized bioprocess from laboratory scale to production scale remains. Scaling up bioreactors is considered one of the biggest challenges [3], and there are various ways in which scale transfer can take place. Typically, scale-independent variables such as pH, dissolved oxygen concentration (DO), temperature and inoculation density are kept constant during scale-up. Ideally, geometrically similar systems are used for scaling up, as they allow for similar conditions, which in practice is not always possible. As Kaiser et al. [4] and Böhm et al. [5] demonstrated in their studies, it is physically impossible to scale up all process parameters equally. Therefore, typically one or more scale-up criteria are defined. Classical scale-up criteria are specific power input P/V, volumetric oxygen mass transfer coefficient k L a , mixing time Θ M , tip speed v tip , superficial gas velocity v g and the Reynolds number Re [6,7,8,9,10]. Interested readers will find a detailed overview of scale-up criteria used in Neubauer and Junne [8] and Löffelholz et al. [10]. Regardless of the frequent and often successful use of these simple scale transfer approaches, some limitations exist [7]. The choice of bioreactors is enormous and exact geometric similarity is rarely given [11]. Different geometries lead to varying flow patterns and mixing regimes in the vessels for the same power inputs, which can be accounted for by the different distribution profiles of the local turbulent energy dissipation rates [12]. Furthermore, the higher heterogeneity at the production scale leads to higher cell-to-cell variability, which cannot always be represented with sufficient accuracy in scale-down models [13].
However, there are also more sophisticated alternatives, mostly used in conjunction with computational fluid dynamics (CFD). For example, Haringa [14] used CFD to model the view of the cell with his lifeline analysis, which can also be used for scale-up. Villiger et al. [15] used maximum hydrodynamic stress as a scale-up criterion in addition to the mixing time and volumetric oxygen mass transfer coefficient. Li et al. [16] defined a three-dimensional shear space consisting of shear strain rate in the impeller zone, shear strain rate in the tank bulk zone and the overall average shear strain rate at which the two systems should be located. Böhm et al. [5] recommend the consideration of the impeller swept volume V l respectively the resulting energy dissipation circulation function (EDCF). The EDCF, introduced by Jüsten et al. [17], is a mixing parameter originally defined according to Equation (1) where t c corresponds to the circulation time. However, there are different ways of determining and calculating the EDCF. A detailed overview is provided by Böhm et al. [5] and Esperança et al. [18].
EDCF = P V l · t c
Nevertheless, the specific power input is the most frequently used scale-up criterion [8,9]. This may be due to the fact that homogenization, dispersion of gas bubbles and suspension of the cells depend on the specific power input and that the specific power input is comparatively easy to determine. The specific power input can be determined experimentally in various ways, whereby the torque measurement (Equation (2)) is recommended by the DECHEMA expert group for single-use technology and is used most frequently [19]. M corresponds to the torque, N to the stirrer speed and V to the liquid volume. This method is both operatively and skill-wise less demanding than the method used by Villiger et al. [15] to determine the maximum hydrodynamic stress.
P / V = 2 · π · N · M V = ε ¯ · ρ
Furthermore, the specific power input can be estimated using literature values and empirical formulae, or calculated using CFD [20]. However, the specific power input is only an average value without any indication of variability in the system. In contrast, hydrodynamic heterogeneity Φ is defined as the ratio of maximum ε max to mean ε ¯ energy dissipation rate (Equation (3)) [21]. An overview of stirred systems can be found in Zhou and Kresta [22], and for different types of bioreactors in Seidel et al. [23]. If not only the mean value P/V but also the hydrodynamic heterogeneity is considered as a type of variance measure, the system can be characterized more precisely. However, it must be taken into account that the maximum energy dissipation rate ε max is difficult to measure, since it is the maximum directly at the stirrer [5].
Φ = ε max ε ¯
Freiberger et al. [24] went one step further and looked not only at the maximum and average values or their ratio Φ, but at the entire energy dissipation rate distribution comparing two bioreactors on the same scale. Johnson et al. [25] studied the Kolmogorov length scale distribution λ k for five different bioreactors from 200 L to 15,000 L and found that only with the same stirrers and number of baffles can a similar Kolmogorov length scale distribution be obtained for different working volumes. The Kolmogorov length scale λ k describes the smallest vortices that are formed before they dissipate into heat and is a function of the energy dissipation rate ε and the kinematic viscosity ν (Equation (4)). Various authors describe that cell damage is likely if the Kolmogorov length scale is equal to or smaller than the cells to be cultivated [15,26,27,28].
λ k = ν 3 ε 1 4
Our hypothesis is that similar Kolmogorov length scale distributions lead to comparable growth of mammalian cell cultures such as human embryonic kidney cells (HEK293) and can thus be used as a scale-up criterion. The aim of this study is to develop a method that, based on CFD, automatically optimizes stirrer geometry, position and speed in order to achieve a similar energy dissipation rate distribution, and therefore Kolmogorov length scale distribution, in a geometrically dissimilar system that allows for a successful scale-up and comparable cell growth. The method will be implemented using open-source resources from optimization to CFD simulations and evaluation.
Shape optimization with the help of CFD is a widely used strategy, especially in optimizing aerospace foils [29,30]. Furthermore, this method is also used to optimize wind turbines [31,32], static mixers [33], pumps [34,35] and other equipment [36]. Both Hoseini et al. [37] and Wu et al. [38] have studied stirrer optimization in stirred tanks, although their focus was neither an open-source nor a biotechnological application. Wu et al. [38] carried out a multi-objective optimization in which mixing time and specific power input were to be minimized. Jossen et al. [39] dealt with stirrer optimization for bioreactors, whereby only a primitive optimization approach was used. Nine CFD simulations were carried out and the optimum was selected from these simulations.
Because CFD simulations are both time and computationally intensive, a surrogate-based optimization (SBO) is typically preferred [34,40]. Here, the design space is investigated using design and analysis of computer experiments (DACEs) and a surrogate model (also known as response surface model (RSM)) is created. Latin hypercube sampling (LHS) is commonly used for these types of experiments [36,41,42,43]. Alternatively, a random or regular grid sampling can be applied [44]. Based on the surrogate model, the actual optimization is then carried out, whereby the surrogate model and optimization algorithm differ depending on the problem under investigation and the optimization objective.
The optimization objective depends on the bioprocess and thus on the needs of the used cells. After Chinese hamster ovary (CHO), HEK293 cells are among the most widely used mammalian cell cultures for the production of biopharmaceuticals [26,45,46]. HEK293 cells are used to produce recombinant proteins, viral vectors and vaccines [47,48,49,50]. It should be noted that HEK293 cells grow adherently, such as HEK293-E and HEK293-T, or in suspension, such as HEK293-H and HEK293-F, with only the latter being considered here [51,52]. HEK293 cells growing in suspension have a maximum specific growth rate between 0.020 h−1 and 0.036 h−1 [53,54,55,56,57] and typical cell diameters from 14 μm to 16 μm [58,59,60]. In Seidel et al. [26], cell growth of HEK FreeStyleTM 293-F suspension cells was improved by the authors at a laboratory scale by adjusting the hydrodynamic stress. This optimized process at 4 L scale serves as a baseline for the scale-up method proposed in this article. To verify the results, the data were compared with cultivations in which the specific power input was used as a scale-up criterion. The reason for choosing this criterion is that several authors have already shown (or at least proposed) that the use of this criterion has worked for geometrically similar bioreactors and HEK293 cells [61,62,63,64].

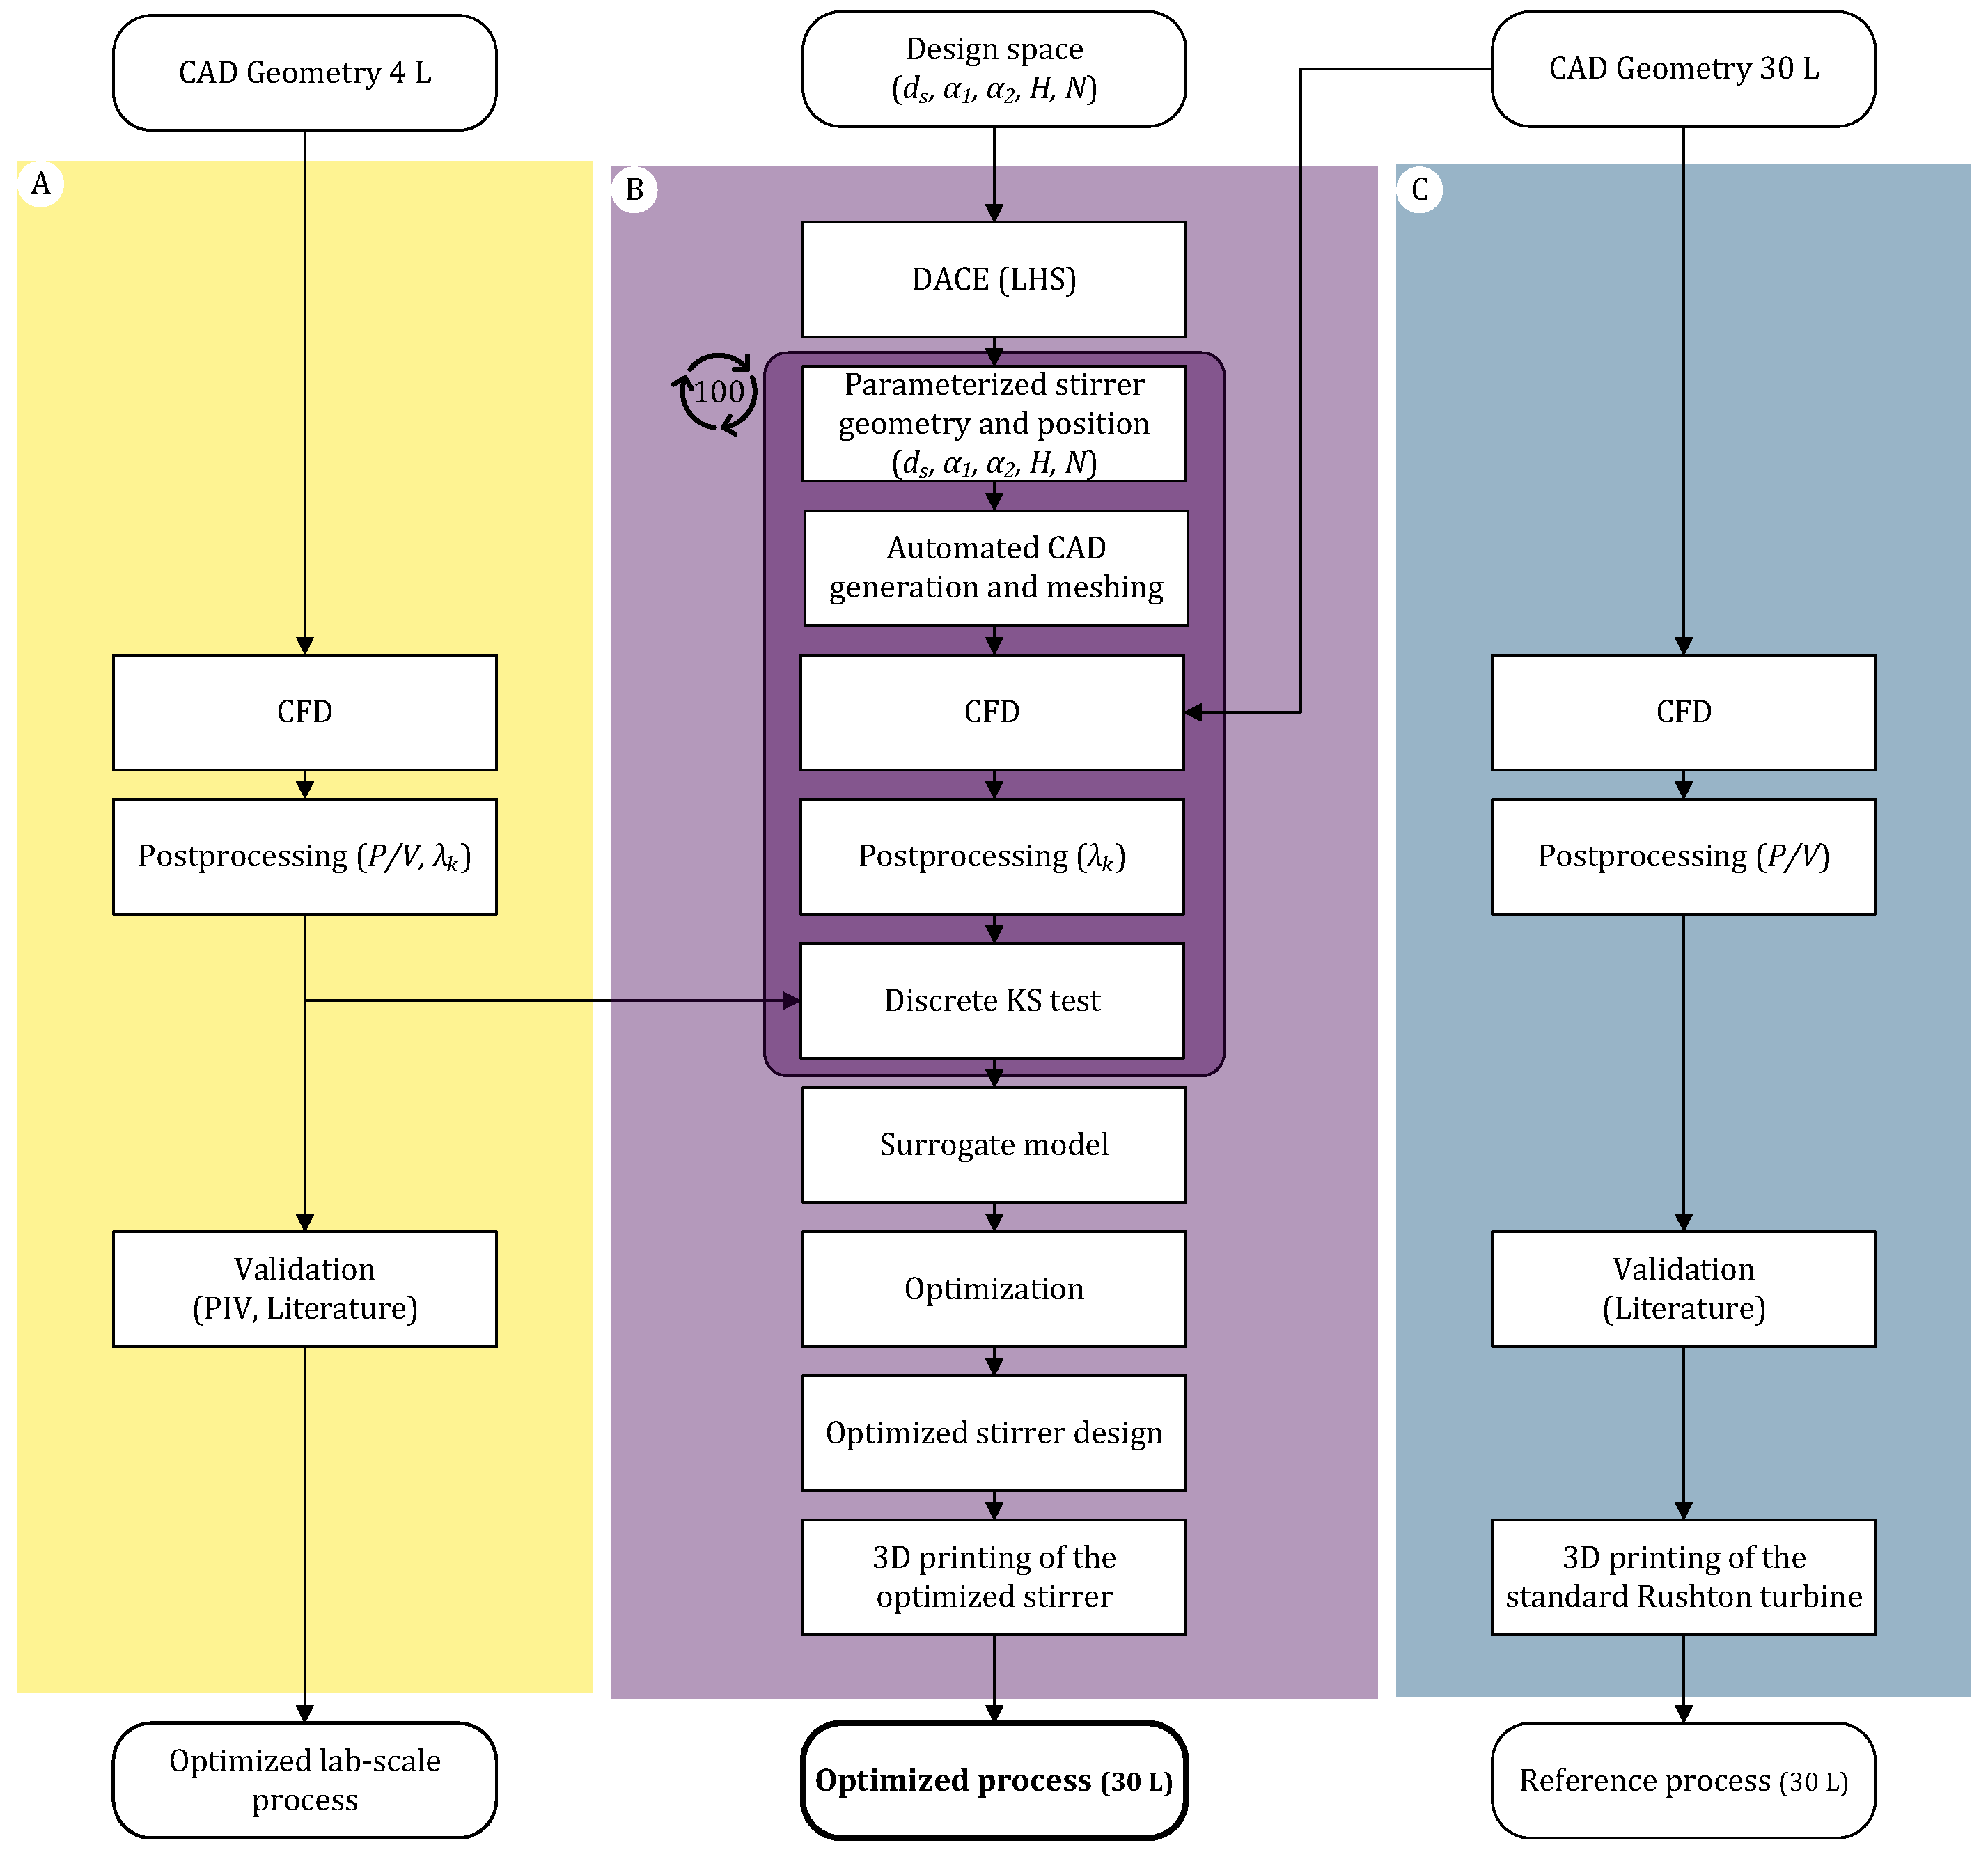
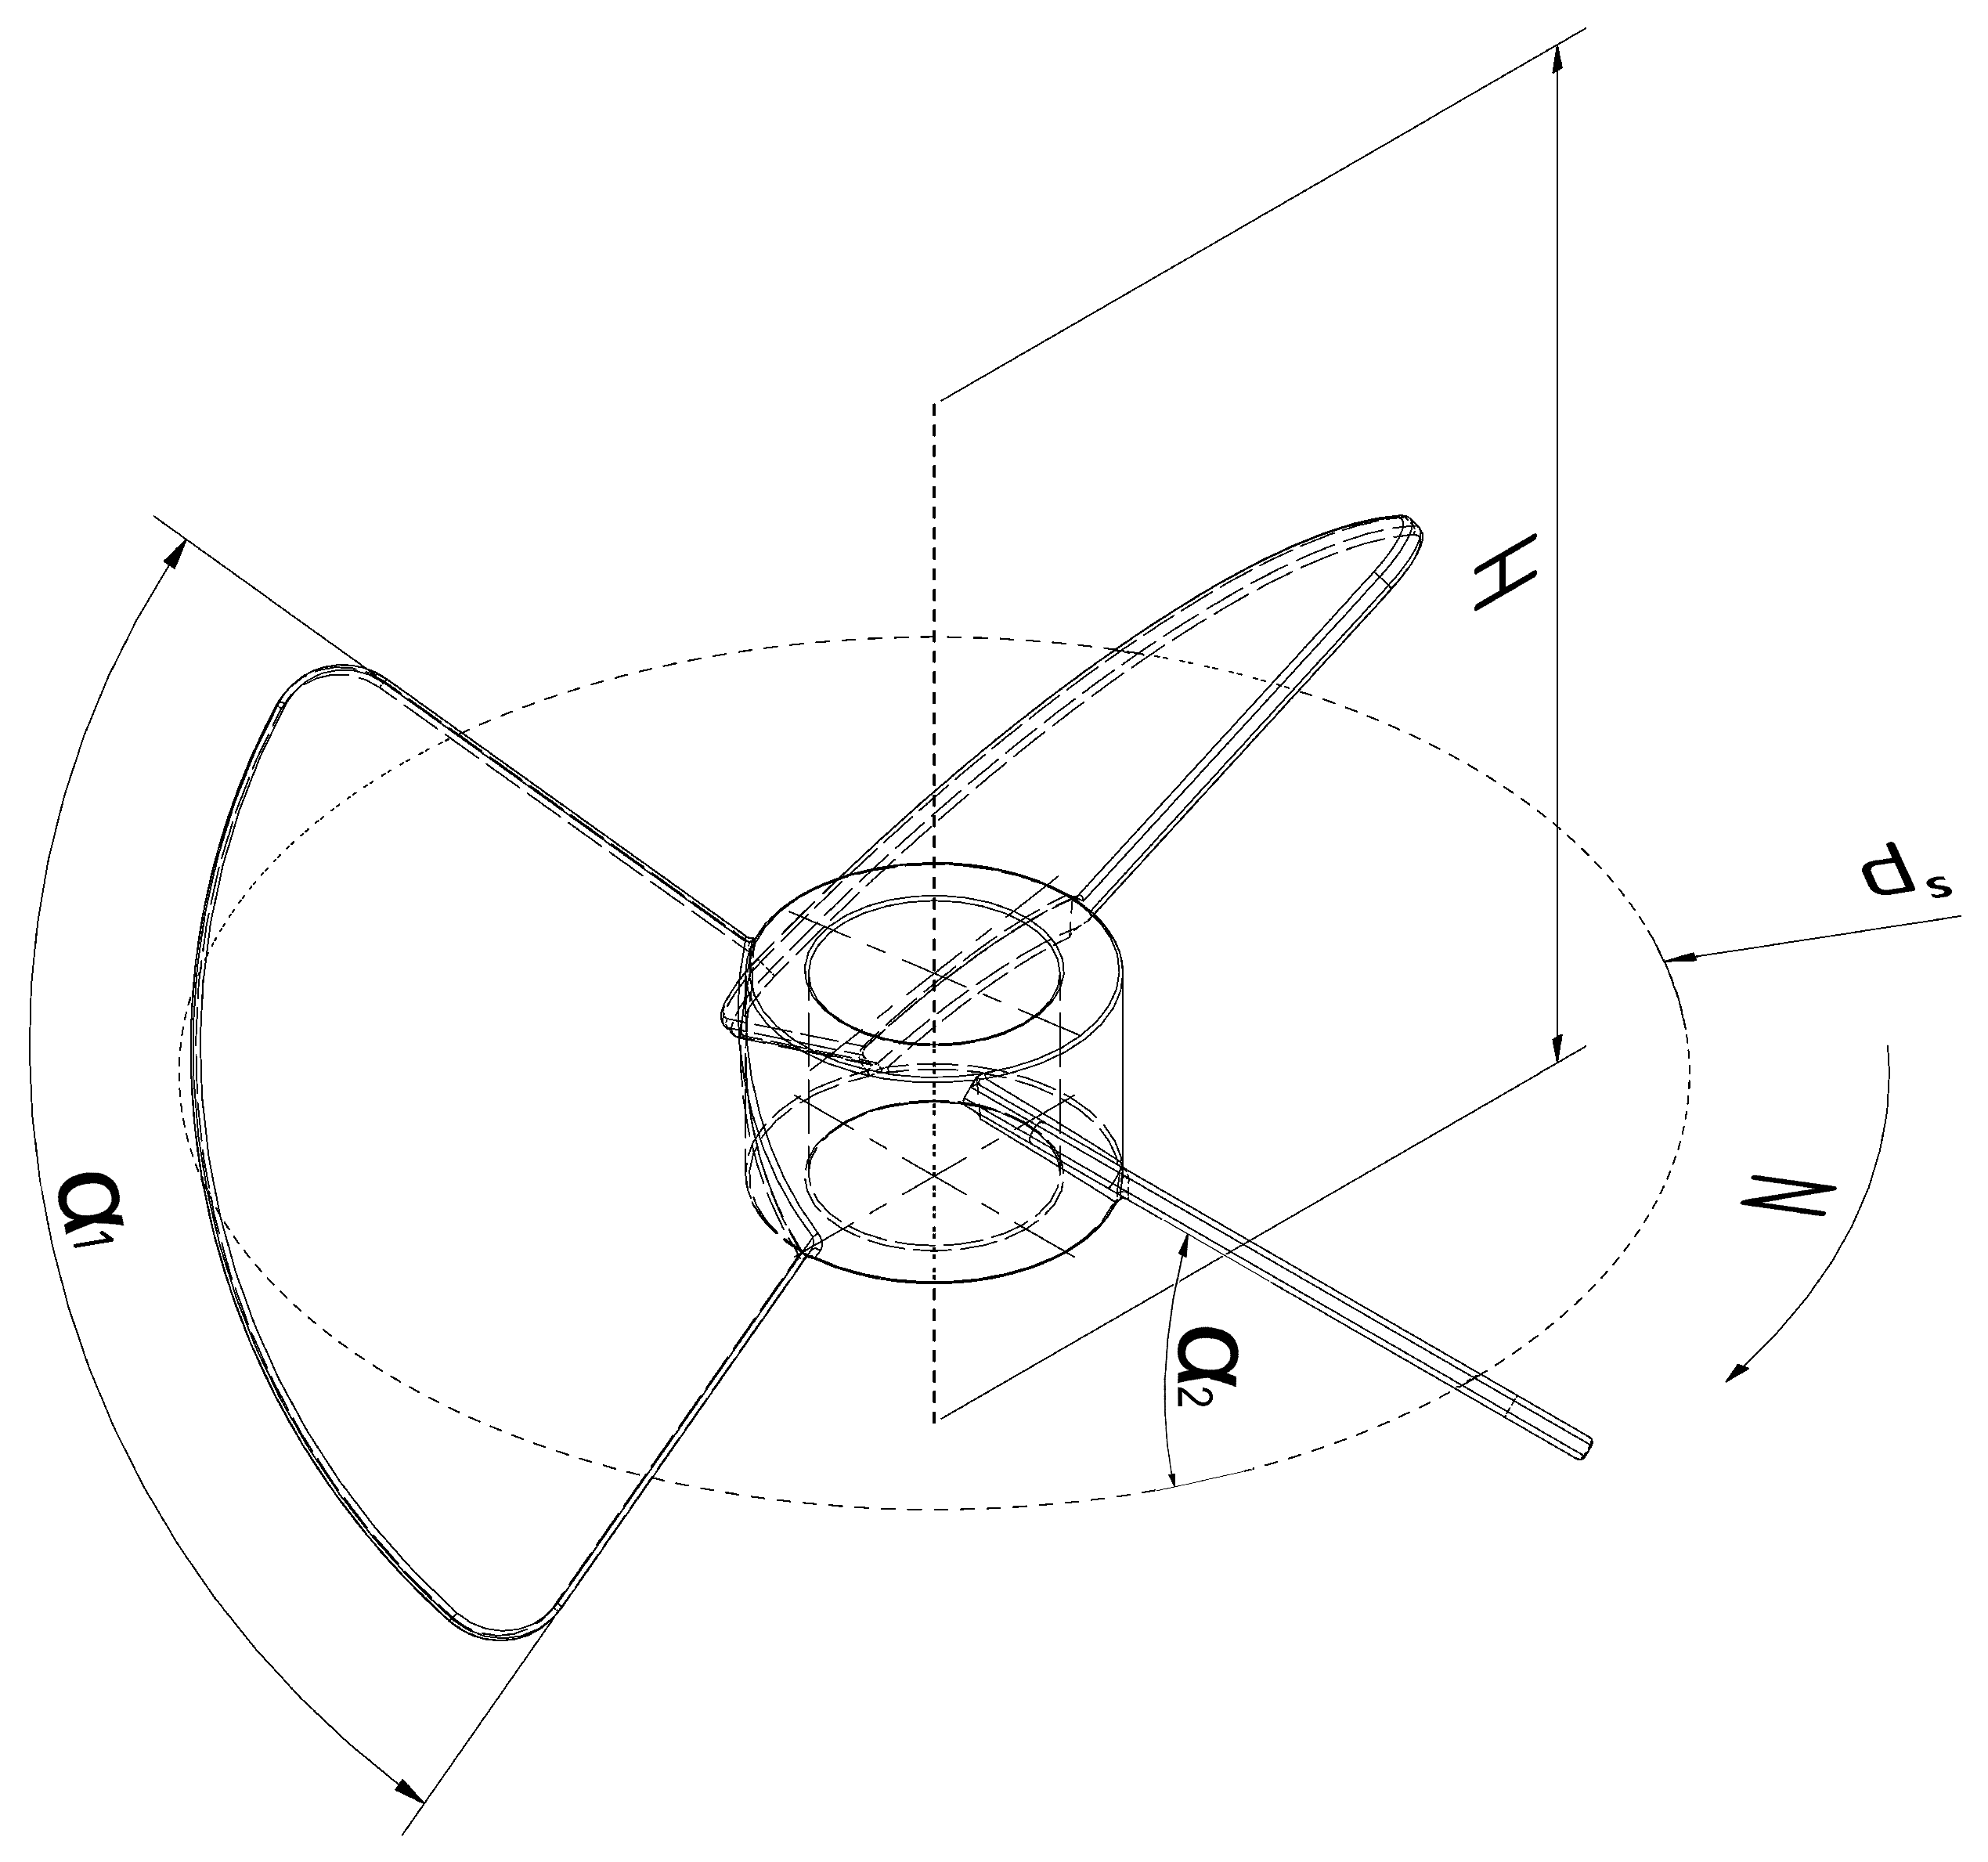
2. Materials and Methods

In Seidel et al. [26], the authors showed that HEK FreeStyleTM 293-F cells can be cultivated with a higher specific power input (233 W m−3) than typically stated in the literature (≈60 W m−3) and to yield 24% higher maximum viable cell densities (VCD max ). The cultivation optimized in Seidel et al. [26] in the Minifors 2 bioreactor from Infors AG (Bottmingen, Switzerland) with 4 L working volume serves as the basis for the automated scale-up concept presented here (Figure 1A). These CFD simulations were validated using particle image velocimetry (PIV) and literature data. Figure 1B shows the new scale-up method proposed here, in which a similar Kolmogorov length scale distribution is achieved by stirrer optimization. The Kolmogorov–Smirnov (KS) test, which compares the cumulative distribution functions (CDF) of the Kolmogorov scale length distribution, was used as the optimization criterion. The scale-up bioreactor was intentionally changed from a cell culture bioreactor to a system that is rather atypical for mammalian cell cultures. However, there are now some companies that successfully cultivate mammalian cells in bioreactors that they also use for processes with microorganisms. The 30 L D-DCU bioreactor (Sartorius AG, Göttingen, Germany) is a classic bioreactor for microbial fermentations with four baffles, three Rushton stirrers and a bioreactor height to diameter ratio H/D of 3:1 [65]. As a reference cultivation, duplicate cultivations were carried out with the same specific power input (233 W m−3) as in the Minifors 2 bioreactor (Figure 1C). A duplicate was also carried out using the system with optimized stirrer geometry, position and speed. The process is described in detail in Figure 1 and the following sections.

2.1. Computational Fluid Dynamics

The CFD model validated in Seidel et al. [26] using PIV and data from literature serves as the basis for the simulations carried out here. All CFD simulations were carried out on the 30 L D-DCU from Sartorius AG, using different stirrers, stirrer positions and speeds (see Section 2.2). All geometries excluding the stirrers, which were required for the simulations, were drawn with Inventor Professional 2023 (Autodesk Inc., San Rafael, CA, USA). To automate the optimization of the stirrer geometry, the stirrers were drawn using Onshape (PTC Inc., Needham, MA, USA) and adapted using the Python application programming interface (API) for each simulation (this option is not available as standard in Autodesk Inventor). For the CFD simulations, OpenFOAM version 10 was used and meshes were generated with the integrated meshing tool SnappyHexMesh. In order to estimate the discretization error, a mesh study with four different computational meshes was performed. Due to the low aeration rates and the low stirrer speeds (in combination with baffles, no vortex formation could be observed), a single-phase, steady-state simulation was carried out. However, since Reynolds numbers higher than 10,000 were achieved in the simulations, the Reynolds-Averaged Navier–Stokes (RANS) approach was chosen. As in Seidel et al. [26], the k-ω shear stress transport (SST) model of Menter [66] was employed as turbulence model, which is described in detail in Seidel et al. [26]. This turbulence model is suitable for low Reynolds numbers as they occur under the selected process conditions (Section 3.1) and in Seidel et al. [26]. The resulting momentum equation corresponds to Equation (5) and the continuity equation to Equation (6).
v t + · ( v v ) · ν eff v = 1 ρ p p + · S i j
· v = 0
For the rotation of the stirrers, the multiple reference frame (MRF) approach was utilized since these are steady-state simulations. A no-slip boundary condition was applied for all walls and a symmetry plane for the fluid surface [67,68]. For the pressure–velocity coupling, the Semi-Implicit Method for Pressure-Linked Equations (SIMPLE) algorithm was employed, which can be utilized in OpenFOAM using simpleFOAM. Also, as in Seidel et al. [26], an undershoot of the residuals of 1 · 10 5 was chosen as a convergence criterion. All CFD simulations were performed with water at a temperature of T = 310.15   K , which corresponds to a density of ρ = 993.37   kg   m 3 and a kinematic viscosity of ν = 0.6959 · 10 6   m 2   s 1 [69]. The calculations were decomposed into 32 parts using the Scotch algorithm and computed in parallel on the high-performance computing (HPC) system described in Seidel and Eibl [70]. The visualization of the simulations was carried out using Paraview 5.10.0 [71].

2.2. Optimization Process

As described in Johnson et al. [25], a similar Kolmogorov length scale distribution cannot be expected if different geometries such as the number of baffles and different stirrers are used. To obtain comparable Kolmogorov length scale distributions that serve as a scale-up criterion, five parameters were defined, varied and optimized. These five parameters are the stirrer speed N, stirrer diameter d s , the blade angle α 1 , the pitch angle of the stirrer blades α 2 and the stirrer height H (Figure 2).
Table 1 shows the design space investigated with the limits set by the system. Based on this design space, a DACE was created using LHS for design space exploration. For the five parameters, 100 CFD simulations were performed automatically. Daymo et al. [43] also used 100 simulations for five variable parameters for the optimization of a methane catalytic partial oxidation monolith reactor. Chen et al. [41] described ten times the number of parameters as standard for LHS and CFD-based optimization. Afzal et al. [42] used 15 times the number of parameters and Benchikh Le Hocine et al. [36] performed 148 simulations for seven parameters.
Table 1. Overview of the input variables and the resulting design space.
ParameterMinimumMaximum
Stirrer speed N50 rpm500 rpm
Stirrer height H 0.10 m 0.45 m
Stirrer diameter d s 50 mm170 mm
Blade angle α 1 20 120
Pitch angle α 2 45 90
The Design Analysis Kit for Optimisation and Terascale Applications (DAKOTA) version 16.5 developed by Sandia National Laboratories was used for the entire optimization process, which allowed the LHS, DACE, evaluation and optimization to be carried out with one command. How DAKOTA interacts with OpenFOAM is depicted in Figure 1 and described in detail in Guerrero et al. [33] and Daymo et al. [43]. As described in Section 2.1, the stirrer geometry was drawn and parameterized using the web-based CAD service Onshape [72]. Using the Python API, the geometry and thus the computational mesh could be automatically adapted for the CFD simulations. In order to obtain a single value per simulation for the optimization process, the Kolmogorov length scale distribution was analyzed using the two-sample KS test with the null hypothesis H 0 of equal cumulative distributions F (Equation (7)) [73]. The test statistic D served as the optimization criterion (Equation (8)). In the KS test, the cumulative Kolmogorov length scale distribution F Minifors from the optimized Minifors 2 cultivation by Seidel et al. [26] was used.
H 0 : F Minifors ( λ ) = F D - DCU ( λ ) λ R 0
D = m a x | F Minifors ( λ ) = F D - DCU ( λ ) |
The automated analysis was carried out with Python 3.10, using PyVista 0.38.5 for the analysis in addition to the usual modules, which has an integrated OpenFOAM case reader [74]. A quadratic polynomial model was used as a surrogate model. DAKOTA allows asynchronous evaluation, which means that not only a single CFD simulation was parallelized (Section 2.1) but also several simulations and evaluations could be carried out in parallel for the design space exploration. Here, four simulations were run in parallel on the HPC system. Once all 100 simulations were completed, the surrogate model was created, and the optimization was carried out.

2.3. Cultivations for Biological Evaluation

In order to evaluate the optimized stirrer geometry, position and speed predicted by CFD, four cultivations were carried out in the 30 L D-DCU system from Sartorius AG. Two cultivations were carried out with the standard configuration of three Rushton stirrers ( d s = 105   mm ), four baffles and ring sparger and two cultivations with the same configuration but with optimized stirrer geometry. Both the inoculum production and the cultivations were carried out analogously to the experiments described in Seidel et al. [26] and serve as the basis for the experiments conducted here. Batch cultivations were carried out with the HEK FreeStyleTM 293-F cell line (Thermo Fisher Scientific, Waltham, MA, USA [75]) and the chemically defined FreeStyleTM 293 medium (Thermo Fisher Scientific) which contains L-alanyl-L-glutamine (GlutaMAXTM) as a stabilized form of L-glutamine. The inoculum for cultivations in the 30 L D-DCU system and reference shake flasks was prepared from a cryovial of a working cell bank with 1 · 10 7 cells mL−1. The thawed cells were transferred into 30 mL of pre-warmed FreeStyleTM 293 medium (125 mL unbaffled shake flask) and then passaged into 500 mL unbaffled shake flasks at a VCD of about 0.3 · 10 6  cells mL−1. The inoculum production lasts 7 days and was performed in a Multitron shaker from Infors AG at a temperature of T = 310.15   K , a shaking speed of N = 100   rpm , a shaking amplitude of d 0 = 50 mm, a CO 2 concentration of c CO 2 = 8 % and a relative humidity of R H = 80 % [26]. The cultivations were carried with a working volume of 30 L and an inoculation cell density of 0.3 · 10 6  cells mL−1. The inoculum was transferred to the bioreactor using a transfer flask (5 L plain bottom Erlenmeyer flask with a disposable 100 mm aseptic transfer cap, from Corning Inc. (Corning, NY, USA)). The cultivation temperature, which was controlled through the double jacket, was 310.15 K in each case. The oxygen concentration was kept above 40% with 0.1 vvm air being added via the headspace and, when necessary, O 2 via the sparger (Appendix A, Figure A2A). The pH was controlled by adding CO 2 through the sparger to maintain a pH of 7.10 ± 0.05 (Appendix A, Figure A2B). The stirrer speeds were determined with CFD resulting in 213 rpm ( v tip = 1.17   m   s 1 ) for the Rushton stirrer configuration and 67 rpm ( v tip = 0.56   m   s 1 ) for the optimized stirrer.
The CFD-optimized stirrer was manufactured using a selective laser sinter (SLS) 3D printing process. The material used is biocompatible polyamide 2200 (PA2200), which is United States Pharmacopeia (USP) class VI certified, Food and Drug Administration (FDA) approved and complies with EN ISO 10993-1 [76]. The stirrers were printed with the EOS p396 system (EOS GmbH, Krailling, Germany). In order to exclude the influence of the stirrer material despite biocompatibility, the standard stainless steel Rushton stirrers were replaced by SLS 3D-printed stirrers for maximum comparability.
To monitor the process, cell-specific parameters such as VCD, total cell density (TCD), viability, and cell and aggregate sizes were measured using a CedexHiRes analyzer (Roche Diagnostics GmbH, Basel, Switzerland) and NucleoCounter NC-200 (Chemometec, Allerod, Denmark). Furthermore, an EXcell 231 near-infrared (NIR) absorption sensor (Exner Process Equipment GmbH, Ettlingen, Germany) was used to determine the optical density (OD 850 n m ) online at a wavelength of 850 nm. Morphology was regularly checked using differential interference microscopy (IX83 inverted microscope with UPlanSApo 100x/1.4 oil /0.17/FN26.5 objective, both from Olympus Life Science (Waltham, MA, USA)). In addition to the cell-specific parameters, the substrates glucose and L-alanyl-L-glutamine, as well as metabolites lactate and ammonium, were measured. These measurements were carried out with a CedexBio analyzer (Roche Diagnostics GmbH) every 24 h. The pH value was likewise externally checked every 24 h with a FiveEasy pH-meter F20 (Mettler-Toledo GmbH, Greifensee, Switzerland). A detailed functional description of the measuring instruments used can be found in Seidel et al. [26]. The reference cultivations in 500 mL unbaffled shake flasks were each prepared from the same inoculum and were cultivated at a shaking rate of 130 rpm (the remaining conditions as for the production of the inoculum). Samples were also taken daily, and the same analyses were carried out as in the stirred bioreactor.

3. Results and Discussion

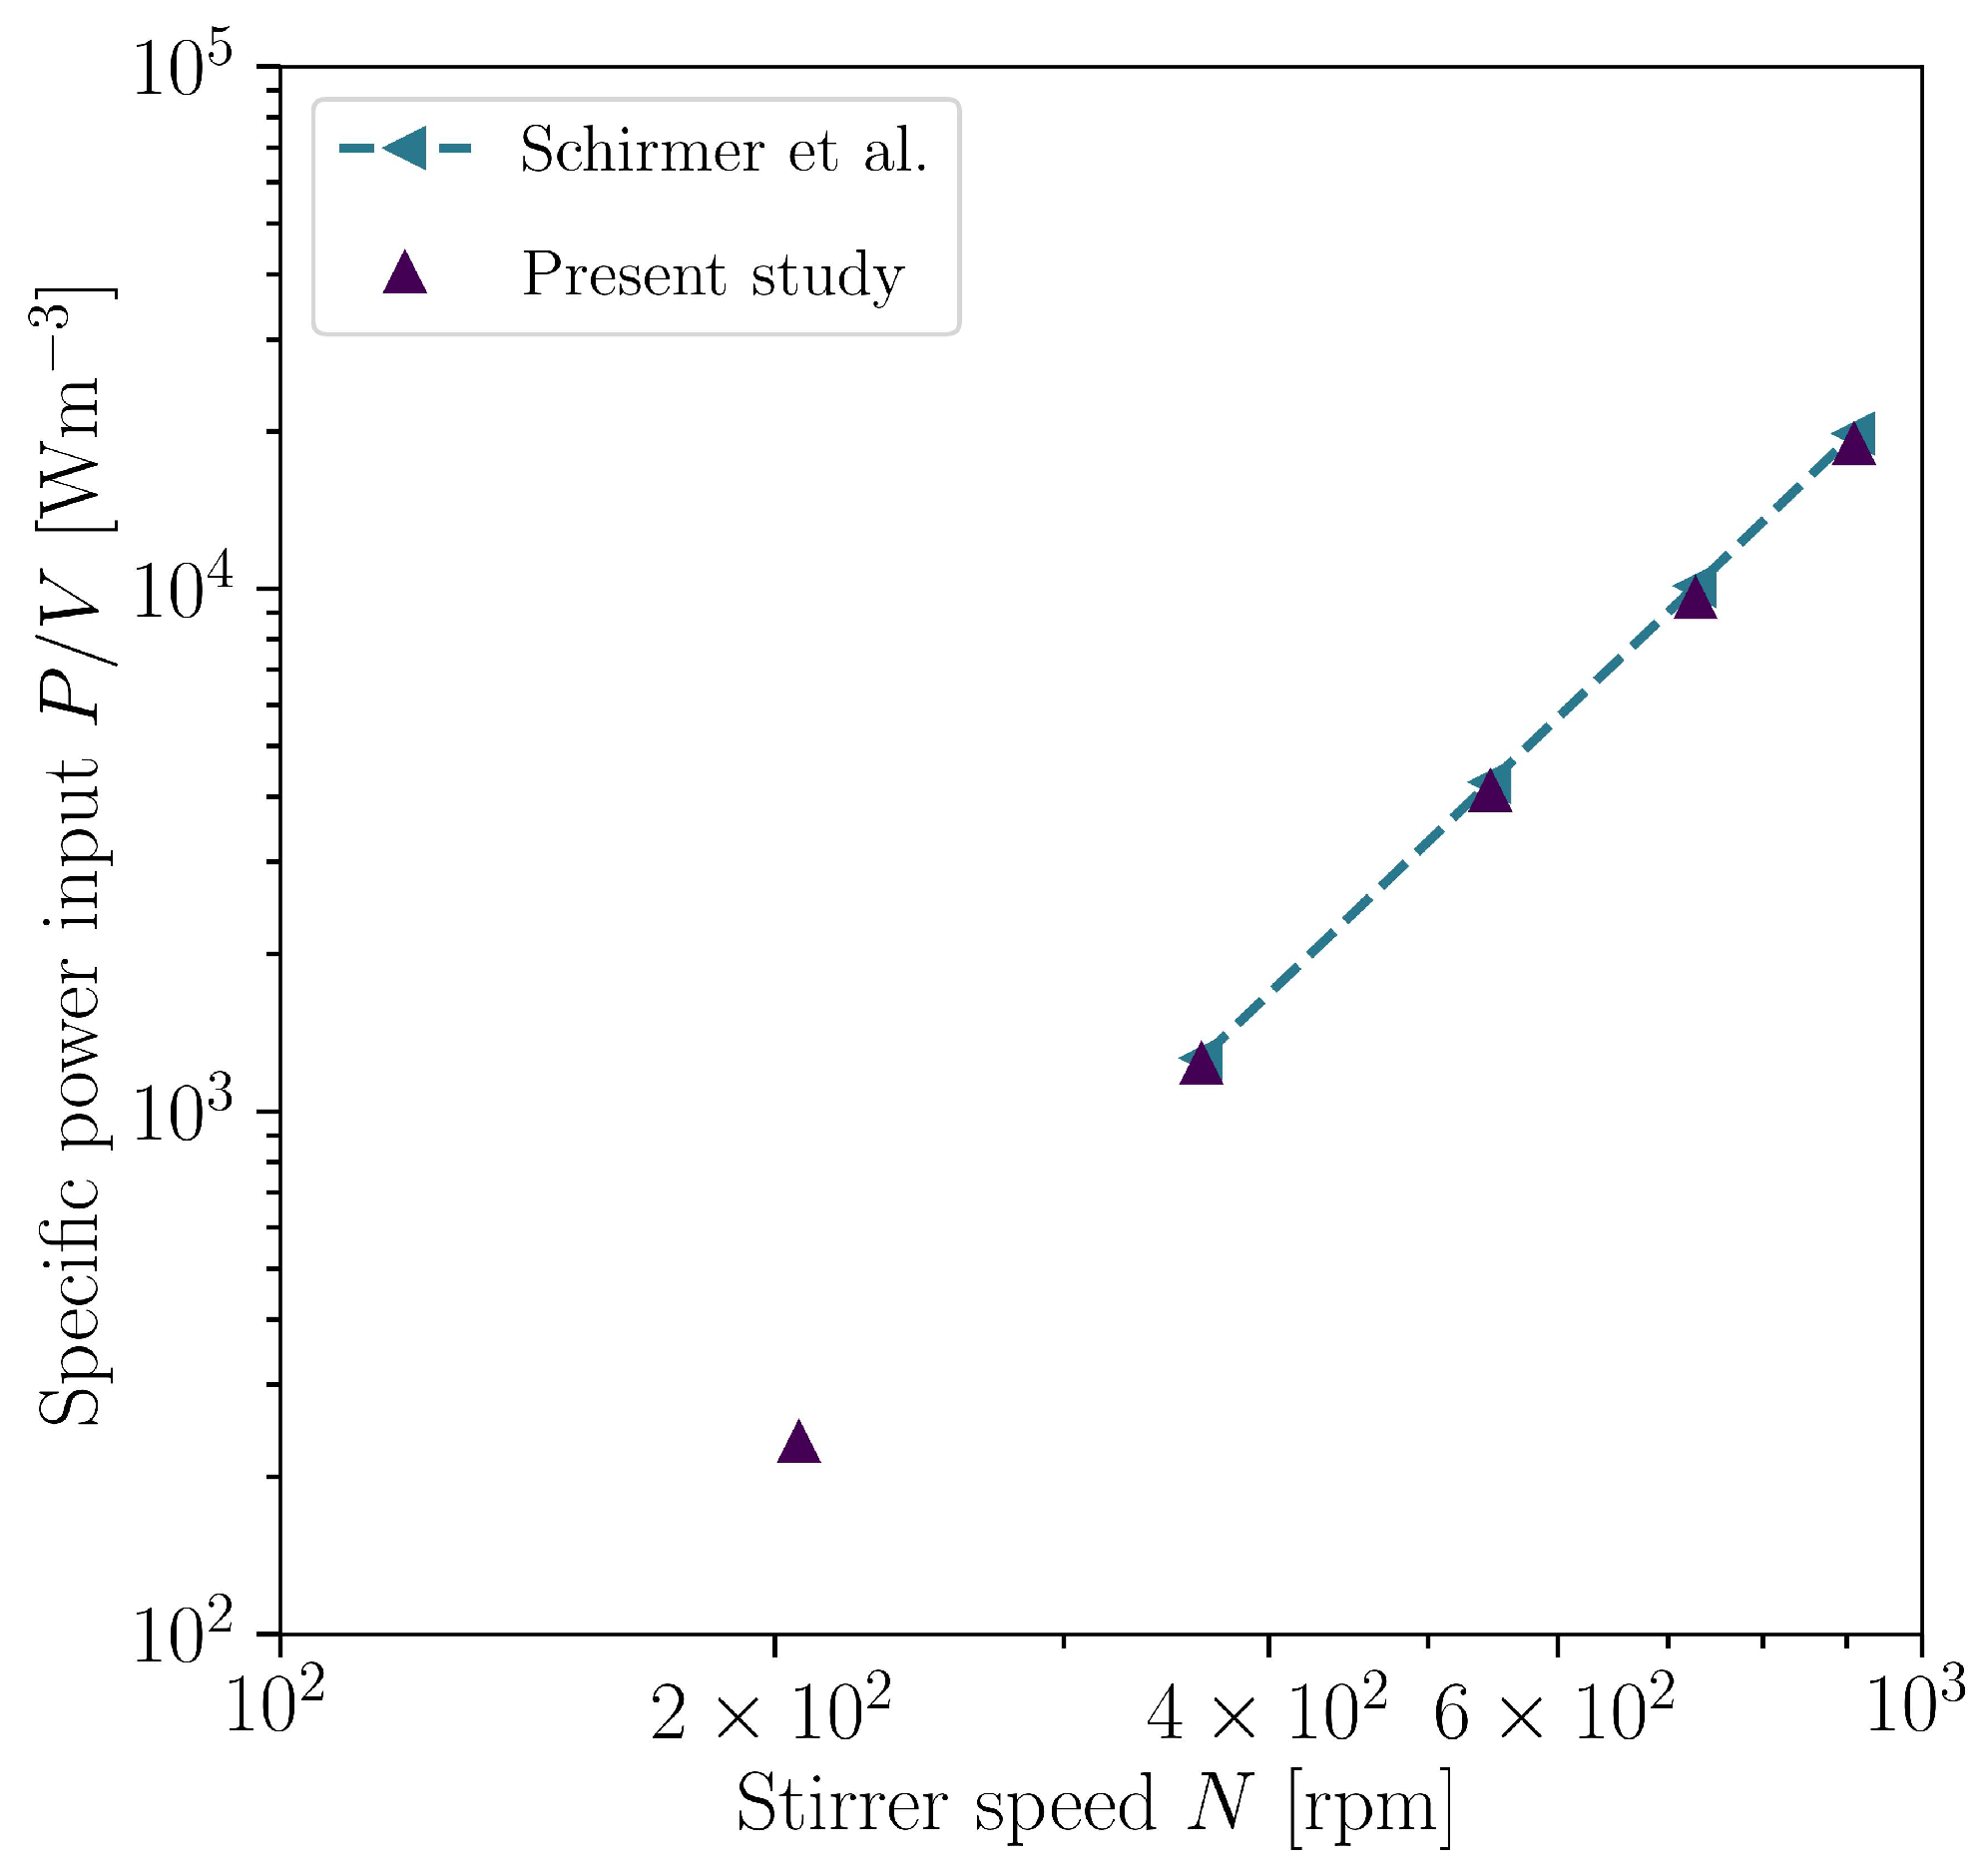
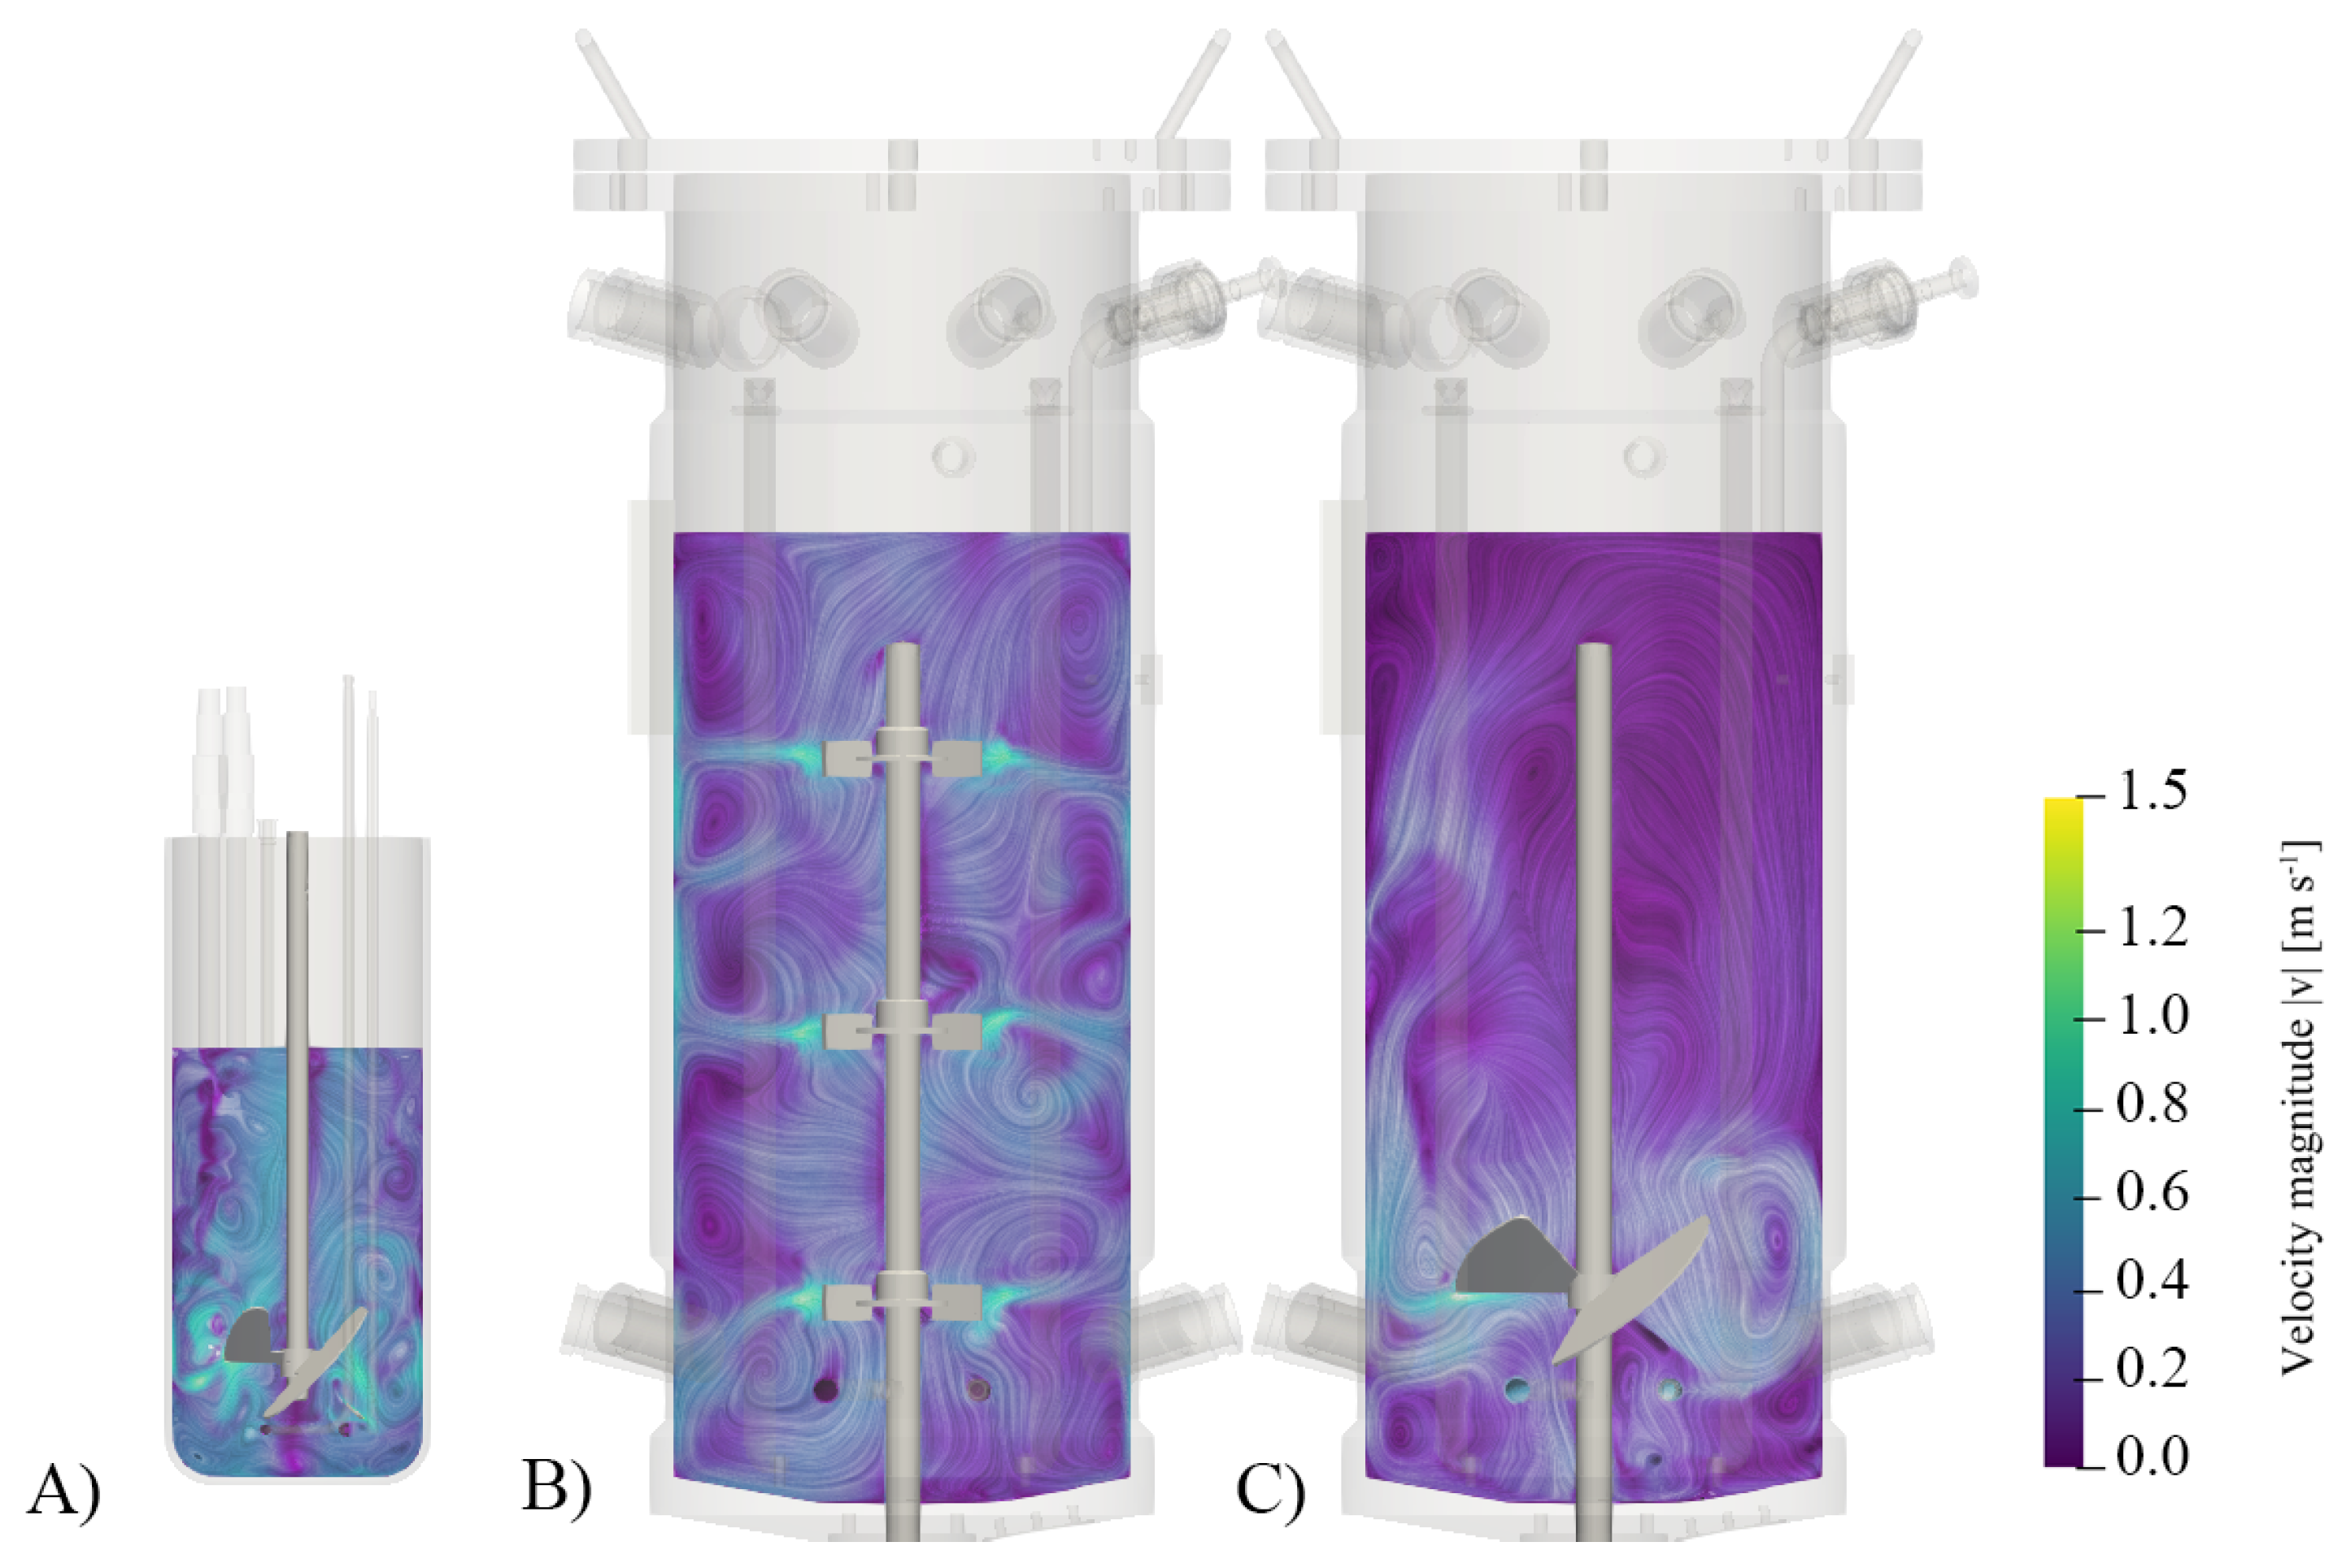
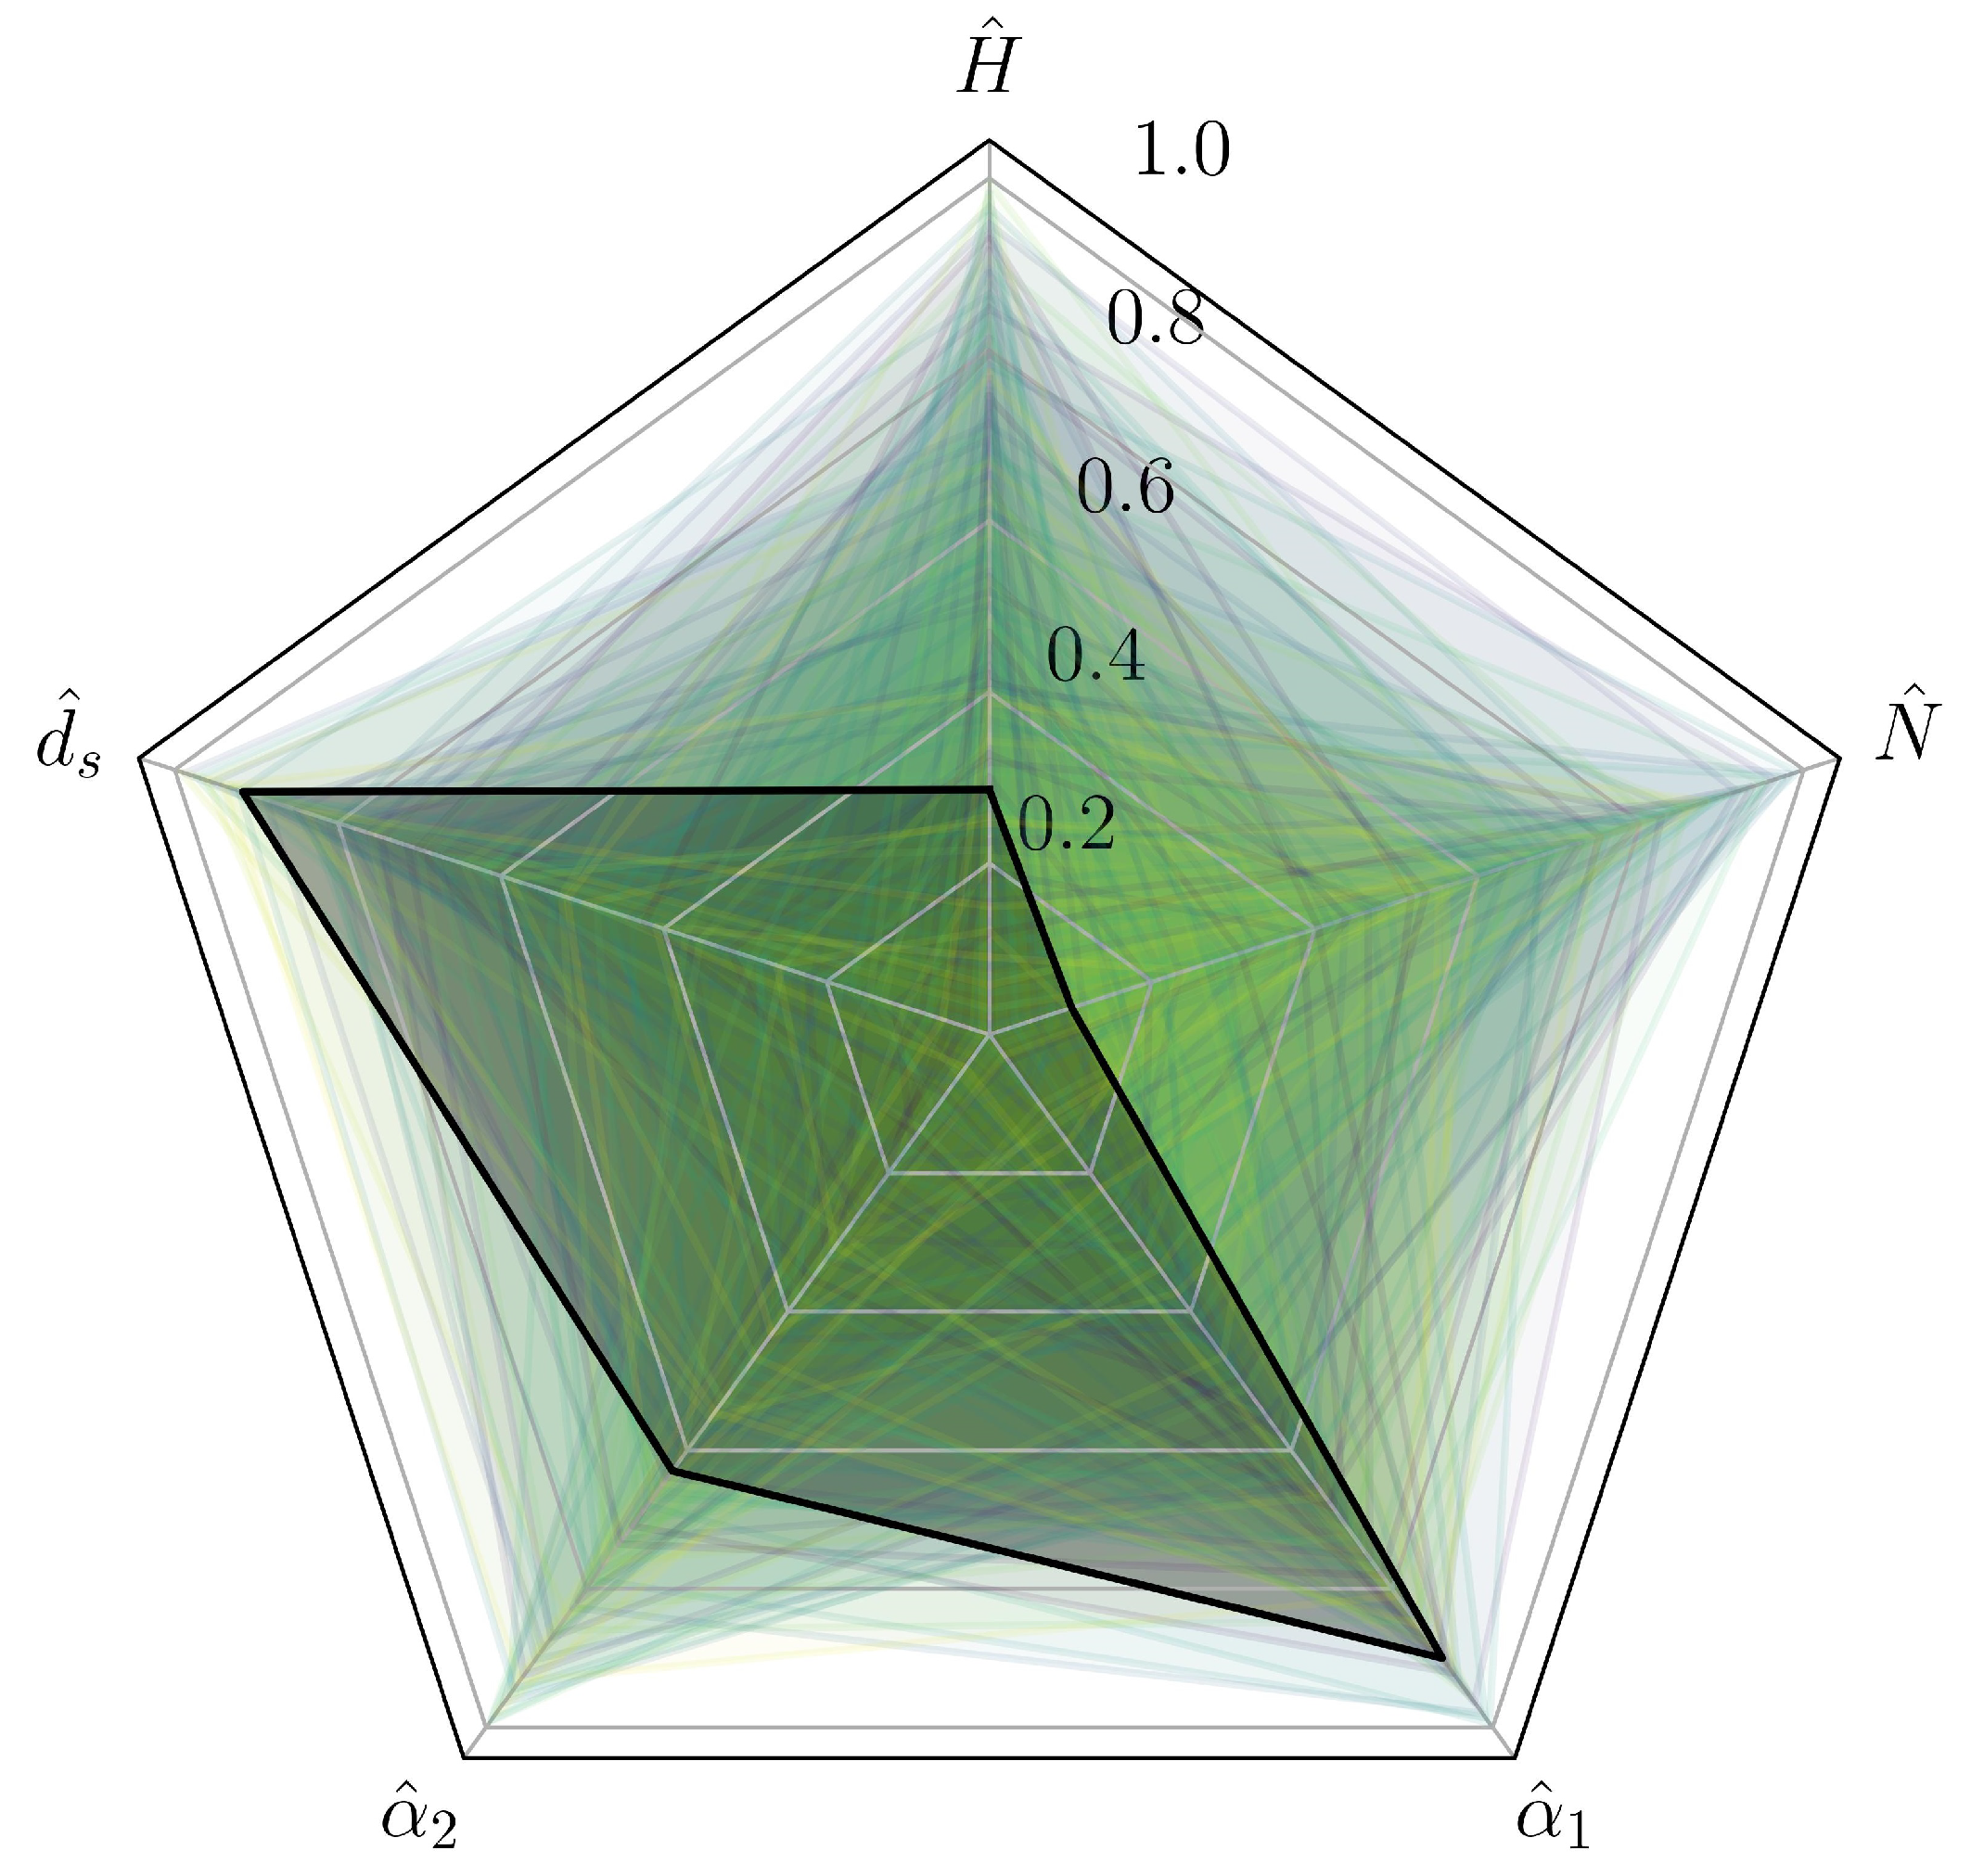
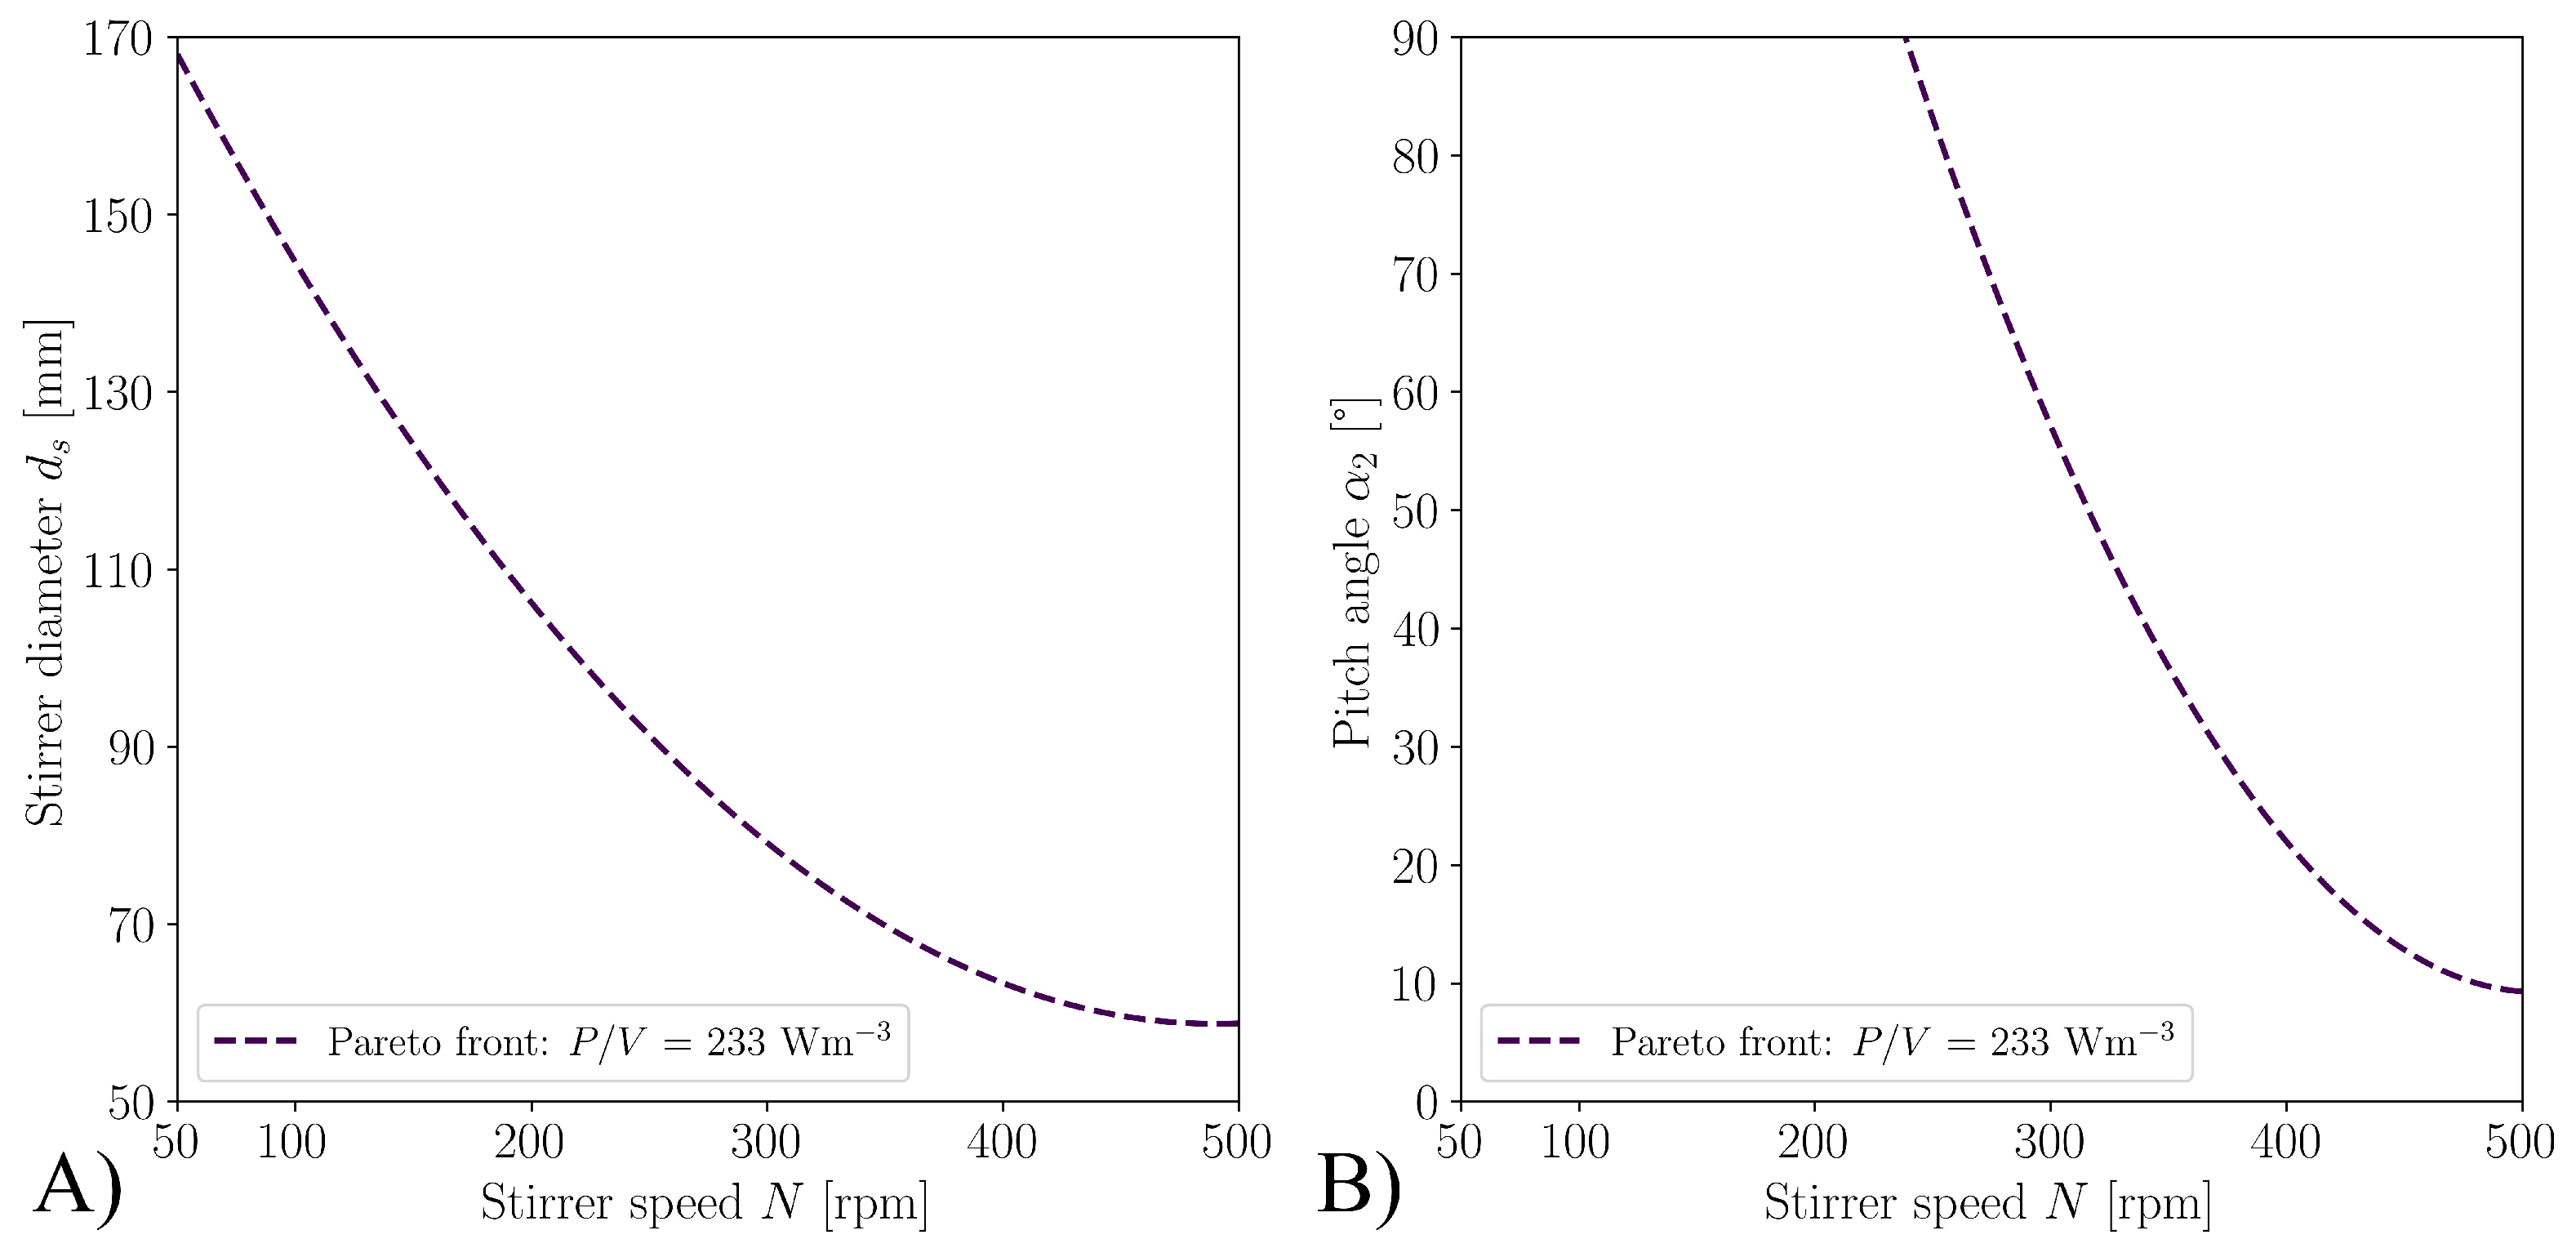
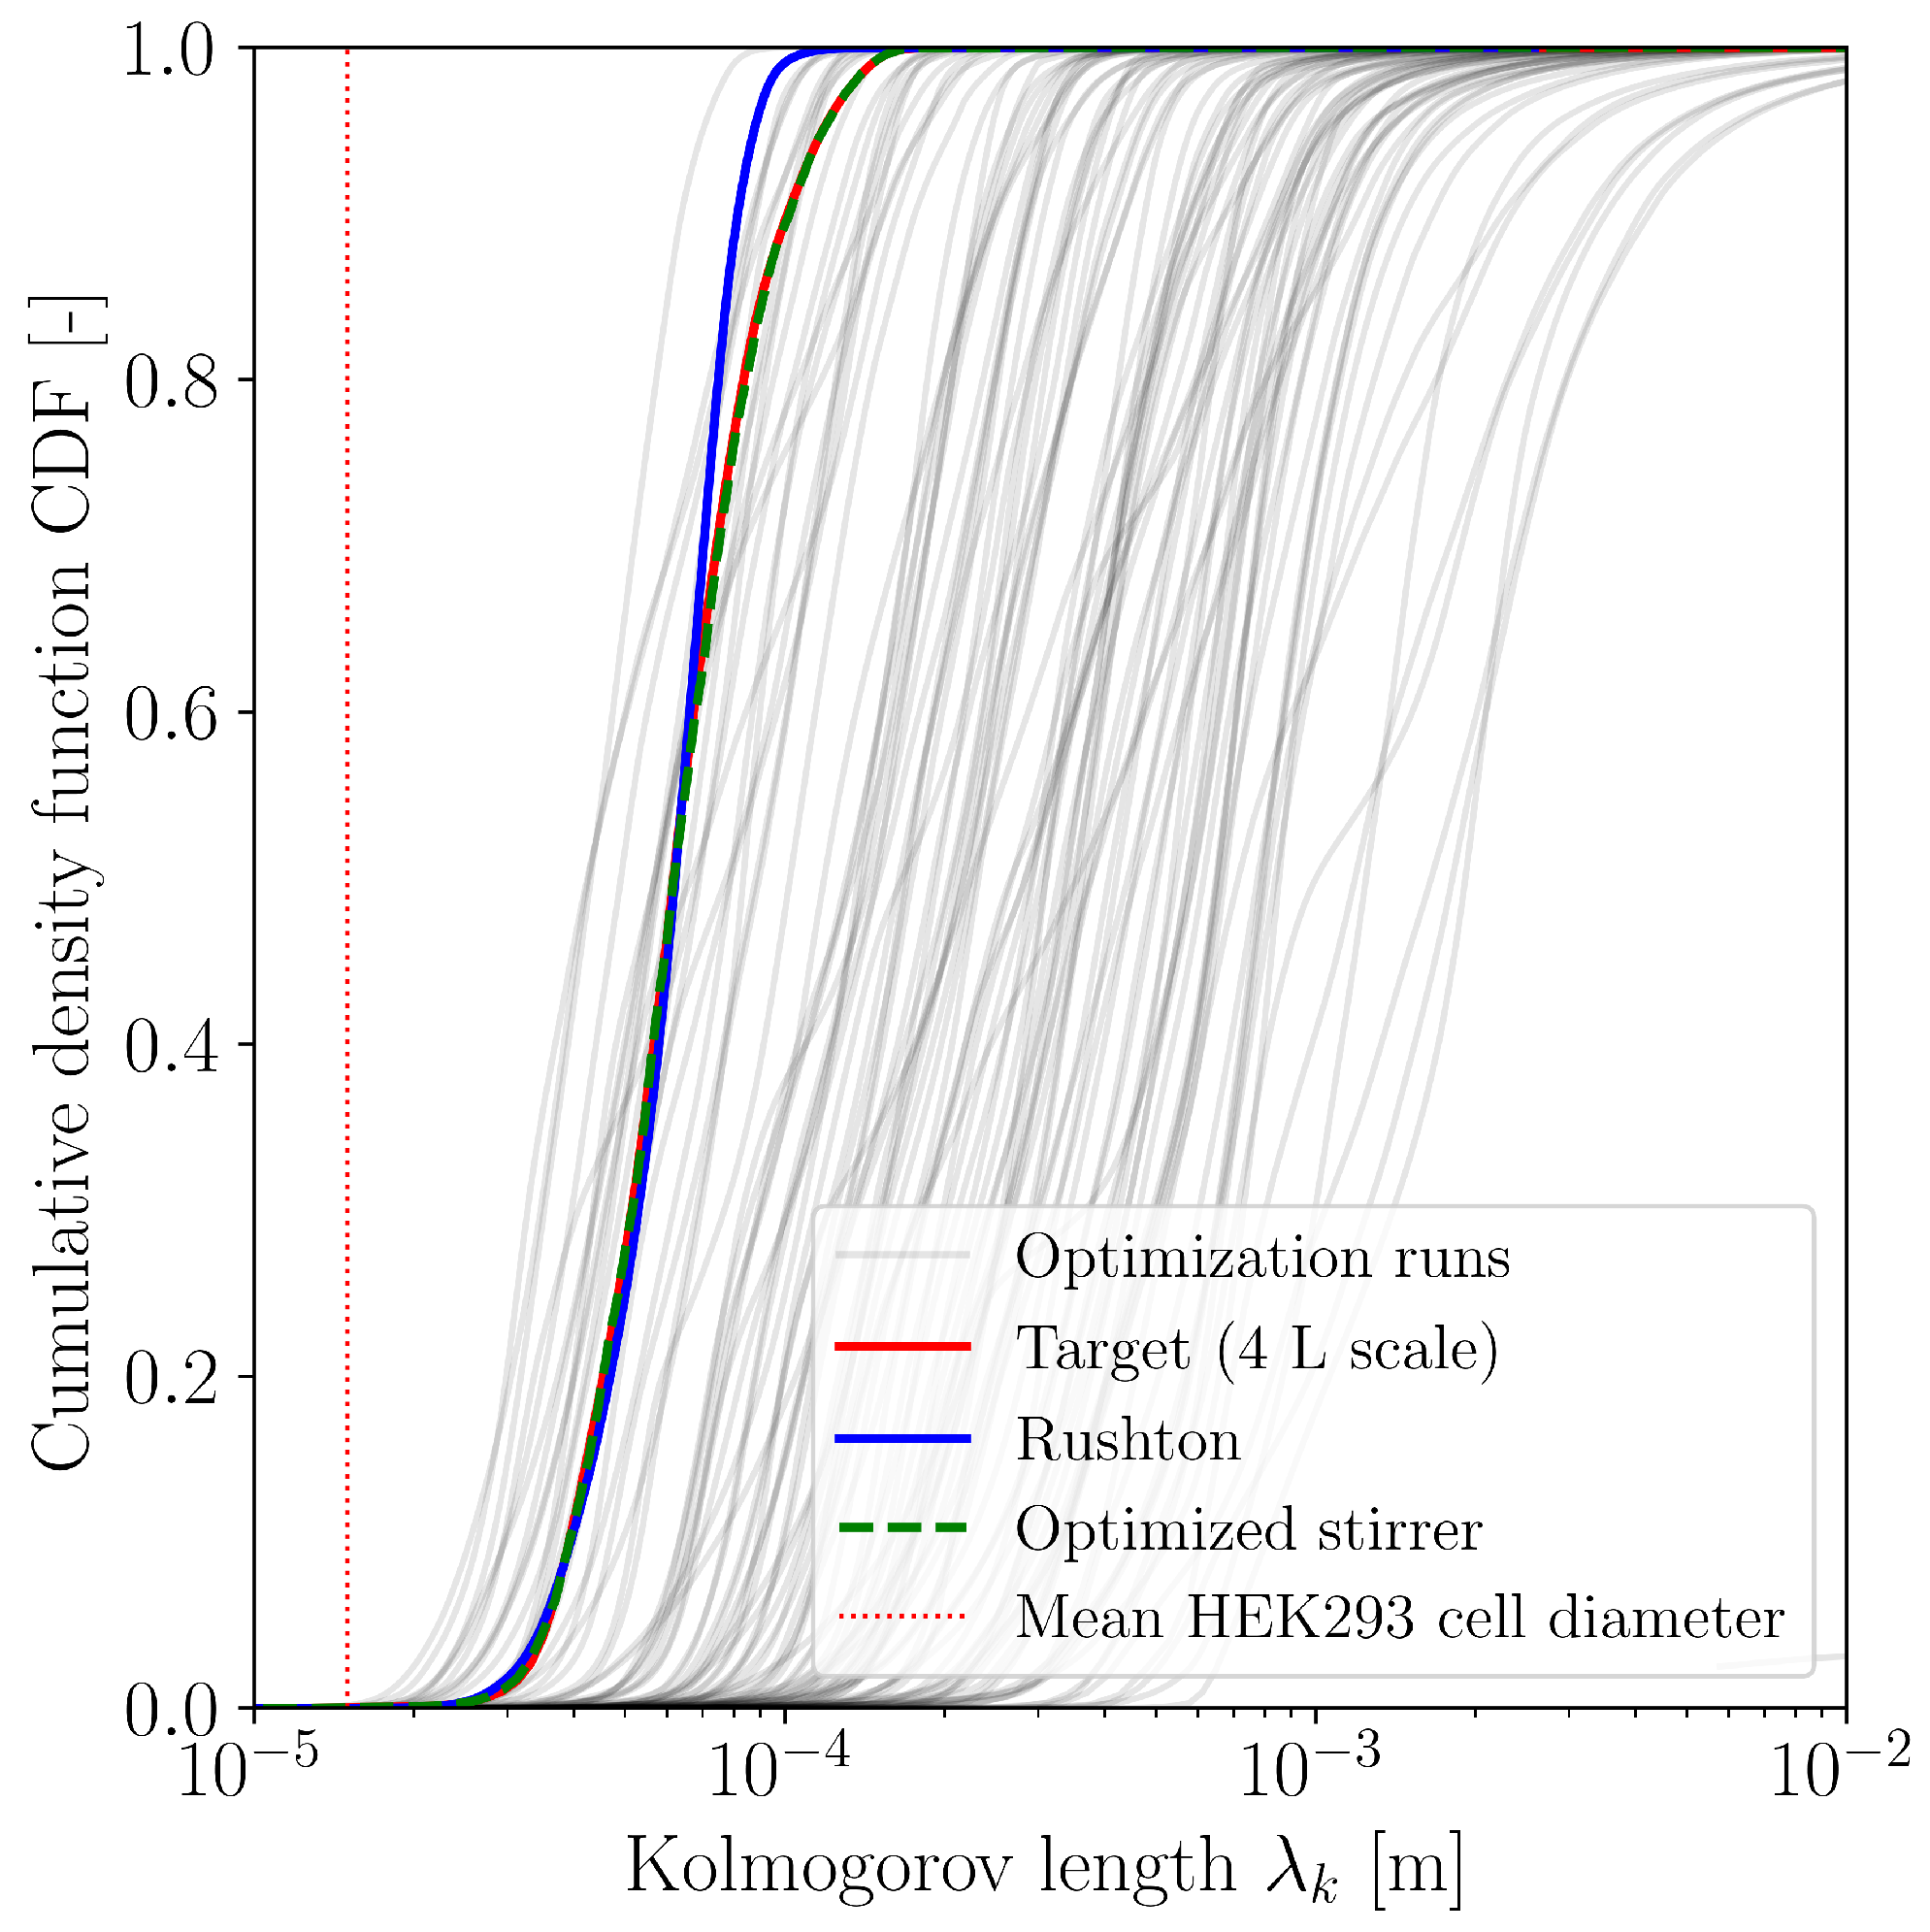
3.1. Optimization with CFD

The CFD model used has already been validated using PIV and literature data as described in Seidel et al. [26]. In order to quantify the discretization error for the new geometry and to ensure an economic implementation with regard to the 100 optimization simulations, a mesh study was carried out. For this study, the grid convergence index (GCI) method was used as described in Baker et al. [77], Ramírez et al. [78] and Pappalardo et al. [79]. The standard value of 1.25 was chosen as the safety factor F S [23,26]. The mesh study was conducted with the standard 30 L D-DCU configuration with three Rushton impellers at a stirrer speed of 364 rpm ( v tip = 2   m   s 1 ) and 30 L working volume. The specific power input was used as an evaluation criterion, which was also calculated by Schirmer et al. [65] with the same configuration and speed. The refinement factor ranged from 1.08 to 1.17, whereas a value of 1.1 to 1.3 is typically recommended [80]. The quotient GCI i + 2 , i + 1 r p a GCI i + 1 , i was close to 1 in each case, suggesting an asymptotic behavior of the specific power input (Table 2). For further simulations, mesh M4 with 4.88 · 10 6 cells and its mesh settings was used, which in this case resulted in a simulation time of 3.5 h with 32 cores.
Schirmer et al. [65] also characterized this system in terms of biochemical engineering parameters using CFD, but with Ansys Fluent 16.2. They utilized the realizable k-ε model, whereas here the k-ω-SST model was used. The same boundary conditions were applied and Schirmer et al. [65] used slightly fewer grid cells ( 4.20 · 10 6 cells) than here ( 4.88 · 10 6 cells). As can be seen in Figure 3, the specific power inputs agree for the range from v tip = 2   m   s 1 ( N = 364   rpm and Re = 66,592) to v tip = 5   m   s 1 ( N = 909   rpm and Re = 166,481). As already mentioned, the 30 L D-DCU bioreactor is a bioreactor typically used for microorganisms [65,81,82]. Therefore Schirmer et al. [65] only investigated the range from v tip = 2 m s−1 to 5 m s−1, which corresponds to a specific power input over 1 kW m−3. However, for the reference cultivation with the same specific power input as in Minifors 2, lower power inputs or speeds were required. With N = 213   rpm ( v tip = 1.17   m   s 1 and Re = 38,956), the 233 W m−3 described in Seidel et al. [26] can be achieved. As can be seen in Figure 4B), the flow field typical for Rushton impellers is formed with the maximum velocities at the stirrer tips [38,83].
In order to obtain a Kolmogorov length scale distribution as similar as possible to that in Minfors 2, optimizations of the stirrer geometry, position and speed were then carried out. The 100 parameter combinations generated by the LHS and subsequently simulated using CFD are shown in Figure 5. For this purpose, the relative parameter values, which are described in Table 1, were mapped in the radar chart. Corresponding velocity plots are summarized in the appendix in Figure A1.
Based on the DACE, a different RSM can now be created, whereby the KS test variable was finally chosen for the scale-up. However, simpler analyses can also be carried out, such as modeling the specific power input. Equation (9) shows the results for the investigated design space ( n s = 100 , R 2 = 0.96 ). If only the specific power input should be kept constant for the scale-up, a Pareto front results, which is shown in Figure 6A, for the combination of stirrer speed and stirrer diameter. The same can be examined, for example, for the combination of pitch angle α 2 and the stirrer speed N. This shows that a larger angle α 2 or a larger stirrer diameter results in a larger projected cross-sectional area and thus a larger specific power input for the same stirrer speed N (Figure 6B).
P / V = 10 a 1 · H [ m ] + a 2 · d s [ m m ] a 3 · d s 2 [ m 2 ] + a 4 · α 1 [ ] + a 5 · α 1 2 [ 2 ] a 6 · α 2 [ ] + a 7 · N [ rpm ] a 8 · N 2 [ rpm 2 ] a 9
a 1 = 0.162 a 2 = 0.049 a 3 = 1.25 · 10 4 a 4 = 6.15 · 10 3 a 5 = 2.29 · 10 4 a 6 = 2.21 · 10 4 a 7 = 0.013 a 8 = 1.39 · 10 5 a 9 = 3.67
However, if the described test statistic D of the KS test is employed, the best agreement with the Minifors 2 bioreactor is obtained for N = 67   rpm , H = 0.124   m , d s = 160.23   mm , α 1 = 59.60 and α 2 = 41.56 , which results in a test statistic of D = 0.117 . This corresponds to a Re of 32,080 and a tip speed of 0.56  m s−1. Visualizing the Kolmogorov length scale distributions, it can be seen that there are only minimal differences in the distribution between the optimized design of the 30 L D-DCU and the Minifors 2, whereas the differences with the standard 30 L D-DCU with three Rushton impellers are significantly larger (Figure 7). Since a similar Kolmogorov length scale distribution was achieved, a similar energy dissipation rate distribution was also achieved (Equation (4)) and therefore resulted in the same specific power input of 233 W m−3.
As can be seen in Figure 7, various simulations were performed that are far from the optimum. This is due to the fact that an LHS was performed for the optimization and thus the entire design space described in Table 1 was considered in an SBO. This approach, which has been used by various authors, also has the advantage that several simulations can be performed simultaneously [36,41,42,84,85]. Nevertheless, optimization might be performed with fewer simulations if direct optimization of the geometry were performed instead of using a surrogate model. For this purpose, optimization algorithms such as the genetic algorithm [86,87] or Bayesian optimization [88,89], which adapt the geometry up to a certain convergence criterion, would be suitable.

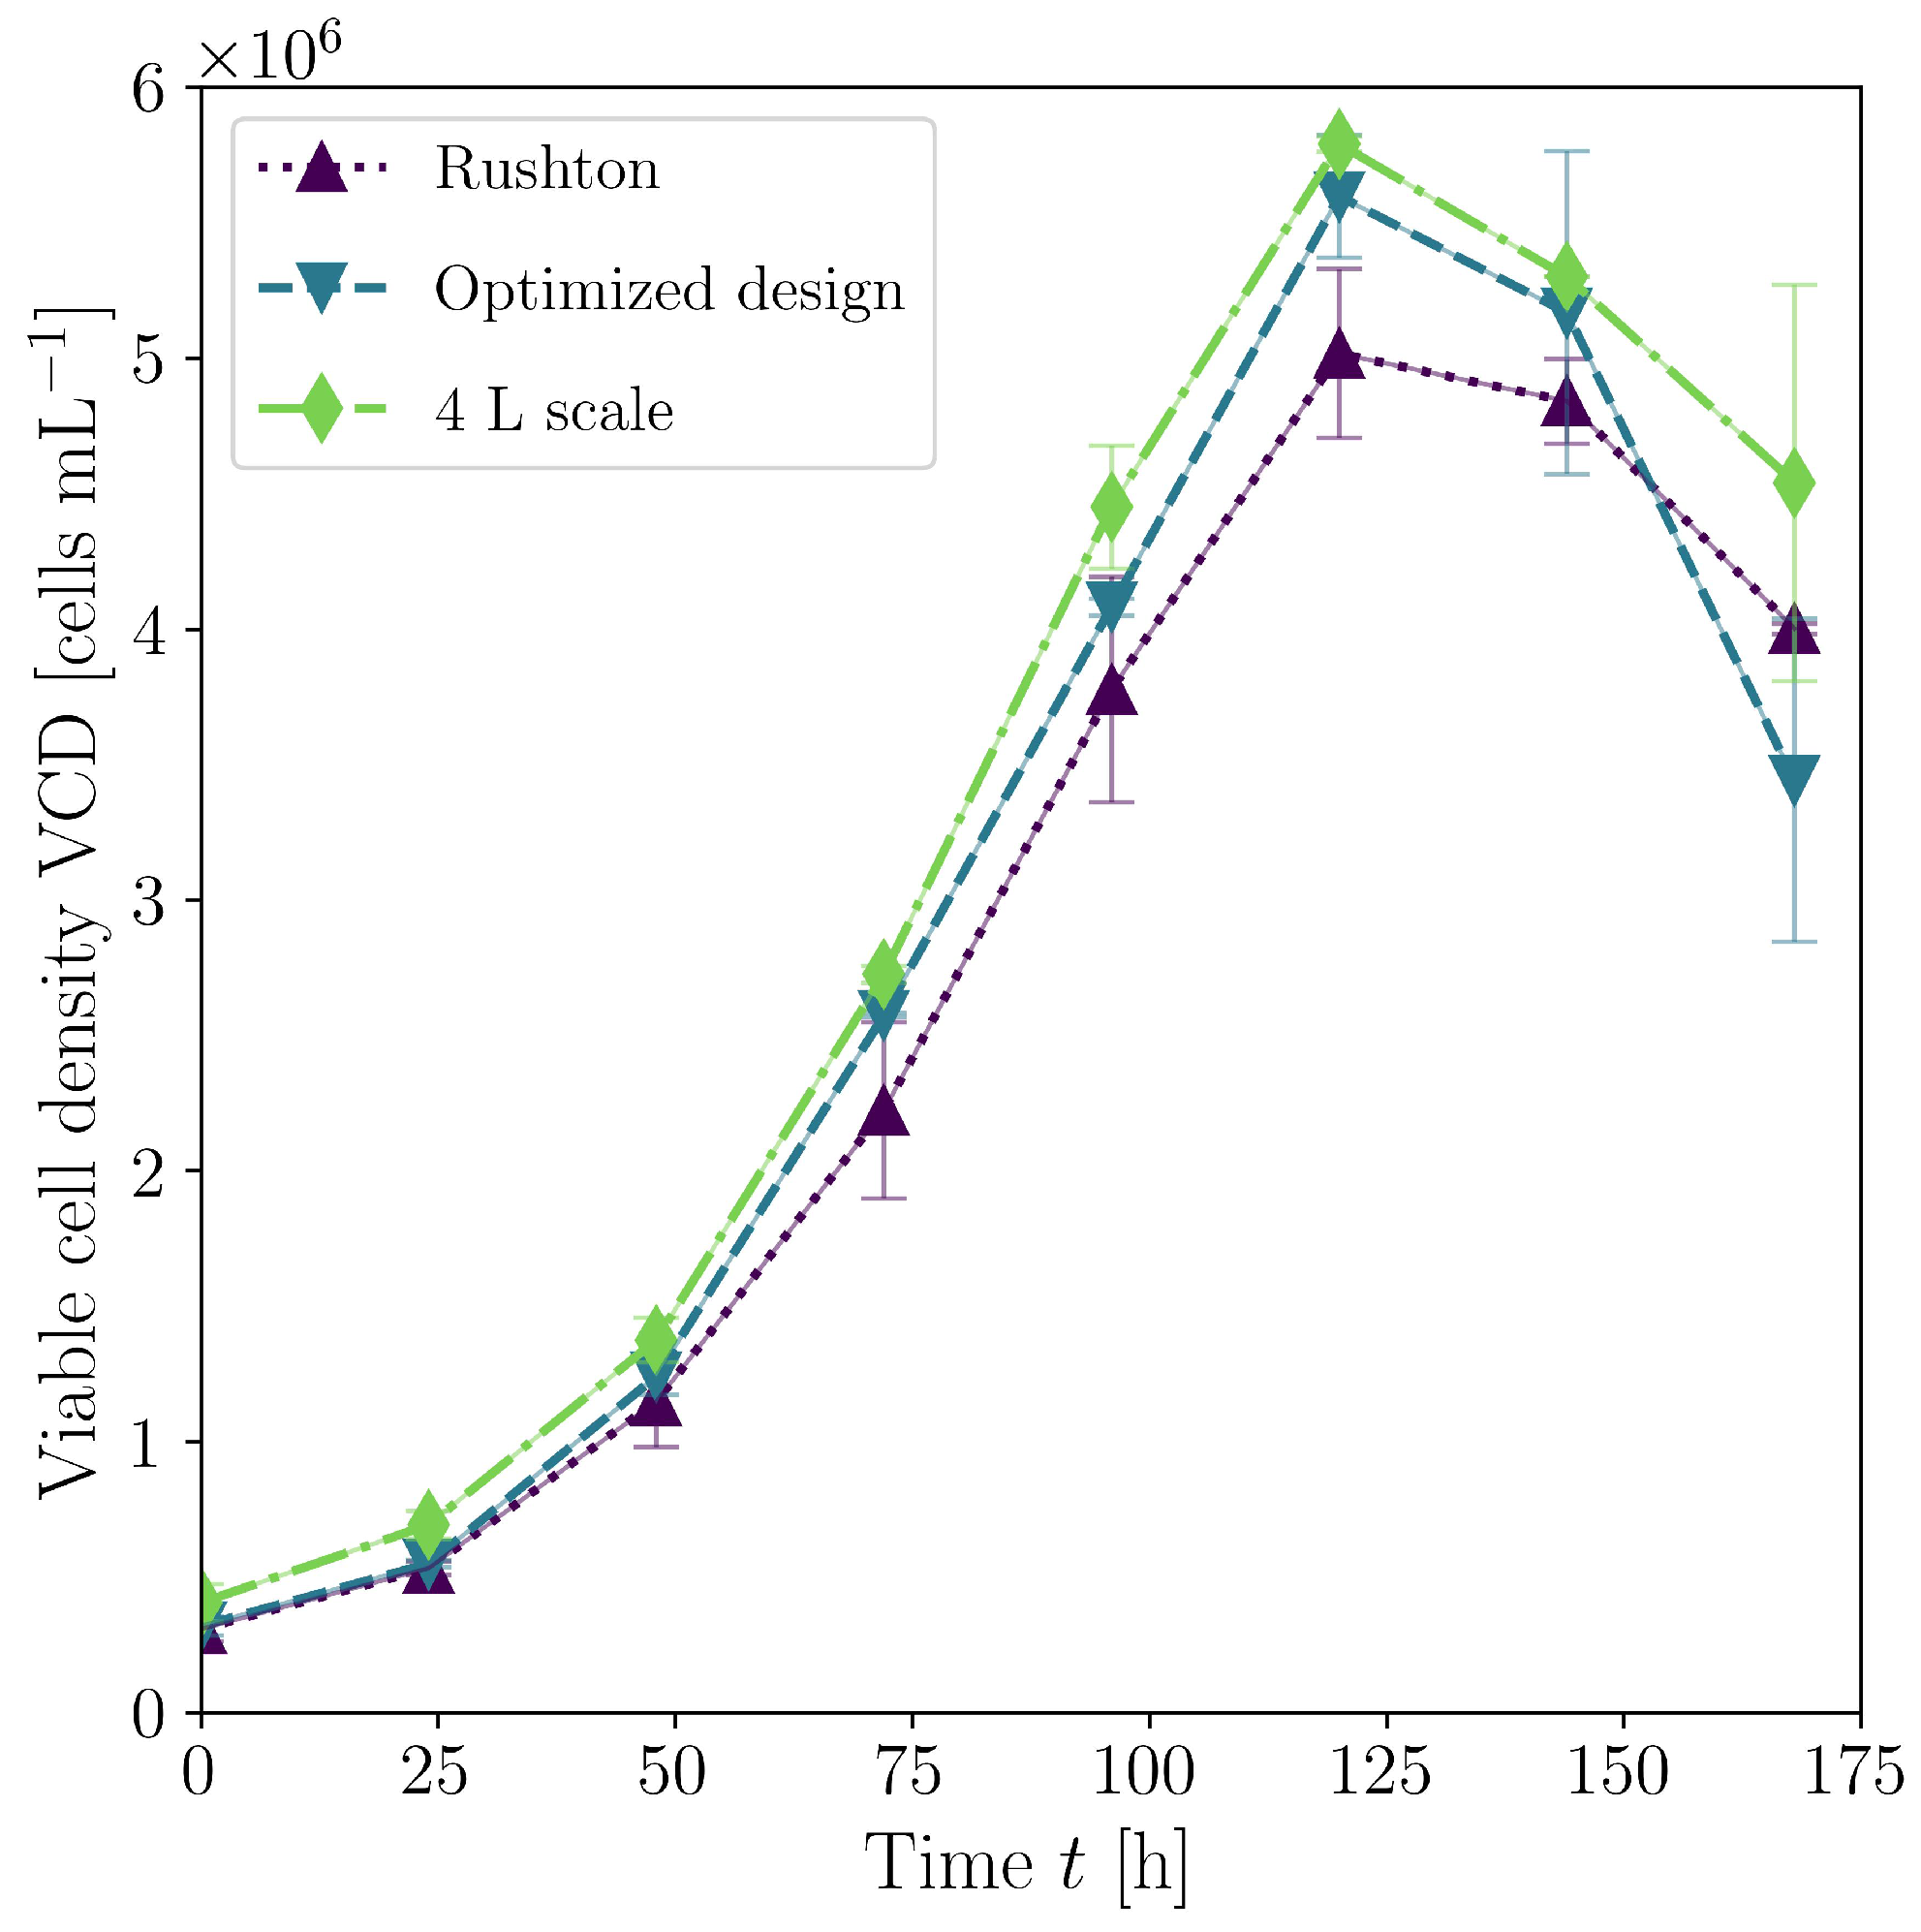
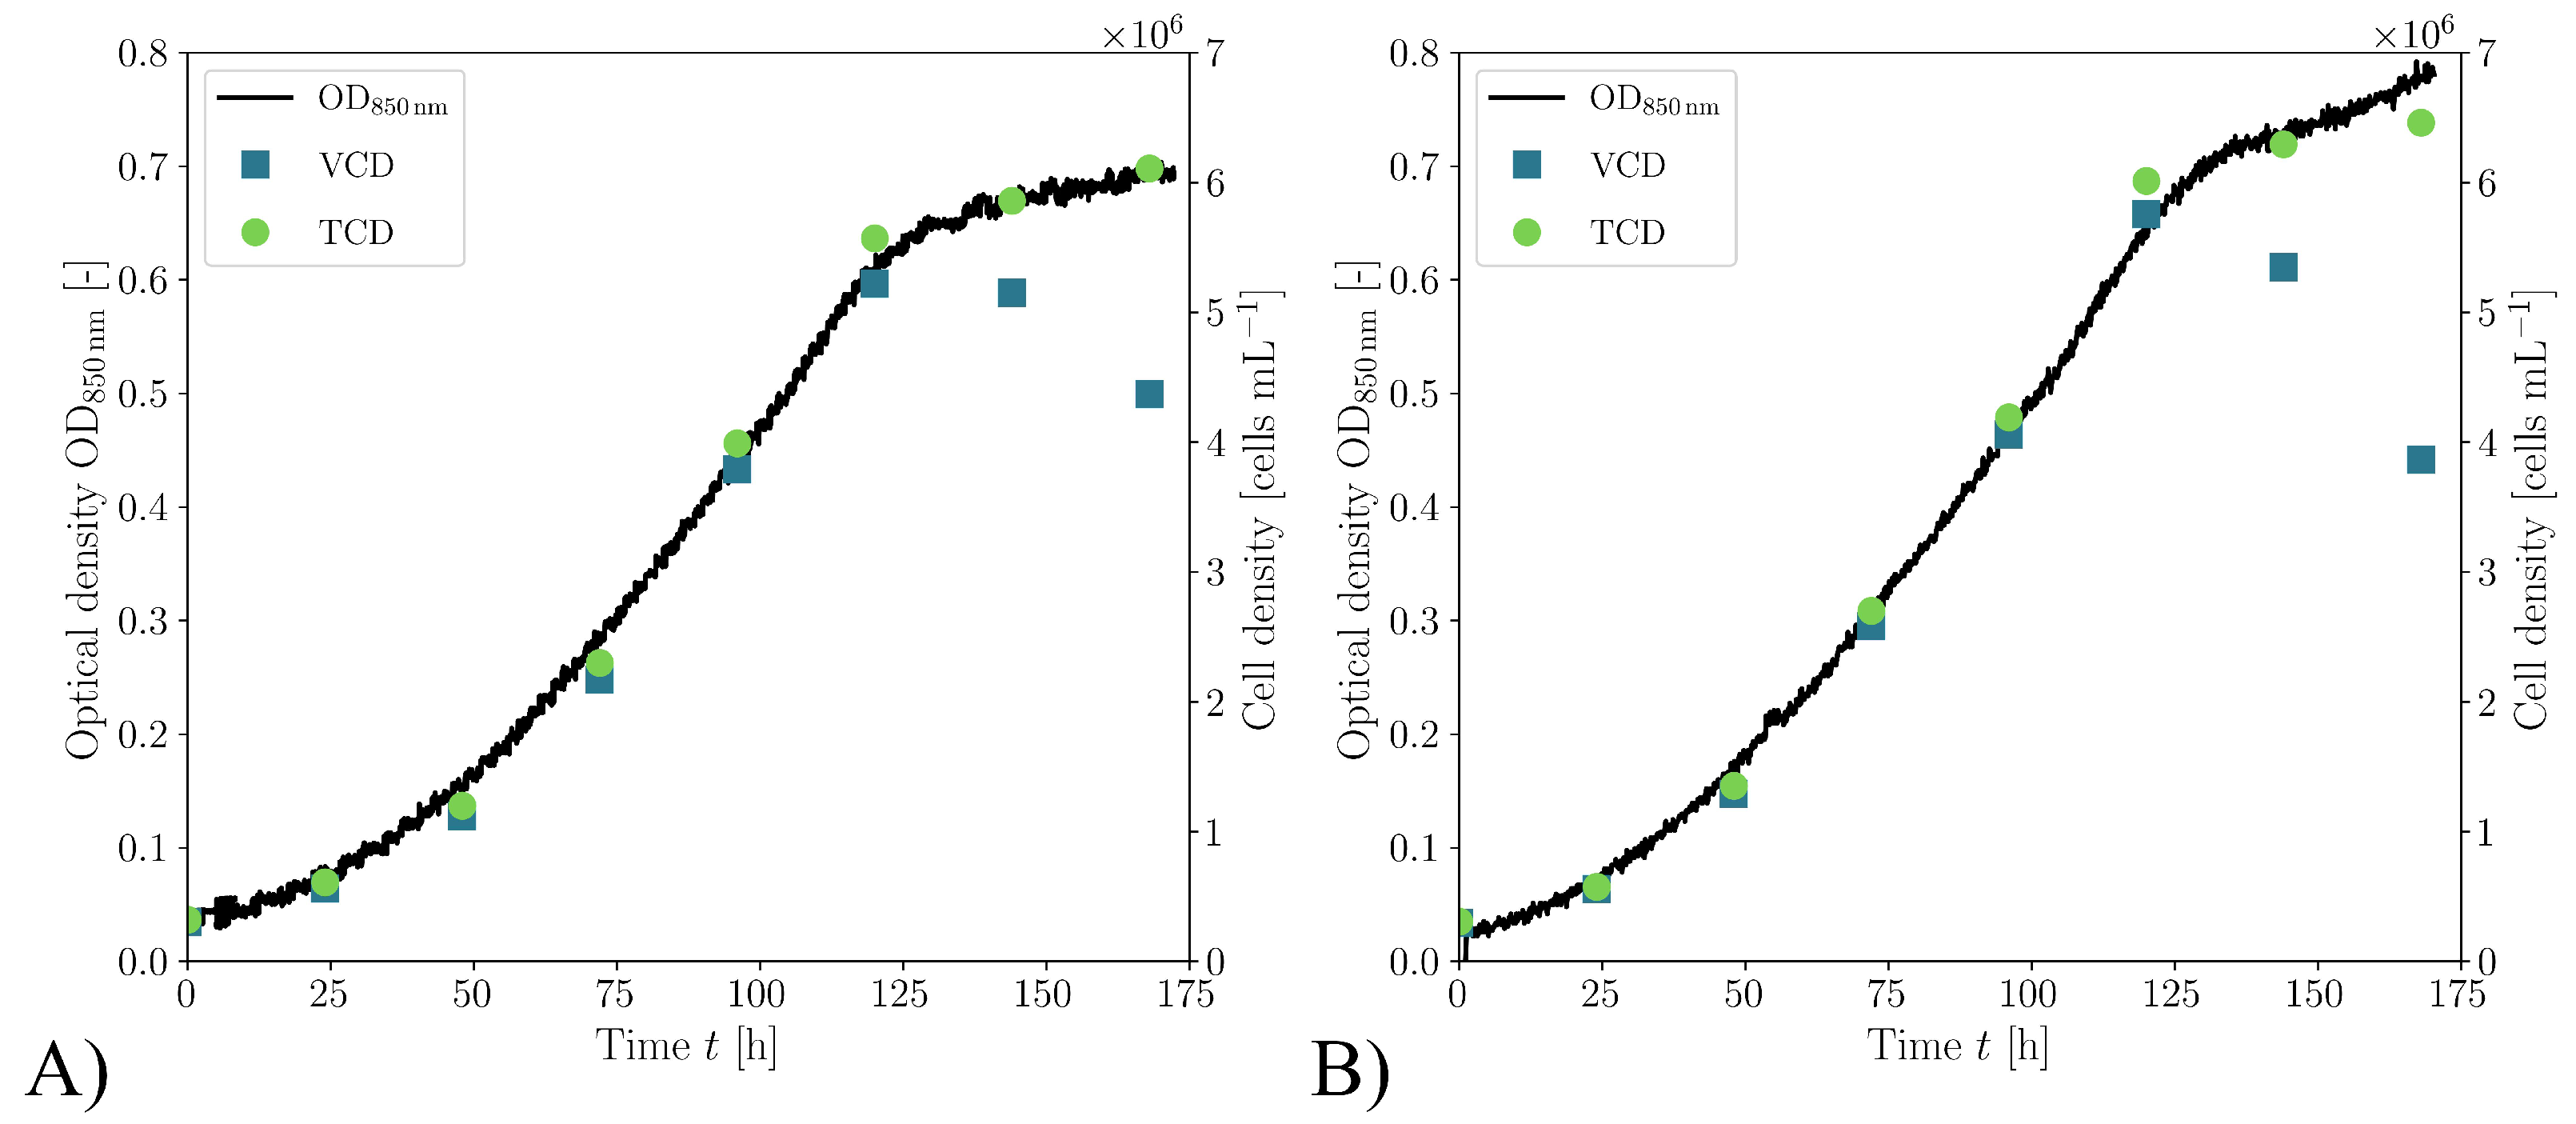
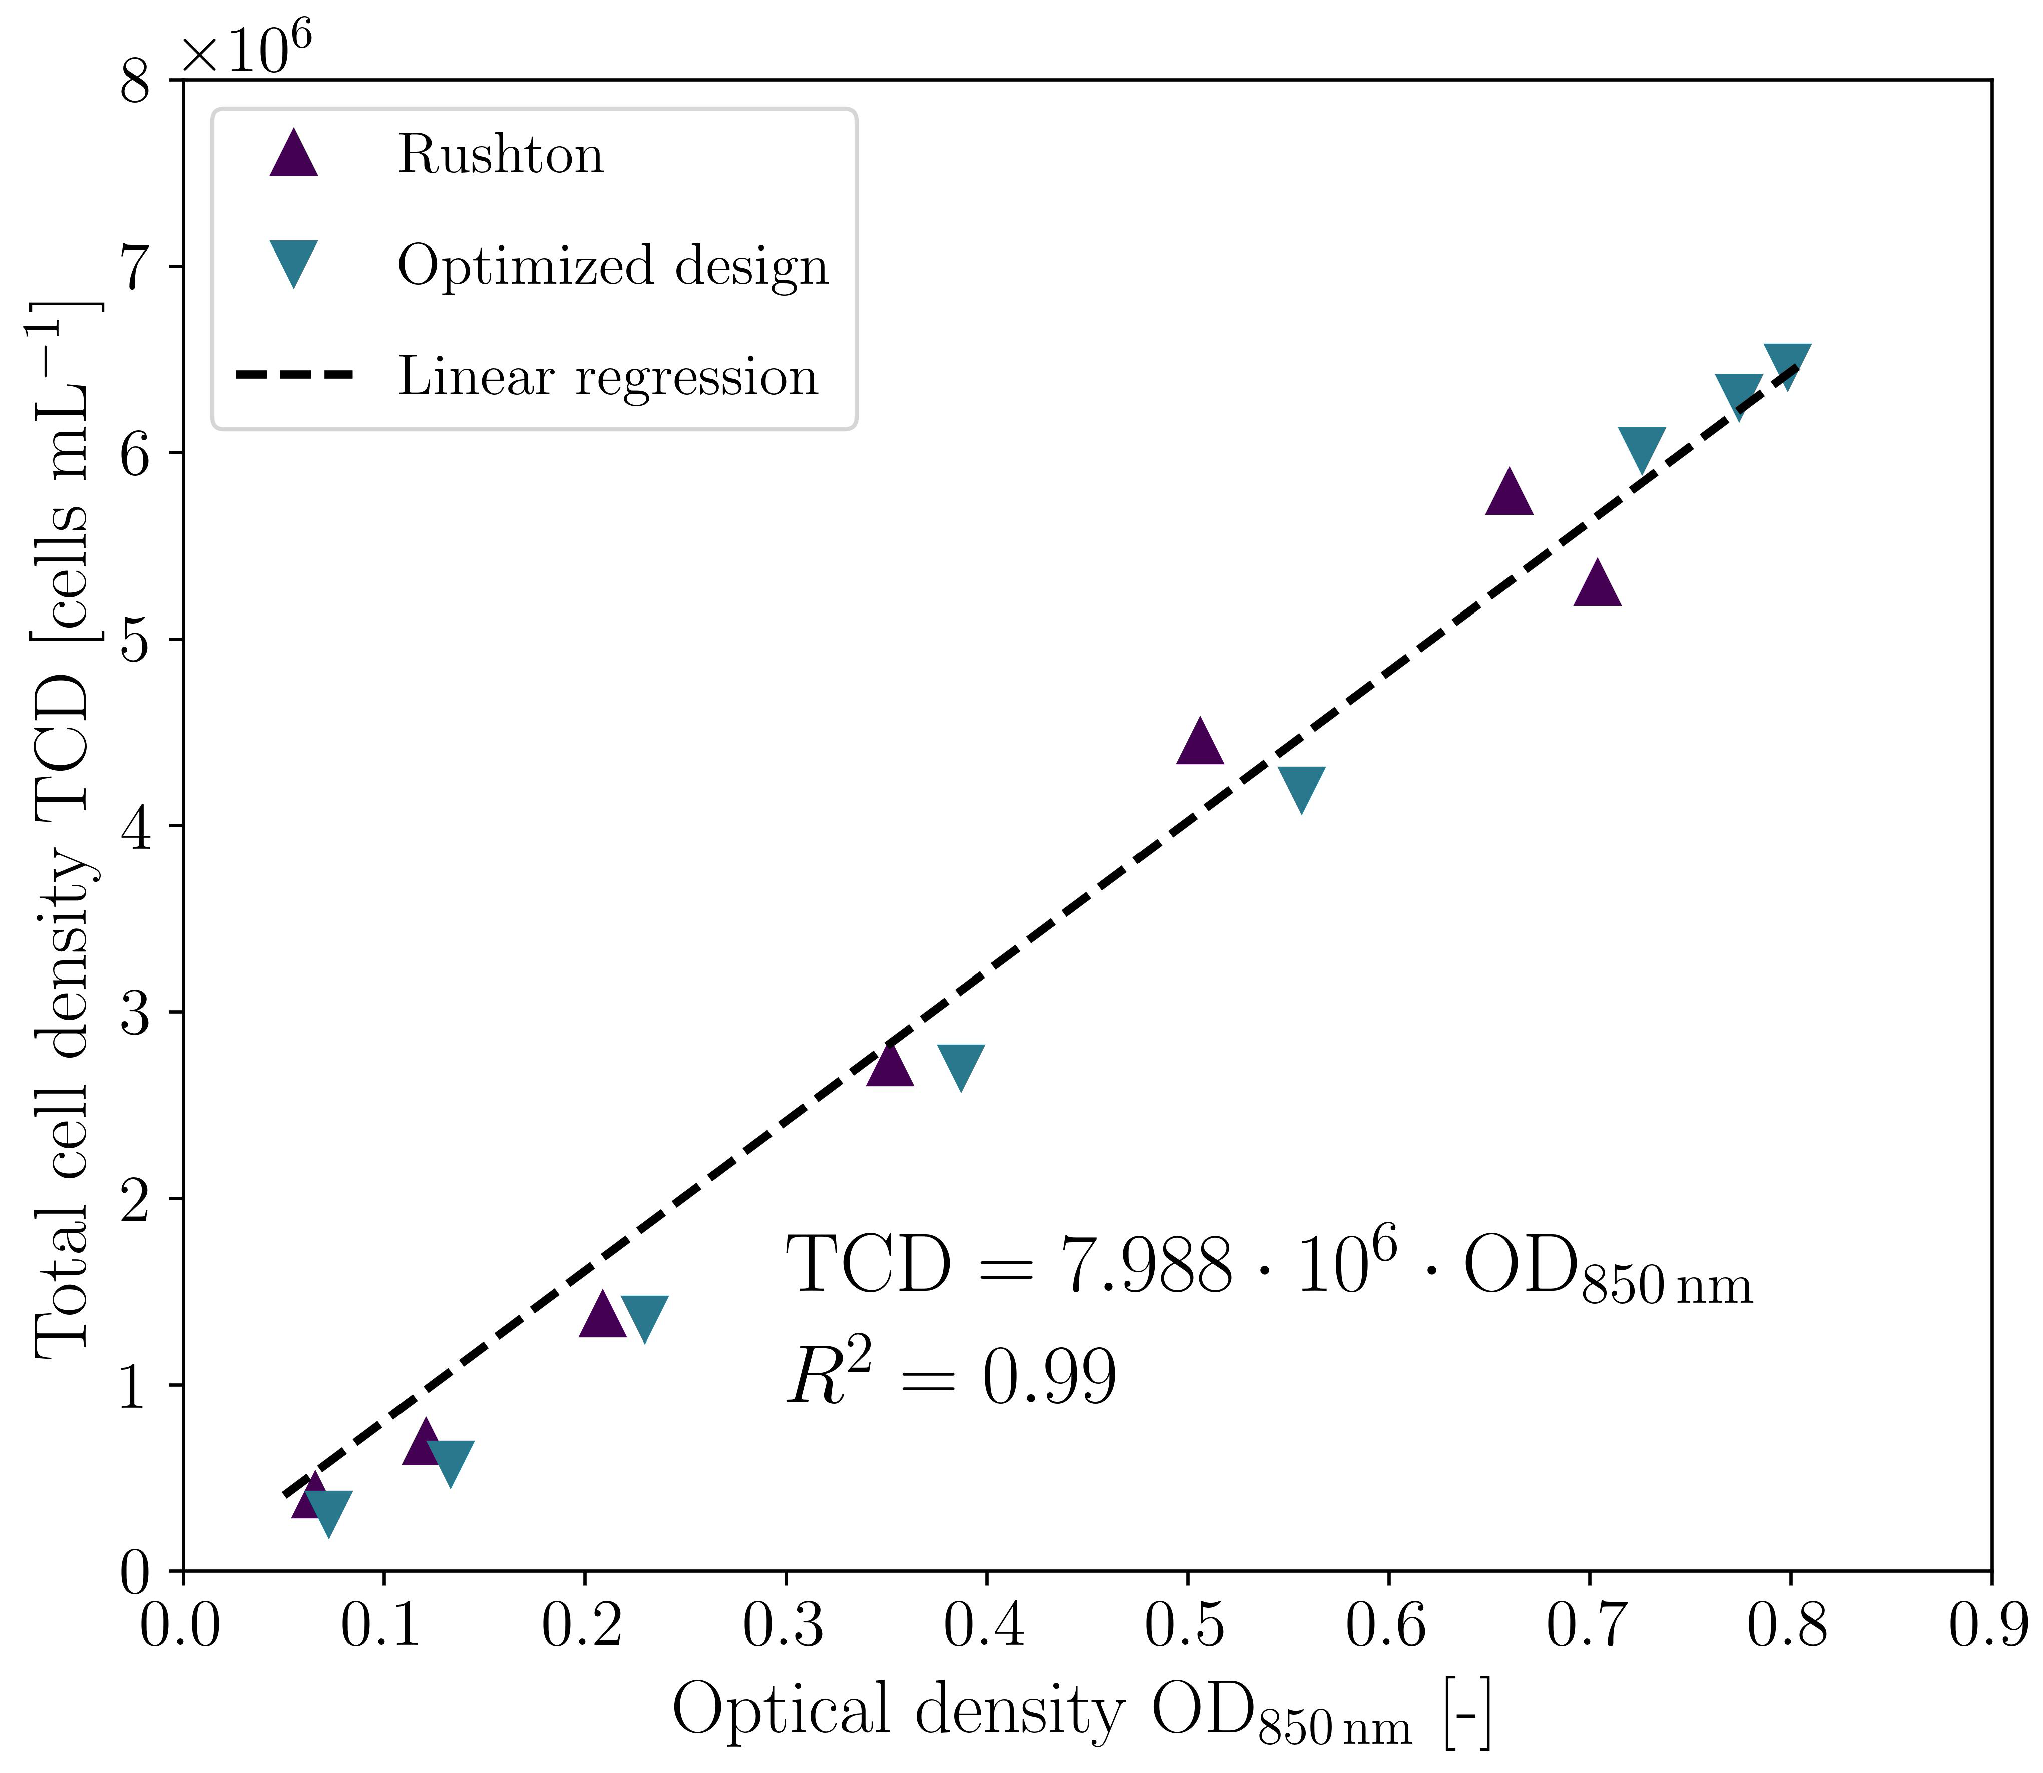
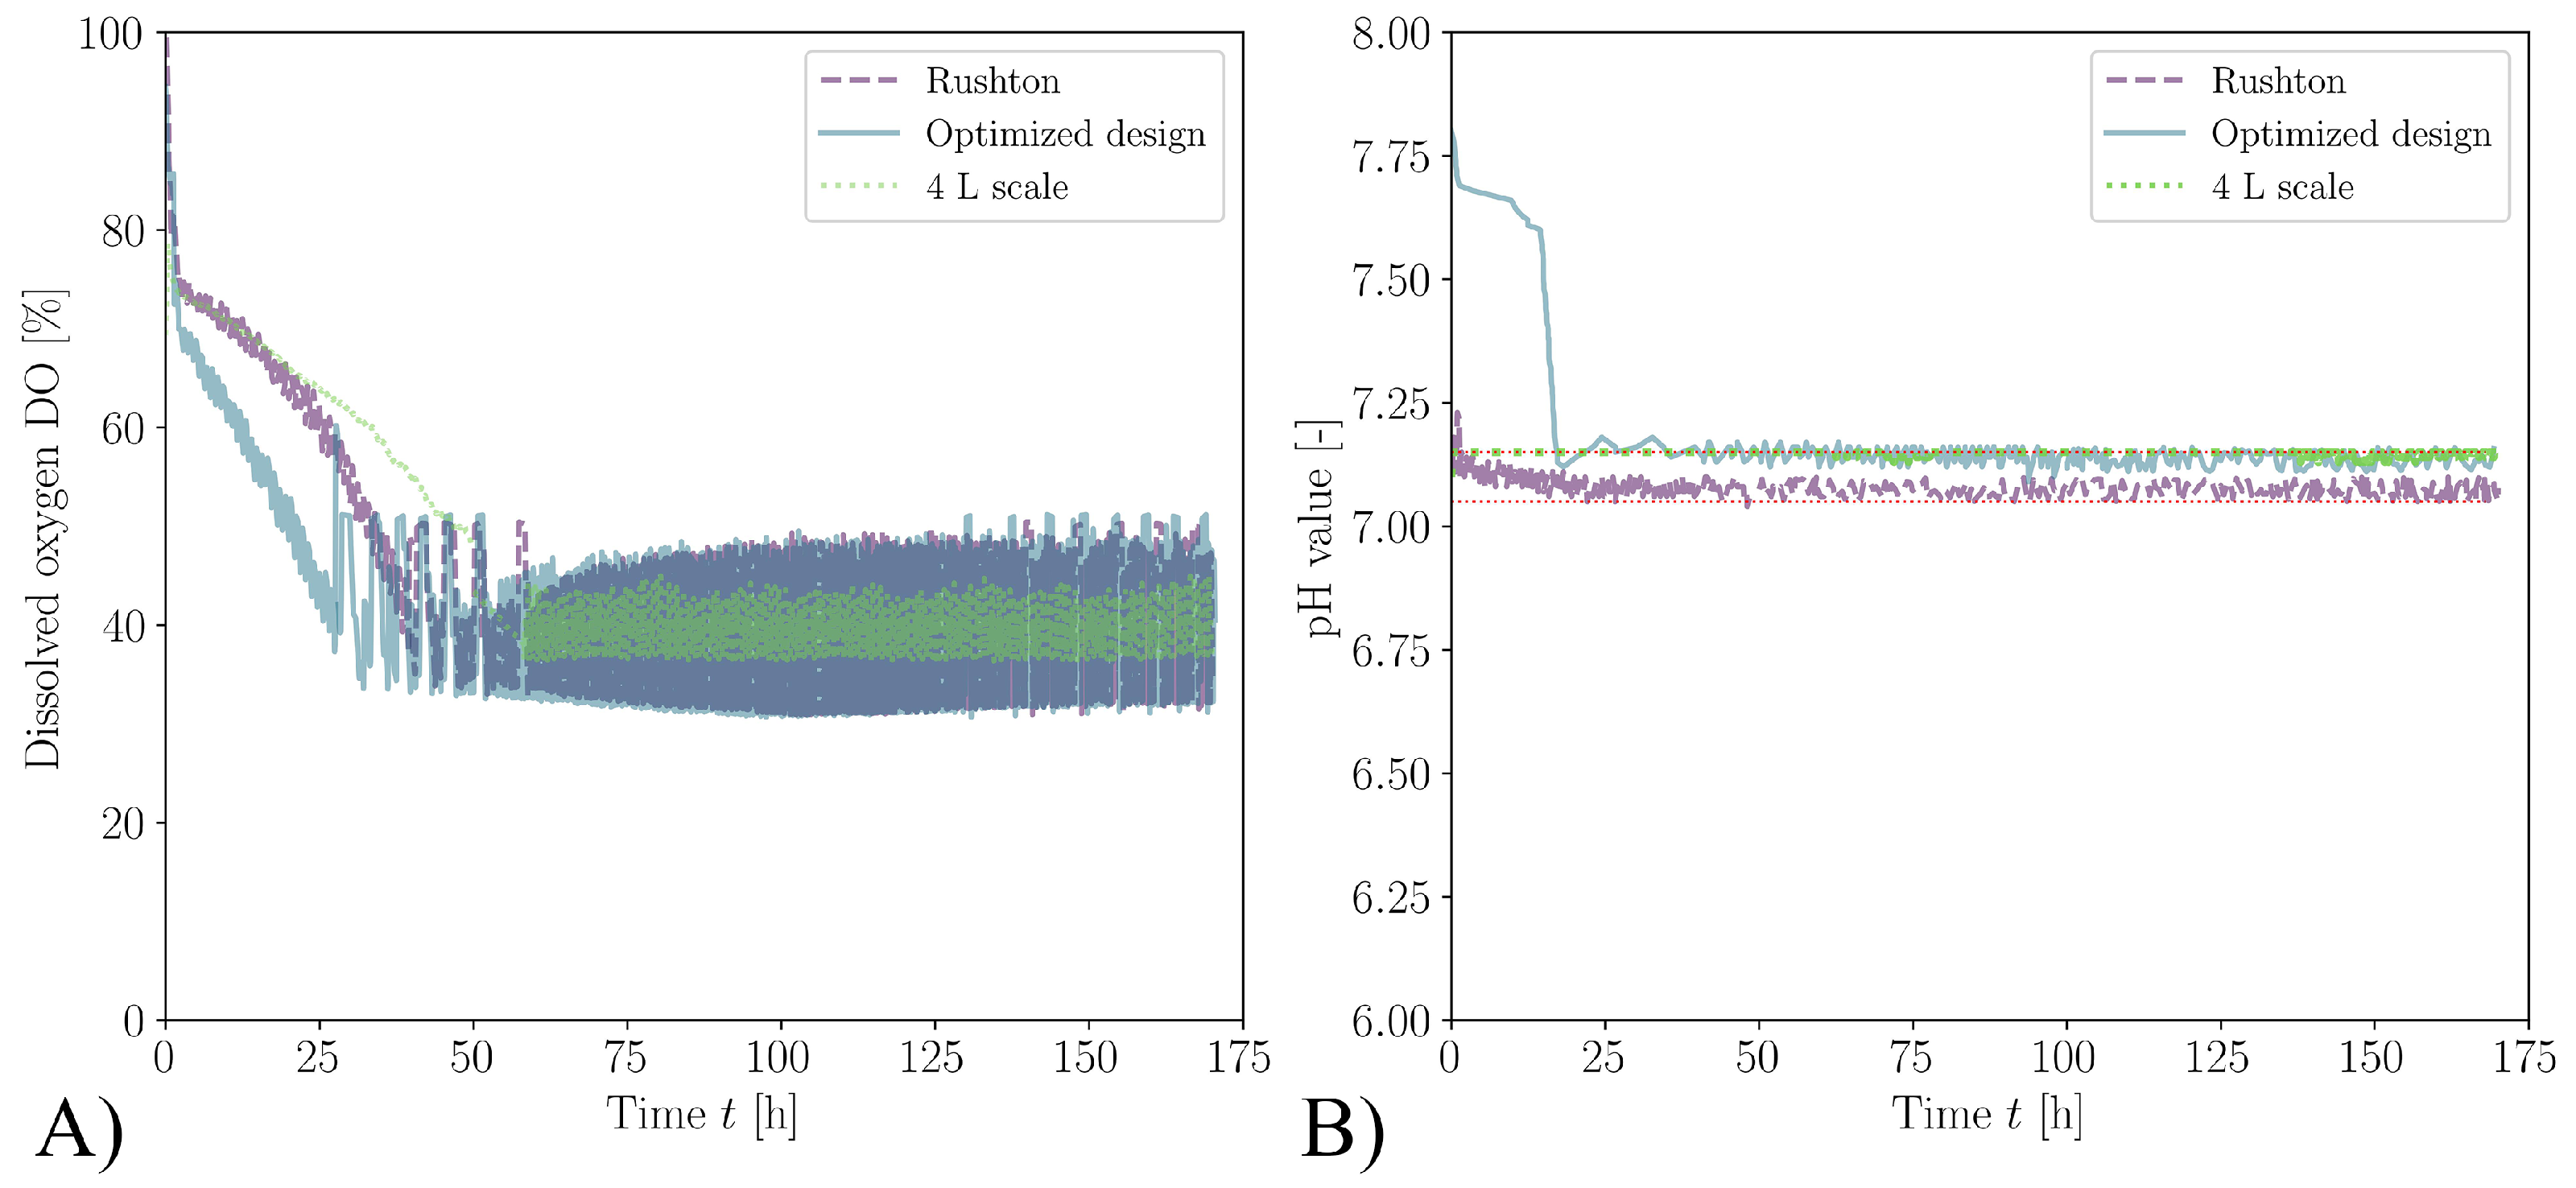
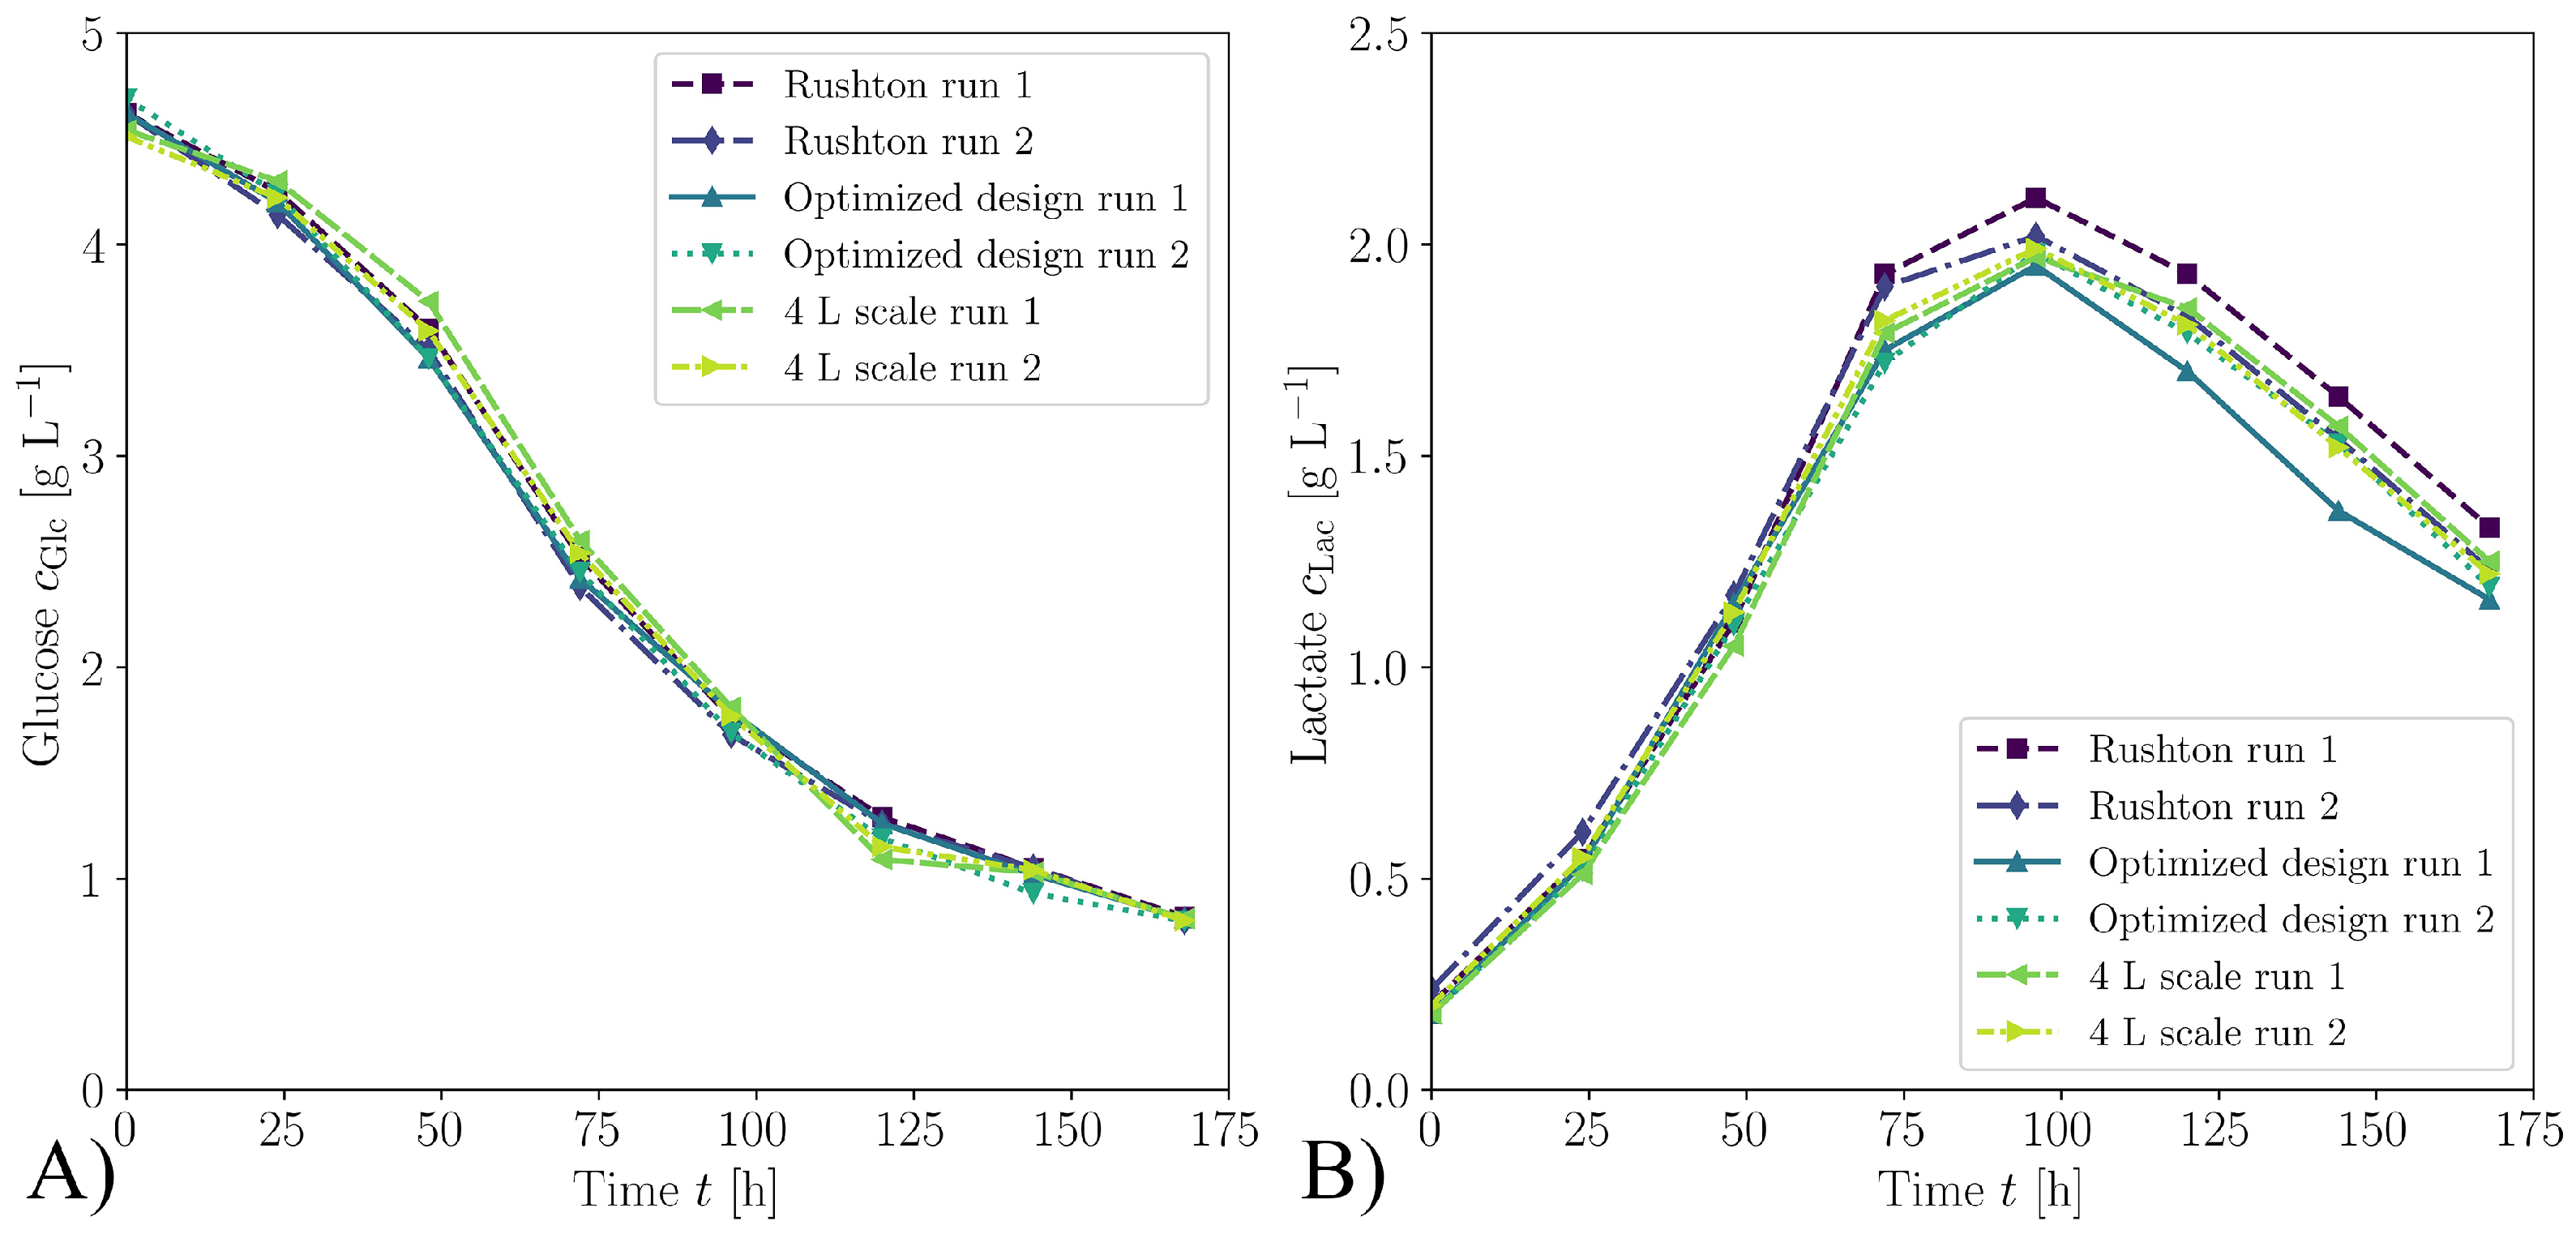
3.2. Biological Verification

The stirrer design optimized in Section 3.1 and the standard configuration were used for the cultivation of HEK FreeStyleTM 293-F suspension cells (Table A2). The batch experiments, which were performed in duplicates, lasted 168 h each, where the maximum VCD was reached after 120 h. In the reference cultivation with Rushton impellers and the same specific power input as at the laboratory scale (Minifors 2), a maximum VCD of 5.02 · 10 6  cells mL−1 was achieved, which is lower compared to the laboratory scale with 5.77 · 10 6  cells mL−1. With the optimized stirrer geometry, however, a VCD max of 5.60 · 10 6  cells mL−1 was achieved, which is comparable to the laboratory scale (Figure 8). At this point, the viability of all cultivations was above 95%. The maximum VCD in all cultivations was slightly higher than the values described in the literature for cultivations in unbaffled shake flasks where values between 4.2 · 10 6  cells mL−1 and 4.6 · 10 6  cells mL−1 were achieved [26,57]. The maximum specific growth rates μ max were achieved for the laboratory scale and for all 30 L D-DCU experiments between the time points of 24 h and 72 h and were μ max , Minifors = 0.0258   h 1 for the laboratory scale, μ max , D - DCU = 0.0248   h 1 for the reference cultivation with the same specific power input and μ max , D - DCU , opt . = 0.0262   h 1 for the bioreactor with optimized stirrer design. All maximum specific growth rates were in the range of 0.020 h 1 to 0.036 h 1 , which is described in the literature [53,54,55,56,57]. The glucose concentration dropped from 4.6 g L−1 to 0.80 g L−1 in all cultivations (Appendix A, Figure A3A). The same glucose concentration drop was described by Maschke et al. [57] for the same cell line and medium in the 250 mL shake flask. As in the laboratory scale, the lactate concentration rose up to the time point t = 96   h and dropped to the end of cultivation (Appendix A, Figure A3B). Slightly higher maximum lactate concentrations (2.11 g L−1) were measured in the reference cultivations with the same specific power input as in the laboratory scale than in the cultivations with optimized stirrer geometry (1.98 g L−1). This increased lactate concentration could be due to the fact that the hydrodynamic stress was too high for the HEK293 cells [62].
In Seidel et al. [26], no statistically significant difference in the measured cell diameter could be observed with different specific power inputs ( 63   W   m 3 to 451   W   m 3 ). The cell diameter in the 4 L system also remained constant over the cultivation period, although the variance in the cell diameter increased slightly over the course of the cultivation. For the reference cultivations in the 30 L system, the cell diameter ((14.49 ± 1.77) μm) was slightly smaller than at laboratory scale ((15.28 ± 2.03) μm) and that of the system with optimized stirrer geometry ((15.17 ± 2.33) μm). Nevertheless, cell diameter in all cultivations was within the typical range described in the literature (14 μm to 16 μm) [58,59,60]. As described in Seidel et al. [26], the aggregate size distribution at the time of maximum VCD strictly follows a geometric distribution with the free parameter p equal to the proportion of non-aggregated cells. The fraction of cells that occur as an aggregate of size n can thus be calculated according to Equation (10). Seidel et al. [26] could further show that Equation (11) applies for shake flasks both with and without baffles, as well as for different operating parameters in the Minfors 2 bioreactor. Using this equation, a value of p = 0.6876 would result in the reference cultivation, which would correspond to 68.76% of non-aggregated cells at the time of maximum VCD ( λ k ¯ = 5.064 · 10 5   m ). As measurements of the two cultivations showed, 68.39% and 69.17%, respectively, were present as non-aggregated cells at this time. The same situation occurs for the cultivations with the optimized stirrer design. Whereas, the mean Kolmogorov length scale of 5.730 · 10 5   m predicts a 65.70% proportion of non-aggregated cells, and 64.64% and 64.22% were measured. The aggregate size distribution also follows the correlation described by Seidel et al. [26] at the pilot scale.
f ( n ) = ( 1 p ) n 1 p , { p | 0 p 1 }
p = 4589 [ m 1 ] · λ k ¯ [ m ] + 0.92
With the help of the OD 850 n m sensor, the growth of cells was monitored online [90,91,92]. As only the turbidity can be measured, no distinction can be made between viable and dead cells. Since there is only a minimal difference between TCD and VCD (viability above 95%) before the maximum VCD is reached at 120 h, the OD signal can be used for process monitoring (Figure 9). As shown in Figure 10, the OD 850 n m signal correlates with the offline measured TCDs for all performed cultivation cycles over the entire measuring range (0.30 · 106 cells mL−1 to 6.46 · 106 cells mL−1).

4. Conclusions and Outlook

In this study, two different scale-up strategies for HEK FreeStyleTM 293-F suspension cells were quantitatively compared. On the one hand, the cultivation parameters proposed in Seidel et al. [26] were utilized to scale-up from a 4 L working volume to a 30 L working volume by keeping the specific power input constant at 233   W   m 3 (in addition to all scale-independent parameters). Even though a system designed for microbial cultivation was used, decent growth was observed, although it was significantly lower than at the laboratory scale (VCD max , D - DCU = 5.02 · 10 6 cells   mL 1 and VCD max , Minifors = 5.77 · 10 6 cells   mL 1 ). On the other hand, a CFD-optimized stirrer design was used for the same D-DCU bioreactor, which showed a similar Kolmogorov length scale distribution as in the small scale. Through the automated optimization of the stirrer, a comparable cultivation could be carried out with respect to the maximum VCD (VCD max , D - DCU , opt . = 5.60 · 10 6 cells   mL 1 and VCD max , Minifors = 5.77 · 10 6 cells   mL 1 ). Thus, it could be shown that in this case, the simple and frequently used scale-up strategy of constant specific power input did not work as well as the use of the same Kolmogorov length scale distribution. Furthermore, these results support the findings of Sandadi et al. [93], Nienow et al. [28] and Nienow [27] that today’s mammalian cell cultures are much less fragile in the applied chemically defined culture media than many authors still assume.
With the method presented here, further, and more complex optimizations for bioreactors can be carried out on an open-source basis. For example, the k L a value could also be modeled using CFD coupled with population balance modeling and utilized as a scale-up criterion in combination with the specific power input, or the EDCF described by Böhm et al. [5]. In addition, it could also be interesting to perform transient simulations to investigate the mixing time as Wu et al. [38] did as a scale-up criterion, since this can be problematic especially for large reactors. Furthermore, not only the stirrer geometry but also the addition of a tracer can be optimized, which is also a challenge when scaling up bioreactors. Another possible application of the approach demonstrated in this publication is to create scale-down bioreactors with similar Kolmogorov length scale distributions by adjusting the laboratory scale stirrer designs to given large-scale bioreactor geometries. This would allow the cost-efficient bioprocess optimization at laboratory scale without changing the large-scale bioreactor design, which is not easily possible with single-use bioreactors or validated systems, for example.

Author Contributions

Conceptualization, S.S.; methodology, S.S., R.W.M. and F.M.; software, S.S.; validation, S.S.; formal analysis, R.W.M.; investigation, S.S. and F.M.; writing—original draft preparation, S.S., R.W.M. and F.M.; writing—review and editing, R.E.-S., D.E. and M.K.; visualization, S.S.; supervision, R.E.-S., D.E. and M.K.; project administration, S.S.; All authors have read and agreed to the published version of the manuscript.

Funding

The APC was funded by ZHAW Zurich University of Applied Sciences.

Data Availability Statement

Acknowledgments

We would like to thank Sandra Jäggi and Dimitria Alder (Emergent BioSolutions) for providing the cultivation medium, Timo Hanselmann (Exner Process Equipment GmbH) for providing the EXcell 231 sensor, Cedric Schirmer for assisting with the cultivations, Lia Rossi for the valuable input and Jakab Kaufmann for proofreading.

Conflicts of Interest

The authors declare no conflict of interest.

Abbreviations

The following abbreviations are used in this manuscript:
APIApplication Programming Interface
CDFCumulative Distribution Function
CFDComputational Fluid Dynamics
CHOChinese Hamster Ovary
DACEDesign and Analysis of Computer Experiments
DAKOTADesign Analysis Kit for Optimisation and Terascale Applications
FDAFood and Drug Administration
HEKHuman Embryonic Kidney
HPCHigh Performance Computing
KSKolmogorov–Smirnov
LHSLatin Hypercube Sampling
MRFMultiple Reference Frame
NIRNear-Infrared
PAPolyamide
PIVParticle Image Velocimetry
PLICPiece-wise Linear Interface Calculation
RANSReynolds-Averaged Navier–Stokes
SBOSurrogate-Based Optimization
SIMPLESemi-Implicit Method for Pressure-Linked Equations
SLSSelective Laser Sinter
SSTShear Stress Transport
USPUnited States Pharmacopeia

Nomenclature

The following nomenclature is used in this article:
Latin symbols
a i Model constant[-]
c C O 2 Concentration of CO 2 in the shaking incubator[%]
c Glc Glucose concentration[g L−1]
c Lac Lactate concentration[g L−1]
DTest statistic of the Kolmogorov–Smirnov test[-]
d 0 Shaking amplitude[mm]
d s Stirrer diameter[mm]
DODissolved oxygen concentration[%]
EDCFEnergy Dissipation Circulation Function[W m−3 s−1]
F ( ) Cumulative distribution[-]
f ( ) Geometric function[-]
F s Safety factor[-]
GCIGrid convergence index[%]
HStirrer height[m]
H 0 Null hypothesis[-]
kTurbulent kinetic energy[m2 s−2]
k L a Volumetric oxygen mass transfer coefficient[h−1]
MMoment/Torque[N m]
NShaking/Stirring speed[rpm]
n c Number of mesh cells[-]
OD 850 n m Optical density at 850 n m [-]
PPower[W]
pFree parameter of the geometric distribution[-]
p ^ a Observed order of accuracy[-]
p p Pressure[Pa]
P / V Specific power input[W m−3]
rMesh refinement factor[-]
R 2 Coefficient of determination[-]
ReReynolds number[-]
R H Relative humidity[%]
S i j Reynolds stress tensor[N m−2]
TTemperature[K]
tTime[s]
t c Circulation time[s]
TCDTotal cell density[cells mL−1]
VVolume[m3]
V l Impeller swept volume[m3]
v Velocity[m s−1]
v g Superficial gas velocity[m s−1]
v tip Tip speed[m s−1]
VCDViable cell density[cells mL−1]
VCD max Maximum viable cell density[cells mL−1]
Greek symbols
α 1 Blade angle[]
α 2 Pitch angle[]
ε Energy dissipation rate[m2 s−3]
ε ¯ Volume-averaged energy dissipation rate[m2 s−3]
ε max Maximum energy dissipation rate[m2 s−3]
ε m n Relative error[%]
Θ M Mixing time[s]
λ k Kolmogorov length scale[m]
λ ¯ k Volume-averaged Kolmogorov length scale[m]
ν Kinematic viscosity[m2 s−1]
ν eff Effective viscosity[m2 s−1]
ν T Turbulent eddy viscosity[m2 s−1]
ρ Density[kg m−3]
Φ Hydrodynamic heterogeneity[-]
ω Specific dissipation rate[s−1]

Appendix A

Figure A1. Velocity profile of all 100 optimization runs.
Processes 11 02703 g0a1
Table A1. Overview of the investigated meshes for the GCI analysis (Table 2).
MeshNumber of Cells [-]Min. Cell Volume [m3]Max. Cell Volume [m3]Max. Skewness [-] P / V [W m−3]
M1 1.67 · 10 6 6.32 · 10 12 1.09 · 10 6 3.91 1243.72
M2 2.12 · 10 6 5.15 · 10 12 5.54 · 10 7 3.74 1248.49
M3 3.02 · 10 6 1.34 · 10 12 2.73 · 10 7 3.70 1253.98
M4 4.88 · 10 6 6.71 · 10 13 7.25 · 10 8 3.86 1259.90
Table A2. Comparison of the process parameters for the benchtop scale bioreactor (Minifors 2), the reference cultivation (D-DCU, same P / V ) and the optimized scale-up approach (D-DCU, similar F ( λ k ) ).
ParameterMinifors 2D-DCU ReferenceD-DCU Optimized
V4 L30 L30 L
Stirrer type3-blade segment3x Rushton3-blade segment
d s 85 mm105 mm160 mm
N275 rpm213 rpm67 rpm
v tip 1.22   m   s 1 1.17   m   s 1 0.56   m   s 1
P / V 233 W m−3233 W m−3233 W m−3
Same F ( λ k ) as in the Minifors 2NoYes
DO set point40%40%40%
pH set point 7.1 7.1 7.1
Figure A2. Online measured process data. (A) Dissolved oxygen concentration and (B) pH value. The dead band for pH control is shown in red.
Processes 11 02703 g0a2
Figure A3. Offline data of the performed cultivations measured with the CedexBio analyzer. (A) Glucose concentration during cultivation and (B) the corresponding lactate concentration.
Processes 11 02703 g0a3

References

  1. Walsh, G.; Walsh, E. Biopharmaceutical benchmarks 2022. Nat. Biotechnol. 2022, 40, 1722–1760. [Google Scholar] [CrossRef]
  2. Oosterhuis, N.M.; Junne, S. Design, Applications, and Development of Single-Use Bioreactors. In Bioreactors, 1st ed.; Mandenius, C.F., Ed.; Wiley-VCH Verlag GmbH & Co. KGaA: Weinheim, Germany, 2016; pp. 261–294. [Google Scholar] [CrossRef]
  3. Shanley, A. Scaling Up Novel Therapies. Biopharm Int. 2018, 31, 14–16. [Google Scholar]
  4. Kaiser, S.C.; Löffelholz, C.; Werner, S.; Eibl, D. CFD for Characterizing Standard and Single-use Stirred Cell Culture Bioreactors. In Computational Fluid Dynamics Technologies and Applications; Minin, I.V., Minin, O.V., Eds.; IntechOpen: London, UK, 2011. [Google Scholar] [CrossRef]
  5. Böhm, L.; Hohl, L.; Bliatsiou, C.; Kraume, M. Multiphase Stirred Tank Bioreactors—New Geometrical Concepts and Scale-up Approaches. Chem. Ing. Tech. 2019, 91, 1724–1746. [Google Scholar] [CrossRef]
  6. Xing, Z.; Kenty, B.M.; Li, Z.J.; Lee, S.S. Scale-up analysis for a CHO cell culture process in large-scale bioreactors. Biotechnol. Bioeng. 2009, 103, 733–746. [Google Scholar] [CrossRef] [PubMed]
  7. Karimi Alavijeh, M.; Baker, I.; Lee, Y.Y.; Gras, S.L. Digitally enabled approaches for the scale up of mammalian cell bioreactors. Digit. Chem. Eng. 2022, 4, 100040. [Google Scholar] [CrossRef]
  8. Neubauer, P.; Junne, S. Scale-Up and Scale-Down Methodologies for Bioreactors. In Bioreactors; Wiley-VCH Verlag GmbH & Co. KGaA: Weinheim, Germany, 2016; pp. 323–354. [Google Scholar] [CrossRef]
  9. Platas Barradas, O.; Jandt, U.; Minh Phan, L.D.; Villanueva, M.E.; Schaletzky, M.; Rath, A.; Freund, S.; Reichl, U.; Skerhutt, E.; Scholz, S.; et al. Evaluation of criteria for bioreactor comparison and operation standardization for mammalian cell culture. Eng. Life Sci. 2012, 12, 518–528. [Google Scholar] [CrossRef]
  10. Löffelholz, C.; Kaiser, S.C.; Kraume, M.; Eibl, R.; Eibl, D. Dynamic Single-Use Bioreactors Used in Modern Liter- and m3-Scale Biotechnological Processes: Engineering Characteristics and Scaling Up. In Disposable Bioreactors II; Eibl, D., Eibl, R., Eds.; Springer: Berlin/Heidelberg, Germany, 2013; pp. 1–44. [Google Scholar] [CrossRef]
  11. Junker, B.H. Scale-up methodologies for Escherichia coli and yeast fermentation processes. J. Biosci. Bioeng. 2004, 97, 347–364. [Google Scholar] [CrossRef] [PubMed]
  12. McConville, F.X.; Kessler, S.B. Scale-Up of Mixing Processes: A Primer. In Chemical Engineering in the Pharmaceutical Industry; Wiley: Hoboken, NJ, USA, 2010; pp. 249–267. [Google Scholar] [CrossRef]
  13. Baert, J.; Delepierre, A.; Telek, S.; Fickers, P.; Toye, D.; Delamotte, A.; Lara, A.R.; Jaén, K.E.; Gosset, G.; Jensen, P.R.; et al. Microbial population heterogeneity versus bioreactor heterogeneity: Evaluation of Redox Sensor Green as an exogenous metabolic biosensor. Eng. Life Sci. 2016, 16, 643–651. [Google Scholar] [CrossRef]
  14. Haringa, C. An analysis of organism lifelines in an industrial bioreactor using Lattice-Boltzmann CFD. Eng. Life Sci. 2022, 23, e2100159. [Google Scholar] [CrossRef]
  15. Villiger, T.K.; Neunstoecklin, B.; Karst, D.J.; Lucas, E.; Stettler, M.; Broly, H.; Morbidelli, M.; Soos, M. Experimental and CFD physical characterization of animal cell bioreactors: From micro- to production scale. Biochem. Eng. J. 2018, 131, 84–94. [Google Scholar] [CrossRef]
  16. Li, C.; Teng, X.; Peng, H.; Yi, X.; Zhuang, Y.; Zhang, S.; Xia, J. Novel scale-up strategy based on three-dimensional shear space for animal cell culture. Chem. Eng. Sci. 2020, 212, 115329. [Google Scholar] [CrossRef]
  17. Jüsten, P.; Paul, G.C.; Nienow, A.W.; Thomas, C.R. Dependence of mycelial morphology on impeller type and agitation intensity. Biotechnol. Bioeng. 1996, 52, 672–684. [Google Scholar] [CrossRef]
  18. Esperança, M.N.; Buffo, M.M.; Mendes, C.E.; Rodriguez, G.Y.; Béttega, R.; Badino, A.C.; Cerri, M.O. Linking maximal shear rate and energy dissipation/circulation function in airlift bioreactors. Biochem. Eng. J. 2022, 178, 108308. [Google Scholar] [CrossRef]
  19. Bauer, I.; Dreher, T.; Eibl, D.; Glöckler, R.; Husemann, U.; John, G.T.; Kaiser, S.C.; Kampeis, P.; Kauling, J.; Kleebank, S.; et al. Recommendations for Process Engineering Characterisation of Single-Use Bioreactors and Mixing Systems by Using Experimental Methods, 2nd ed.; Gesellschaft für Chemische Technik und Biotechnologie e.V.: Frankfurt am Main, Germany, 2020. [Google Scholar]
  20. Seidel, S.; Schirmer, C.; Maschke, R.W.; Rossi, L.; Eibl, R.; Eibl, D. Computational Fluid Dynamics for Advanced Characterisation of Bioreactors Used in the Biopharmaceutical Industry: Part I: Literature Review. In Computational Fluid Dynamics-Recent Advances, New Perspectives and Applications; IntechOpen: London, UK, 2023. [Google Scholar] [CrossRef]
  21. Nienow, A.W.; Hewitt, C.J.; Heathman, T.R.; Glyn, V.A.; Fonte, G.N.; Hanga, M.P.; Coopman, K.; Rafiq, Q.A. Agitation conditions for the culture and detachment of hMSCs from microcarriers in multiple bioreactor platforms. Biochem. Eng. J. 2016, 108, 24–29. [Google Scholar] [CrossRef]
  22. Zhou, G.; Kresta, S.M. Impact of tank geometry on the maximum turbulence energy dissipation rate for impellers. AIChE J. 1996, 42, 2476–2490. [Google Scholar] [CrossRef]
  23. Seidel, S.; Maschke, R.W.; Kraume, M.; Eibl-Schindler, R.; Eibl, D. CFD Modelling of a wave-mixed bioreactor with complex geometry and two degrees of freedom motion. Front. Chem. Eng. 2022, 4, 1021416. [Google Scholar] [CrossRef]
  24. Freiberger, F.; Budde, J.; Ateş, E.; Schlüter, M.; Pörtner, R.; Möller, J. New Insights from Locally Resolved Hydrodynamics in Stirred Cell Culture Reactors. Processes 2022, 10, 107. [Google Scholar] [CrossRef]
  25. Johnson, C.; Natarajan, V.; Antoniou, C. Verification of energy dissipation rate scalability in pilot and production scale bioreactors using computational fluid dynamics. Biotechnol. Prog. 2014, 30, 760–764. [Google Scholar] [CrossRef]
  26. Seidel, S.; Maschke, R.W.; Mozaffari, F.; Eibl, R.; Eibl, D. Improvement of HEK293 cell growth by adapting hydrodynamic stress and predicting cell aggregate size distribution. Bioengineering 2023, 10, 478. [Google Scholar] [CrossRef]
  27. Nienow, A.W. Reactor Engineering in Large Scale Animal Cell Culture. Cytotechnology 2006, 50, 9–33. [Google Scholar] [CrossRef]
  28. Nienow, A.W.; Scott, W.H.; Hewitt, C.J.; Thomas, C.R.; Lewis, G.; Amanullah, A.; Kiss, R.; Meier, S.J. Scale-down studies for assessing the impact of different stress parameters on growth and product quality during animal cell culture. Chem. Eng. Res. Des. 2013, 91, 2265–2274. [Google Scholar] [CrossRef]
  29. Wang, K.; Han, Z.H.; Zhang, K.S.; Song, W.P. An efficient geometric constraint handling method for surrogate-based aerodynamic shape optimization. Eng. Appl. Comput. Fluid Mech. 2023, 17, e2153173. [Google Scholar] [CrossRef]
  30. Yu, Y.; Lyu, Z.; Xu, Z.; Martins, J.R. On the influence of optimization algorithm and initial design on wing aerodynamic shape optimization. Aerosp. Sci. Technol. 2018, 75, 183–199. [Google Scholar] [CrossRef]
  31. Hoang Quan, N.N.; Lam, P.V.; Long, L.V. Wind Turbine Blade Design Optimization using OpenFOAM and DAKOTA software. Transp. Res. Procedia 2021, 56, 71–78. [Google Scholar] [CrossRef]
  32. Cruz, L.E.B.; Carmo, B.S. Wind farm layout optimization based on CFD simulations. J. Braz. Soc. Mech. Sci. Eng. 2020, 42, 433. [Google Scholar] [CrossRef]
  33. Guerrero, J.; Mantelli, L.; Naqvi, S.B. Cloud-Based CAD Parametrization for Design Space Exploration and Design Optimization in Numerical Simulations. Fluids 2020, 5, 36. [Google Scholar] [CrossRef]
  34. De Donno, R.; Ghidoni, A.; Noventa, G.; Rebay, S. Shape optimization of the ERCOFTAC centrifugal pump impeller using open-source software. Optim. Eng. 2019, 20, 929–953. [Google Scholar] [CrossRef]
  35. Thakkar, S.; Vala, H.; Patel, V.K.; Patel, R. Performance improvement of the sanitary centrifugal pump through an integrated approach based on response surface methodology, multi-objective optimization and CFD. J. Braz. Soc. Mech. Sci. Eng. 2021, 43, 24. [Google Scholar] [CrossRef]
  36. Benchikh Le Hocine, A.E.; Poncet, S.; Fellouah, H. CFD modeling and optimization by metamodels of a squirrel cage fan using OpenFoam and Dakota: Ventilation applications. Build. Environ. 2021, 205, 108145. [Google Scholar] [CrossRef]
  37. Hoseini, S.; Najafi, G.; Ghobadian, B.; Akbarzadeh, A. Impeller shape-optimization of stirred-tank reactor: CFD and fluid structure interaction analyses. Chem. Eng. J. 2021, 413, 127497. [Google Scholar] [CrossRef]
  38. Wu, M.; Jurtz, N.; Walle, A.; Kraume, M. Evaluation and application of efficient CFD-based methods for the multi-objective optimization of stirred tanks. Chem. Eng. Sci. 2022, 263, 118109. [Google Scholar] [CrossRef]
  39. Jossen, V.; Kaiser, S.C.; Schirmaier, C.; Herrmann, J.; Tappe, A.; Eibl, D.; Siehoff, A.; van den Bos, C.; Eibl, R. Modification and qualification of a stirred single-use bioreactor for the improved expansion of human mesenchymal stem cells at benchtop scale. Pharm. Bioprocess. 2014, 2, 311–322. [Google Scholar] [CrossRef]
  40. Siddappaji, K.; Turner, M.G. An Advanced Multifidelity Multidisciplinary Design Analysis Optimization Toolkit for General Turbomachinery. Processes 2022, 10, 1845. [Google Scholar] [CrossRef]
  41. Chen, F.; Zhu, G.; Wang, X.; Yao, B.; Guo, W.; Xu, T.; Peng, M.; Cheng, D. Optimization of the impeller of sand-ejecting fire extinguisher based on CFD-DEM simulations and Kriging model. Adv. Powder Technol. 2023, 34, 103898. [Google Scholar] [CrossRef]
  42. Afzal, A.; Kim, K.Y.; Seo, J.w. Effects of Latin hypercube sampling on surrogate modeling and optimization. Int. J. Fluid Mach. Syst. 2017, 10, 240–253. [Google Scholar] [CrossRef]
  43. Daymo, E.; Tonkovich, A.L.; Hettel, M.; Guerrero, J. Accelerating reactor development with accessible simulation and automated optimization tools. Chem. Eng. Process. Process Intensif. 2019, 142, 107582. [Google Scholar] [CrossRef]
  44. Kamath, C. Intelligent sampling for surrogate modeling, hyperparameter optimization, and data analysis. Mach. Learn. Appl. 2022, 9, 100373. [Google Scholar] [CrossRef]
  45. Lin, Y.C.; Boone, M.; Meuris, L.; Lemmens, I.; Van Roy, N.; Soete, A.; Reumers, J.; Moisse, M.; Plaisance, S.; Drmanac, R.; et al. Genome dynamics of the human embryonic kidney 293 lineage in response to cell biology manipulations. Nat. Commun. 2014, 5, 4767. [Google Scholar] [CrossRef]
  46. Hacker, D.L.; Durrer, L.; Quinche, S. CHO and HEK293 Cultivation and Transfection in Single-Use Orbitally Shaken Bioreactors. In Recombinant Protein Expression in Mammalian Cells. Methods in Molecular Biology, 1st ed.; Hacker, D.L., Ed.; Humana Press: New York, NY, USA, 2018; pp. 123–131. [Google Scholar] [CrossRef]
  47. Shaw, G.; Morse, S.; Ararat, M.; Graham, F.L. Preferential transformation of human neuronal cells by human adenoviruses and the origin of HEK 293 cells. FASEB J. Off. Publ. Fed. Am. Soc. Exp. Biol. 2002, 16, 869–871. [Google Scholar] [CrossRef]
  48. Ghani, K.; Garnier, A.; Coelho, H.; Transfiguracion, J.; Trudel, P.; Kamen, A. Retroviral vector production using suspension-adapted 293GPG cells in a 3 L acoustic filter-based perfusion bioreactor. Biotechnol. Bioeng. 2006, 95, 653–660. [Google Scholar] [CrossRef]
  49. Ansorge, S.; Lanthier, S.; Transfiguracion, J.; Henry, O.; Kamen, A. Monitoring lentiviral vector production kinetics using online permittivity measurements. Biochem. Eng. J. 2011, 54, 16–25. [Google Scholar] [CrossRef]
  50. Le Ru, A.; Jacob, D.; Transfiguracion, J.; Ansorge, S.; Henry, O.; Kamen, A.A. Scalable production of influenza virus in HEK-293 cells for efficient vaccine manufacturing. Vaccine 2010, 28, 3661–3671. [Google Scholar] [CrossRef]
  51. Tan, E.; Chin, C.S.H.; Lim, Z.F.S.; Ng, S.K. HEK293 Cell Line as a Platform to Produce Recombinant Proteins and Viral Vectors. Front. Bioeng. Biotechnol. 2021, 9, 796991. [Google Scholar] [CrossRef] [PubMed]
  52. Malm, M.; Saghaleyni, R.; Lundqvist, M.; Giudici, M.; Chotteau, V.; Field, R.; Varley, P.G.; Hatton, D.; Grassi, L.; Svensson, T.; et al. Evolution from adherent to suspension: Systems biology of HEK293 cell line development. Sci. Rep. 2020, 10, 18996. [Google Scholar] [CrossRef]
  53. Henry, O.; Durocher, Y. Enhanced glycoprotein production in HEK-293 cells expressing pyruvate carboxylase. Metab. Eng. 2011, 13, 499–507. [Google Scholar] [CrossRef] [PubMed]
  54. Jang, M.; Pete, E.S.; Bruheim, P. The impact of serum-free culture on HEK293 cells: From the establishment of suspension and adherent serum-free adaptation cultures to the investigation of growth and metabolic profiles. Front. Bioeng. Biotechnol. 2022, 10, 964397. [Google Scholar] [CrossRef]
  55. Liste-Calleja, L.; Lecina, M.; Cairó, J.J. HEK293 cell culture media study towards bioprocess optimization: Animal derived component free and animal derived component containing platforms. J. Biosci. Bioeng. 2014, 117, 471–477. [Google Scholar] [CrossRef]
  56. Fuge, G. New Approaches for Characterizing and Monitoring Mammalian Cell Cycle and Specific Growth Rate in Production Cell Lines. Ph.D. Thesis, Technische Universität Hamburg, Hamburg, Germany, 2018. [Google Scholar] [CrossRef]
  57. Maschke, R.W.; Pretzner, B.; John, G.T.; Herwig, C.; Eibl, D. Improved Time Resolved KPI and Strain Characterization of Multiple Hosts in Shake Flasks Using Advanced Online Analytics and Data Science. Bioengineering 2022, 9, 339. [Google Scholar] [CrossRef]
  58. Liu, X.M.; Liu, H.; Wu, B.C.; Li, S.C.; Ye, L.L.; Wang, Q.W.; Huang, P.T.; Chen, Z.L. Suspended aggregates as an immobilization mode for high-density perfusion culture of HEK 293 cells in a stirred tank bioreactor. Appl. Microbiol. Biotechnol. 2006, 72, 1144–1151. [Google Scholar] [CrossRef]
  59. Liu, H.; Liu, X.M.; Li, S.C.; Wu, B.C.; Ye, L.L.; Wang, Q.W.; Chen, Z.L. A high-yield and scaleable adenovirus vector production process based on high density perfusion culture of HEK 293 cells as suspended aggregates. J. Biosci. Bioeng. 2009, 107, 524–529. [Google Scholar] [CrossRef]
  60. Faust, C.; Beil, C.; Dittrich, W.; Rao, E.; Langer, T. Impact of lipopolysaccharides on cultivation and recombinant protein expression in human embryonal kidney (HEK-293) cells. Eng. Life Sci. 2021, 21, 778–785. [Google Scholar] [CrossRef]
  61. Decaria, P. Growth and Scale-Up of HEK293F Derivatives in HyPerforma DynaDrive Single-Use Bioreactors. Available online: https://assets.thermofisher.com/TFS-Assets/BPD/Application-Notes/hek293f-derivatives-dynadrive-sub-application-note.pdf (accessed on 10 August 2023).
  62. Liu, H.; Liu, X.; Wu, B.; YE, L.; Ni, X.; Wang, Q.; Chen, Z. Effects of Hydrodynamics on Aggregates Formation, Growth and Metabolism of HEK 293 Cells in Suspension Culture. Chin. J. Biotechnol. 2006, 22, 101–106. [Google Scholar] [CrossRef]
  63. Patel, S.; Fong, E.; George, H. Considerations for Bioreactor Process Development and Scale-Up for Transient Transfection-Based Lentivirus Production in Suspension. Available online: https://www.emdmillipore.com/Web-US-Site/en_CA/-/USD/ShowDocument-Pronet?id=202008.048 (accessed on 10 August 2023).
  64. Arena, T.A.; Chou, B.; Harms, P.D.; Wong, A.W. An anti-apoptotic HEK293 cell line provides a robust and high titer platform for transient protein expression in bioreactors. mAbs 2019, 11, 977–986. [Google Scholar] [CrossRef] [PubMed]
  65. Schirmer, C.; Blaschczok, K.; Husemann, U.; Leupold, M.; Zahnow, C.; Rupprecht, J.; Glöckler, R.; Greller, G.; Pörtner, R.; Eibl, R.; et al. Standardized Qualification of Stirred Bioreactors for Microbial Biopharmaceutical Production Processes. Chem. Ing. Tech. 2017, 89, 1766–1772. [Google Scholar] [CrossRef]
  66. Menter, F. Zonal Two Equation k-ω Turbulence Models For Aerodynamic Flows. In Proceedings of the 23rd Fluid Dynamics, Plasmadynamics, and Lasers Conference, Reston, VA, USA, 6–9 July 1993. [Google Scholar] [CrossRef]
  67. Götz, S.; Sperling, R.; Liepe, F.; Jembere, S. Numerical determination of the three-dimensional velocity distribution in a baffled pitched blade impeller stirred vessel. Chem. Eng. Technol. 1997, 20, 596–605. [Google Scholar] [CrossRef]
  68. Jaworski, Z.; Wyszynski, M.L.; Moore, I.P.T.; Nienow, A.W. Sliding mesh computational fluid dynamics—A predictive tool in stirred tank design. Proc. Inst. Mech. Eng. Part E J. Process Mech. Eng. 1997, 211, 149–156. [Google Scholar] [CrossRef]
  69. Stephan, P.; Kabelac, S.; Kind, M.; Mewes, D.; Schaber, K.; Wetzel, T. (Eds.) VDI-Wärmeatlas; Springer Reference Technik; Springer: Berlin/Heidelberg, Germany, 2019. [Google Scholar] [CrossRef]
  70. Seidel, S.; Eibl, D. Influence of Interfacial Force Models and Population Balance Models on the kLa Value in Stirred Bioreactors. Processes 2021, 9, 1185. [Google Scholar] [CrossRef]
  71. Ahrens, J.; Geveci, B.; Law, C. ParaView: An End-User Tool for Large Data Visualization, Visualization Handbook; Elsevier: Amsterdam, The Netherlands, 2005. [Google Scholar]
  72. Ramírez-Durán, V.J.; Berges, I.; Illarramendi, A. Towards the implementation of Industry 4.0: A methodology-based approach oriented to the customer life cycle. Comput. Ind. 2021, 126, 103403. [Google Scholar] [CrossRef]
  73. Berger, V.W.; Zhou, Y. Kolmogorov–Smirnov Test: Overview. In Wiley StatsRef: Statistics Reference Online; Wiley: Hoboken, NJ, USA, 2014. [Google Scholar] [CrossRef]
  74. Sullivan, C.; Kaszynski, A. PyVista: 3D plotting and mesh analysis through a streamlined interface for the Visualization Toolkit (VTK). J. Open Source Softw. 2019, 4, 1450. [Google Scholar] [CrossRef]
  75. Cates, S.; Ciccarone, V.C.; Gruber, D.F.; Hawley-Nelson, P. Novel Attached Cell Lines. WO2004085620A2, 7 October 2004. [Google Scholar]
  76. EOS GmbH. PA 2200 Regulatory Information; Technical Report; EOS GmbH: München, Germany, 2013. [Google Scholar]
  77. Baker, N.; Kelly, G.; O’Sullivan, P.D. A grid convergence index study of mesh style effect on the accuracy of the numerical results for an indoor airflow profile. Int. J. Vent. 2020, 19, 300–314. [Google Scholar] [CrossRef]
  78. Ramírez, L.A.; Pérez, E.L.; García Díaz, C.; Camacho Luengas, D.A.; Ratkovich, N.; Reyes, L.H. CFD and Experimental Characterization of a Bioreactor: Analysis via Power Curve, Flow Patterns and kLa. Processes 2020, 8, 878. [Google Scholar] [CrossRef]
  79. Pappalardo, F.; Moscatello, A.; Ledda, G.; Uggenti, A.C.; Gerboni, R.; Carpignano, A.; Di Maio, F.; Mereu, R.; Zio, E. Quantification of Uncertainty in CFD Simulation of Accidental Gas Release for O & G Quantitative Risk Assessment. Energies 2021, 14, 8117. [Google Scholar] [CrossRef]
  80. Roache, P.J. Perspective: A Method for Uniform Reporting of Grid Refinement Studies. J. Fluids Eng. 1994, 116, 405–413. [Google Scholar] [CrossRef]
  81. Weiser, S.; Tiso, T.; Willing, K.; Bardl, B.; Eichhorn, L.; Blank, L.M.; Regestein, L. Foam-free production of the rhamnolipid precursor 3-(3-hydroxyalkanoyloxy) alkanoic acid (HAA) by Pseudomonas putida. Discov. Chem. Eng. 2022, 2, 8. [Google Scholar] [CrossRef]
  82. Noppiboon, S.; Lapanusorn, N.; Ekkpongpaisit, P.; Slack, S.; Frank, S.; Hocharoen, L. A Simple and Cost-Efficient Platform for a Novel Porcine Circovirus Type 2d (PCV2d) Vaccine Manufacturing. Vaccines 2023, 11, 169. [Google Scholar] [CrossRef] [PubMed]
  83. Zlokarnik, M. Stirring; Wiley: Hoboken, NJ, USA, 2001. [Google Scholar] [CrossRef]
  84. Navid, A.; Khalilarya, S.; Abbasi, M. Diesel engine optimization with multi-objective performance characteristics by non-evolutionary Nelder-Mead algorithm: Sobol sequence and Latin hypercube sampling methods comparison in DoE process. Fuel 2018, 228, 349–367. [Google Scholar] [CrossRef]
  85. Dhamotharan, V.; Jadhav, P.D.; Ramu, P.; Prakash, A.K. Optimal design of savonius wind turbines using ensemble of surrogates and CFD analysis. Struct. Multidiscip. Optim. 2018, 58, 2711–2726. [Google Scholar] [CrossRef]
  86. Akram, M.T.; Kim, M.H. CFD Analysis and Shape Optimization of Airfoils Using Class Shape Transformation and Genetic Algorithm—Part I. Appl. Sci. 2021, 11, 3791. [Google Scholar] [CrossRef]
  87. Espinosa Sarmiento, A.L.; Ramirez Camacho, R.G.; de Oliveira, W.; Gutiérrez Velásquez, E.I.; Murthi, M.; Diaz Gautier, N.J. Design and off-design performance improvement of a radial-inflow turbine for ORC applications using metamodels and genetic algorithm optimization. Appl. Therm. Eng. 2021, 183, 116197. [Google Scholar] [CrossRef]
  88. Morita, Y.; Rezaeiravesh, S.; Tabatabaei, N.; Vinuesa, R.; Fukagata, K.; Schlatter, P. Applying Bayesian optimization with Gaussian process regression to computational fluid dynamics problems. J. Comput. Phys. 2022, 449, 110788. [Google Scholar] [CrossRef]
  89. Diessner, M.; O’Connor, J.; Wynn, A.; Laizet, S.; Guan, Y.; Wilson, K.; Whalley, R.D. Investigating Bayesian optimization for expensive-to-evaluate black box functions: Application in fluid dynamics. Front. Appl. Math. Stat. 2022, 8, 1076296. [Google Scholar] [CrossRef]
  90. Peng, K.; Koubaa, M.; Bals, O.; Vorobiev, E. Effect of Pulsed Electric Fields on the Growth and Acidification Kinetics of Lactobacillus delbrueckii Subsp. bulgaricus. Foods 2020, 9, 1146. [Google Scholar] [CrossRef] [PubMed]
  91. Jensch, C.; Knierim, L.; Tegtmeier, M.; Strube, J. Development of a General PAT Strategy for Online Monitoring of Complex Mixtures—On the Example of Natural Product Extracts from Bearberry Leaf (Arctostaphylos uva-ursi). Processes 2021, 9, 2129. [Google Scholar] [CrossRef]
  92. Zhuang, S.; Renault, N.; Archer, I. A brief review on recent development of multidisciplinary engineering in fermentation of Saccharomyces cerevisiae. J. Biotechnol. 2021, 339, 32–41. [Google Scholar] [CrossRef]
  93. Sandadi, S.; Pedersen, H.; Bowers, J.S.; Rendeiro, D. A comprehensive comparison of mixing, mass transfer, Chinese hamster ovary cell growth, and antibody production using Rushton turbine and marine impellers. Bioprocess Biosyst. Eng. 2011, 34, 819–832. [Google Scholar] [CrossRef] [PubMed]
Figure 1. Overview of the experiments and steps carried out. (A) Steps marked in yellow show the work carried out in Seidel et al. [26]. (B) Depicts the new scale-up process proposed here. (C) Shows the traditional scale-up approach using a constant specific power input. This approach was used as a reference.
Processes 11 02703 g001
Figure 2. Technical drawing of the stirrer to be optimized for the 30 L D-DCU bioreactor. The five input variables described in Table 1 are marked.
Processes 11 02703 g002
Figure 3. Comparison of the determined specific power input in the standard D-DCU 30 L configuration with three Rushton impellers with published data from Schirmer et al. [65].
Processes 11 02703 g003
Figure 4. Velocity profiles with line integral convolution (LIC) of the investigated bioreactors at 233 W m−3. (A) Minifors 2 bioreactor with 4 L working volume at 275 rpm that served as a baseline. (B) Standard configuration of the 30 L D-DCU bioreactor with 3 Rushton impellers at 213 rpm. (C) Optimized stirrer design where a similar Kolmogorov length distribution was obtained ( N = 67   rpm ).
Processes 11 02703 g004
Figure 5. Explored design space for optimization. The five parameters examined are shown normalized. The absolute values are summarized in Table 1. The selected parameter combination is marked black and, according to the KS test, showed the best match of the Kolmogorov length scale distribution.
Processes 11 02703 g005
Figure 6. Pareto front of the specific power input (233 W m−3). (A) Stirrer diameter d s dependence on the stirrer speed N (at H = 0.2   m , α 1 = 60 , α 2 = 45 ). (B) Pitch angle α 2 dependence on the stirrer speed N (at H = 0.2   m , d s = 120   m m , α 1 = 25 ).
Processes 11 02703 g006
Figure 7. Cumulative distribution function (CDF) of the Kolmogorov length scales for the initial case, the scale-up approach via the specific power input and the optimized case.
Processes 11 02703 g007
Figure 8. Temporal development of the viable cell density for the investigated systems at a specific power input of 233   W   m 3 . Green shows the cultivations in the 4 L Minifors 2 bioreactor that have reached a maximum VCD of 5.77 · 10 6 cells mL−1 [26]. In purple are the cultivations in the 30 L bioreactor and Rushton impellers with the same specific power input as in the 4 L system, which served as a reference (VCD max = 5.02 · 10 6 cells   mL 1 ). The optimized cultivations, with a similar Kolmogorov length scale distribution, are shown in teal (VCD max = 5.60 · 10 6 cells   mL 1 ).
Processes 11 02703 g008
Figure 9. Temporal progression of VCD, TCD and online measured OD 850 n m in the 30 L system. (A) Cultivation with Rushton impellers at the same specific power input as in the laboratory scale (Minifors 2) and (B) with optimized stirrer geometry.
Processes 11 02703 g009
Figure 10. Total cell density TCD as a function of the optical density at 850 nm (OD 850 n m ). For the TCD range of 0.30 · 106 cells mL−1 to 6.46 · 106 cells mL−1 achieved in the cultivations, a linear relationship can be demonstrated for all cultivations.
Processes 11 02703 g010
Table 2. Overview of GCI analysis for the 30 L D-DCU bioreactor with three Rushton impellers and a stirrer speed of 364 rpm ( v tip = 2   m   s 1 ). A detailed overview of the mesh properties can be found in Table A1.
CaseMeshr p ^ a ε mn GCI [%] GCI i + 2 , i + 1 r p a GCI i + 1 , i
Case 1M1-M21.082.46 3.84 · 10 3 2.241.13
M2-M31.13 4.40 · 10 3 1.63
Case 2M2-M31.132.04 4.40 · 10 3 2.011.04
M3-M41.17 4.72 · 10 3 1.52
Disclaimer/Publisher’s Note: The statements, opinions and data contained in all publications are solely those of the individual author(s) and contributor(s) and not of MDPI and/or the editor(s). MDPI and/or the editor(s) disclaim responsibility for any injury to people or property resulting from any ideas, methods, instructions or products referred to in the content.

