Article

Using Adsorption Energy Distribution for Parameter Estimation of Competitive Cofactor Coupled Enzyme Reaction

Institute of Process Systems Engineering, Hamburg University of Technology, Am Schwarzenberg-Campus 4, 21073 Hamburg, Germany
*
Author to whom correspondence should be addressed.
Processes 2023, 11(9), 2686; https://doi.org/10.3390/pr11092686
Submission received: 3 August 2023 / Revised: 25 August 2023 / Accepted: 5 September 2023 / Published: 7 September 2023
(This article belongs to the Special Issue Development, Modelling and Simulation of Biocatalytic Processes)

Abstract

:
The chemical and biotechnology industries are facing new challenges in the use of renewable resources. The complex nature of these materials requires the use of advanced techniques to understand the kinetics of reactions in this context. This study presents an interdisciplinary approach to analyze cofactor coupled enzymatic two-substrate kinetics and competitive two-substrate kinetics in a fast and efficient manner. By studying the adsorption energy distribution (AED), it is possible to determine the individual parameters of the reaction kinetics. In the case of a single alcohol reaction, the AED is able to identify parameters in agreement with the literature with few experimental data points compared to classical methods. In the case of a competitive reaction, AED analysis can automatically determine the number of competing substrates, whereas traditional nonlinear regression requires prior knowledge of this information for parameter identification.

Graphical Abstract

1. Introduction

In recent years, biotechnology has steadily gained increased importance in the chemical industry [1,2,3,4]. Biotechnology can offer sustainable alternatives to traditional chemical production methods, using microorganisms and enzymes to produce chemicals with high selectivity and fewer by-products, as well as less hazardous waste than conventional processes. Biotechnological processes also provide the potential to reduce production costs by using cheaper renewable raw materials, while operating at ambient pressure and considerably lower temperatures than traditional chemical processes. In addition, stereoselective products, such as pharmaceuticals, nutraceuticals, or specialties, are comparatively easy to produce [2,5,6,7,8]. Thus, biotechnology represents a very good opportunity to achieve the sustainable development goal (SDG) 12, ensuring sustainable consumption and production patterns. However, there are several challenges associated with the industrial application of biotechnological production processes [9,10], with scaling up from the laboratory to the industrial scale being one of the biggest challenges. This can lead to significant differences in yield and product quality between laboratory and industrial scale. Moreover, optimization of these highly complex processes can be difficult, as they can be sensitive to changes in environmental conditions, and maintaining stability over long production runs can be ambitious. Yet, mathematical modeling can play a crucial role in tackling these challenges, providing a cost-effective and efficient way to identify process parameters and optimize production [11,12,13,14]. However, model development itself presents a challenge that requires proper experimental and numerical analysis.
Based on assumptions of a reaction mechanism, a kinetic model can be postulated. Afterward, the parameter regression for a specific model is usually performed based on experimental data, applying least squares minimization or maximum likelihood estimation. In the case of nonlinear regression, various mathematical methods and different computational tools can be applied, potentially providing significant differences in the resulting parameter estimates [15]. Therefore, it is important to carefully select the calculation tool for the parameter regression, especially since, for nonlinear regression, the results may depend on the initial values [16]. Of course, kinetic models can include multiple substrates and/or products. Often, a parameter is then assigned to the individual components, which, depending on the reaction mechanism, describes, e.g., an affinity with the enzyme or an enzyme complex [17,18]. For more complex reaction mechanisms, computer tools can assist in model identification by offering a database of candidate models that account for a vast pool of possible reaction mechanisms [15,19]. However, internal parameter estimation tools may use a rather simple solver, e.g., the gradient-free Nelder–Mead method, which may not be the most effective for parameter estimation in nonlinear models [15]. Incremental model identification and model reduction are additional tools used to systematically generate suitable model candidates and eliminate unidentifiable parameters [20,21]. Furthermore, model-based optimal experimental design provides a systematic approach for discriminating between different model candidates with limited experimental effort [22,23,24].
This contribution describes a numerically robust approach to analyzing assays for enzymatic two-substrate reactions with and without competing substrates. The approach is based on the estimation of the adsorption energy distribution (AED), which allows for the identification of the number of individual substrates and an estimation of the kinetic parameters of different substrates in a mixture for an enzymatic reaction using the non-selective measurement of co-factor consumption. The results of the proposed AED-based method, which was introduced and validated for single-substrate enzymatic reactions in our preceding work [25], are compared with parameter estimates obtained from classical non-linear regression based on concentration measurements. As was previously demonstrated, the AED-based method requires only a small number of composition measurements while avoiding the need for costly separation of individual products, such as through high-performance liquid chromatographic (HPLC) methods. As a result, it has the potential to significantly reduce the time and cost of model identification. This interdisciplinary approach combines ideas from systems engineering, transport process analysis, and biotechnology and may encourage increased modeling of multisubstrate enzymatic processes in industry to overcome the above-mentioned challenges for industrial application.

2. Materials and Methods

As mentioned above, the choice of the kinetic model must be made carefully, as different reaction mechanisms are mathematically described by different kinetic equations. For alcohol dehydrogenase (ADH), various reaction mechanisms have been published in the literature, some including inhibition while others do not. Moreover, some are contradictory, even for ADHs of the same origin/species [26,27,28,29,30,31,32,33,34]. Since the focus of the present study is not to discriminate reaction mechanisms but to present a new approach for parameter regression, a simple three-parameter extended Michaelis–Menten model according to Equation (1) is considered. This kinetic model assumes that substrates alcohol and cofactor bind to the enzyme randomly and independently without any inhibition coefficient [17]. This random mechanism for ADH is also part of the discussion in the literature [26,27,28,32,34].
v ( c ) = v m a x c s 1 K M 1 + c s 1 c s 2 K M 2 + c s 2
In enzymatic two-substrate reactions, one set of experiments often keeps one substrate concentration constant and only varies the other. In a second set of experiments, the varied concentration is then changed. This leads to a high effort of experiments and is not necessary at all because, in this way, only information about the varied substrate can be obtained for each set. The simultaneous variation of both substrates reduces the experimental effort while simultaneously increasing information density.
The subsequent sections describe the AED-based method for analysis of a two-substrate kinetic as well as the procedure for the experimental analysis for the example of ADH with substrate 1-propanol and 2-butanol, respectively.

2.1. Adsorption Energy Distribution

The basic assumption used in this study is the analogy between enzyme kinetics and adsorption equilibria. In an enzymatic reaction, a substrate molecule adsorbs to the active center of the enzyme, where it is then converted to the product. According to Bisswanger [17], “this phase can be considered as a quasi-equilibrium state, which is maintained for a limited period”, called steady-state. This quasi-equilibrium is analogous to the adsorption equilibrium of a conventional adsorption process. In a previous study, we have shown the validity and the use of AED for the analysis of enzyme kinetics for a uni–uni reaction [24] described by the well-known Michaelis–Menten approach. In this study, we extend this approach to a bi–bi reaction for the example of ADH, which extends the kinetic model by a second term for the second substrate c s 2 / ( K m 2 + c s 2 ) , cf. Equation (1). Refer to the original work for the uni-uni reaction [25] for a more thorough description of the fundamentals.
The AED was originally developed for the analysis of heterogeneous adsorption surfaces. Based on the general case of a continuous distribution of arbitrary energy levels, the heterogeneous adsorption isotherm can be described according to Equation (2) [35], which determines the total amount of solute adsorbed via the integral over the adsorption energy ϵ, considering the product of the AED f(ϵ) and the local adsorption model Θ(ϵ,c). The integration limits min and max correspond to the minimum and maximum adsorption energies [36].
q ( c ) = m i n m a x f ( ϵ ) Θ ( c , ϵ ) d ϵ ,
In order to transfer Equation (2) to enzymatic reaction kinetics, the local adsorption isotherm is replaced by the underlying reaction kinetics. In this case, a simple two-substrate kinetic, as described in Equation (1), is considered. The adsorption energy, as a measure of the affinity of the adsorptive to the adsorbent can be expressed by the Michaelis constant Km, which is a measure of the affinity of the substrate to the enzyme. Since a two-substrate kinetic is considered, two Km values (Km1, Km2) must be used, and the integration is to be performed from the minimum to maximum affinity (analogous to respective minimum and maximum adsorption energy). The local adsorption model will be substituted by the kinetic equation. The values of the integration limits are suggested to be depending on the minimum and maximum concentration of experimental data [37]. For the numerical evaluation, a discrete form is used, which is given in Equation (3) for each local reaction rate, where ΔKm1 is the grid spacing around Km1,i and ΔKm2 is the grid spacing around Km2,i, respectively, for a specific pair c1,j and c2,j.
v ( c 1 , c 2 ) = K m 1 ,   m i n K m 1 , m a x       K m 2 , m i n K m 2 , m a x f ( K m 1 , i , K m 2 , i ) v ( K m 1 , i , K m 2 , i , c 1 , j , c 2 , j )   Δ K m 1 Δ K m 2
In order to derive the AED from this equation using raw data of the reaction rates, the expectation maximization (EM) algorithm with maximum likelihood estimation, as represented in Equation (4), is used, as it is a very robust method for parameter estimation and is expected to converge to the global optimum for Gaussian and Poisson distributed data [36]. For the application of the EM algorithm, a uniform distribution over all Km intervals is assumed as the initial estimate for f(Km1, Km2), also referred to as the “total ignorance guess” [36]. A scheme of the total AED algorithm is shown in SI.
m i n ( 1 2 π σ 2 ) n 2 e x p ( i = 1 n ( v i ( K m 1 , K m 2 ) v ^ i ) 2 2 σ 2 )
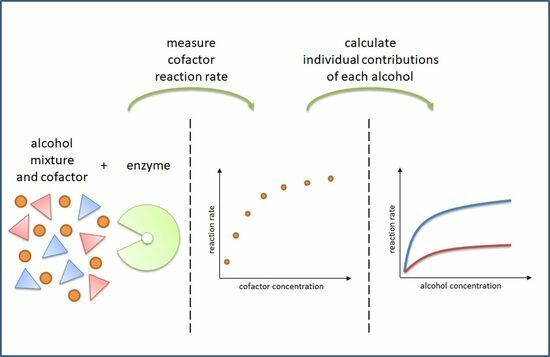
The outcome of the AED analysis is a dimensionless distribution function characterized by a prominent peak aligning with the respective Km values. The conceptual methodology behind the AED-based approach is further illustrated in Figure 1 for a simple bi–bi reaction. Using a set of experimentally derived reaction rates (depicted in Figure 1a), which also serves as the starting point for NLR, a computation of the AED is performed, resulting in a distribution diagram (depicted in Figure 1b). Subsequently, the kinetic parameters are deducted from specific peak information, and a response surface can be calculated (depicted in Figure 1c). The positions of the x- and y-axis in Figure 1b correspond to Km1 and Km2, while the volume below the peak corresponds to vmax.
For classical nonlinear regression (NLR), the sum of squared error (SSE) is minimized. As the experimental values are very small, the SSE is standardized; see Equation (5).
m i n i = 1 n ( v i ( v m a x , K m 1 , K m 2 ) v ^ i ) 2 v ¯ i 2
In comparison to NLR, the AED-based method has two major advantages: First, the AED-based method does not require good initial estimates or a global optimization method of the sum of squares residuals for the identification of the optimal parameter values. Second, its main strength is its application to the determination of competitive substrate kinetics, in which different substrates act analogously to different adsorptives without explicitly measuring the individual substrate concentrations since, for each substrate, an individual peak will occur. The position of the peaks provides information about the different Km values, while the volume of the peak corresponds to the respective vmax values. While a direct assignment to a specific component, as with HPLC, is not necessary, it is sufficient to follow the course of the reaction via the cofactor concentration. Thereby, conclusions can be drawn about the reaction rates of different alcohols in a mixture of substrates, eliminating the need for complex analysis. A major benefit of the AED-based method is that, unlike conventional methods, the number of substrates does not need to be known a priori, while the information on the number of substrates has to be determined a priori from, e.g., dedicated HPLC analysis for classical NLR-based parameter estimation. In the following, an overview of advantages and disadvantages is listed in Table 1.

2.2. Experimental Desgin

To analyze the reaction rate of ADH, batch experiments were performed in which the increase in NADH (at 340 nm in a UV-1600PC spectrometer) was measured at ambient temperature. Initial slope experiments are simple to perform and commonly used in enzyme kinetic analysis as they represent the quasi-equilibrium [17]. Furthermore, the results can be directly implemented into the differentiated form of the kinetic equation, e.g., Equation (1). Stock solutions of 1-propanol (Carl Roth, 99.5% for synthesis), 2-butanol (Carl Roth, 98.5% for synthesis), a mixture of both alcohols, NAD (Carl Roth, 98% for biochemistry), and ADH from S. cerevisiae (Sigma Aldrich, A7011-75KU, Lot SLCC0980) were used. Both substrates, as well as buffer (final 100 mM sodium phosphate buffer, pH 8.8), were added to a cuvette in which the reaction took place. The cuvette was placed in the spectrometer. The reaction was started by the addition of enzyme stock solution and pipetting up and down. The initial reaction rate was measured for 10 s. The experimental data for one alcohol are listed in Table S1, and the mixture of two alcohols in Table S2, respectively. All experiments were performed as triplets; standard deviation for all experiments is listed in the tables.

2.3. Data Analysis with Matlab R2022b

The classical nonlinear regression was performed by means of the lsqnonlin function, applying the Levenberg–Marquardt algorithm to minimize the standardized sum of squares of the residuals of observed v ^ and calculated v . Lower and upper bonds were set to 0 and inf for each parameter. All other options were left at the default setting. For application of the EM to calculate AED the axes were set to the measuring range of alcohol and co-factor. Details are provided in the supporting information. For further analysis of the results, the standard error of the estimates was calculated manually according to our previous work [25].

3. Results and Discussion

In the following the application of the AED-based method is described and compared with classical nonlinear regression for the ADH-based conversion of 1-propanol and 2-butanol. Section 3.1 first presents the application of the AED-based approach to reactions with a single alcohol. The results of the different methods are further compared with literature data. In Section 3.2, the AED-based method is extended to the analysis of competing alcohols in a mixture and compared with the results obtained by classical nonlinear regression.

3.1. Single Alcohol Reaction

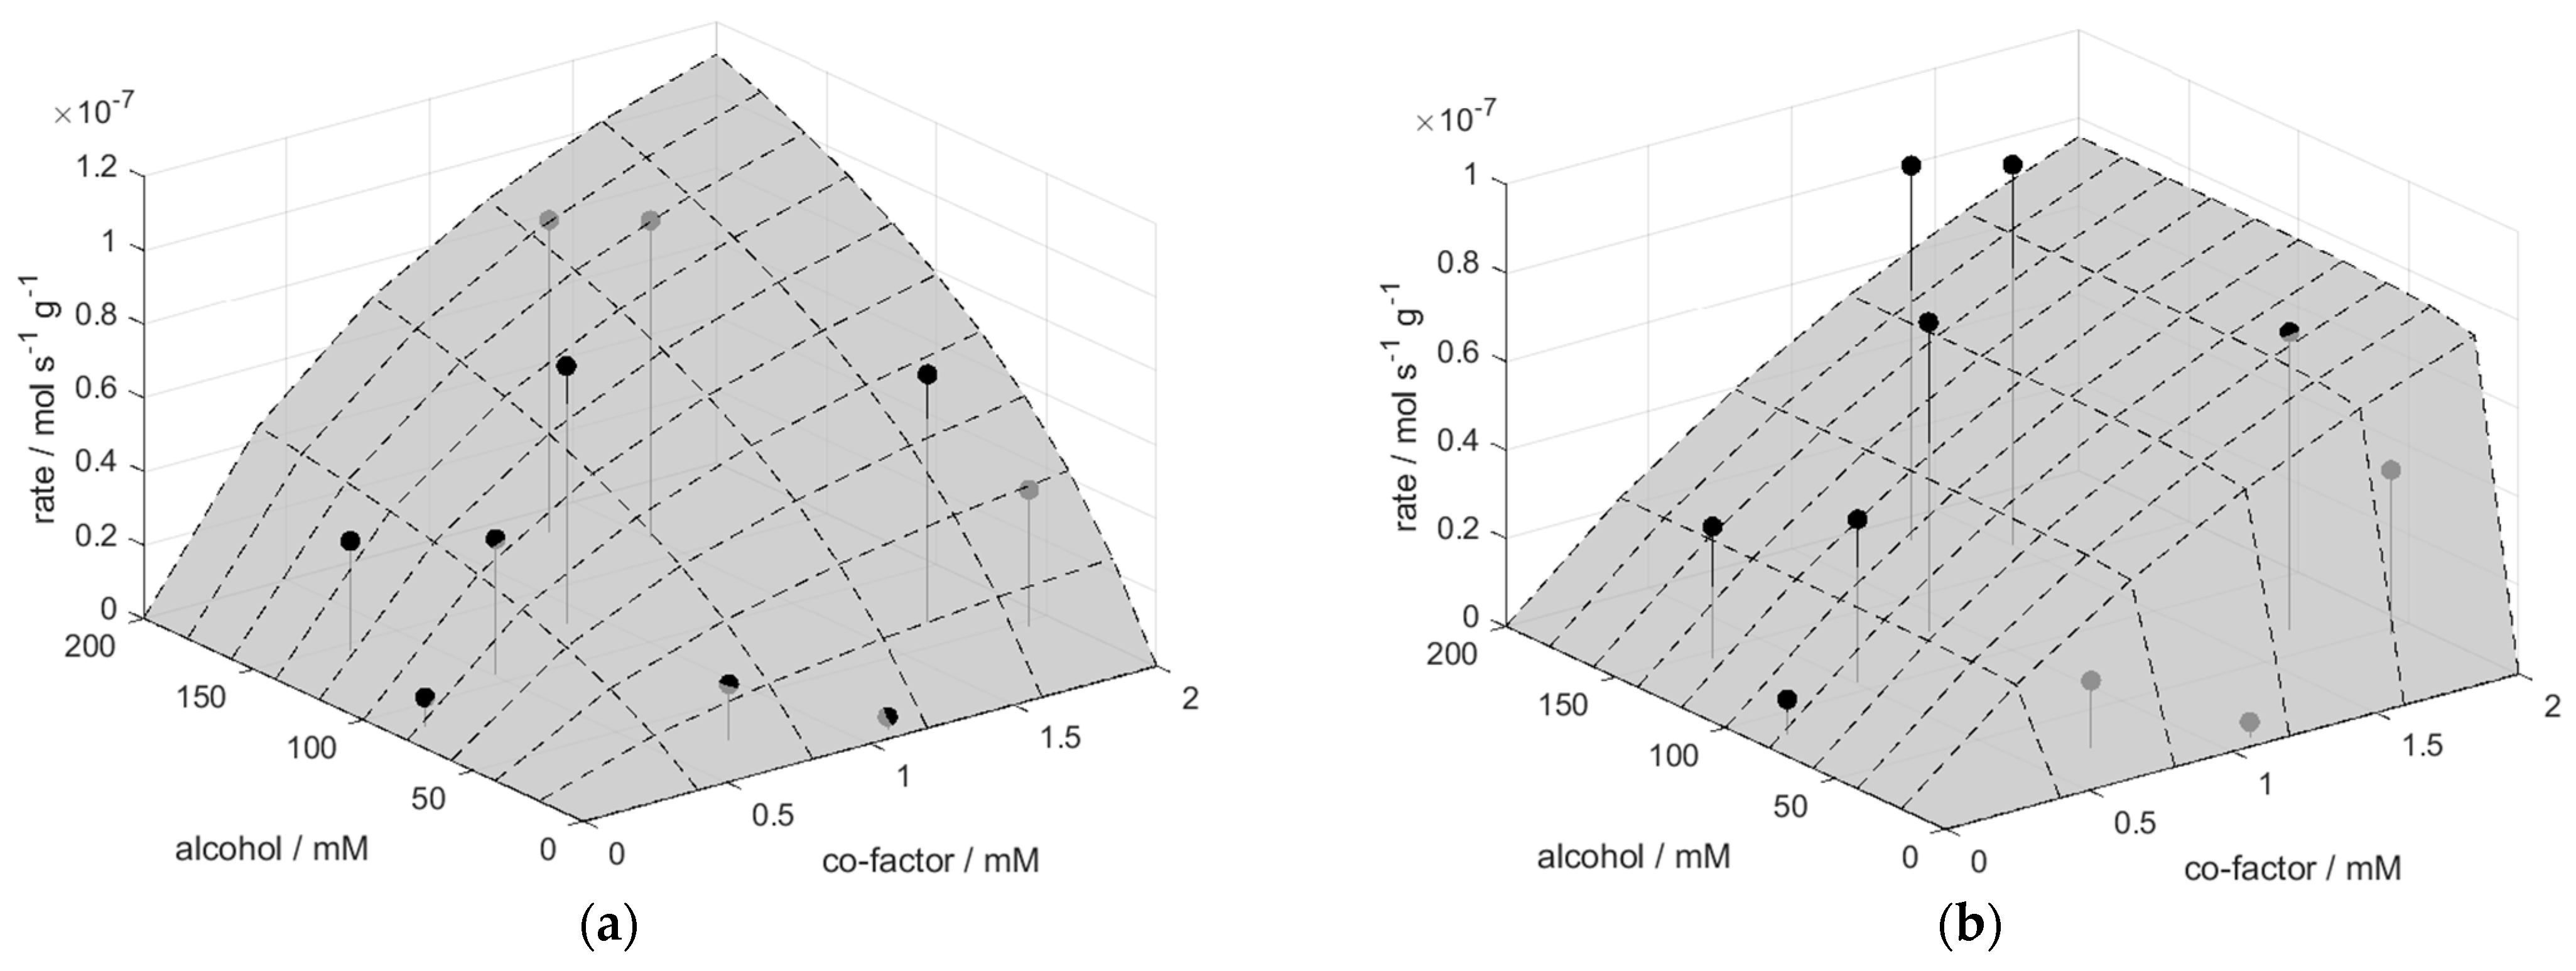
The kinetic characterization of ADH involved conducting initial slope experiments utilizing ten different initial concentrations of alcohol and co-factor, which were randomly assigned to each other. Figure 2 illustrates the Michaelis–Menten diagram with experimental data (cf. Table S1 for the numerical details), including the response surface for the reaction kinetic model with the parameters retrieved by AED-based estimation (Figure 2a) and nonlinear regression (NLR) (Figure 2b) with initial values of vmax = 1, Km1 = 1, and Km2 = 1 for the conversion of 2-butanol. The corresponding parameters and standard errors are summarized in Table 2.
As can be seen at first glance, the results of the two methods differ considerably. This applies to both a qualitative (shape of the area) and a quantitative analysis (cf. Table 2). It is noteworthy that the standard error of the parameters is significantly larger for the NLR estimates than for the AED-based estimates, which is also evident from the sum of squared errors. The qualitative difference in the response surface is remarkable. In the NLR, the Km,alc is below the smallest experimental value, which leads to an insensitivity for the alcohol concentration. Therefore, the surface looks like a straight ramp, which only increases with the cofactor concentration. The results of the analysis of propanol are analogous as can be seen in Table 2. The resulting peaks of AED analysis are shown in Figure S1.
The Km value for 2-butanol for the reaction of ADH from S. cerevisiae was determined to be 93.3 mM ± 36.33% by Nealon et al. [38], while the manufacturer gives a Km value of 140 mM [39]. The parameter estimation based on the AED (139.50 mM) agrees very well with these values, whereas the analysis by NLR (1.30 mM) deviates significantly. The Km value for NAD for ADH from S. cerevisiae is reported in the literature to be in the range of 0.11–0.81 mM as it differs with alcohol and depends on the type of isozyme [30]. Furthermore, the Km value depends on the pH value, whereby a Km value of 0.2 mM for ADH from yeast is reported for a pH of 8.5 [33]. Dependence on alcohol is evident in the AED-based method, where a value of 1.25 mM for 2-buthanol and 0.55 mM for propanol as the substrate is reached. Both values are quantitatively consistent with literature values. The NLR method calculates the same Km value for both alcohol substrates, which is 3.11 mM and somewhat high compared with literature values. The Km value of propanol for ADH from S. cerevisiae was determined to be 2.6 mM, 11 mM, and 27 mM for each isozyme respectively [30], and 5.7 mM [40]. Although the values of both methods used in this study are closer to each other than for 2-butanol, the value of the AED method (11.35 mM) agrees more closely with the differing literature values compared with the NLR estimate (1.30 mM). It is to be expected that the maximum reaction rate for the linear alcohol propanol is significantly higher than for the secondary alcohol 2-butanol, which is documented in the literature [29,38]. Remarkably, the NLR predicts the same Km values for 2-butanol and propanol and the corresponding co-factor. However, the NLR estimates depend considerably on the initial values, which is a well-known problem when utilizing local optimization algorithms, such as the applied Levenberg-Marquardt algorithm [25,41]. The NLR estimates for alternative initial values are listed in Table S3. It can be seen that the algorithm apparently always runs into a local minimum, as no significant change can be observed between the initial parameter of Km values and the calculated parameter, while the SSE differs. It may be assumed that the NLR cannot cope with the small number of experimental data and that a higher experimental effort would have to be made to obtain more reliable values [16]. However, even with an extension of experimental data up to 19 data points for the example of 2-butanol (cf. Table S1), NLR is not able to identify unambiguously due to numerical difficulty [18].
To sum up, the kinetic parameters determined with AED estimation agree well with values reported in the literature, while the NLR results are very sensitive to the initial values and show larger deviations with comparably large standard errors. Therefore, both the experimental method and the method for parameter identification by means of the AED-based method are deemed reliable, enabling the application of this approach for actual assessments of competing substrates. It should be emphasized that all parameters could be determined by AED at just ten data points (30 individual experiments, as triple determination was performed) with simultaneous variation of alcohol and cofactor concentrations.

3.2. Competing Alcohol Reaction

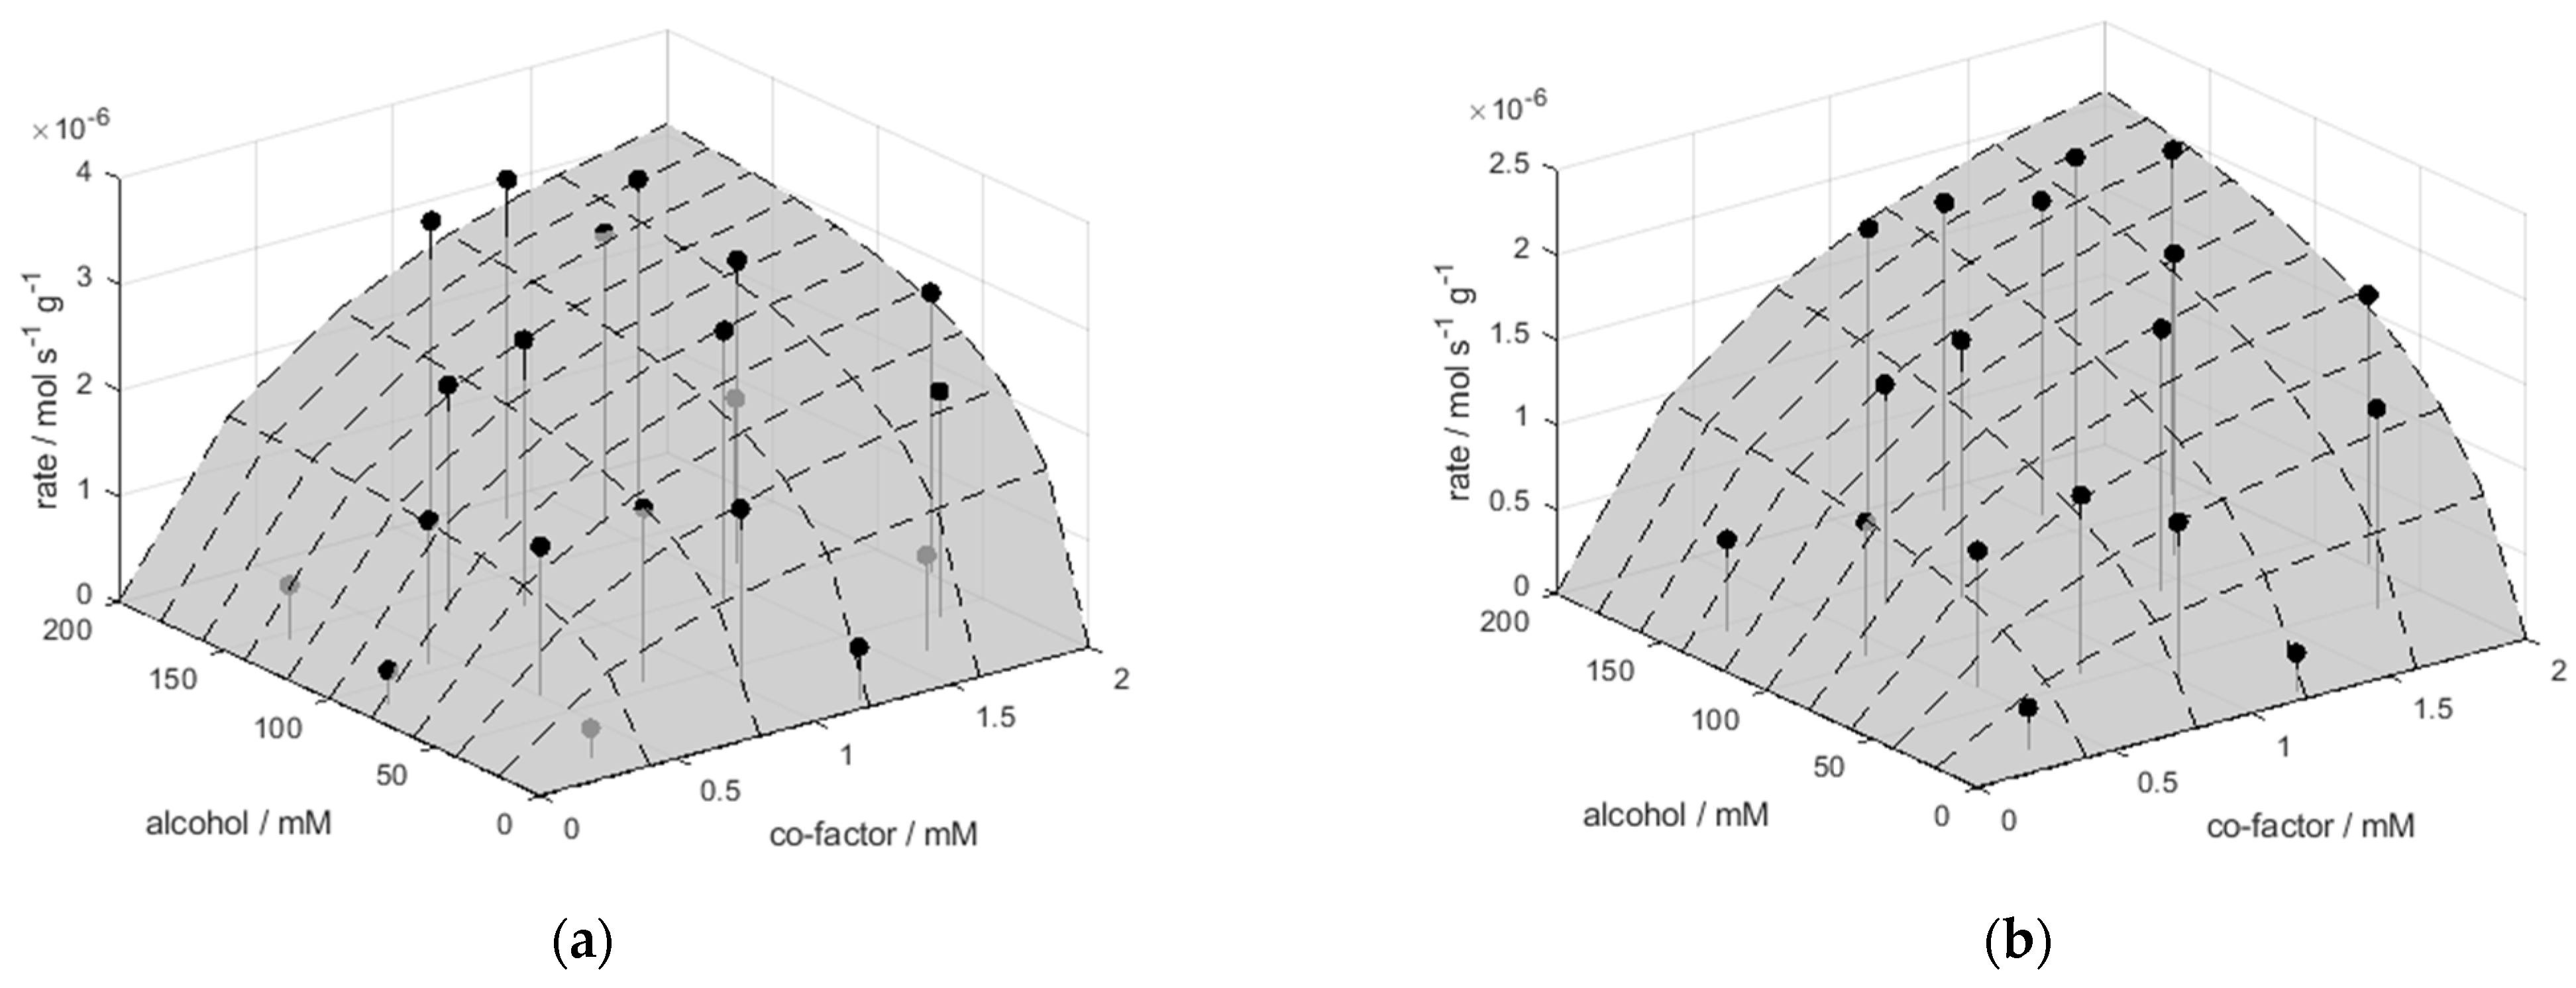
A common approach to describe the competing two-substrate kinetics is the simple addition of the individual kinetics [42,43,44,45]. In this study, this is the addition of two individual v according to Equation (1) to a vtotal. Figure 3 illustrates the Michaelis–Menten diagram with experimental data (cf. Table S2 for numerical details) as well as the response surface of the reaction kinetic model based on the parameter estimates determined by AED-based estimation for a mixture of propanol/2-butanol with a mole content of 50/50 (a) and 25/75 (b). The corresponding kinetic parameters are listed in Table 3.
As can be seen, there is a good qualitative agreement of experimental data with the response surface. It has to be noticed that the AED-based approach has automatically detected the correct number of alcohol substrates, which is two in all cases. Therefore, two peaks appear in the AED analysis for all three mixtures (cf. Figure S2).
The kinetic parameters were also calculated from the experimental data using the local NLR method, for which the number of alcohols has to be specified beforehand. Table 4 shows the calculated parameters, determined for the initial values of 1. On the one hand, it can be seen that both the SSE and the S.E. are significantly higher than with the AED method. On the other hand, one vmax value is identified as 0, while the corresponding Km values have extremely high S.E. Thus, the NLR is not able to distinguish between the different alcohols. It only identifies one alcohol even though the model equation assumes two alcohols since this makes no difference to the minimization of the least squares as long as the values of the individual alcohols are not identifiable. This issue is effectively avoided by the inherent reconvolution in the estimation of the AED, which does not only resolve individual substrate kinetics from the experimental data but enables the identification of parameter estimates with a relatively small set of experimental data.
As in the case of single alcohol kinetics, it can be seen that the results for the local optimization are strongly dependent on the initial values (cf. Table S4) and that apparently local minima are found. The Km values stay nearly the same, while the vmax value is changed. This can be interpreted as an imprecise integration of the peak for the AED method. For competitive substrates, the statement remains identical. Starting with AED values as initial values for a subsequent NLR, the Km values stay nearly the same while the vmax value is changed. However, the SSE values decrease as the S.E. decreases considerably, implying better parameter identification.
In silico experiments with computed measured values show that an increase in the data points leads to a significant improvement in the S.E. by using the AED approach. Thus, the AED method is capable of performing model discrimination.

Identification of Substrates

In contrast to the estimated Km value of cofactor, in the context of competing substrate kinetics, the Km for the main substrate alcohol cannot be directly deducted from the peak’s position within the AED-based approach, as it reflects the summed-up concentration of all alcohols. Hence, in order to estimate the Km value for an individual alcohol, it becomes necessary to establish a relationship between the positions of the peaks and the respective alcohol concentrations. Therefore, the Km value of a component j in a multicomponent mixture with m components can be calculated from the position of the peak xPeak,j and the total concentrations of all components (in this case: alcohols) according to Equation (6):
K m , j = x P e a k , j × c C o m p o n e n t , j i = 1 m c C o m p o n e n t , i
As the vmax of the linear alcohol is significantly higher than the vmax of the secondary alcohol, it can be assumed that the bigger peak (which is equal to a higher vmax) represents propanol, which is why the smaller peak represents 2-butanol. Therefore, the Km estimated from the 50/50 mixture is 28.44 mM/2 = 14.22 mM, while the Km estimated from the 25/75 mixture is 62.60 mM/4 = 15.65 mM. The Km of pure propanol is 11.35 mM. Therefore, the Km value increases with decreasing alcohol content. This was to be expected since only the apparent Km value is observed in a mixture, which is defined according to Equation (7) [18]:
K m a p p = K m ( 1 + c i n h i b i t o r K i )
Therefore, the apparent Km must increase with an increase in the competing alcohol, which is the case. The Km value for NAD does not need to be corrected, as it is not a mixture of different cofactors. However, also in this case, the Km value increases from 0.55 mM (pure propanol) to 0.75 mM and 0.85 mM for a mixture of 50/50 and 25/75, respectively. However, conclusions must be chosen with great care since the standard error for the calculated parameters in the case of competing substrate kinetics is extremely large, even with the AED method. As mentioned above, the combination of AED and NRL minimally reduces the error. However, this effect may be only due to a different vmax value, as the Km values stay the same. This change in the vmax value may be due to the resolution of the grid surface. In the case of the small peak, the standard errors are even larger. Here, too, no statement can be made about the course of the Km value for 2-butanol. This may also be due to the fact that the influence of 2-butanol is too small due to the significantly lower reaction rate and may hardly stand out from the noise of the experimental values. Moreover, the underlying model may not reflect reality. As described in Section 2, there is some controversial discussion on this point. Further research may use a model-based design of experiments to reduce the standard error of estimated parameters and to support model discrimination [46]. Further research may address an independent validation of the experimental results by discrimination of different alcohols in the analysis, as was demonstrated for a simple uni–uni reaction via HPLC before [25]. For the given experimental set-up, an offline analytic is not reasonable, as the measuring sample cannot be taken by a closed spectrometer, and the reaction takes place within seconds.

4. Conclusions

In the present study the analysis of the AED was used for the first time for parameter estimation of a two-substrate kinetic. For simple two-substrate kinetics, the AED approach calculates different values than an NLR. The comparison with literature data shows that the AED approach is superior to the NLR and calculates more appropriate values with few data points. A Km value of 139.5 mM ± 54% was identified for the model alcohol 2-butanol and a Km value of 11.35 mM ± 15% for propanol. Corresponding Km values for the cofactor were 1.25 mM ± 76 and 0.55 mM ± 12%, respectively. In contrast, the NLR identified for both alcohols the same Km value of 1.30 mM with quite a larger standard error, and in both reactions, the same Km value of 3.11 mM for the cofactor. Furthermore, the AED approach does not require initial values but searches a predefined range, which corresponds to the measurement range. This is a clear strength of the AED approach. In addition, the AED approach is also usable for analyzing competing two-substrate kinetics. The AED approach independently determined the correct number of competing substrates—this did not need to be specified, unlike a model for the NLR. Furthermore, the NLR results were also found to be highly dependent on the initial values, which is not the case for the AED approach. For the example of propanol, the AED was able to detect an increase in the apparent Km value as expected due to the increasing influence of the 2-butanol. These Km values were 14.22 mM and 15.56 mM for a mixture of 50/50 and 25/75, respectively.

Supplementary Materials

The following supporting information can be downloaded at: https://www.mdpi.com/article/10.3390/pr11092686/s1, Details to iteration; Figure S1: AED analysis of ADH with (a) substrate 2-butanol and cofactor NAD at ambient temperature in 100 mM phosphate buffer (pH 8.8) and (b) substrate propanol and cofactor NAD at ambient temperature in 100 mM phosphate buffer (pH 8.8).; Figure S2: AED analysis of ADH with substrate propanol/2-butanol and cofactor NAD at ambient temperature in 100 mM phosphate buffer (pH 8.8) (a) 50/50 mol content (b) 25/75 mol content; Scheme S1: Schematic representation of AED algorithm; Table S1: Numerical data of initial slope experiments for ADH with 2-butanol or propanol as substrate at different substrate concentrations at ambient temperature in 100 mM phosphate buffer (pH 8.8), Table S2: Numerical data of initial slope experiments for ADH with propanol/2-butanol mixture at different substrate concentrations at ambient temperature in 100 mM phosphate buffer (pH 8.8), Table S3: Parameters obtained from NLR with different initial values for single substrate kinetics, Table S4: Parameters for NLR estimation with different initial values for mixture substrate kinetics for a mixture of propanol/2-butanol.

Author Contributions

Conceptualization, T.W. and M.S.; methodology, T.W.; software, T.W.; validation, T.W. and M.S.; formal analysis, T.W.; investigation, T.W.; resources, T.W. and M.S.; data curation, T.W. and M.S.; writing—original draft preparation, T.W. and M.S.; writing—review and editing, T.W. and M.S.; visualization, T.W.; project administration, T.W. All authors have read and agreed to the published version of the manuscript.

Funding

This research received no external funding.

Data Availability Statement

All numerical experimental data are available in Supplementary Materials section. The Matlab code for the AED calculation is available as a Gitlab project at https://collaborating.tuhh.de/v-4/psi-public/aed4biocatalysis.git (accessed on 4 September 2023).

Acknowledgments

The authors would like to thank Christoph Witthoefft for his fantastic work in the laboratory.

Conflicts of Interest

The authors declare no conflict of interest.

References

  1. Erdem, E.; Woodley, J.M. Industrially useful enzymology: Translating biocatalysis from laboratory to process. Chem Catal. 2022, 2, 2499–2505. [Google Scholar] [CrossRef]
  2. Cavalcante, F.T.T.; Cavalcante, A.L.G.; de Sousa, I.G.; Neto, F.S.; dos Santos, J.C.S. Current Status and Future Perspectives of Supports and Protocols for Enzyme Immobilization. Catalysts 2021, 11, 1222. [Google Scholar] [CrossRef]
  3. Benvenuto, M.A. Industrial Biotechnology; De Gruyter: Berlin, Germany, 2019. [Google Scholar]
  4. Straathof, A.J.J.; Wahl, S.A.; Benjamin, K.R.; Takors, R.; Wierckx, N.; Noorman, H.J. Grand Research Challenges for Sustainable Industrial Biotechnology. Trends Biotechnol. 2019, 37, 1042–1050. [Google Scholar] [CrossRef] [PubMed]
  5. Chapman, J.; Ismail, A.; Dinu, C. Industrial Applications of Enzymes: Recent Advances, Techniques, and Outlooks. Catalysts 2018, 8, 238. [Google Scholar] [CrossRef]
  6. Meyer, F.; Gasimov, N.; Bubenheim, P.; Waluga, T. Concept of an Enzymatic Reactive Extraction Centrifuge. Processes 2022, 10, 2137. [Google Scholar] [CrossRef]
  7. Wenda, S.; Illner, S.; Mell, A.; Kragl, U. Industrial biotechnology—The future of green chemistry? Green Chem. 2011, 13, 3007. [Google Scholar] [CrossRef]
  8. Lv, L.; Dai, L.; Du, W.; Liu, D. Progress in Enzymatic Biodiesel Production and Commercialization. Processes 2021, 9, 355. [Google Scholar] [CrossRef]
  9. Woodley, J.M. Biocatalysis for future sustainable manufacturing. Biochem. 2022, 44, 6–8. [Google Scholar] [CrossRef]
  10. Fernandes, P.; de Carvalho, C.C.C.R. Multi-Enzyme Systems in Flow Chemistry. Processes 2021, 9, 225. [Google Scholar] [CrossRef]
  11. Johannsen, J.; Meyer, F.; Engelmann, C.; Liese, A.; Fieg, G.; Bubenheim, P.; Waluga, T. Multi-enzyme cascade reaction in a miniplant two-phase-system: Model validation and mathematical optimization. AIChE J. 2021, 67, e17158. [Google Scholar] [CrossRef]
  12. Woodley, J.M. Accelerating the implementation of biocatalysis in industry. Appl. Microbiol. Biotechnol. 2019, 103, 4733–4739. [Google Scholar] [CrossRef]
  13. Siedentop, R.; Dziennus, M.; Lütz, S.; Rosenthal, K. Debottlenecking of an In Vitro Enzyme Cascade Using a Combined Model- and Experiment-Based Approach. Chem. Ing. Tech. 2023, 95, 543–548. [Google Scholar] [CrossRef]
  14. Boodhoo, K.; Flickinger, M.C.; Woodley, J.M.; Emanuelsson, E. Bioprocess intensification: A route to efficient and sustainable biocatalytic transformations for the future. Chem. Eng. Process. Process Intensif. 2022, 172, 108793. [Google Scholar] [CrossRef]
  15. Zavrel, M.; Kochanowski, K.; Spiess, A.C. Comparison of different approaches and computer programs for progress curve analysis of enzyme kinetics. Eng. Life Sci. 2010, 10, 191–200. [Google Scholar] [CrossRef]
  16. Archontoulis, S.V.; Miguez, F.E. Nonlinear Regression Models and Applications in Agricultural Research. Agron. J. 2015, 107, 786–798. [Google Scholar] [CrossRef]
  17. Bisswanger, H. Enzyme Kinetics: Principles and Methods, 3rd ed.; Enlarged and Improved Edition; Wiley-VCH: Weinheim, Germany, 2017; ISBN 9783527806461. [Google Scholar]
  18. Cornish-Bowden, A. Fundamentals of Enzyme Kinetics, 4th ed.; Wiley-VCH: Weinheim, Germany, 2012; ISBN 9783527665488. [Google Scholar]
  19. Straathof, A. Development of a computer program for analysis of enzyme kinetics by progress curve fitting. J. Mol. Catal. B Enzym. 2001, 11, 991–998. [Google Scholar] [CrossRef]
  20. Brendel, M.; Bonvin, D.; Marquardt, W. Incremental identification of kinetic models for homogeneous reaction systems. Chem. Eng. Sci. 2006, 61, 5404–5420. [Google Scholar] [CrossRef]
  21. Michalik, C.; Schmidt, T.; Zavrel, M.; Ansorge-Schumacher, M.; Spiess, A.; Marquardt, W. Application of the incremental identification method to the formate oxidation using formate dehydrogenase. Chem. Eng. Sci. 2007, 62, 5592–5597. [Google Scholar] [CrossRef]
  22. Buzzi Ferraris, G.; Forzatti, P.; Emig, G.; Hofmann, H. Sequential experimental design for model discrimination in the case of multiple responses. Chem. Eng. Sci. 1984, 39, 81–85. [Google Scholar] [CrossRef]
  23. Ohs, R.; Leipnitz, M.; Schöpping, M.; Spiess, A.C. Simultaneous identification of reaction and inactivation kinetics of an enzyme-catalyzed carboligation. Biotechnol. Prog. 2018, 34, 1081–1092. [Google Scholar] [CrossRef]
  24. Michalik, C.; Stuckert, M.; Marquardt, W. Optimal Experimental Design for Discriminating Numerous Model Candidates: The AWDC Criterion. Ind. Eng. Chem. Res. 2010, 49, 913–919. [Google Scholar] [CrossRef]
  25. Waluga, T.; Klein, M.; Skiborowski, M. On the Use of the Adsorption Energy Distribution for the Analysis of Competing Substrate Kinetics. Ind. Eng. Chem. Res. 2023, 62, 355–364. [Google Scholar] [CrossRef]
  26. Sanghani, P.C.; Robinson, H.; Bennett-Lovsey, R.; Hurley, T.D.; Bosron, W.F. Structure-function relationships in human Class III alcohol dehydrogenase (formaldehyde dehydrogenase). Chem. Biol. Interact. 2003, 143–144, 195–200. [Google Scholar] [CrossRef] [PubMed]
  27. Chou, C.-F.; Lai, C.-L.; Chang, Y.-C.; Duester, G.; Yin, S.-J. Kinetic mechanism of human class IV alcohol dehydrogenase functioning as retinol dehydrogenase. J. Biol. Chem. 2002, 277, 25209–25216. [Google Scholar] [CrossRef]
  28. Mahler, H.R.; Douglas, J. Mechanisms of Enzyme-catalyzed Oxidation-Reduction Reactions. I. An Investigation of the Yeast Alcohol Dehydrogenase Reaction by Means of the Isotope Rate Effect 1,2. J. Am. Chem. Soc. 1957, 79, 1159–1166. [Google Scholar] [CrossRef]
  29. Dickinson, F.M.; Monger, G.P. A study of the kinetics and mechanism of yeast alcohol dehydrogenase with a variety of substrates. Biochem. J. 1973, 131, 261–270. [Google Scholar] [CrossRef] [PubMed]
  30. Ganzhorn, A.J.; Green, D.W.; Hershey, A.D.; Gould, R.M.; Plapp, B.V. Kinetic characterization of yeast alcohol dehydrogenases. Amino acid residue 294 and substrate specificity. J. Biol. Chem. 1987, 262, 3754–3761. [Google Scholar] [CrossRef]
  31. Wratten, C.C.; Cleland, W.W. Kinetic Studies with Liver Alcohol Dehydrogenase*. Biochemistry 1965, 4, 2442–2451. [Google Scholar] [CrossRef]
  32. Silverstein, E.; Boyer, P.D. Equilibrium Reaction Rates and the Mechanisms of Liver and Yeast Alcohol Dehydrogenase. J. Biol. Chem. 1964, 239, 3908–3914. [Google Scholar] [CrossRef]
  33. Mazid, M.A.; Laidler, K.J. pH dependence of free and immobilized yeast alcohol dehydrogenase kinetics. Can. J. Biochem. 1982, 60, 100–107. [Google Scholar] [CrossRef] [PubMed]
  34. Klinman, J.P. The Mechanism of Enzyme-catalyzed Reduced Nicotinamide Adenine Dinucleotide-dependent Reductions. J. Biol. Chem. 1972, 247, 7977–7987. [Google Scholar] [CrossRef] [PubMed]
  35. Jaroniec, M. Physical adsorption on heterogeneous solids. Adv. Colloid Interface Sci. 1983, 18, 149–225. [Google Scholar] [CrossRef]
  36. Stanley, B.J.; Guiochon, G. Numerical estimation of adsorption energy distributions from adsorption isotherm data with the expectation-maximization method. J. Phys. Chem. 1993, 97, 8098–8104. [Google Scholar] [CrossRef]
  37. Stanley, B.J.; Guiochon, G. Importance of the Accuracy of Experimental Data in the Nonlinear Chromatographic Determination of Adsorption Energy Distributions. Langmuir 1994, 10, 4278–4285. [Google Scholar] [CrossRef]
  38. Nealon, C.M.; Musa, M.M.; Patel, J.M.; Phillips, R.S. Controlling Substrate Specificity and Stereospecificity of Alcohol Dehydrogenases. ACS Catal. 2015, 5, 2100–2114. [Google Scholar] [CrossRef]
  39. Alcohol-Dehydrogenase aus Saccharomyces Cerevisiae ≥300 units/mg Protein, Lyophilized Powder (Contains Buffer Salts) | Sigma-Aldrich. Available online: https://www.sigmaaldrich.com/DE/de/product/sigma/a7011 (accessed on 21 April 2023).
  40. Pietruszko, R.; Crawford, K.; Lester, D. Comparison of substrate specificity of alcohol dehydrogenases from human liver, horse liver, and yeast towards saturated and 2-enoic alcohols and aldehydes. Arch. Biochem. Biophys. 1973, 159, 50–60. [Google Scholar] [CrossRef]
  41. Biegler, L.T.; Damiano, J.J.; Blau, G.E. Nonlinear parameter estimation: A case study comparison. AIChE J. 1986, 32, 29–45. [Google Scholar] [CrossRef]
  42. Rangheard, M.S.; Langrand, G.; Triantaphylides, C.; Baratti, J. Multi-competitive enzymatic reactions in organic media: A simple test for the determination of lipase fatty acid specificity. Biochim. Biophys. Acta 1989, 1004, 20–28. [Google Scholar] [CrossRef]
  43. Rangheard, M.-S.; Langrand, G.; Triantaphylides, C.; Baratti, J. Multi-competitive enzymatic reactions in organic media: Application to the determination of lipase alcohol specificity. Enzym. Microb. Technol. 1992, 14, 966–974. [Google Scholar] [CrossRef]
  44. Bornadel, A.; Akerman, C.O.; Adlercreutz, P.; Hatti-Kaul, R.; Borg, N. Kinetic modeling of lipase-catalyzed esterification reaction between oleic acid and trimethylolpropane: A simplified model for multi-substrate multi-product ping-pong mechanisms. Biotechnol. Prog. 2013, 29, 1422–1429. [Google Scholar] [CrossRef]
  45. Kuo, Y.-M.; Henry, R.A.; Andrews, A.J. Measuring specificity in multi-substrate/product systems as a tool to investigate selectivity in vivo. Biochim. Biophys. Acta 2016, 1864, 70–76. [Google Scholar] [CrossRef] [PubMed]
  46. Franceschini, G.; Macchietto, S. Model-based design of experiments for parameter precision: State of the art. Chem. Eng. Sci. 2008, 63, 4846–4872. [Google Scholar] [CrossRef]
Figure 1. Diagrammatic representation showcasing the utilization of the AED approach in the context of an enzymatic bi–bi reaction. (a) Empirically obtained dataset of reaction rates featuring simultaneous manipulation of substrate concentrations. (b) AED estimated via analysis of empirical data. (c) Model fitting process leading to a response surface, constructed using parameters extrapolated from the AED analysis.
Processes 11 02686 g001
Figure 2. Kinetic analysis of ADH with substrate 2-butanol and cofactor NAD at ambient temperature in 100 mM phosphate buffer (pH 8.8). (a) AED-based estimation; (b) regression by NRL with initial values of vmax = 1, Km1 = 1, and Km2 = 1.
Processes 11 02686 g002
Figure 3. Kinetic analysis of ADH with substrate mixture propanol/2-butanol and cofactor NAD at ambient temperature in 100 mM phosphate buffer (pH 8.8), Area represents sum of two individual kinetics according to Equation (1). (a) AED-based estimation for 50/50; (b) AED-based estimation for 25/75.
Processes 11 02686 g003
Table 1. Overview of advantages and disadvantages of NLR and AED method.
MethodAdvantageDisadvantage
NLRFast calculation (ms–s), established method, diverse (commercial) tools (with GUI) available, many of different solvers availableInitial value necessary, results depends on initial values, local minima can be found, number of competing substrates needs to be known, competing substrates must be analyzed individually, more experimental data necessary
AEDNo initial values necessary, jet results are independent of initial values. Automatic identification of competing substrates, therefore no need for time-consuming individual analysis, EM algorithm is guaranteed to converge to the global optimum at every iteration for Poisson and Gaussian distribution data, less experimental data necessarySlow calculation (s–min), complex method, limited solvers available
Table 2. Reaction kinetic parameters of ADH for 2-butanol and propanol determined via AED-based estimation and NLR with initial values of vmax = 1, Km1 = 1, and Km2 = 1.
AlcoholParameterAEDNLR
ValueS.E. [%]ValueS.E. [%]
2-butanolvmax [mol s−1 g−1]3.06 × 10−745.71.96× 10−7193.05
Km,alc [mM]139.5053.81.30389.65
Km,NAD [mM]1.2576.23.11280.62
SSE0.652.66
propanolvmax [mol s−1 g−1]8.00 × 10−63.91.60 × 10−595.17
Km,alc [mM]11.3514.51.30192.10
Km,NAD [mM]0.5511.73.11138.34
SSE0.00560.60
Table 3. Reaction kinetic parameters of ADH for a mixture of propanol/2butanol (mol content) determined via AED-based estimation.
PeakParameter50/5025/75
ValueS.E. [%]ValueS.E. [%]
1vmax1 [mol s−1 g−1]3.35 × 10−647093.53 × 10−6929
Km,alc1 [mM]28.44551762.60792
Km,NAD1 [mM]0.7512020.85298
2vmax2 [mol s−1 g−1]1.54 × 10−698652.83 × 10−711,796
Km,alc2 [mM]2.8137,72411.3514,225
Km,NAD2 [mM]1.1551460.653641
SSE1.49540.0650
Table 4. Reaction kinetic parameters of ADH for a mixture of propanol/2-butanol (mol content) determined via NLR with initial values of vmax = 1, Km1 = 1, and Km2 = 1.
PeakParameter50/5025/75
ValueS.E. [%]ValueS.E. [%]
1vmax1 [mol s−1 g−1]1.41 × 10−51 × 10119.39 × 10−63 × 1010
Km,alc1 [mM]1.044 × 1071.102 × 107
Km,NAD1 [mM]3.141 × 1073.185 × 106
2vmax2 [mol s−1 g−1]00
Km,alc2 [mM]1.047 × 10251.102 × 1025
Km,NAD2 [mM]3.142 × 10263.181 × 1026
SSE18.739415.0992
Disclaimer/Publisher’s Note: The statements, opinions and data contained in all publications are solely those of the individual author(s) and contributor(s) and not of MDPI and/or the editor(s). MDPI and/or the editor(s) disclaim responsibility for any injury to people or property resulting from any ideas, methods, instructions or products referred to in the content.