Abstract
It is difficult to determine the main microscopic factors controlling reservoir quality due to the strong microscopic heterogeneity of tight sandstone reservoirs, which also makes it difficult to distinguish dominant reservoirs. At the same time, there are fewer experimental samples available, and data collected from relevant research are thus worth paying attention to. In this study, based on the experimental results of high-pressure mercury injection of 25 rock samples from Chang 6 reservoir in the Wuqi area, Lasso dimensionality reduction was used to reduce the dimensionality of 14 characteristic parameters to 6, which characterize the microscopic pore structure, while a combination of different kernel functions was used to construct the multi-kernel function of the multi-kernel model to be determined. A multi-kernel support vector machine (MK-SVM) model was established for unsupervised learning of microscopic pore structure characteristic parameters that affect reservoir quality. By optimizing the hyperparameters of the model and obtaining the optimal decision function, the tight sandstone reservoirs were classified into classes I, II and III, and the classification results were verified. The results show that the accuracy of the proposed reservoir classification method is as high as 86%, which can effectively reduce the time loss and save labor costs. It provides an effective method for the comprehensive evaluation of tight sandstone reservoirs.
1. Introduction
The huge resource potential of tight oil and the rapid growth of production make it one of the hottest oil exploration and research fields today [1,2]. However, tight sandstone reservoirs are characterized by poor physical properties, a small pore throat and strong microscopic heterogeneity, resulting in poor resource quality and strong economic sensitivity for development and utilization. Therefore, development should be carried out in stages and types under the condition of relatively consistent economic and technological strategies [3,4,5,6,7,8,9]. Reservoir classification aims to sort the reservoirs in the study area according to their qualities, which is an important basis for development selection, well placement, productivity prediction and development plan formulation. Differing from conventional reservoirs, the pore throat radius of tight sandstone reservoirs is mostly at the micron scale. The particularity of their complex pore structure puts forward higher requirements for the accuracy and method of classification and counting for tight sandstone reservoirs [10,11,12,13,14]. There are three conventional reservoir classification methods. The first is single-parameter classification, which only considers a single parameter for reservoir classification; the second is the geological empirical method based on field practice [15,16]; and the third is the multivariate statistical analysis method based on mathematical statistics [17,18,19], which uses mathematical methods such as geostatistics, cluster analysis and fuzzy identification to quantitatively characterize and classify reservoirs.
In recent years, many scholars have introduced new techniques and methods to classify reservoirs and have achieved certain results. On the one hand, the evaluation parameters of macroscopic reservoir characteristics such as porosity, permeability, effective sand body thickness and oil saturation have gradually been developed to evaluate microscopic pore structure characteristic parameters based on new methods such as constant velocity mercury injection, high-pressure mercury injection and nuclear magnetic resonance [20,21,22]. For example, oil reservoirs can be classified according to new parameters of oil migration and seepage experiments, while conventional oil reservoirs can be classified into four types according to their sensitivity to stress in tight reservoirs and their effects on oil saturation [23]; at the same time, sandstone reservoirs have the characteristics of poor physical properties and a small pore throat. There are many studies on the mechanical properties of sandstone, and in order to clarify the mechanical and permeability characteristics of fractured limestone in a complete stress–strain process, hydro-mechanical coupling tests with various differential water pressures and confining pressures were performed. A cubic polynomial was used to describe the relationship between permeability and volumetric strain at the volumetric compression stage by Zhao [24]. To further study the mechanical characteristics and deformation control scheme of a roadway with weakly cemented siltstone as the roof, Weijian Yu took Linchang coal mine as the research background and adopted field investigation methods, laboratory experiments, and theoretical analysis [25]. Tight gas reservoirs are valuable yet challenging unconventional resources as a result of their complex flow mechanisms. Hence, it is beneficial to regulate the rate of the water cut increase in order to enhance production in tight gas reservoirs based on a gas−water two-phase flow model with consideration of a threshold pressure gradient [26].
On the other hand, with the rapid development of artificial intelligence, machine learning methods such as Neural Networks, Support Vector Machines, Bayesian Classification, Random Forests, Extreme Gradient Boosting (XGB), Multilayer Perceptron (MLP), and K-Nearest Neighbors (KNN), etc., are getting better, and these research methods have the characteristics of strong generalization and convenience in practical application. Compared with the traditional method, it has more advantages and has gradually been widely used in the field of oil and gas field geology and development [27,28,29]. For example, the use of multi-resolution graph-based clustering to optimize conventional logging sensitive to electro-clustering analysis can correlate the characteristics of each identified electrical phase in geophysics, thus helping to select the six best lithofacies [30]. In practice, it is also found that the prediction effect of machine learning methods is highly dependent on the data themselves, and different machine learning methods have different adaptation conditions. For example, the BP neural network model is highly dependent on the region, and imperfect data samples will greatly affect the credibility of the prediction results. The random forest model has high efficiency for the classification of multi-dimensional feature datasets, but it will overfit in the classification or regression problems with loud data noise, and the resulting attribute weights are not credible. In contrast, the MK-SVM has unique advantages and perfect theory in terms of data volume requirements, providing an obvious classification effect for the single classification problem, and effectively dealing with the most common multi-parameter and small sample problems in the practical application of oilfields [31,32,33,34,35].
In this work, on the basis of high-pressure mercury injection, cast thin sections and petrophysical experiments, Lasso dimensionality reduction is adopted to reduce the dimensionality of the parameters characterizing the microscopic pore structure characteristics, and the multi-core kernel function to be determined in the multi-core model is constructed by combining different kernel functions. Then, the MK-SVM model was established to conduct unsupervised learning of the microscopic pore structure characteristic parameters affecting reservoir quality. Moreover, by optimizing the model hyperparameters in this study, the optimal decision function was obtained, and then the tight sandstone reservoirs were classified so as to provide guidance for an in-depth understanding and fine evaluation of tight oil and gas reservoir development.
2. MK-SVM Model and Experiments Methods
2.1. Sample Preparation
The microscopic pore structure characteristic parameters of 25 rock samples in Chang 6 reservoir in the study area were used as sample data, and the min-max scaling was used for preprocessing, and then the L1 regularization of LASSO was used to reduce the dimensionality of the data. The multi-core kernel function of the multi-core model to be determined was constructed via the combination of different kernel functions, and the samples were divided into a training set and test set according to a ratio of 75:25, so as to realize the training and testing of the model. Through a series of experiments, the optimal combination of the multi-kernel kernel function of the multi-kernel SVM model was obtained to realize the classification of reservoir data.
2.2. Data Preprocessing and Lasso Dimensionality Reduction
The Lasso dimensionality reduction method is a compression estimation method based on the idea of reducing the variable set—that is, reducing the order. By constructing a penalty function, it can compress the coefficients of variables and cause some regression coefficients to become 0, so as to achieve the purpose of variable selection. The Lasso regression function is:
where is the number of samples, is the regression coefficient, is the sample, is the sample label, the first accumulated calculation result is the loss function of the model regression, and the second accumulated result is the regularization term, where is the shrinkage factor and is the norm. Fourteen characteristic parameters of the microscopic pore structure, such as the seepage coefficient, displacement pressure, maximum pore throat radius, median pressure, median radius, mean coefficient, sorting coefficient, skew coefficient, variation coefficient, maximum mercury injection saturation, residual mercury saturation, unsaturated mercury saturation, mercury removal efficiency and pore–throat ratio are reduced to 6 characteristic parameters, which are the structural seepage coefficient, displacement pressure, median radius, mean coefficient, mercury rejection efficiency and pore–throat ratio, according to the above steps.
The correlation heat map of each feature parameter after dimensionality reduction is shown in Figure 1, which shows that the structural seepage coefficient is negatively correlated with the drainage pressure, the median radius is positively correlated with the structural seepage coefficient, the pore–throat ratio is almost linearly independent of the structural seepage coefficient, mercury removal efficiency and drainage pressure.
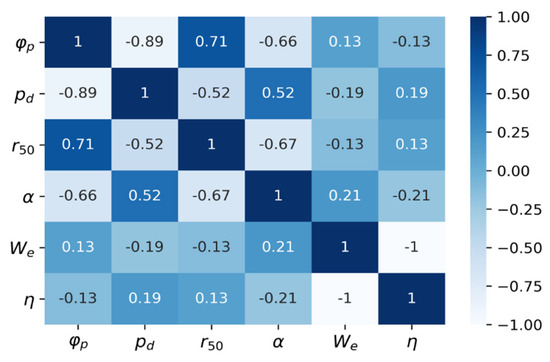
Figure 1.
Correlation heat map of each feature parameter.
In Figure 1, is the structural seepage coefficient, is the displacement pressure, is the median radius, is the mean coefficient, is the mercury removal efficiency and is the pore–throat ratio.
2.3. The MK-SVM Model
In this work, there are mainly seven kinds of kernel function: the Gaussian radial basis kernel function, the exponential kernel function, the Laplacian kernel function, the multiquadric kernel function, the linear kernel function, the polynomial kernel function, and the sigmoid kernel function. A linear combination of kernel functions is constructed by assigning different weight coefficients to each kernel function. The discriminant function of multi-core SVM is as follows:
where is the sample vector in the sample space, is the number of vectors in the sample vector, is the weight vector, is the label corresponding to the input sample, and is the bias. is the number of kernel functions, taken as 5 in this paper, is the weight coefficient of each kernel function, and , is the linear combination of several types of kernel functions constructed.
2.4. Experimental Methods
2.4.1. The Calculation Process of the Kernel Function Coefficient of the MK-SVM Model
Step 1. Constructing the Output Matrix O of the sample by using the vector Y composed of the real labels of the training set sample, and constructing the square matrix according to Y*YT;
Step 2. Constructing a series of kernel function mapping matrices, referred to as the kernel matrix Ai, the dimension of each kernel matrix is the number of training set samples, and the elements in the kernel matrix are the values after a single kernel function mapping;
Step3. The product of the kernel matrix Ai of a single kernel function and the output matrix O constitutes the matrix corresponding to the training set sample under the kernel function characterization, and the trace Ji of the matrix was obtained;
Step 4. The normalized trace Ji is the coefficient βi corresponding to a single kernel function. The sum of each single kernel function and its coefficient product forms the kernel function of the MK-SVM model.
2.4.2. Combination Experiments of Five Kinds of Kernel Function
Linear combinations of five types of kernel functions, such as the linear kernel function, polynomial kernel function, multiquadric kernel function, sigmoid kernel function and exponential kernel function, were selected for 10 experiments (the kernel function ID number is 01–25). The experimental results show that selecting the kernel functions with ID numbers of 4, 11, 17, and 23 and substituting them into the MK-SVM model for calculation has obvious advantages.
In Figure 2, the abscissa represents the corresponding ID number of the kernel function combination under different hyperparameters. The ordinate in Figure 2a corresponds to the index Macro_Precision, and Figure 2b corresponds to the Macro_F1_score. The orange solid line in the figure represents the median of the 10 experimental results, and the blue dotted line represents the mean of the 10 experimental results. The diamonds represent the outliers, and the position of the median can determine the distribution of the data in the 10 experimental results. The average level of the test results can be judged from the position of the mean value, while the convergence and stability of the model can be judged from the length of the box. The middle line of the box is the median of the data, which represents the average level of the sample data, while the upper and lower limits of the box are the upper and lower quartiles of the data, respectively. This means that the bin contains 50% of the data. Therefore, the width of the bins reflects, to a certain extent, the degree of fluctuation in the data.
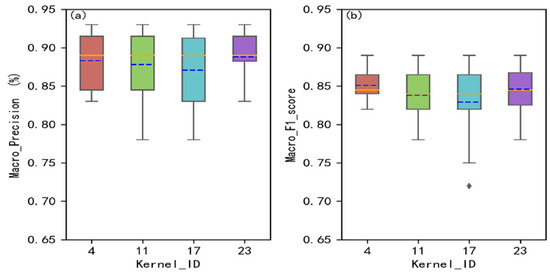
Figure 2.
Five types of kernel function. Combination experiments with ID numbers 4, 11, 17, and 23. (a) index Macro_Precision; (b) Macro_F1_score.
Combining Figure 2 and Table 1, it can be seen that the accuracy of reservoir classification can reach 86.0%, the Macro_Precision can reach 88.8%, and the Macro_F1_Score can reach 0.846 when the kernel function combination with ID No. 23 is selected for calculation in the MK-SVM model.

Table 1.
Mean results of performance indicators. Corresponding to 10 experiments on five types of kernel functions.
2.4.3. Combination Experiments of Four Kinds of Kernel Function
The linear kernel, polynomial kernel, multiquadric kernel and sigmoid kernel are combined with the kernel functions with ID numbers 26–32, and the kernel functions with ID 33–38 can be combined with the linear kernel, polynomial kernel, Gaussian kernel and sigmoid kernel. The linear kernel, polynomial kernel, multiquadric kernel and Laplacian kernel are combined with the kernel functions with ID 39–44, and the kernel functions with ID 45–51 are combined with the linear kernel, polynomial kernel, multiquadric kernel and exponential kernel. The experimental results show that the kernel functions with ID numbers 29, 35, 42, and 47 have obvious advantages when substituting them into MK-SVM for calculation.
Combining Figure 3 and Table 2, it can be seen that the kernel function combination with ID 42 is selected for calculation in the MK-SVM model. According to the judgment method described above, the accuracy of reservoir classification can reach 86.0%, and the Macro_Precision can reach 88.8%. The Macro_F1_score can reach 0.848.
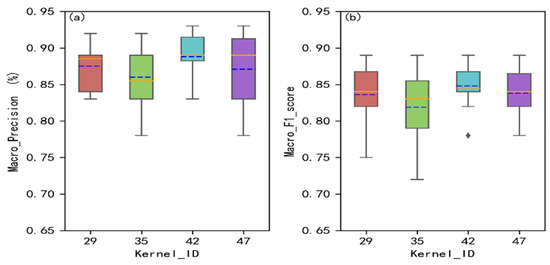
Figure 3.
Four types of kernel function. Combination experiments with ID numbers 29, 35, 42, 47. (a) index Macro_Precision; (b) Macro_F1_score.
Table 2.
Mean results of performance indicators. Corresponding to 10 experiments on four types of kernel functions.
2.4.4. Combination Experiments of Three Kinds of Kernel Function
The kernel functions with ID numbers 52–58 are combined with the linear kernel, polynomial kernel and Gaussian kernel, and the kernel functions with ID numbers 59–64 are combined with the linear kernel, polynomial kernel and multiquadric kernel. At the same time, the combination of kernel functions with ID 65 and 66 could not be fitted, so no hyperparameter adjustment was made. Therefore, by conducting 10 experiments on the combination of kernel functions with ID 56, 63, 65 and 66 and comparing their performance, it can be seen from Figure 4 and Table 3 that the kernel function combination with ID number 63 is selected for calculation in the MK-SVM model, and the accuracy of the reservoir classification can reach 84.5%, the Macro_Precision can reach 87.6%, and the Macro_F1_score can reach 0.826.
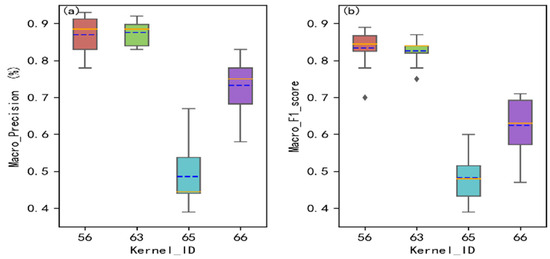
Figure 4.
Three types of kernel function. Combination experiments with ID numbers 56, 63, 65, and 66. (a) index Macro_Precision; (b) Macro_F1_score.
Table 3.
Mean results of performance indicators. Corresponding to 10 experiments on three types of kernel functions.
3. Microscopic Pore Structure Characteristics of Different Classes of Reservoirs
3.1. The Relationship between Porosity and Permeability
Nano pores account for the largest proportion in tight reservoirs and have a very important impact on the physical properties of reservoirs [21]. In order to further verify the accuracy of the comprehensive evaluation and prediction model (MK-SVM) of reservoirs, the relationship between porosity and permeability of class I, II, and III reservoirs was deeply analyzed. It can be seen from Figure 5 that there is an obvious positive correlation between the porosity and permeability of the I, II and III reservoirs, and the correlation coefficients R2 are all greater than 0.85, which shows that in the same type of reservoir, the microscopic development degree of pores has a strong control effect on the seepage capacity of the reservoir. It is further proved that the accuracy of the MK-SVM model is sufficient to provide reliable prediction results.
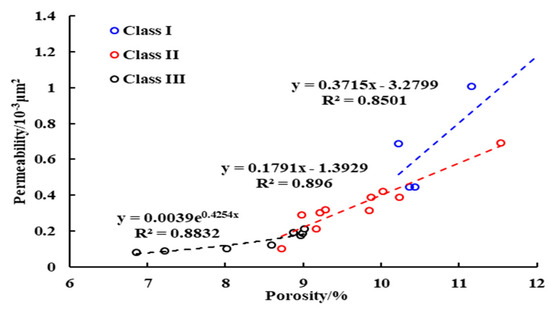
Figure 5.
Relationship between the porosity and permeability of different classes of reservoirs.
3.2. Storage Space
The samples in this work were collected from Chang 6 reservoir in Yanchang Formation in the Wuqi area, Ordos Basin. The porosity and permeability of the measured samples combined with previous studies show that the reservoir is a typical tight sandstone reservoir with low permeability and extra low permeability, the lithology is mainly feldspar sandstone, the clastic particles are well sorted, the roundness is sub-angular, and the cementation types are mostly pore-film, thin film, and enlarged-pore cementation. The main pore types are residual intergranular pores, feldspar soluble pores and lithic soluble pores [21]. The difference in reservoir space between different types of reservoirs is shown in Figure 6. According to Figure 6, the porosity development degree and connectivity of class I, II and III reservoirs become worse in turn.
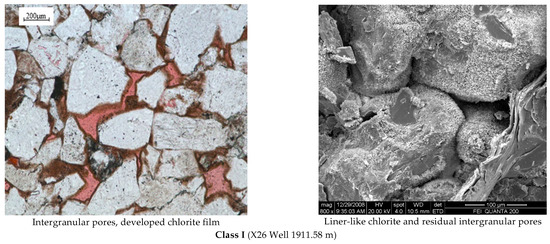
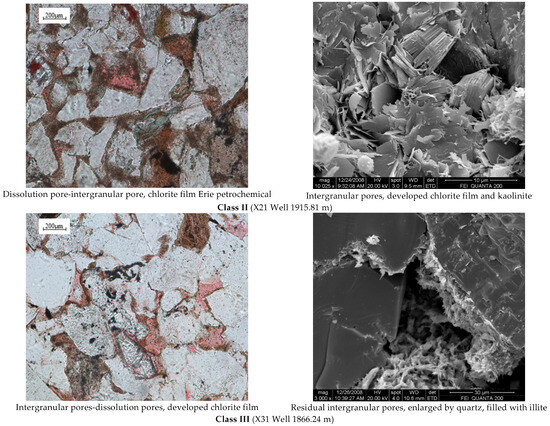
Figure 6.
Reservoir space of different classes of reservoirs.
3.3. Microscopic Pore Structural Characteristics
Based on the experimental data of high-pressure mercury injection, the reservoirs are classified into classes I, II and III via MK-SVM prediction. The capillary pressure curves and microscopic pore structure characteristic parameters of different types of reservoirs (25 rock samples) are shown in Table 4.
Table 4.
Physical properties and microscopic pore structure characteristic parameters of different classes of reservoirs.
As can be seen from Table 4, the capillary pressure curve of class I reservoirs is inclined to the lower left, and the drainage pressure is relatively low, ranging from 0.287 to 0.722 MPa, with an average value of 0.421 MPa and an average median radius of 0.209 μm. At the early stage of mercury injection, the curve is flat, indicating that the capillary pressure corresponds to the relatively large throat controlled by a large number of pores, meaning that the pore–throat connectivity is better. The platoon pressure of the capillary pressure curve of the class II reservoir is higher, ranging from 0.293 MPa to 0.744 MPa, with an average of 0.599 MPa. The mean value of the median radius was 0.111 μm, and the mean coefficient was large, indicating that the pore–throat distribution was relatively uniform, the distribution of the throat radius was concentrated, the pore–throat connectivity was good, and the mercury injection curve showed a long flat segment. The capillary pressure curve of the class III reservoir has the highest drainage pressure, which is 1.134–1.169 MPa, with an average value of 1.149 MPa. The median radius was small, with an average value of 0.061 μm, indicating that the pore space controlled by throats of each magnitude was not different, and macropores were not developed.
4. Results and Discussion
4.1. Kernel Function after MK-SVM Model Optimization
As can be seen from the above experiments in Section 2, the kernel function with ID 42 was selected from the MK-SVM model for calculation, and the corresponding coefficients of each single core function in the kernel function are shown in Table 5 for 10 experiments. By analyzing Table 5, it can be seen that in multi-kernel function No. 42, the coefficient of the linear kernel is 0.2558746, the coefficient of the polynomial kernel is 0.2630193, the coefficient of the multivariate quadratic kernel is 0.2508263 and the coefficient of the Laplace kernel is 0.2302798. Thus, the optimized kernel function formula is as follows:
Table 5.
The results of the coefficients corresponding to each kernel. The single kernel function in the No. 42 kernel function in 10 experiments.
4.2. Comparison of MK-SVM with Other Classification Models
The MK-SVM model is compared with the Extra-Trees classification model, the Polynomial SVM model and the RBF SVM model. The results are shown in Figure 7 and Table 6.
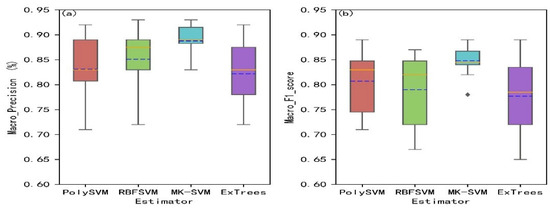
Figure 7.
Comparison of four types of models. (a) index Macro_Precision; (b) Macro_F1_score.
Table 6.
Performance index results in 10 experiments on four types of models.
It can be seen from Figure 7a and Table 6 that the Macro_Precision of the MK-SVM model proposed in this study is 3.7% higher than that of the RBF-SVM model, with better performance than other comparative models. The data waveform degree of Macro_Precision in the proposed MK-SVM model is 75.26% lower than that of the RBF-SVM model. According to Figure 7b and Table 6, the MK-SVM model proposed in this study can achieve a 4.1% increase in the F1_ score compared to the SVM model, with better performance than other comparative models, and the degree of data fluctuation of the F1_score in the MK-SVM model proposed decreases by 76.54% compared with the SVM model. As can be seen from Table 6, the accuracy of the MK-SVM model proposed in this study increases by 4.5% compared with the SVM model, with better performance than other comparative models. Therefore, the proposed MK-SVM model based on microscopic pore structure characteristic parameters can classify tight reservoirs with an accuracy of 86.0%.
4.3. Validation of Experimental Results
Based on the high-pressure mercury injection experimental data and dimensionality-reduction results of 25 rock samples in the study area, the reservoir can be classified into classes I, II and III by using four prediction types—Polynomial SVM, RBF SVM, MKL and Extra Trees. The capillary pressure (mercury injection) curve characteristics are shown in Figure 8. As can be seen from Figure 8, the boundary of capillary pressure curves of the three types of reservoirs obtained via the MK-SVM comprehensive evaluation and prediction model is the most obvious, and the reservoir classification results are very suitable for the classification and evaluation of the Chang 6 tight sandstone reservoir in the study area.
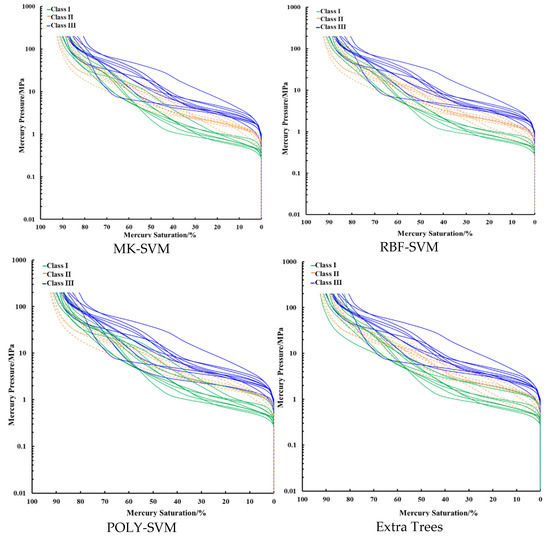
Figure 8.
Capillary pressure curve characteristics of different classes of reservoirs.
5. Conclusions
In this work, the Lasso dimensionality reduction method was used to realize the selection of major microscopic features of tight sandstone and the MK-SVM model was used to complete the classification of tight sandstone reservoirs. In addition, the performance of the MK-SVM model under different kernel function combinations is discussed in detail, from which the optimal solution is found to complete the classification of tight sandstone reservoirs, and the comparison with the traditional classification method and other three machine learning methods shows the accuracy of the classification results of the model in this paper. Therefore, the following conclusions can be obtained.
- (1)
- There are obvious differences in the physical properties, storage space, capillary pressure curve and microscopic pore structure between different classes of reservoirs. The porosity development degree, connectivity and physical properties of class I, II and III reservoirs are successively worse. The drainage pressure, mean coefficient and pore–throat ratio increase successively in class I, II and III reservoirs.
- (2)
- The comprehensive evaluation method of tight sandstone reservoirs based on MK-SVM, compared with the traditional method, has obvious reservoir classification effects, and can effectively deal with the most common multi-parameter and small sample problems in the practical application of oilfields. It provides an effective method for the comprehensive evaluation of tight sandstone reservoirs.
- (3)
- From the classification results of the Chang 6 tight sandstone reservoir in the study area, it can be seen that the accuracy of the comprehensive evaluation and prediction model of tight sandstone reservoir based on MK-SVM is higher than 86.0%, indicating that this method is an effective method for the classification and evaluation of tight sandstone reservoirs.
Author Contributions
Writing—original draft, X.L.; Formal analysis, X.X.; Investigation, K.H.; Data curation, B.Z. All authors have read and agreed to the published version of the manuscript.
Funding
This work was financially supported by the National Natural Science Foundation of China (41802166), and Shaanxi Province Natural Science Foundation Research Project (2022JM-166 and 2017JQ4005), we are grateful for the support of these projects.
Data Availability Statement
The data used to support the results of this study are included within the manuscript.
Conflicts of Interest
The authors declare no conflict of interest.
References
- Zou, C.N.; Zhang, G.S.; Yang, Z. Concept, characteristics, potential and technology of unconventional oil and gas-also on unconventional oil and gas geology. Pet. Explor. Dev. 2013, 40, 385–399. [Google Scholar] [CrossRef]
- Jia, C.Z.; Zou, C.N.; Li, J.Z.; Li, D.H.; Zheng, M. Evaluation criteria, main types, basic characteristics and resource prospects of tight oil in China. Acta Pet. Sin. 2012, 33, 343–349. [Google Scholar]
- Ren, D.Z.; Zhou, D.S.; Liu, D.K.; Dong, F.J.; Ma, S.W.; Huang, H. Formation mechanism of the Upper Triassic Yanchang Formation tight sandstone reservoir in Ordos Basin-Take Chang 6 reservoir in Jiyuan oil field as an example. J. Pet. Sci. Eng. 2019, 178, 497–505. [Google Scholar] [CrossRef]
- Liu, D.; Sun, W.; Ren, D. Experimental Investigation of Pore Structure and Movable Fluid Traits in Tight Sandstone. Processes 2019, 7, 149. [Google Scholar] [CrossRef]
- Zhang, L.; Liu, X.; Zhao, Y.; Zhou, Y.; Shan, B. Effect of pore throat structure on micro-scale seepage characteristics of tight gas reservoirs. Nat. Gas Ind. B 2020, 7, 160–167. [Google Scholar] [CrossRef]
- Dai, J.X.; Nin, Y.Y.; Wu, X.Q. Tight gas in China and its significance in exploration and exploitation. Pet. Explor. Dev. 2012, 39, 257–264. [Google Scholar] [CrossRef]
- Cai, X.Y.; Qiu, G.Q.; Zhu, Q.; Wang, W.; Zeng, Z.P. Types and characteristics of tight sandstone sweet spots in largebasins of central western China. Oil Gas Geol. 2020, 41, 684–695. [Google Scholar]
- Dong, F.J.; Lu, X.F.; Cao, Y.; Rao, X.J.; Sun, Z.Y. Microscale Pore Throat Differentiation and Its Influence on the Distribution of Movable Fluid in Tight Sandstone Reservoirs. Geofluids 2021, 2021, 6654773. [Google Scholar] [CrossRef]
- Ren, D.Z.; Sun, W.; Wei, H.; Zhou, S.X.; Zhang, Y.G.; Zhang, X. Types of Sandstone Reservoir Diagenetic Facies and Microscopic Pore Structure Characteristics of Chang 81 Reservoir in Huaqing Oilfield. Geoscienge 2014, 28, 379–387. [Google Scholar]
- Elkins, L.E. The Technology and Economics of Gas Recovery from Tight Sans. In SPE Production Technology Symposium; OnePetro: Richardson, TX, USA, 1978. [Google Scholar]
- SY/T 6832-2011; People’s Republic of China Petroleum and Natural Gas Industry Standards. China National Petroleum Corporation. Petroleum Industry Press: Beijing, China, 2011.
- Gao, Y.L.; Sun, W.; Zhang, X. Microscopic geologic origin for ultra-low permeability reservo-ir or Yanchang Groups, Ordos Basin. J. Jilin Univ. 2013, 43, 13–19. [Google Scholar]
- Ma, Y.; Li, W.H.; Liu, Z. Characteristics of microscopic pore structure in the low permeability sandstone reservoir: A case study of Chang 9 of Yanchang Formation in Zhijing-Ansai Area of Ordos Basin. Geol. Bull. China 2016, 35, 398–405. [Google Scholar]
- Wang, Y.; Ma, Y.; Wang, R.G. Fractal study of micro-pore structure of tight sandstone reservo-ir. J. Northwest Univ. 2019, 49, 935–940. [Google Scholar]
- Guo, Y.Q.; He, Z.Q.; Guo, B.C. Reservoir characteristic and evaluation of tight sandstone of He 8 Member in southeastern Sulige Gas Field, Ordos Basin. Lithol. Reserv. 2019, 31, 1–11. [Google Scholar]
- Zhou, T.; Zhang, C.Y.; Liu, G.G. Reservoir comprehensive evaluation: A case study of Su54 Block, Sulige Gas Field. Nat. Gas Explor. Dev. 2015, 38, 44–52. [Google Scholar]
- Shafiei, A.; Dusseault, M.B.; Zendehboudi, S. A new screening tool for evaluation of steam flooding performance in naturally fractured carbonate reservoirs. Fuel 2013, 108, 502–514. [Google Scholar] [CrossRef]
- Ye, X.C.; Zhang, P.; We, M.J. Study on characteristics of Lower Plaeozoic reservoir in Tao 2 Block of Sulige Gas Field. J. Xi’an Shiyou Univ. 2020, 35, 18–27. [Google Scholar]
- Bize-Forest, N.; Lima, L.; Baines, V.; Boyd, A.; Abbots, F.; Barnett, A. Using machine learning for depositional facies prediction in a complex carbonate Reservoir. In Proceedings of the SPWLA 59th Annual Logging Symposium, London, UK, 2–6 June 2018. [Google Scholar]
- Dong, F.J.; Sun, W.; Hu, X.J.; Jiang, Z. Application of Grey Analytic Hierarchy Process to Divide Flow Units—A Case from Sanjianfang Formation of Qiuling Oilfield. J. Jilin Univ. (Earth Sci. Ed.) 2010, 40, 1255–1261. [Google Scholar]
- Meng, Z.Y.; Sun, W.; Liu, D.K.; Wu, Y.P.; Li, G.N.; Ouyang, S.Q.; Zhao, D.D.; Luo, B. Combined mercury porosimetry to characterize the microscopic pore structure and pore size distribution of tight reservoirs: A case of Chang 6 reservoir in Wuqi area, Ordos Basin. Geol. Sci. Technol. Inf. 2019, 38, 208–216. [Google Scholar]
- Dong, F.J.; Liu, N.; Sun, Z.; Wei, X.L.; Wang, H.N.; Nan, J.X.; Ren, D.Z. Quantitative Characterization of Heterogeneity in Different Reservoir Spaces of Low-Permeability Sandstone Reservoirs and Its Influence on Physical Properties. Adv. Civ. Eng. 2021, 2021, 2399016. [Google Scholar] [CrossRef]
- Liu, B.; Yang, Y.Q.; Li, J.T.; Chi, Y.A.; Li, J.H.; Fu, X. Stress sensitivity of tight reservoirs and its effect on oil saturation: A case study of Lower Cretaceous tight clastic reservoirs in the Hailar Basin, Northeast China. J. Pet. Sci. Eng. 2020, 184, 106484. [Google Scholar] [CrossRef]
- Zhao, Y.L.; Tang, J.Z.; Chen, Y.; Zhang, L.Y.; Wang, W.J.; Wan, W.; Liao, J.P. Hydromechanical coupling tests for mechanical and permeability characteristics of fractured limestone in complete stress–strain process. Environ. Earth Sci. 2017, 76, 24. [Google Scholar] [CrossRef]
- Yu, W.J.; Li, K.; An, B.F.; Wang, P.; Wu, H. Mechanical characteristics and deformation control of surrounding rock in weakly cemented siltstone. Environ. Earth Sci. 2021, 80, 337. [Google Scholar] [CrossRef]
- Yao, J.; Ding, Y.; Sun, H.; Fan, D.Y.; Wang, M.; Jia, C.Q. Productivity Analysis of Fractured Horizontal Wells in Tight Gas Reservoirs Using a Gas-Water Two-Phase Flow Model with Consideration of a Threshold Pressure Gradient. Energy Fuels 2023, 37, 8190–8198. [Google Scholar] [CrossRef]
- Wang, Y.; Wang, R.G.; Wei, K.Y.; Lu, H.J.; Xiong, X.W.; Zhang, T.J. Classification of Tight Reservoirs Based on Random Forest Algorithm: A Case Study of He 8Member in East of Yan’an Gasfield. J. Xi’an Shiyou Univ. (Nat. Sci. Ed.) 2021, 36, 1–8. [Google Scholar]
- Caf, A.B.; Pigott, J.D. Dolomitization geometry and reservoir quality from supervised Bayesian classification and probabilistic neural networks: Midland Basin Leonardian Wichita and Clear Fork Formations. Interpretation 2021, 9, 585–598. [Google Scholar] [CrossRef]
- Zhang, X.Q.; Zhang, Z.S.; Zhang, C.M. Bi-LSTM Deep Neural Network Reservoir Classification Model Based on the Innovative Input of Logging Curve Response Sequences. IEEE Access 2021, 9, 19902–19915. [Google Scholar] [CrossRef]
- Liu, B.; Zhao, X.Q.; Fu, X.F.; Yuan, B.Y.; Bai, L.H.; Zhang, Y.W.; Ostadhassan, M. Petrophysical characteristics and log identification of lacustrine shale lithofacies: A case study of the first member of Qingshankou Formation in the Songliao Basin, Northeast China. Interpretation 2020, 8, SL45–SL57. [Google Scholar] [CrossRef]
- Yan, X.L.; Gong, L.Q.; Wang, B.B.; Mo, F.X. Fault diagnosis of electronic circuit based on BAT optimized MK-SVM. J. Guilin Univ. Electron. Technol. 2018, 38, 204–209. [Google Scholar]
- Lu, X.F.; Wang, X.Y.; Yang, Y.F.; Xue, J.N. The optimization model for reducing RON loss in gasoline refining process. Geofluids 2021, 2021, 5520942. [Google Scholar] [CrossRef]
- Lu, X.F.; Dong, F.J.; Wei, X.L.; Wang, P.T.; Liu, N.; Ren, D.Z. Analysis of microscopic main controlling factors for occurrence of movable fluid in tight sandstone gas reservoirs based on improved grey correlation theory. Math. Probl. Eng. 2021, 2021, 3158504. [Google Scholar] [CrossRef]
- Zhong, J.; He, L.; Huang, B. An incremental learning algorithm based on support vector machine for multi-scenario crowd counting. Microelectron. Comput. 2022, 39, 75–83. [Google Scholar] [CrossRef]
- Liu, B.; Nakhaei-Kohani, R.; Bai, L.H.; Wen, Z.G.; Gao, Y.F.; Tian, W.C.; Yang, L.; Liu, K.Q.; Hemmati-Sarapardeh, A.; Ostadhassan, M. Integrating advanced soft computing techniques with experimental studies for pore structure analysis of Qingshankou shale in Southern Songliao Basin, NE China. Int. J. Coal Geol. 2022, 257, 103998. [Google Scholar] [CrossRef]
Disclaimer/Publisher’s Note: The statements, opinions and data contained in all publications are solely those of the individual author(s) and contributor(s) and not of MDPI and/or the editor(s). MDPI and/or the editor(s) disclaim responsibility for any injury to people or property resulting from any ideas, methods, instructions or products referred to in the content. |
© 2023 by the authors. Licensee MDPI, Basel, Switzerland. This article is an open access article distributed under the terms and conditions of the Creative Commons Attribution (CC BY) license (https://creativecommons.org/licenses/by/4.0/).