
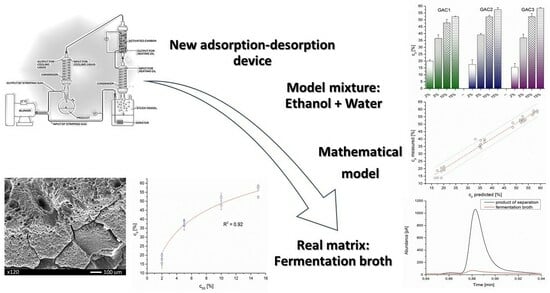
Separation of VOC Gaseous Mixtures Using an Adsorption–Desorption Device

 , , ,
, , ,
Abstract
:
1. Introduction
2. Materials and Methods
2.1. Analysis of Gas Samples by GC-FID
2.2. Analysis of Liquid Samples Using GC-FID
Sample Preparation
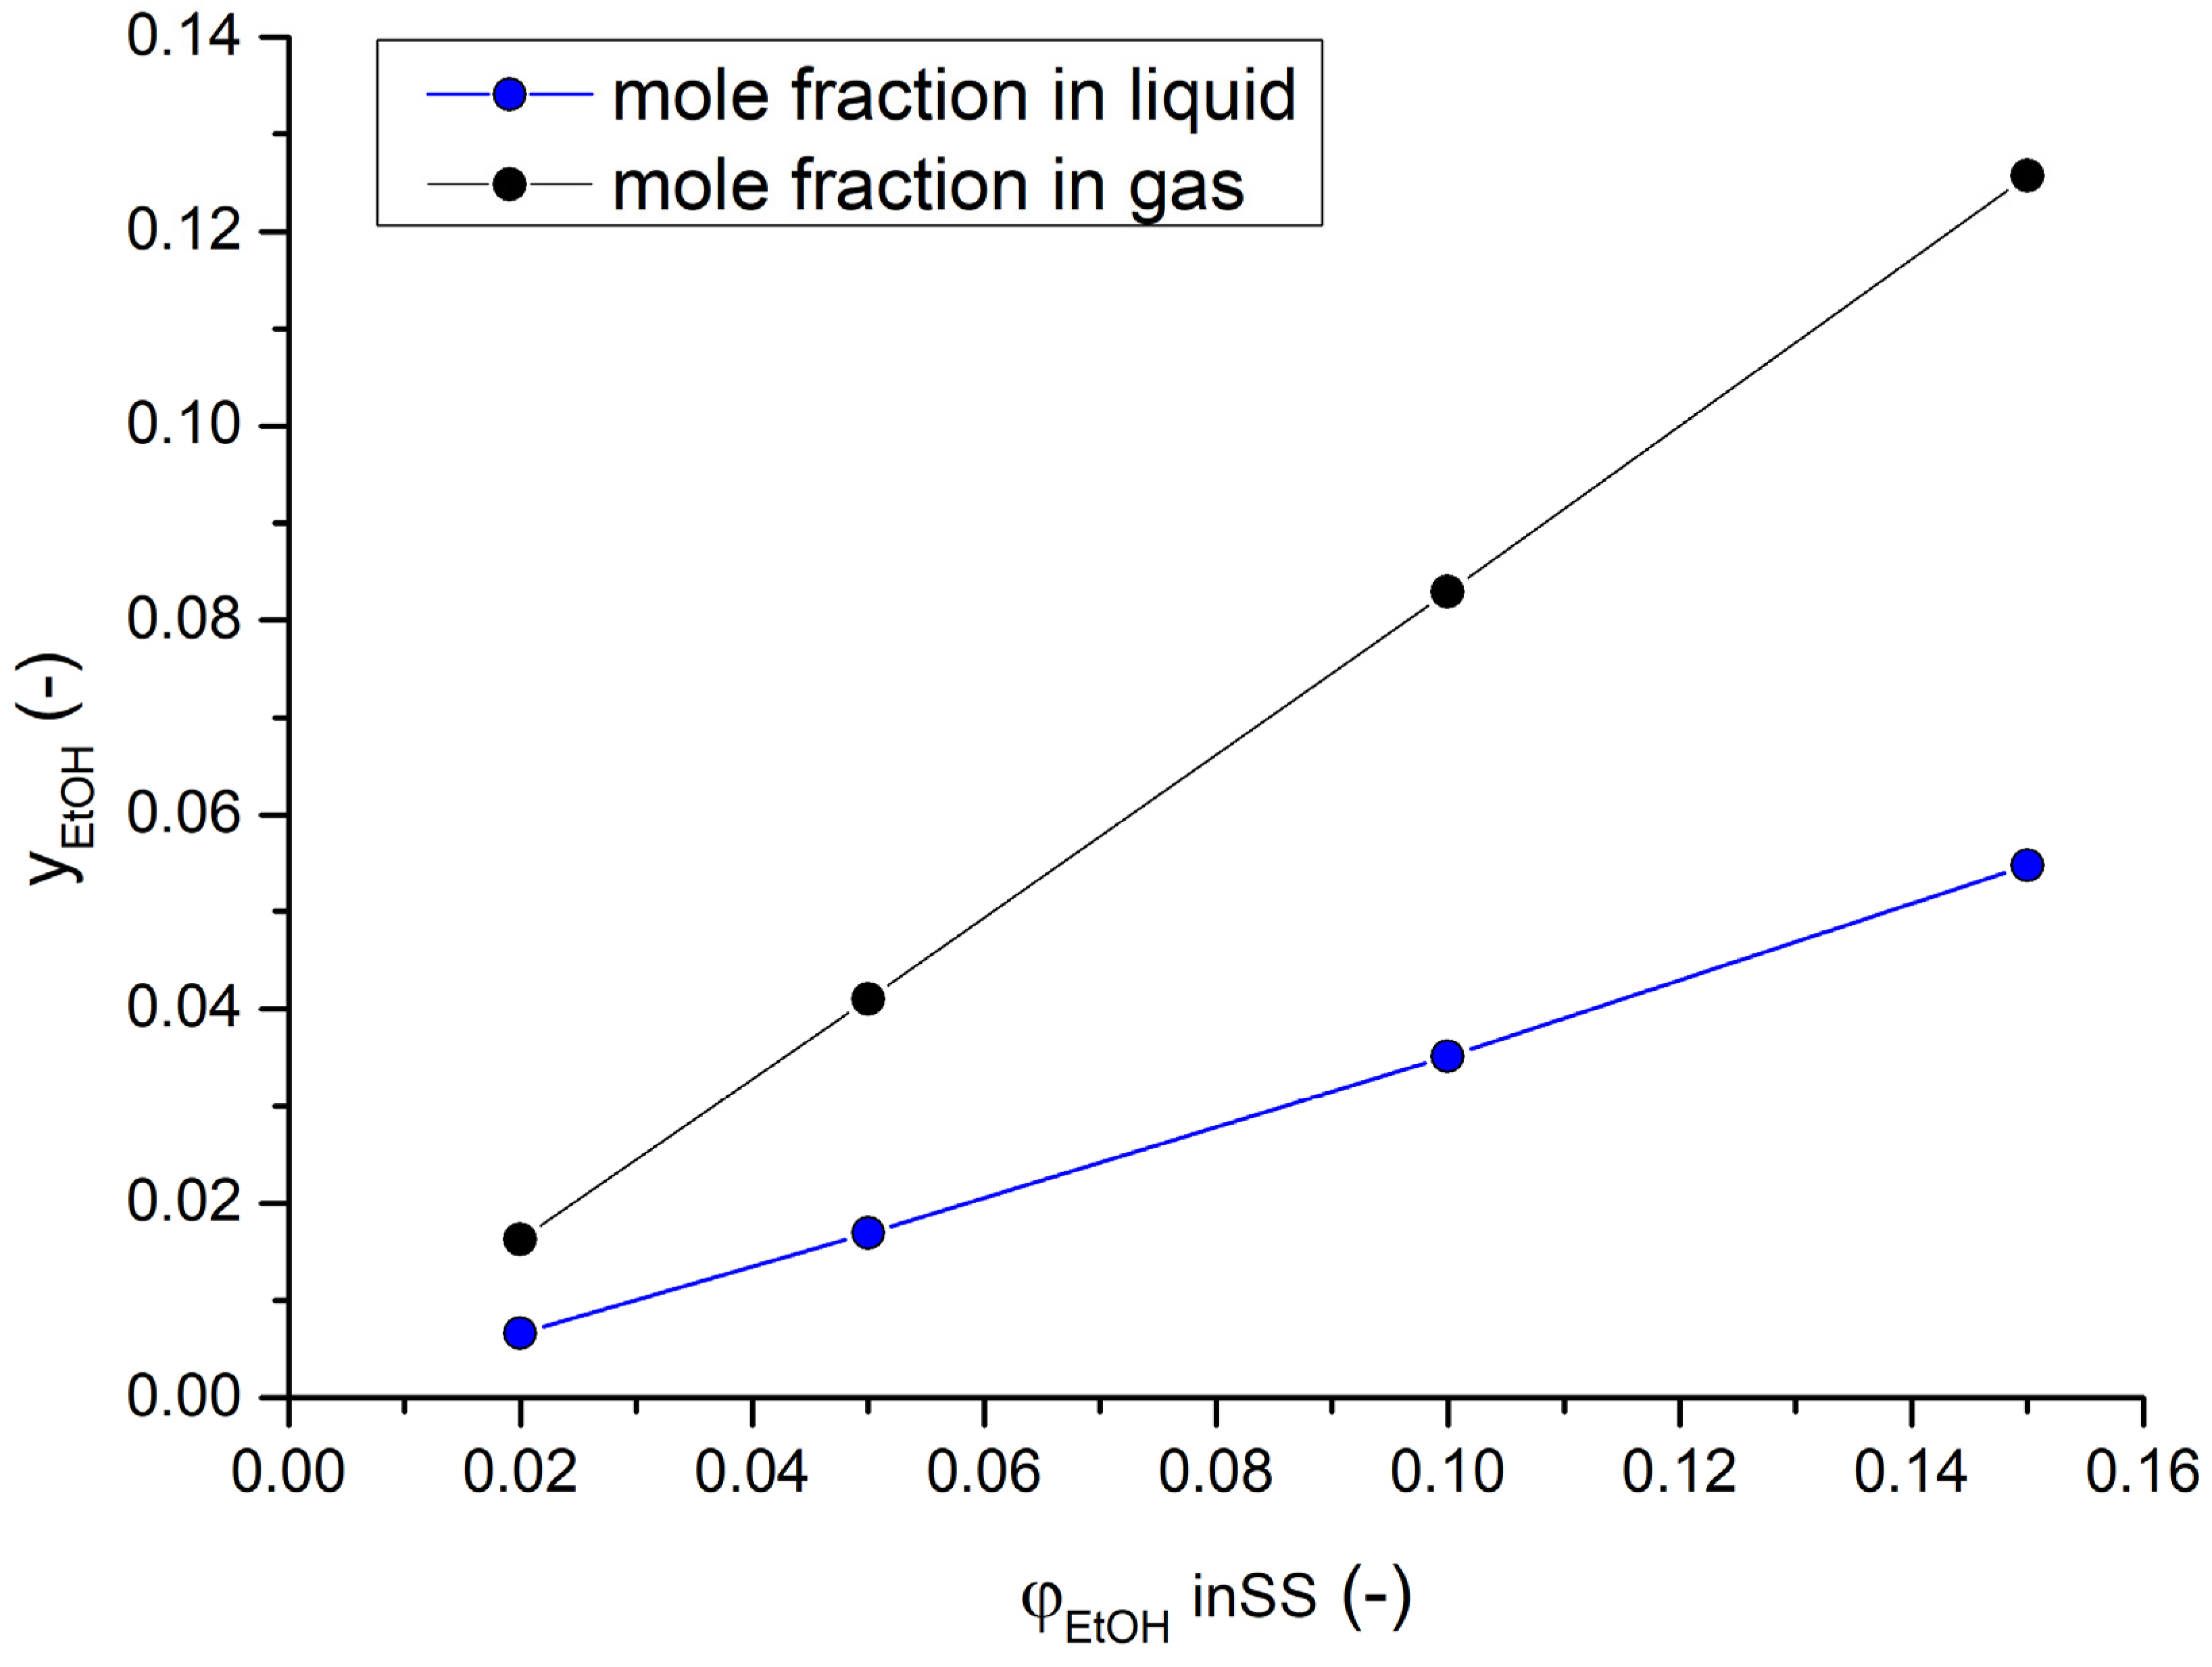
2.3. Theoretical Background of Ethanol Content
3. Results and Discussion
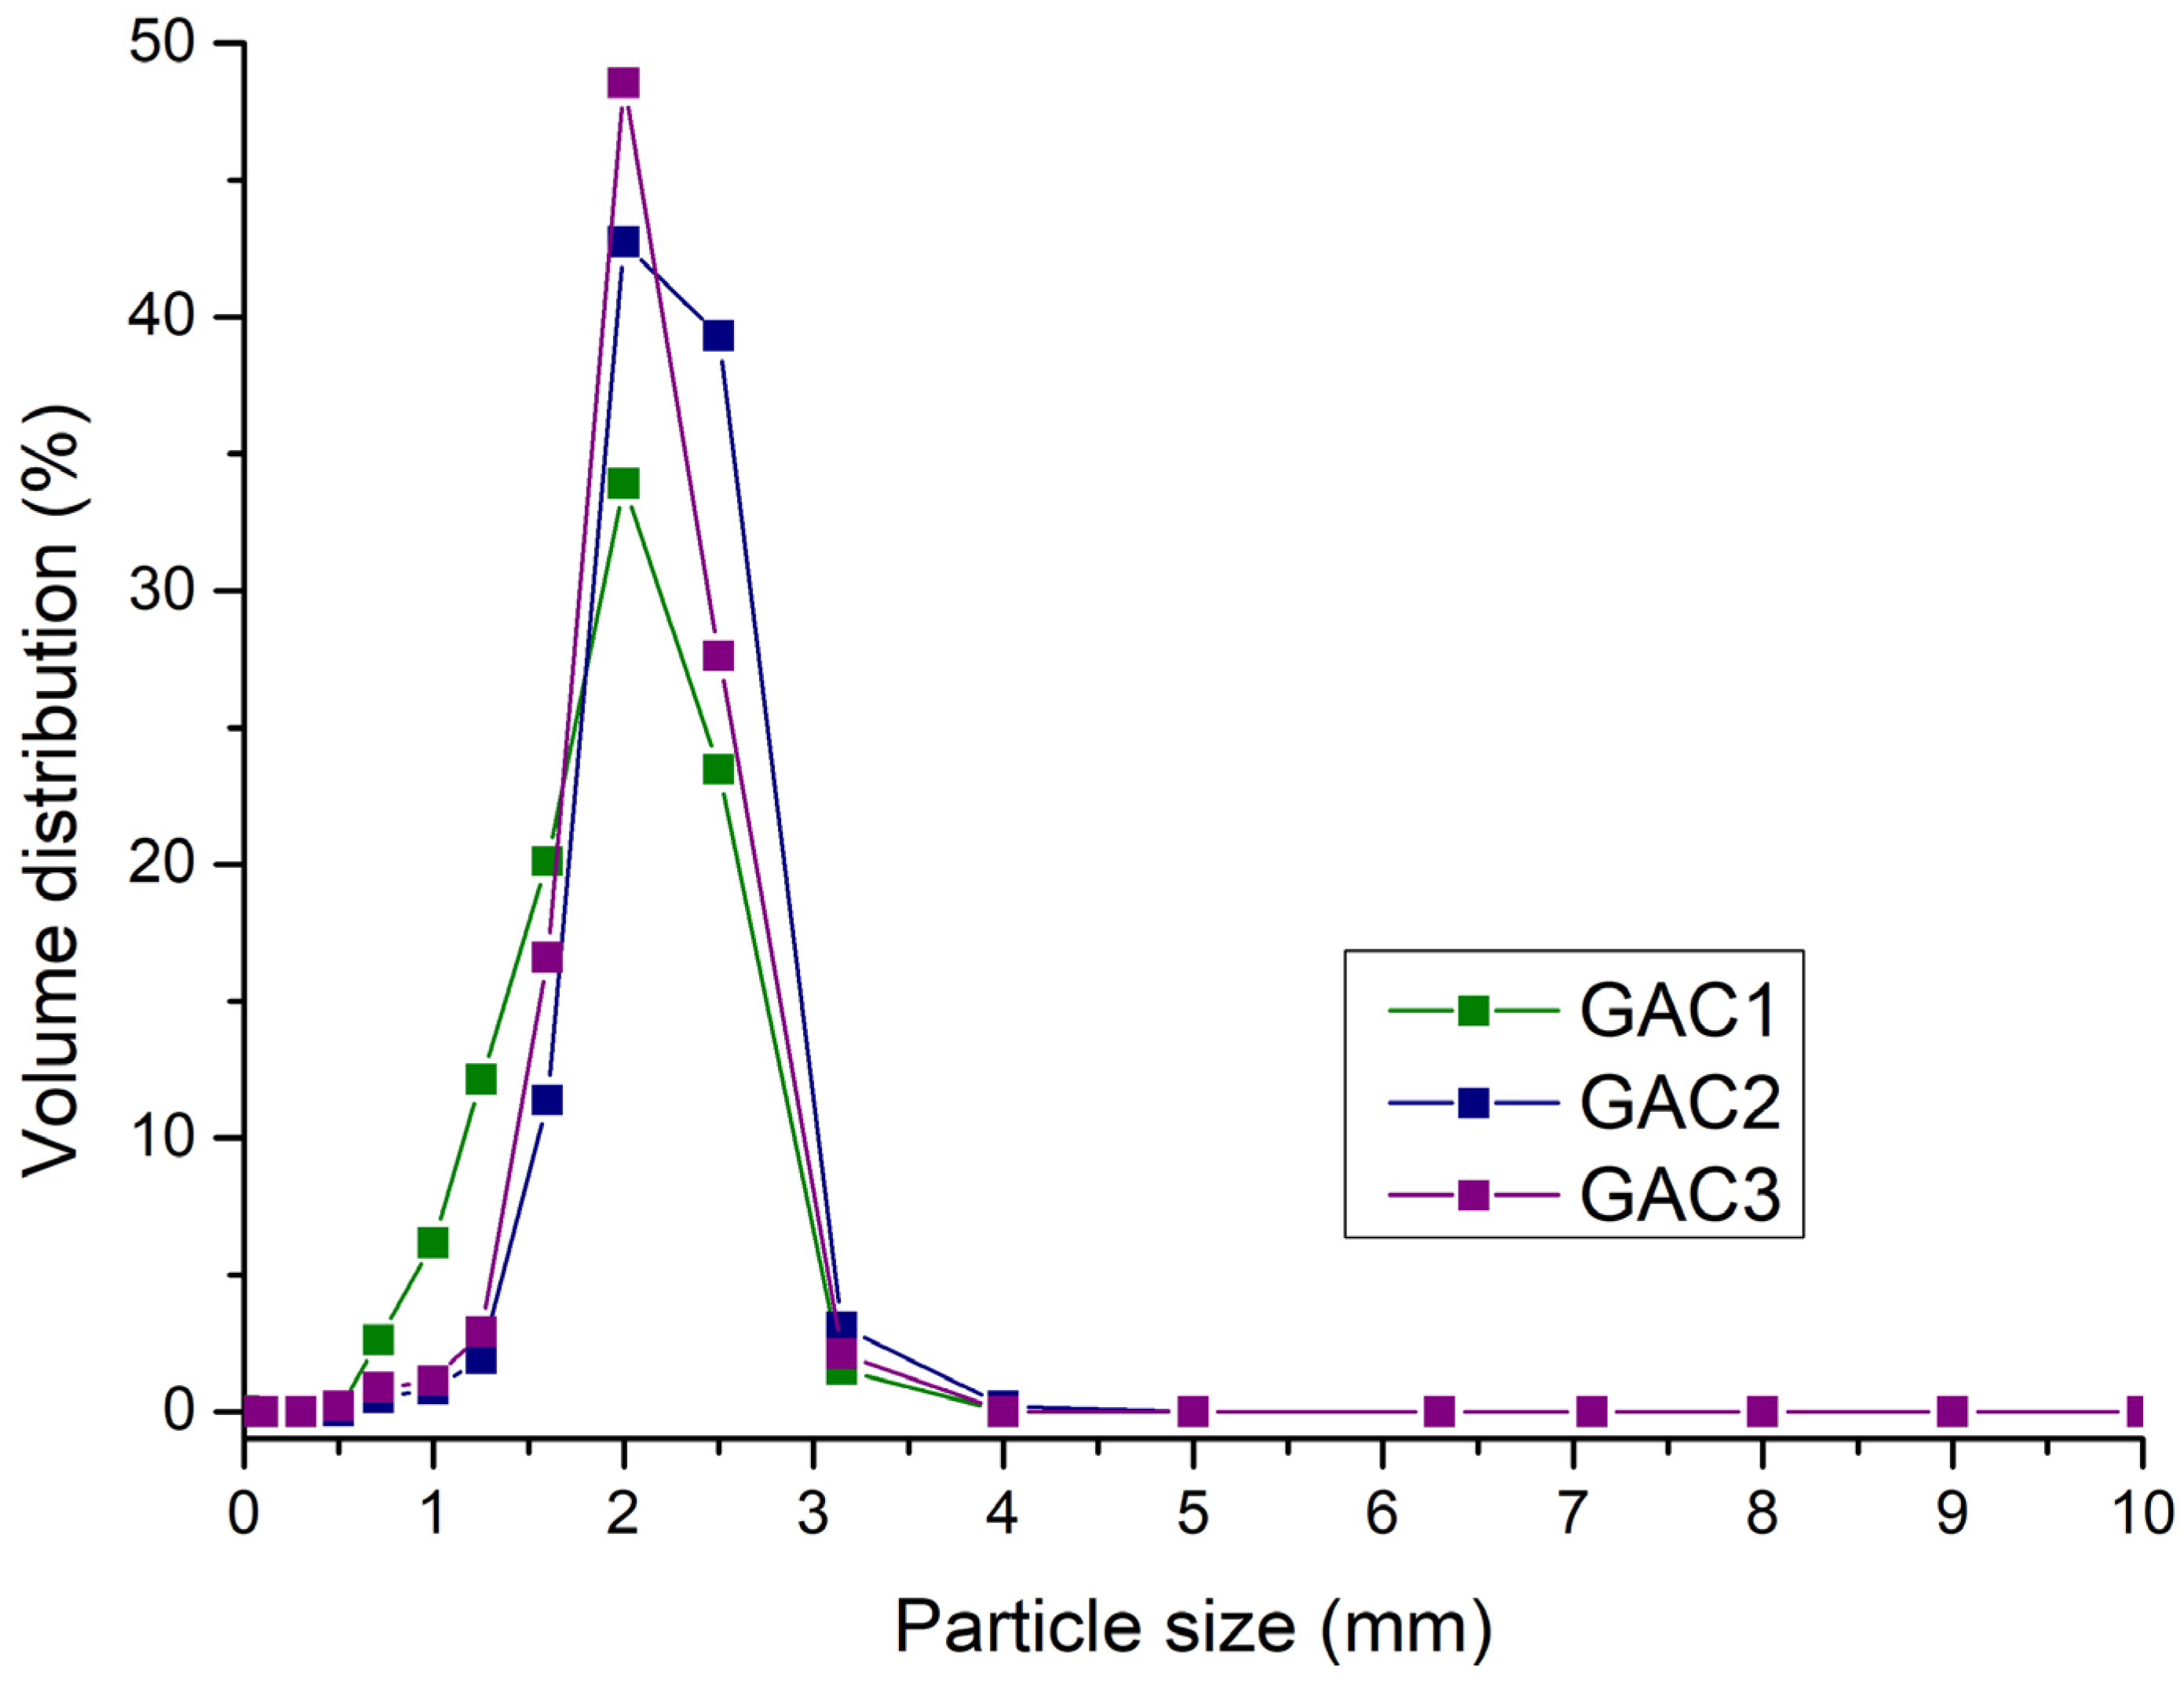
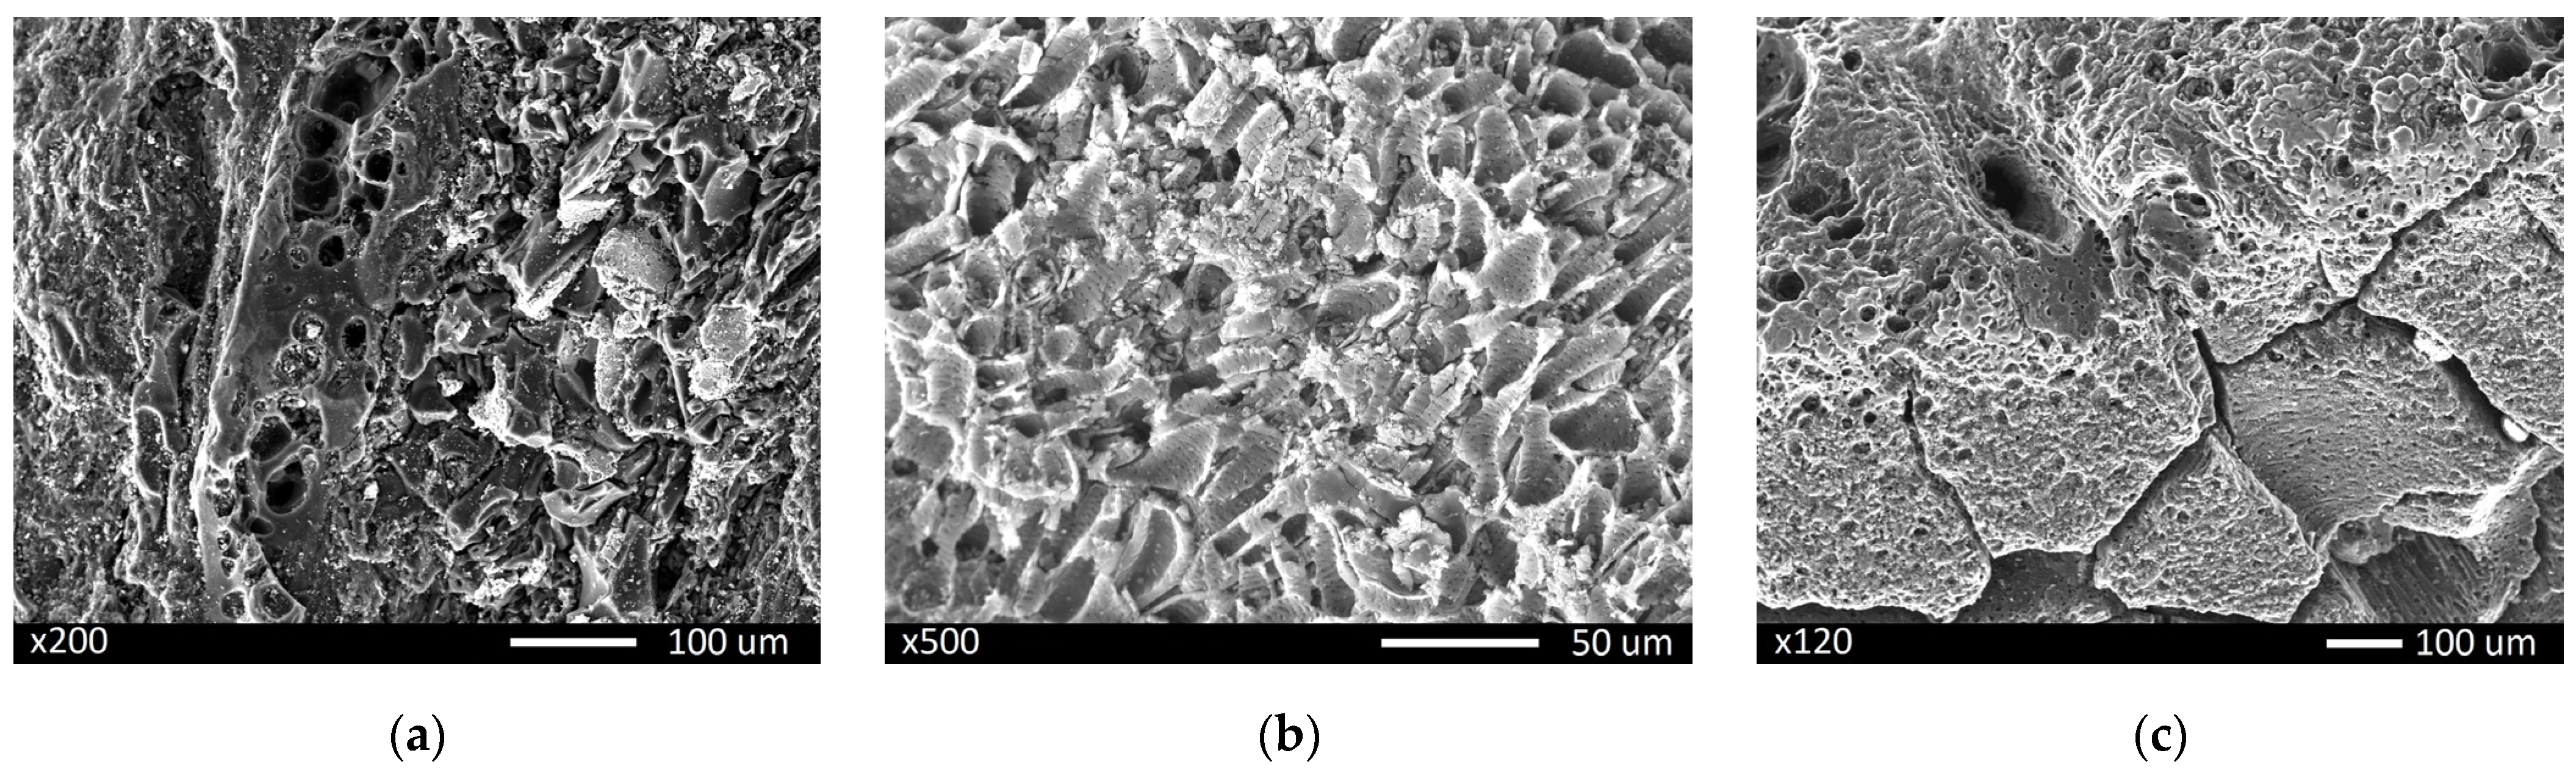
3.1. Characterization of GAC
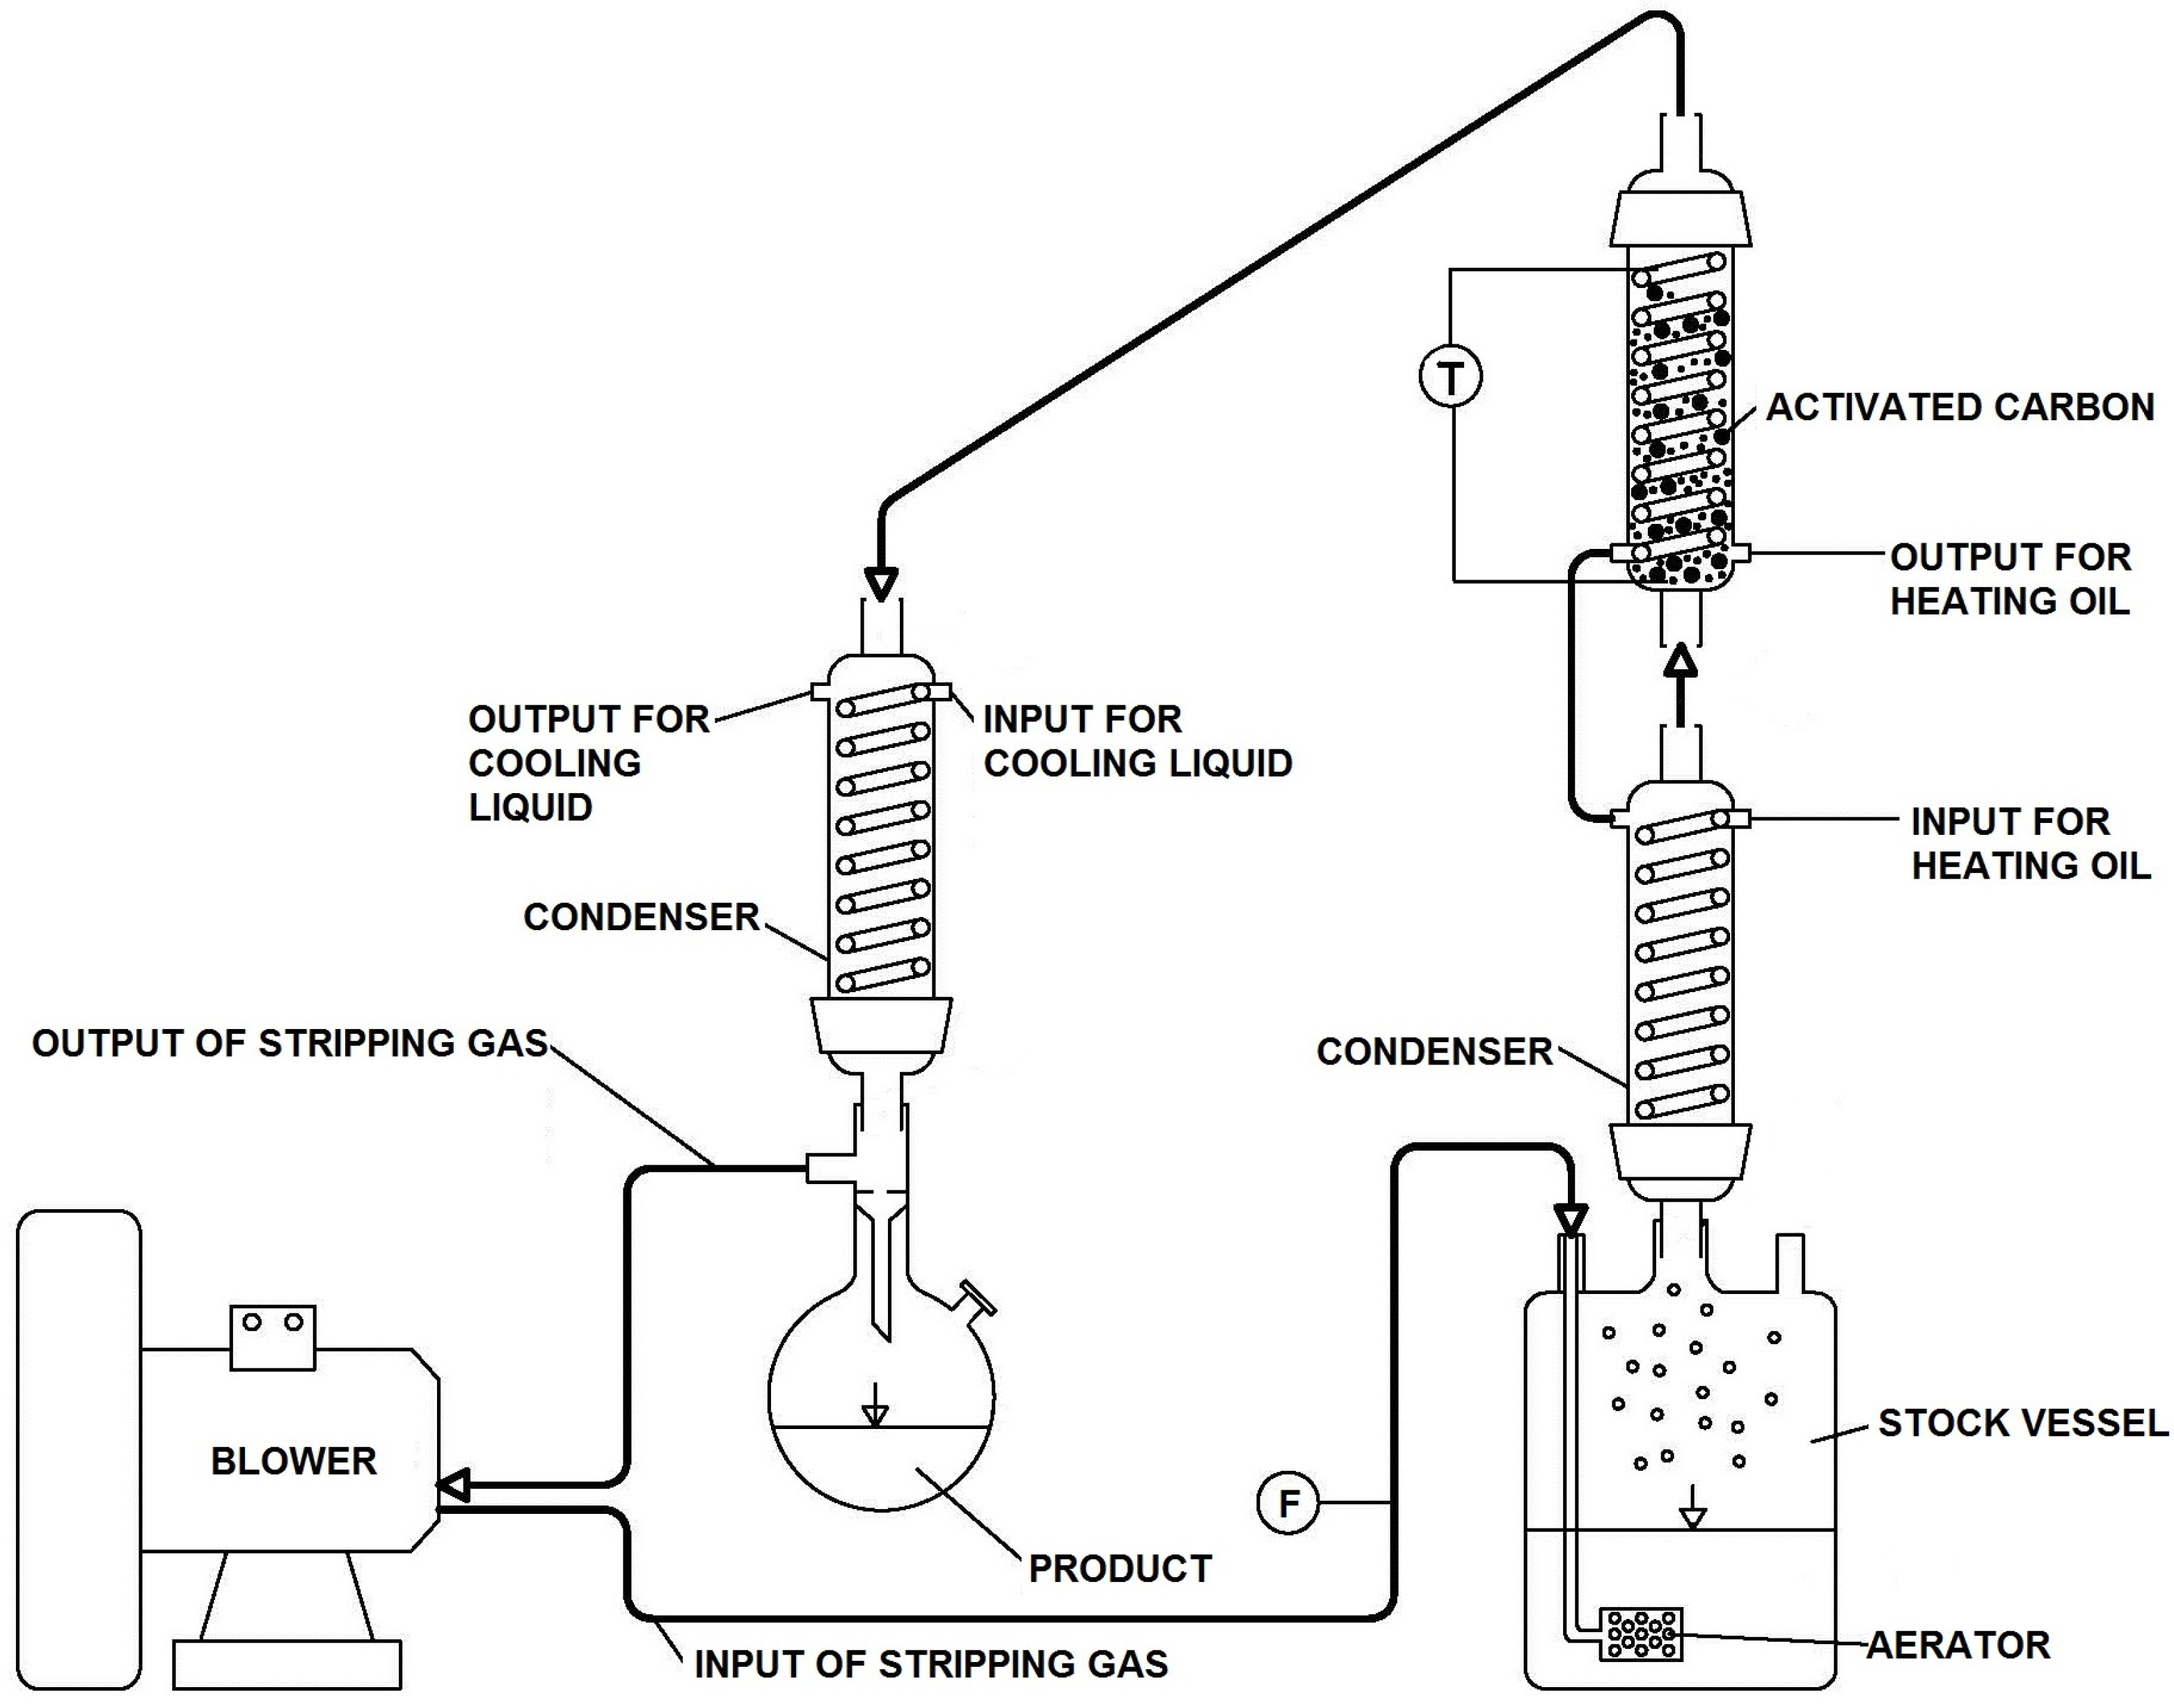
3.2. Adsorption–Desorption Experiments
3.3. Adsorption–Desorption Mathematical Model
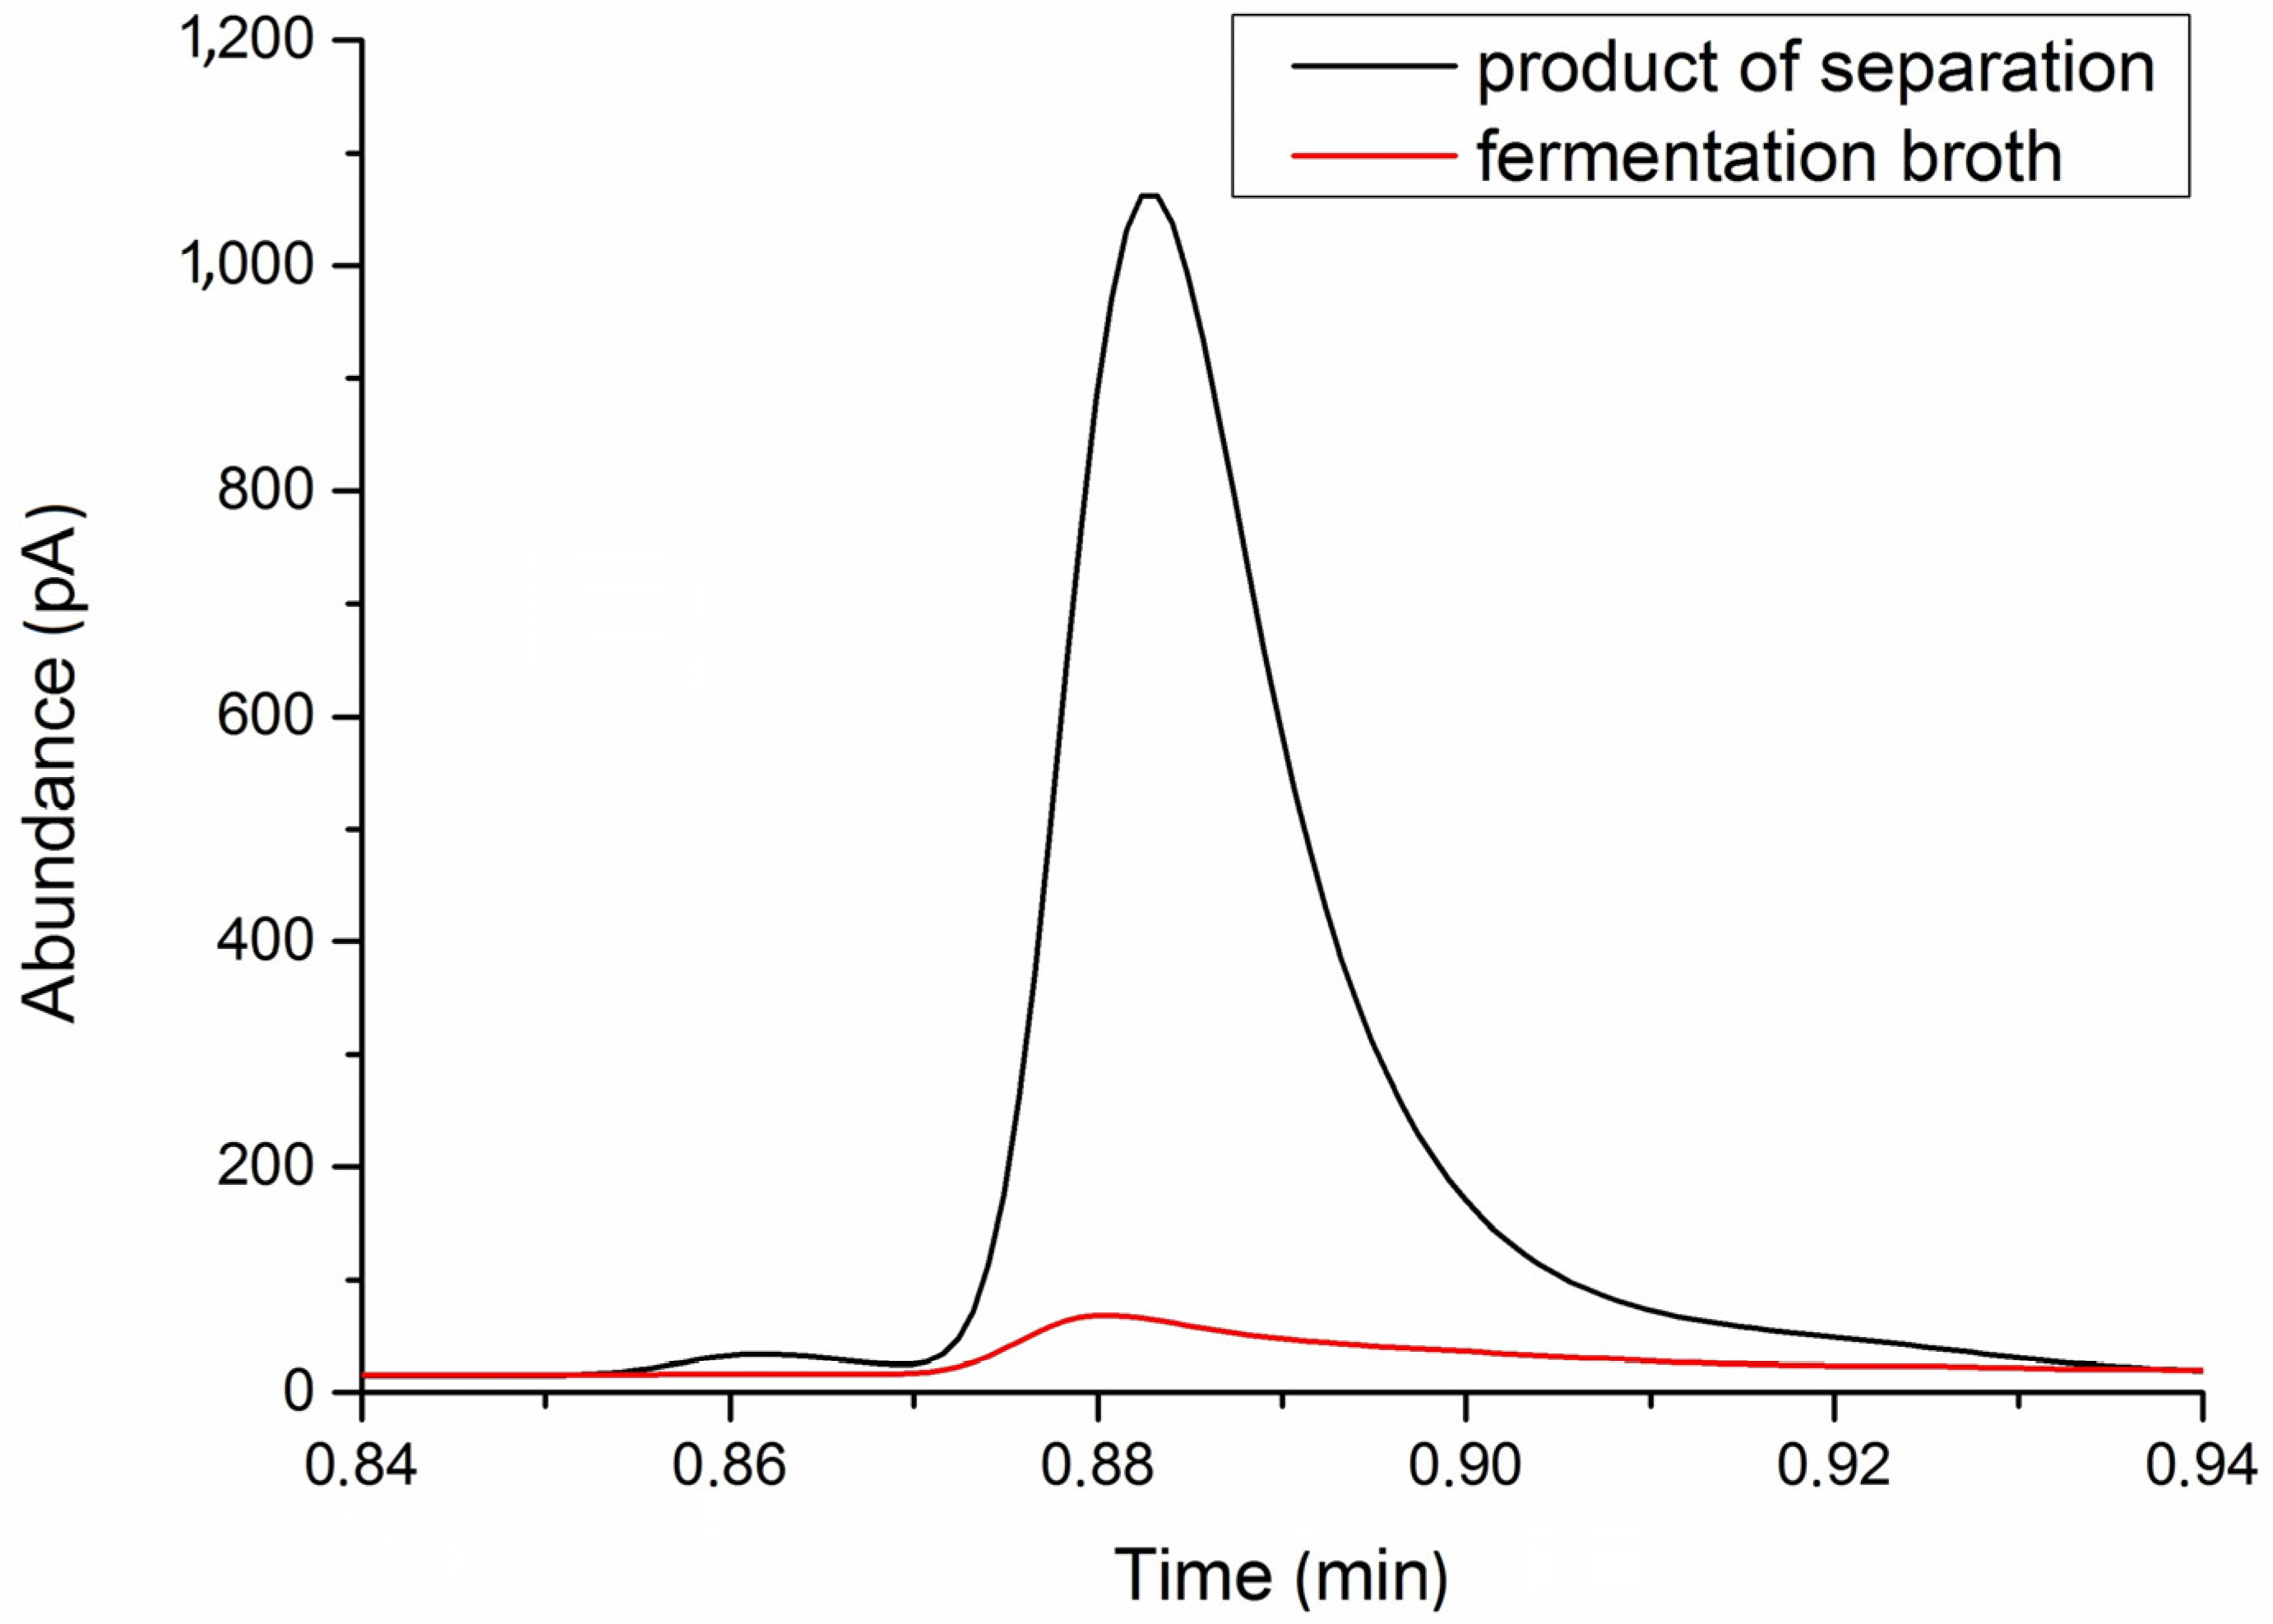
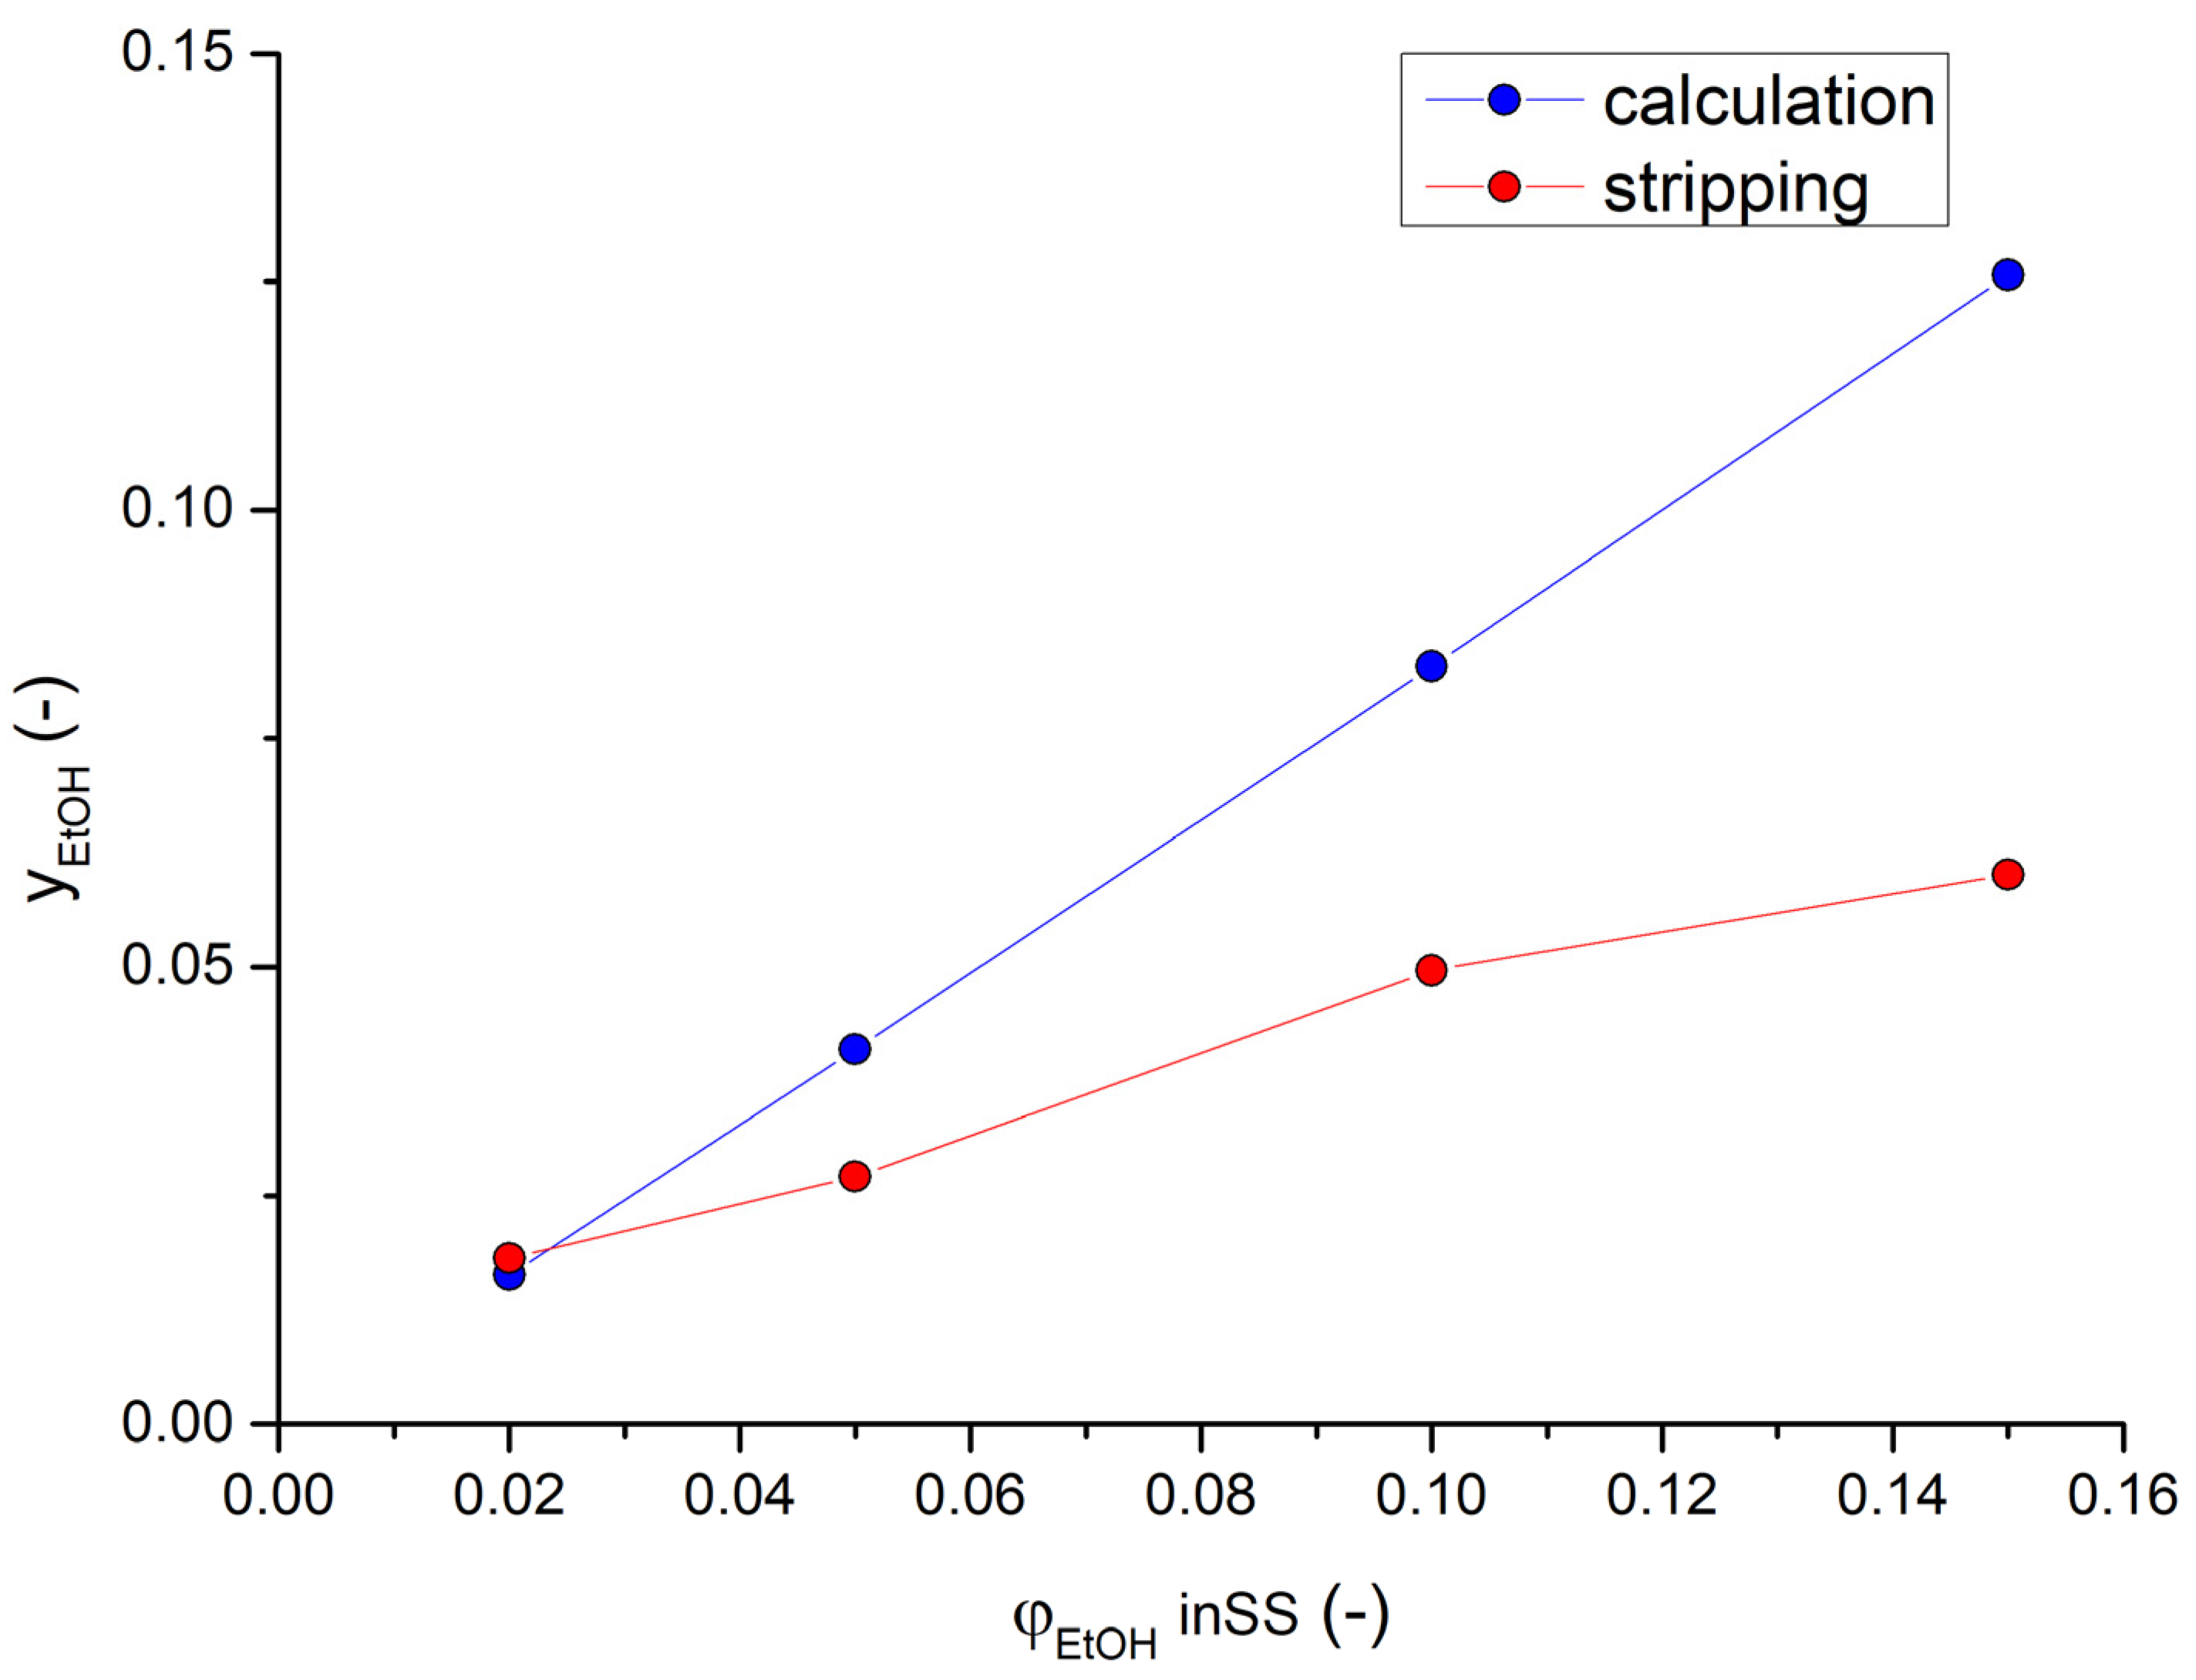
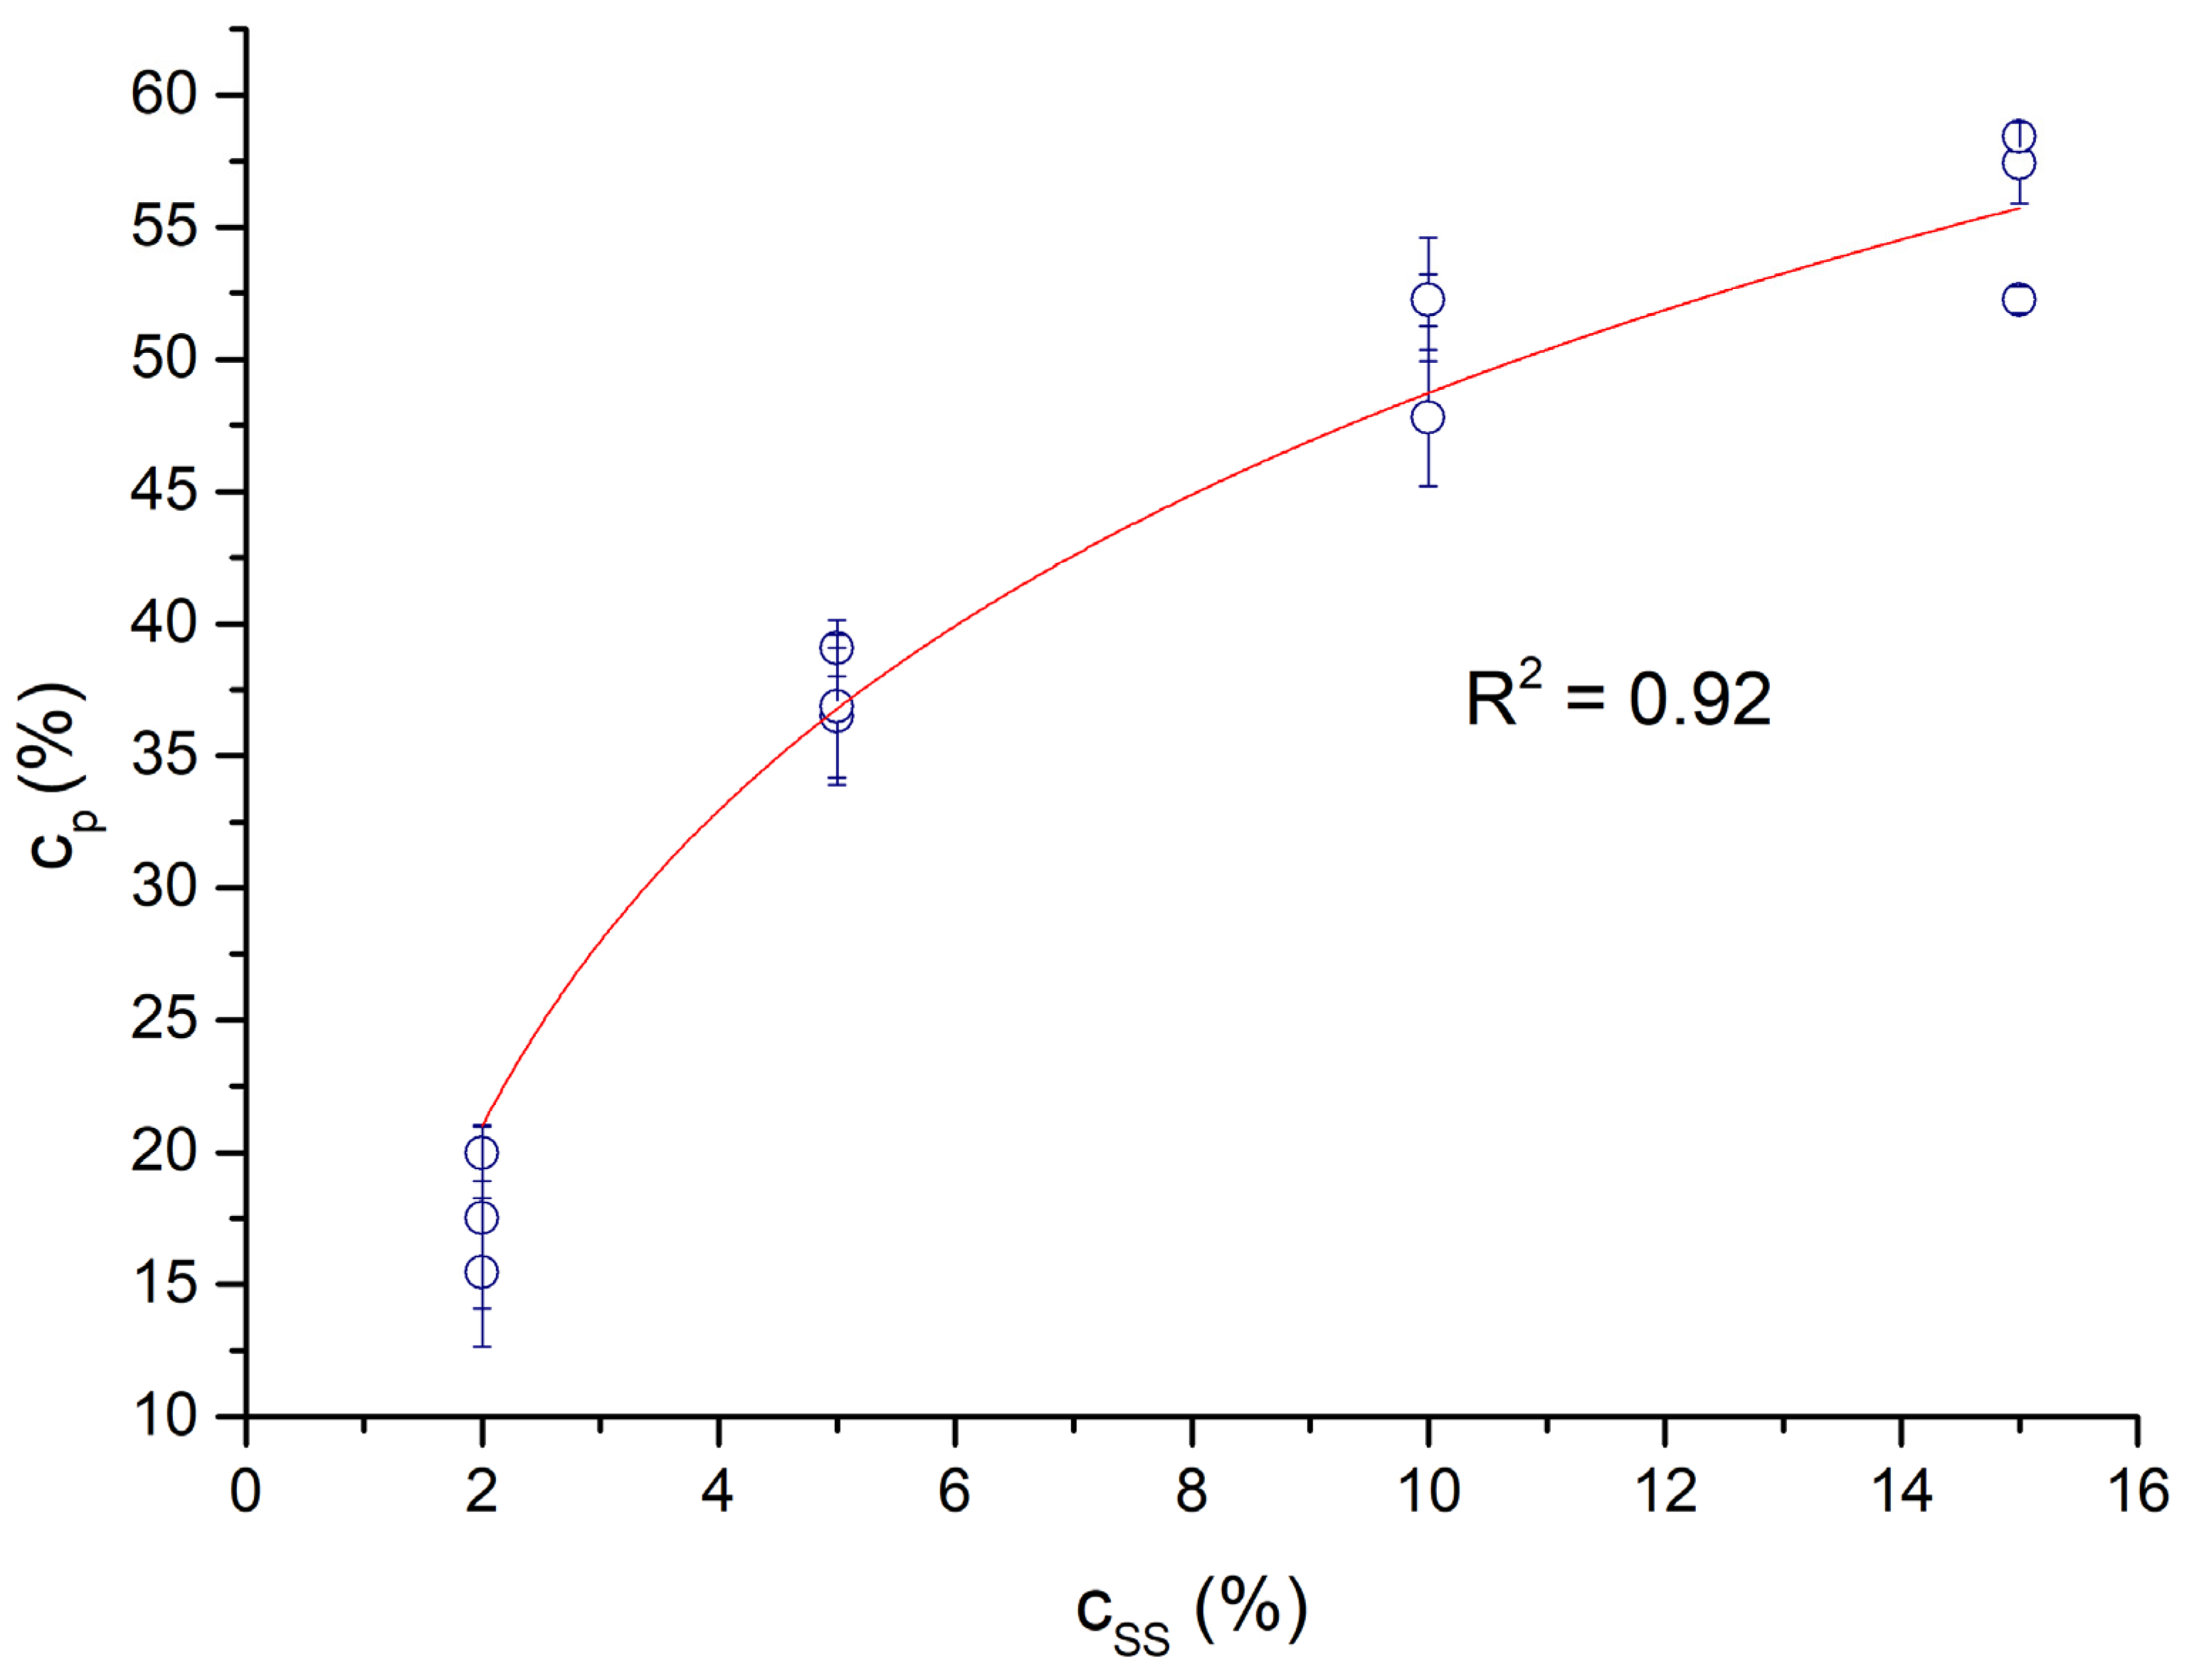
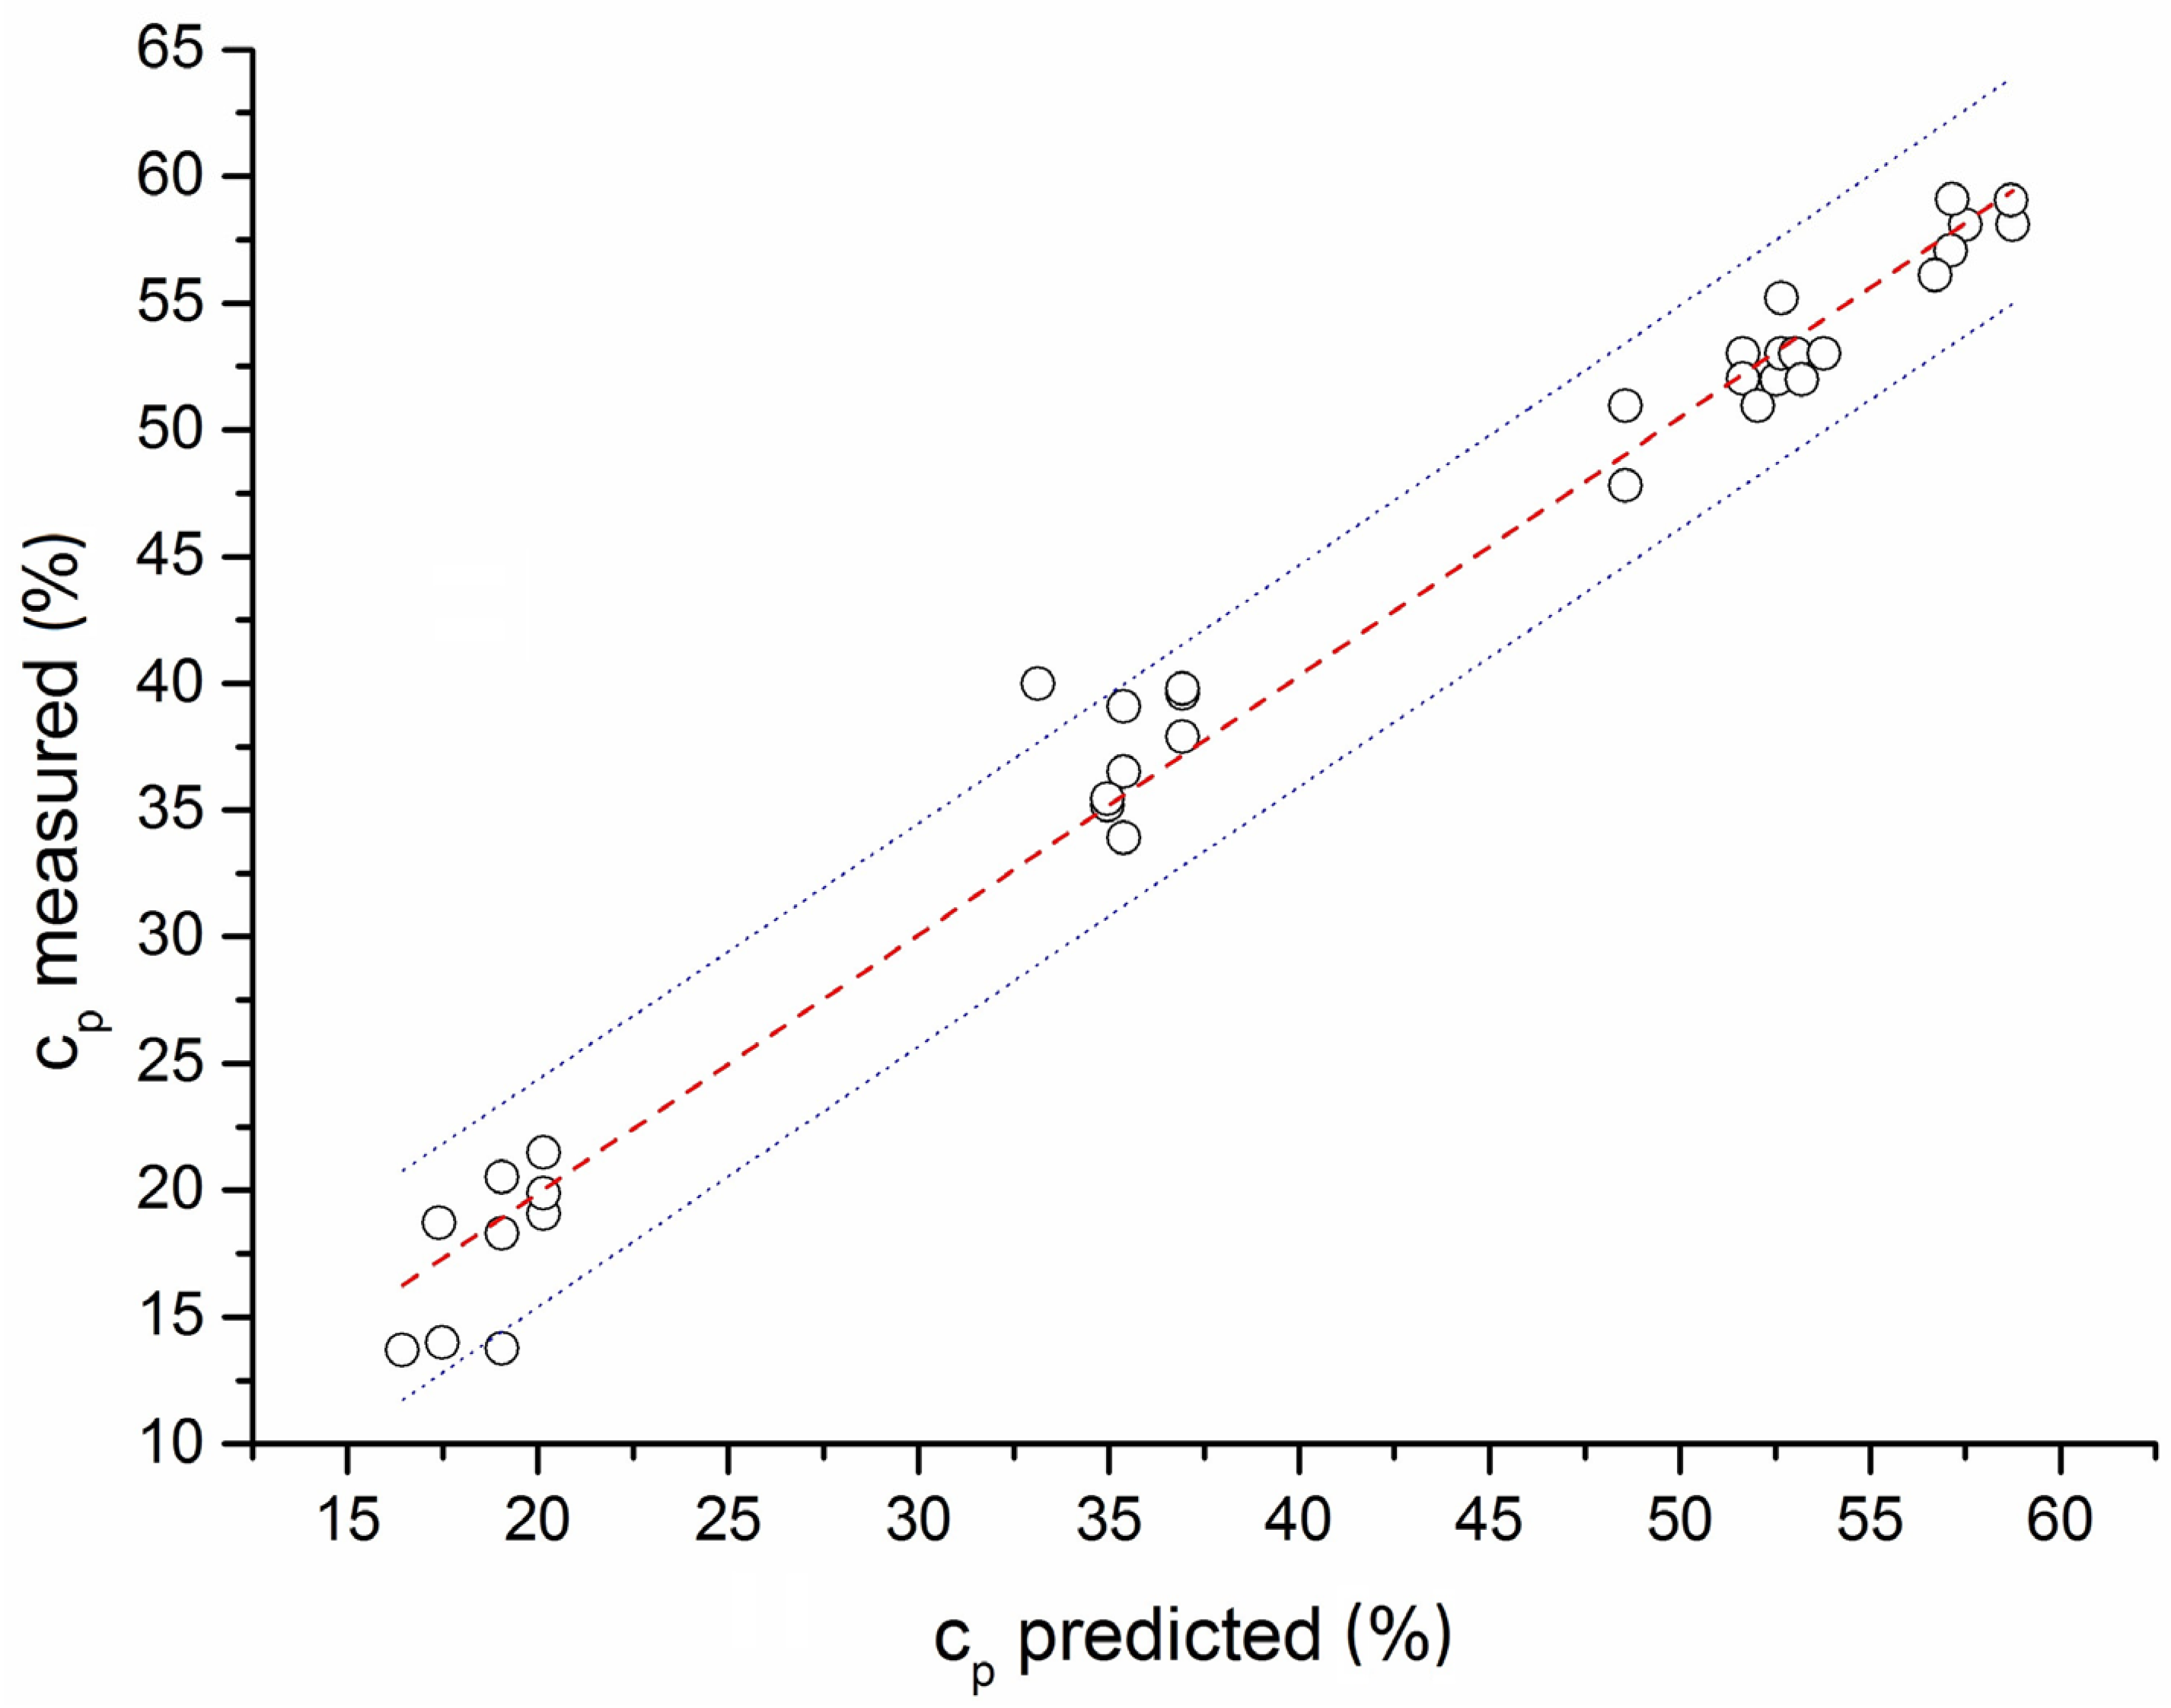
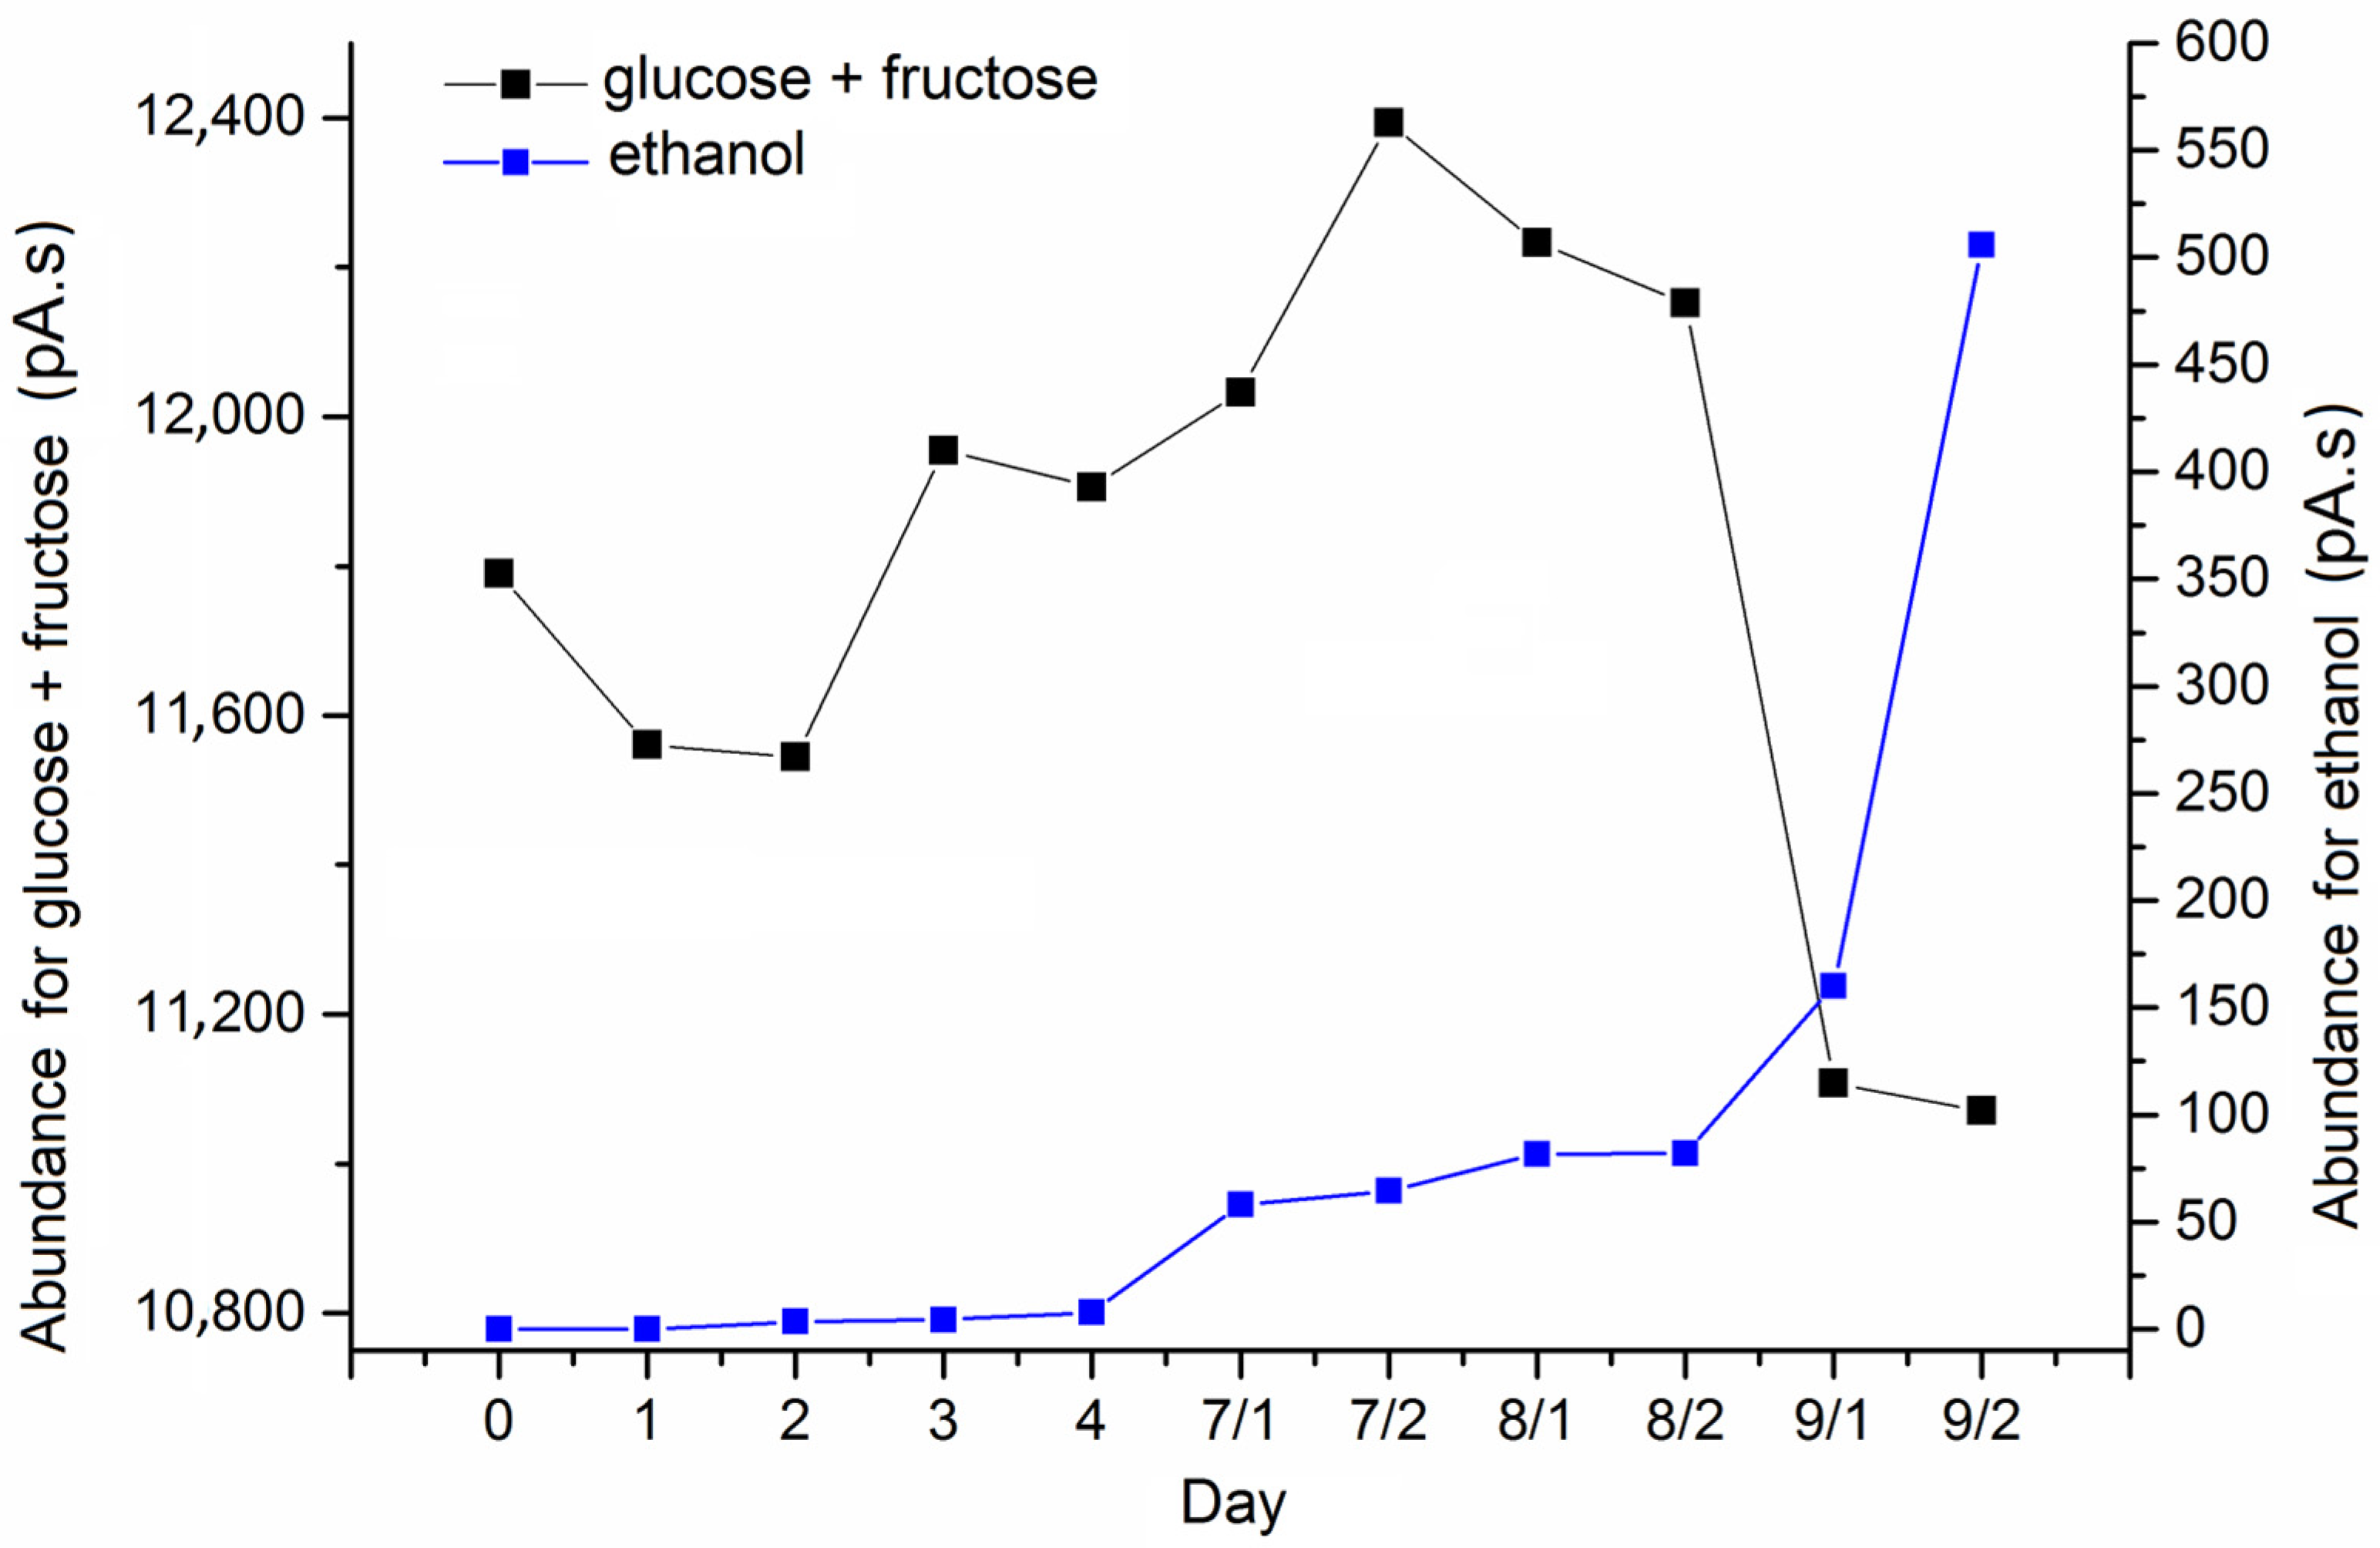
3.4. Ethanol Separation from Fermentation Broth
4. Conclusions
5. Patents
Author Contributions
Funding
Data Availability Statement
Conflicts of Interest
Nomenclature
| Ethanol concentration in the product (%) | |
| Ethanol concentration in stock solution (%) | |
| Particle size (m) | |
| Pore average size (m) | |
| Granulated activated carbon | |
| Gas chromatography with flame ionization detector | |
| Ethanol mass in SS (g) | |
| Amount of substance i (mol) | |
| Sum of the amount of substances in system (mol) | |
| Partial pressure of component i (kPa) | |
| Vapor pressure of component i (kPa) | |
| Total pressure above SS (kPa) | |
| Pore average radius (nm) | |
| Surface area (m2/g) | |
| Standard deviation (%) | |
| Stock solution | |
| Volatile organic compound | |
| Specific pore volume (cm3/g) | |
| Molar fraction of ethanol in gas (-) | |
| Molar fraction of component i in gas (-) | |
| Volume fraction of ethanol (-) |
References
- Abdehagh, N.; Dai, B.; Thibault, J.; Tezel, F.H. Biobutanol Separation from ABE Model Solutions and Fermentation Broths Using a Combined Adsorption—Gas Stripping Process. J. Chem. Technol. Biotechnol. 2016, 92, 245–251. [Google Scholar] [CrossRef]
- Li, X.; Zhang, L.; Yang, Z.; Wang, P.; Yan, Y.; Ran, J. Separation and Puri Fi Cation Technology Adsorption Materials for Volatile Organic Compounds (VOCs) and the Key Factors for VOCs Adsorption Process: A Review. Sep. Purif. Technol. 2020, 235, 116213. [Google Scholar] [CrossRef]
- Patel, H. Fixed-Bed Column Adsorption Study: A Comprehensive Review. Appl. Water Sci. 2019, 9, 45. [Google Scholar] [CrossRef]
- Delgado, J.A.; águeda, V.I.; Uguina, M.A.; Sotelo, J.L.; García, A.; Brea, P.; García-Sanz, A. Separation of Ethanol-Water Liquid Mixtures by Adsorption on a Polymeric Resin Sepabeads 207®. Chem. Eng. J. 2013, 220, 89–97. [Google Scholar] [CrossRef]
- Abdehagh, N.; Gurnani, P.; Corporation, T.; Tezel, F.H.; Thibault, J. Adsorptive Separation and Recovery of Biobutanol from ABE Model Solutions Adsorptive Separation and Recovery of Biobutanol from ABE Model Solutions. Adsorption 2015, 21, 185–194. [Google Scholar] [CrossRef]
- Qureshi, N.; Hughes, S.; Maddox, I.S.; Cotta, M.A. Energy-Efficient Recovery of Butanol from Model Solutions and Fermentation Broth by Adsorption. Bioprocess Biosyst. Eng. 2005, 27, 215–222. [Google Scholar] [CrossRef]
- Salvador, F.; Martin-Sanchez, N.; Sanchez-Hernandez, R.; Sanchez-Montero, M.J.; Izquierdo, C. Regeneration of Carbonaceous Adsorbents. Part II: Chemical, Microbiological and Vacuum Regeneration. Microporous Mesoporous Mater. 2015, 202, 277–296. [Google Scholar] [CrossRef]
- Zhang, W.; Li, G.; Yin, H.; Zhao, K.; Zhao, H.; An, T. Adsorption and Desorption Mechanism of Aromatic VOCs onto Porous Carbon Adsorbents for Emission Control and Resource Recovery: Recent Progress and Challenges. Environ. Sci. Nano 2022, 9, 81–104. [Google Scholar] [CrossRef]
- Zhu, X.; Fan, Z.; Zhang, X.F.; Yao, J. Metal-Organic Frameworks Decorated Wood Aerogels for Efficient Particulate Matter Removal. J. Colloid Interface Sci. 2023, 629, 182–188. [Google Scholar] [CrossRef]
- Laksmono, J.A.; Pangesti, U.A.; Sudibandriyo, M.; Haryono, A.; Saputra, A.H. IOP Conference Series: Earth and Environmental Science Adsorption Capacity Study of Ethanol-Water Mixture for Zeolite, Activated Carbon, and Polyvinyl Alcohol. IOP Conf. Ser. Earth Environ. Sci. 2018, 105, 12025. [Google Scholar] [CrossRef]
- Hashi, M.; Tezel, F.H.; Thibault, J. Ethanol Recovery from Fermentation Broth via Carbon Dioxide Stripping and Adsorption. Energy Fuels 2010, 24, 4628–4637. [Google Scholar] [CrossRef]
- Zhang, X.; Gao, B.; Creamer, A.E.; Cao, C.; Li, Y. Adsorption of VOCs onto Engineered Carbon Materials: A Review. J. Hazard. Mater. 2017, 338, 102–123. [Google Scholar] [CrossRef] [PubMed]
- Gil, R.R.; Ruiz, B.; Lozano, M.S.; Martín, M.J.; Fuente, E. VOCs Removal by Adsorption onto Activated Carbons from Biocollagenic Wastes of Vegetable Tanning. Chem. Eng. J. 2014, 245, 80–88. [Google Scholar] [CrossRef]
- Ledesma, B.; Román, S.; Álvarez-Murillo, A.; Sabio, E.; González, J.F. Cyclic Adsorption/Thermal Regeneration of Activated Carbons. J. Anal. Appl. Pyrolysis 2014, 106, 112–117. [Google Scholar] [CrossRef]
- Silvestre-Albero, A.; Silvestre-Albero, J.; Sepúlveda-Escribano, A.; Rodriguéz-Reinoso, F. Ethanol Removal Using Activated Carbon: Effect of Porous Structure and Surface Chemistry. Microporous Mesoporous Mater. 2009, 120, 62–68. [Google Scholar] [CrossRef]
- Bradley, R.H.; Smith, M.W.; Andreu, A.; Falco, M. Surface Studies of Novel Hydrophobic Active Carbons. Appl. Surf. Sci. 2011, 257, 2912–2919. [Google Scholar] [CrossRef]
- Wolak, E.; Vogt, E.B.; Szczurowski, J. Chemical and Hydrophobic Modification of Activated WD-Extra Carbon. E3S Web Conf. 2017, 14, 02033. [Google Scholar] [CrossRef]
- Figueiredo, J.L.; Pereira, M.F.R.; Freitas, M.M.A.; Órfão, J.J.M. Modification of the Surface Chemistry of Activated Carbons. Carbon 1999, 37, 1379–1389. [Google Scholar] [CrossRef]
- Barroso-Bogeat, A.; Alexandre-Franco, M.; Fernández-González, C.; Gómez-Serrano, V. FT-Ir Analysis of Pyrone and Chromene Structures in Activated Carbon. Energy Fuels 2014, 28, 4096–4103. [Google Scholar] [CrossRef]
- Petrovic, B.; Gorbounov, M.; Masoudi Soltani, S. Impact of Surface Functional Groups and Their Introduction Methods on the Mechanisms of CO2 Adsorption on Porous Carbonaceous Adsorbents. Carbon Capture Sci. Technol. 2022, 3, 100045. [Google Scholar] [CrossRef]
- Fletcher, A.J.; Uygur, Y.; Mark Thomas, K. Role of Surface Functional Groups in the Adsorption Kinetics of Water Vapor on Microporous Activated Carbons. J. Phys. Chem. C 2007, 111, 8349–8359. [Google Scholar] [CrossRef]
- Liu, H.; Yu, Y.; Shao, Q.; Long, C. Separation and Puri Fi Cation Technology Porous Polymeric Resin for Adsorbing Low Concentration of VOCs: Unveiling Adsorption Mechanism and e Ff Ect of VOCs’ Molecular Properties. Sep. Purif. Technol. 2019, 228, 115755. [Google Scholar] [CrossRef]
- Qi, N.; LeVan, M.D. Adsorption Equilibrium Modeling for Water on Activated Carbons. Carbon 2005, 43, 2258–2263. [Google Scholar] [CrossRef]
- Wilkins, N.S.; Rajendran, A.; Farooq, S. Dynamic Column Breakthrough Experiments for Measurement of Adsorption Equilibrium and Kinetics. Adsorption 2021, 27, 397–422. [Google Scholar] [CrossRef]
- Baeyens, J.; Kang, Q.; Appels, L.; Dewil, R.; Lv, Y.; Tan, T. Challenges and Opportunities in Improving the Production of Bio-Ethanol. Prog. Energy Combust. Sci. 2015, 47, 60–88. [Google Scholar] [CrossRef]
- Fletcher, A.J.; Yüzak, Y.; Thomas, K.M. Adsorption and Desorption Kinetics for Hydrophilic and Hydrophobic Vapors on Activated Carbon. Carbon 2006, 44, 989–1004. [Google Scholar] [CrossRef]
- Bowen, T.C.; Vane, L.M. Ethanol, Acetic Acid, and Water Adsorption from Binary and Ternary Liquid Mixtures on High-Silica Zeolites. Langmuir 2006, 22, 3721–3727. [Google Scholar] [CrossRef]
- Krings, U.; Kelch, M.; Berger, R.G. Adsorbents for the Recovery of Aroma Compounds in Fermentation Processes. J. Chem. Technol. Biotechnol. 1993, 58, 293–299. [Google Scholar] [CrossRef]
- Claessens, B.; Cousin-saint-remi, J.; Denayer, J.F.M. Efficient Downstream Processing of Renewable Alcohols Using Zeolite Adsorbents; Springer: Cham, Switzerland, 2020. [Google Scholar]
- Walker, G.M.; Stewart, G.G. Saccharomyces Cerevisiae in the Production of Fermented Beverages. Beverages 2016, 2, 30. [Google Scholar] [CrossRef]
- Henrique, G.; Ponce, S.F.; Moreira, J.; Santos, S.; Jesus, D.; César, J.; Miranda, D.C.; Maciel, R.; Ramos, R.; Andrade, D.; et al. Sugarcane Molasses Fermentation with in Situ Gas Stripping Using Low and Moderate Sugar Concentrations for Ethanol Production: Experimental Data and Modeling. Biochem. Eng. J. 2016, 110, 152–161. [Google Scholar] [CrossRef]
- Ouzzine, M.; Romero-Anaya, A.J.; Lillo-Ródenas, M.A.; Linares-Solano, A. Spherical Activated Carbons for the Adsorption of a Real Multicomponent VOC Mixture. Carbon 2019, 148, 214–223. [Google Scholar] [CrossRef]
- Hu, Z.; Zhang, H.; Zhang, X.F.; Jia, M.; Yao, J. Polyethylenimine Grafted ZIF-8@cellulose Acetate Membrane for Enhanced Gas Separation. J. Memb. Sci. 2022, 662, 120996. [Google Scholar] [CrossRef]
- Wei, Y.; Zhao, T.; Wang, J.; Chen, Y.; Wang, Q.; Liu, X.; Zhao, Y. Ultramicroporous Carbon Molecular Sieve for Air Purification by Selective Adsorption Low-Concentration CO2 and VOC Molecules. Ind. Eng. Chem. Res. 2023, 62, 7635–7641. [Google Scholar] [CrossRef]
- Sonego, J.L.S.; Lemos, D.A.; Rodriguez, G.Y.; Cruz, A.J.G.; Badino, A.C. Extractive Batch Fermentation with CO2 Stripping for Ethanol Production in a Bubble Column Bioreactor: Experimental and Modeling. Energy Fuels 2014, 28, 7552–7559. [Google Scholar] [CrossRef]
- Cho, C.W.; Hwang, S.T. Continuous Membrane Fermentor Separator for Ethanol Fermentation. J. Membr. Sci. 1991, 57, 21–42. [Google Scholar] [CrossRef]
- Ponce, G.H.S.F.; Miranda, J.C.C.; Alves, M.; Maria, R.M.; Maciel, R.; De Andrade, R.R.; Conto, L.C. De Simulation, Analysis and Optimization of an In Situ Gas Stripping Fermentation Process in a Laboratory Scale for Bioethanol Production. Chem. Eng. 2014, 37, 295–300. [Google Scholar] [CrossRef]
- Seo, D.J.; Takenaka, A.; Fujita, H.; Mochidzuki, K.; Sakoda, A. Practical Considerations for a Simple Ethanol Concentration from a Fermentation Broth via a Single Adsorptive Process Using Molecular-Sieving Carbon. Renew. Energy 2018, 118, 257–264. [Google Scholar] [CrossRef]
- Gabrišová, L.; Peciar, P.; Macho, O.; Juriga, M.; Galbavá, P.; Nižnanská, Ž.; Kubinec, R.; Valent, I.; Peciar, M. The Development of a New Adsorption-Desorption Device. Acta Polytech. 2020, 60, 455–461. [Google Scholar] [CrossRef]
- Perry, R.H. Perry’s Chemical Engineering Handbook; McGraw-Hill Inc.: New York, NY, USA, 2007. [Google Scholar]
- Kwon, S.H.; Cho, D. A Comparative, Kinetic Study on Cork and Activated Carbon Biofilters for VOC Degradation. J. Ind. Eng. Chem. 2009, 15, 129–135. [Google Scholar] [CrossRef]
- Bley, M.; Duvail, M.; Guilbaud, P.; Penisson, C.; Theisen, J.; Gabriel, J.; Dufrêche, J. Molecular Simulation of Binary Phase Diagrams from the Osmotic Equilibrium Method: Vapour Pressure and Activity in Water—Ethanol Mixtures. Mol. Phys. 2018, 116, 2009–2021. [Google Scholar] [CrossRef]
- Waller, R.; Strang, T.J.K. Physical Chemical Properties of Preservative Solutions—1. Ethanol-Water Solutions. Collect. Forum 1996, 12, 70–85. [Google Scholar]
- 13322-2: ISO 13322-2; Particle Size Analysis—Imange Analysis Methods—Dynamic Image Analysis. International Organization for Standardization: Geneva, Switzerland, 2006.
- 9276-6: ISO 9276-6; Representation of Results of Particle Size Analysis—Descriptive and Quantitative Representation of Particle Shape and Morphology. International Organization for Standardization: Geneva, Switzerland, 2008.
- Faisal, A.; Zhou, M.; Hedlund, J.; Grahn, M. Recovery of Butanol from Model ABE Fermentation Broths Using MFI Adsorbent: A Comparison between Traditional Beads and a Structured Adsorbent in the Form of a Film. Adsorption 2016, 22, 205–214. [Google Scholar] [CrossRef]
- Pellenz, L.; de Oliveira, C.R.S.; da Silva Júnior, A.H.; da Silva, L.J.S.; da Silva, L.; Ulson, S.M.D.A.G.; de Souza, A.A.U.; Borba, F.H.; da Silva, A. A Comprehensive Guide for Characterization of Adsorbent Materials. Sep. Purif. Technol. 2023, 305, 122435. [Google Scholar] [CrossRef]
- Oumi, Y.; Miyajima, A.; Miyamoto, J.; Sano, T. Binary Mixture Adsorption of Water and Ethanol on Silicalite. In Proceedings of the Studies in Surface Science and Catalysis; Elsevier: Amsterdam, The Netherlands, 2002; Volume 142, pp. 1595–1602. [Google Scholar]
- Thommes, M.; Kaneko, K.; Neimark, A.V.; Olivier, J.P.; Rodriguez-Reinoso, F.; Rouquerol, J.; Sing, K.S.W. Physisorption of Gases, with Special Reference to the Evaluation of Surface Area and Pore Size Distribution (IUPAC Technical Report). Pure Appl. Chem. 2015, 87, 1051–1069. [Google Scholar] [CrossRef]
- Okolo, G.N.; Everson, R.C.; Neomagus, H.W.J.P.; Roberts, M.J.; Sakurovs, R. Comparing the Porosity and Surface Areas of Coal as Measured by Gas Adsorption, Mercury Intrusion and SAXS Techniques. Fuel 2015, 141, 293–304. [Google Scholar] [CrossRef]
- Kazak, O.; Ramazan Eker, Y.; Bingol, H.; Tor, A. Preparation of Activated Carbon from Molasses-to-Ethanol Process Waste Vinasse and Its Performance as Adsorbent Material. Bioresour. Technol. 2017, 241, 1077–1083. [Google Scholar] [CrossRef]
- Chen, X.; Jeyaseelan, S.; Graham, N. Physical and Chemical Properties Study of the Activated Carbon Made from Sewage Sludge. Waste Manag. 2002, 22, 755–760. [Google Scholar] [CrossRef]
- Bansal, R.C.; Goyal, M. Activated Carbon Adsorption; CRC: Boca Raton, FL, USA, 2005. [Google Scholar]
- Hashi, M.; Thibault, J.; Tezel, F.H. Recovery of Ethanol from Carbon Dioxide Stripped Vapor Mixture: Adsorption Prediction and Modeling. Ind. Eng. Chem. Res. 2010, 49, 8733–8740. [Google Scholar] [CrossRef]
- Tronchoni, J.; Gamero, A.; Arroyo-lópez, F.N.; Barrio, E.; Querol, A. International Journal of Food Microbiology Differences in the Glucose and Fructose Consumption pro Fi Les in Diverse Saccharomyces Wine Species and Their Hybrids during Grape Juice Fermentation. Int. J. Food Microbiol. 2009, 134, 237–243. [Google Scholar] [CrossRef]
- Berthels, N.J. Discrepancy in Glucose and Fructose Utilisation during Fermentation by Saccharomyces Cerevisiae Wine Yeast Strains. FEMS Yeast Res. 2004, 4, 683–689. [Google Scholar] [CrossRef]
- Taylor, P.; Nongonierma, A.; Voilley, A.; Cayot, P.; Quéré, L.; Springett, M.; Springett, M.; Voilley, A. Mechanisms of Extraction of Aroma Compounds from Foods, Using Adsorbents. Effect of Various Parameters. Food Rev. Int. 2006, 22, 51–94. [Google Scholar] [CrossRef]


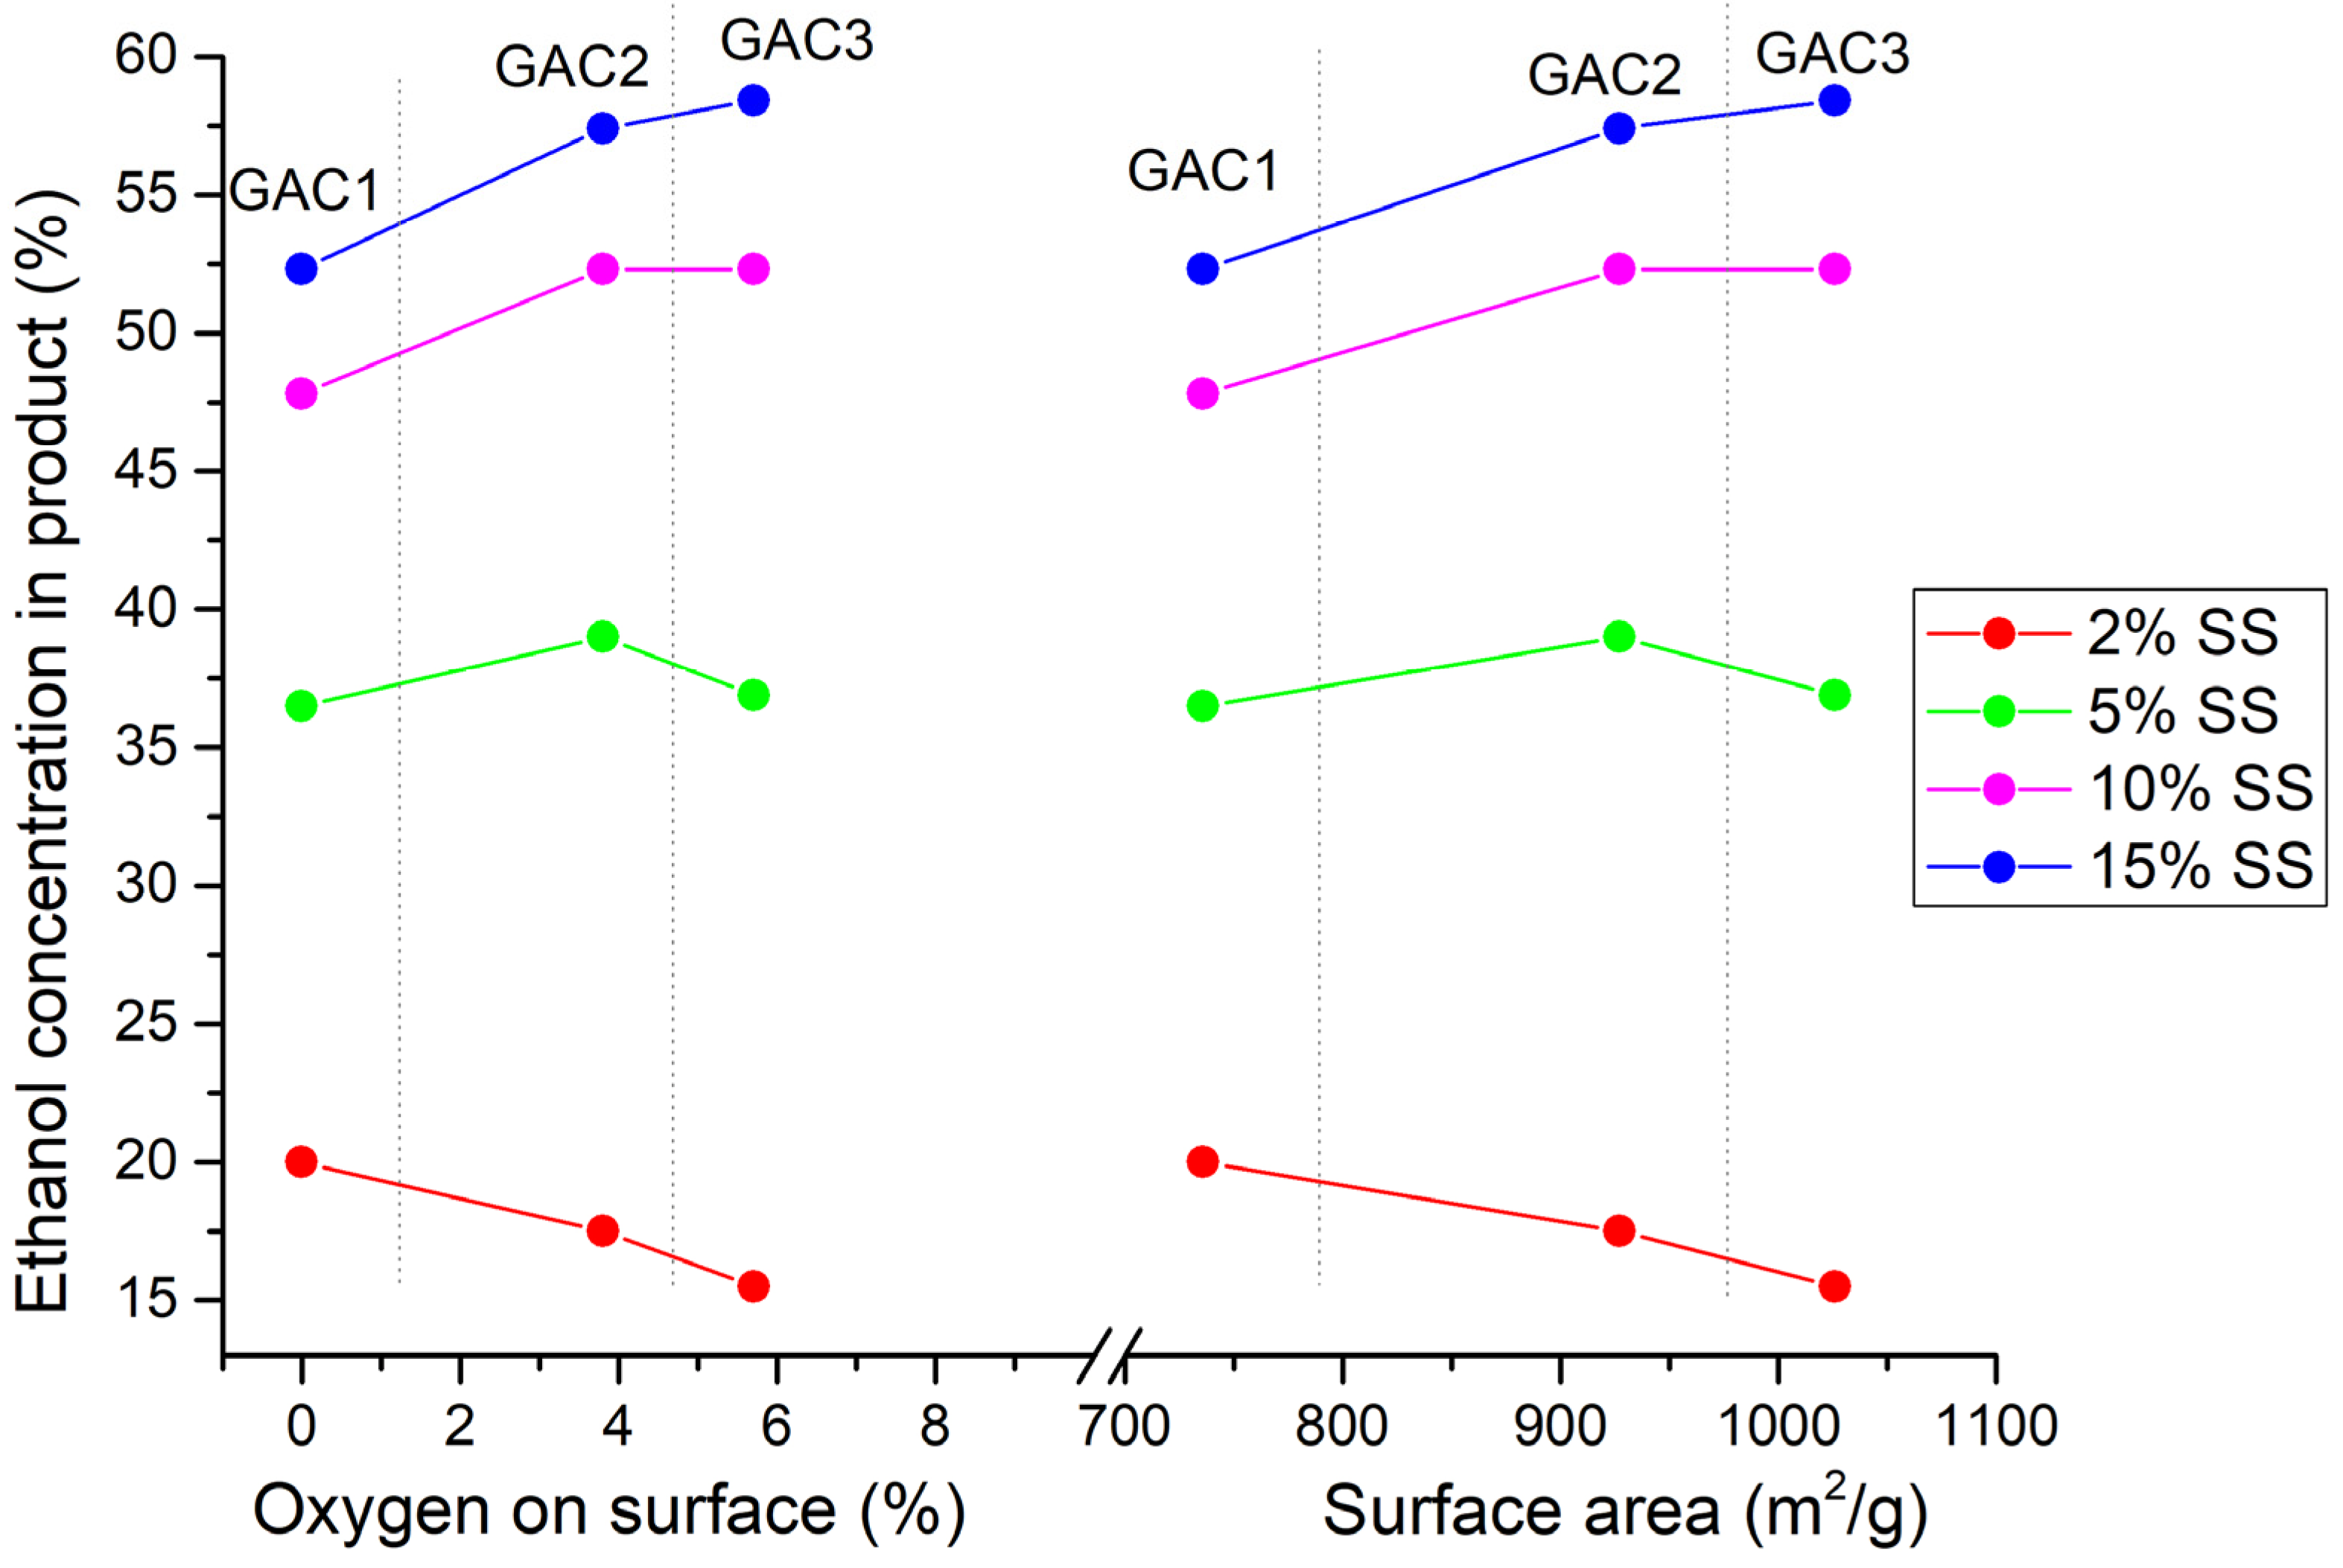
| Type GAC | SA (m2/g) | O (%) | C (%) | Vp (cm3/g) | rp (nm) |
|---|---|---|---|---|---|
| GAC1 | 736.12 | 0 | 98.6 | 0.524 | 1.721 |
| GAC2 | 927.23 | 3.8 | 95.4 | 0.575 | 1.652 |
| GAC3 | 1025.97 | 5.7 | 92.5 | 0.626 | 1.769 |
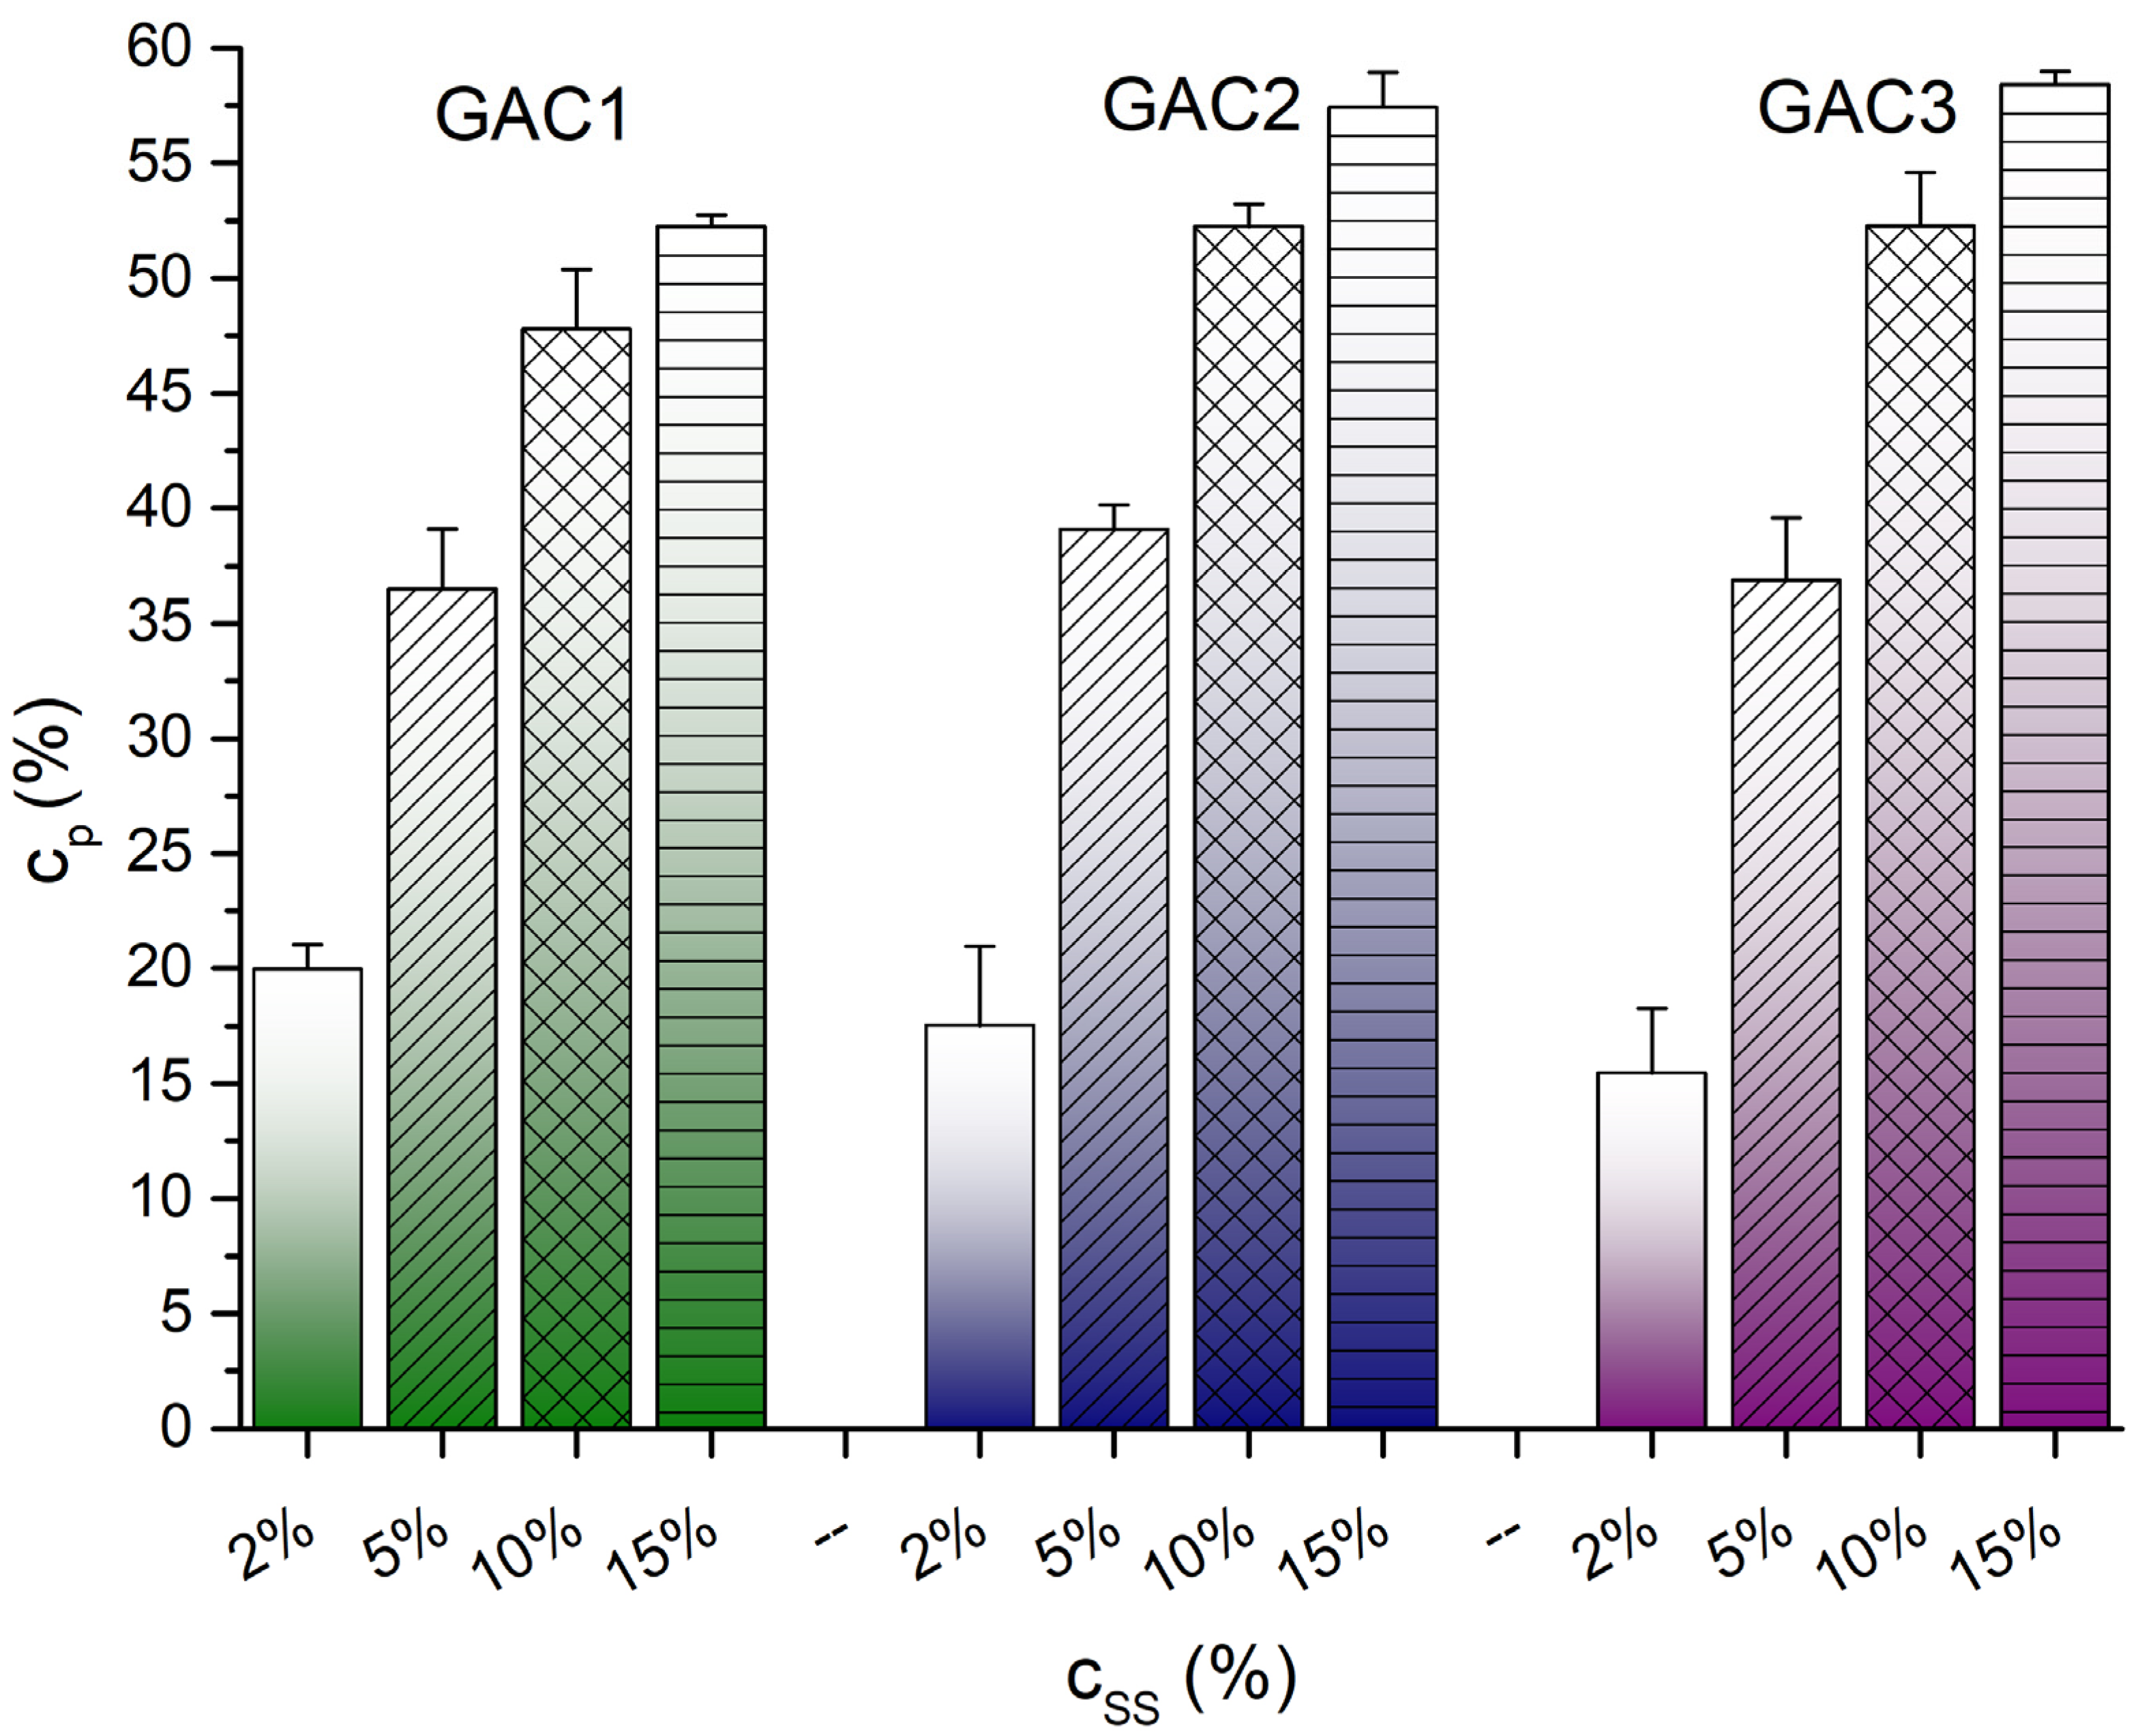
| GAC1 | GAC2 | GAC3 | |
|---|---|---|---|
| cSS (%) | cp (%) | cp (%) | cp (%) |
| 2 | 19.97 ± 1.05 | 17.52 ± 3.44 | 15.46 ± 2.80 |
| 5 | 36.50 ± 2.60 | 39.08 ± 1.05 | 36.88 ± 2.70 |
| 10 | 47.79 ± 2.59 | 52.25 ± 0.99 | 52.27 ± 2.34 |
| 15 | 52.25 ± 0.50 | 57.42 ± 1.53 | 58.42 ± 0.55 |
| GAC | Model Parameter | R2 | ||
|---|---|---|---|---|
| A | B | C | ||
| GAC1 | −124.549 | 0.0175 | 193.018 | 0.9983 |
| GAC2 | −2.272 × 10⁻³ | 0.353 | 15.091 | 0.9952 |
| GAC3 | −8.698 × 10⁻⁴ | 0.382 | 12.901 | 0.9978 |
Disclaimer/Publisher’s Note: The statements, opinions and data contained in all publications are solely those of the individual author(s) and contributor(s) and not of MDPI and/or the editor(s). MDPI and/or the editor(s) disclaim responsibility for any injury to people or property resulting from any ideas, methods, instructions or products referred to in the content. |
© 2023 by the authors. Licensee MDPI, Basel, Switzerland. This article is an open access article distributed under the terms and conditions of the Creative Commons Attribution (CC BY) license (https://creativecommons.org/licenses/by/4.0/).
Share and Cite
Gabrišová, Ľ.; Macho, O.; Juriga, M.; Gábrišová, Z.; Valent, I.; Kabát, J.; Blaško, J.; Kubinec, R. Separation of VOC Gaseous Mixtures Using an Adsorption–Desorption Device. Processes 2023, 11, 2572. https://doi.org/10.3390/pr11092572
Gabrišová Ľ, Macho O, Juriga M, Gábrišová Z, Valent I, Kabát J, Blaško J, Kubinec R. Separation of VOC Gaseous Mixtures Using an Adsorption–Desorption Device. Processes. 2023; 11(9):2572. https://doi.org/10.3390/pr11092572
Chicago/Turabian StyleGabrišová, Ľudmila, Oliver Macho, Martin Juriga, Zuzana Gábrišová, Ivan Valent, Juraj Kabát, Jaroslav Blaško, and Róbert Kubinec. 2023. "Separation of VOC Gaseous Mixtures Using an Adsorption–Desorption Device" Processes 11, no. 9: 2572. https://doi.org/10.3390/pr11092572
APA StyleGabrišová, Ľ., Macho, O., Juriga, M., Gábrišová, Z., Valent, I., Kabát, J., Blaško, J., & Kubinec, R. (2023). Separation of VOC Gaseous Mixtures Using an Adsorption–Desorption Device. Processes, 11(9), 2572. https://doi.org/10.3390/pr11092572