1. Introduction
Biomass is one of the most important renewable sources of energy to reduce carbon emissions and combat climate change caused by fossil fuels. Biomass mainly consists of wood (or forestry crops) and wood processing residues (e.g., firewood and wood chips), agricultural crops and residues (e.g., rice, corn, wheat, soybeans, and algae), dedicated energy crops (e.g., switchgrass, miscanthus, fast-growing willow, and poplar), municipal solid waste (e.g., paper, cotton, and plastic), animal waste (e.g., poultry litter and pig manure), sewage, and industrial waste (e.g., black liquor and peelings and scraps from fruit and vegetables) [
1]. The increasing demand for animal and protein products (e.g., egg, meat) has led to a high number of animal feeding operations and massive quantities of poultry litter. There is an increasing trend of using poultry litter as an alternative biomass resource because improper excess land application causes environmental issues (e.g., nitrate contamination, water pollution) [
2]. Energy and exergy efficiency in a thermal conversion process of biomass into energy has been a subject of concern for researchers, thermal plant operators, energy policy makers, and consumers. Improving the efficiency of energy generation and consuming systems is ultimately cost effective and environmentally friendly, albeit usually not initially [
3]. Thermochemical processes involve the burning of biomass fuels at various temperatures, mostly greater than 400 °C, to produce the desired end products (e.g., heat, electricity, liquid fuels). These processes include pyrolysis, which produces oil and char (300–800 °C); gasification, which produces syngas (hydrogen) (600–700 °C); and combustion, which produces heat energy (900–1300 °C). Co-combustion of poultry litter has proven to be a suitable process for generation of both heat and electricity [
4] using a fluidized-bed combustion system.
The First Law of Thermodynamics (FLT) governs the amount of energy lost or gained in a process, and energy cannot be created nor destroyed [
3]. In contrast, exergy is always destroyed when a process is irreversible (such as loss of heat to the environment). This explains the Second Law of Thermodynamics (SLT). FLT analysis alone fails to identify the quality of the dissipated energy and how much work potential is available. To assess both the quantity (via energy analysis) and the quality (via exergy analysis) of the energy transfer, both the FLT and SLT must be used in conjunction with each other to provide a more thorough understanding of the conversion inefficiencies, termed exergy, which is defined as the maximum theoretical work that a system can achieve when it comes into equilibrium with the environment or reaches the dead state [
5]. Exergy analysis is a practical approach to evaluate the merit of energy conversion or distribution processes and systems. With the aid of energy analysis, the performance of an energy conversion system cannot be evaluated efficiently and precisely, but an exergy analysis complements and enhances an energy analysis [
6]. Exergy is consumed during real processes—due to irreversibility—and is conserved during ideal processes. Exergy analysis is a powerful tool for developing, evaluating, and improving an energy conversion system. The growing energy supply and demand have created an interest in plant equipment efficiency and the optimization of existing thermal power plants. The interest in using energy and exergy modeling techniques for energy utilization assessments has been increased in order to attain energy and financial savings [
7,
8,
9,
10]. Exergy analysis has been used to analyze several energy systems, including the steam power plant [
11], feed-water heating repowering of natural gas-fired steam power systems [
12], round-coupled heat pump systems with two horizontal ground heat exchangers [
13], and heat exchanger networks in a complex natural gas refinery [
14]. Previous exergy analysis results have indicated inefficient heat exchangers and a high potential for improvement in a huge energy-consuming industrial systems application.
The shell-and-tube heat exchanger (STHE) is a type of heat exchanger which has been widely used in several industries, such as chemicals, petroleum refining, and power generation, because it has much lower production cost, is easily cleaned, and is considered as more flexible in utility when compared with other heat exchangers [
15]. Due to the widespread application of the STHE, it is necessary to improve its performance [
16]. Previous studies have been carried out on exergy analysis of the STHE using graphene oxide nanofluids [
17], hot water [
18], and tap water [
19], but limited research was performed to investigate the exergy analysis of the STHE using flue gas as a medium.
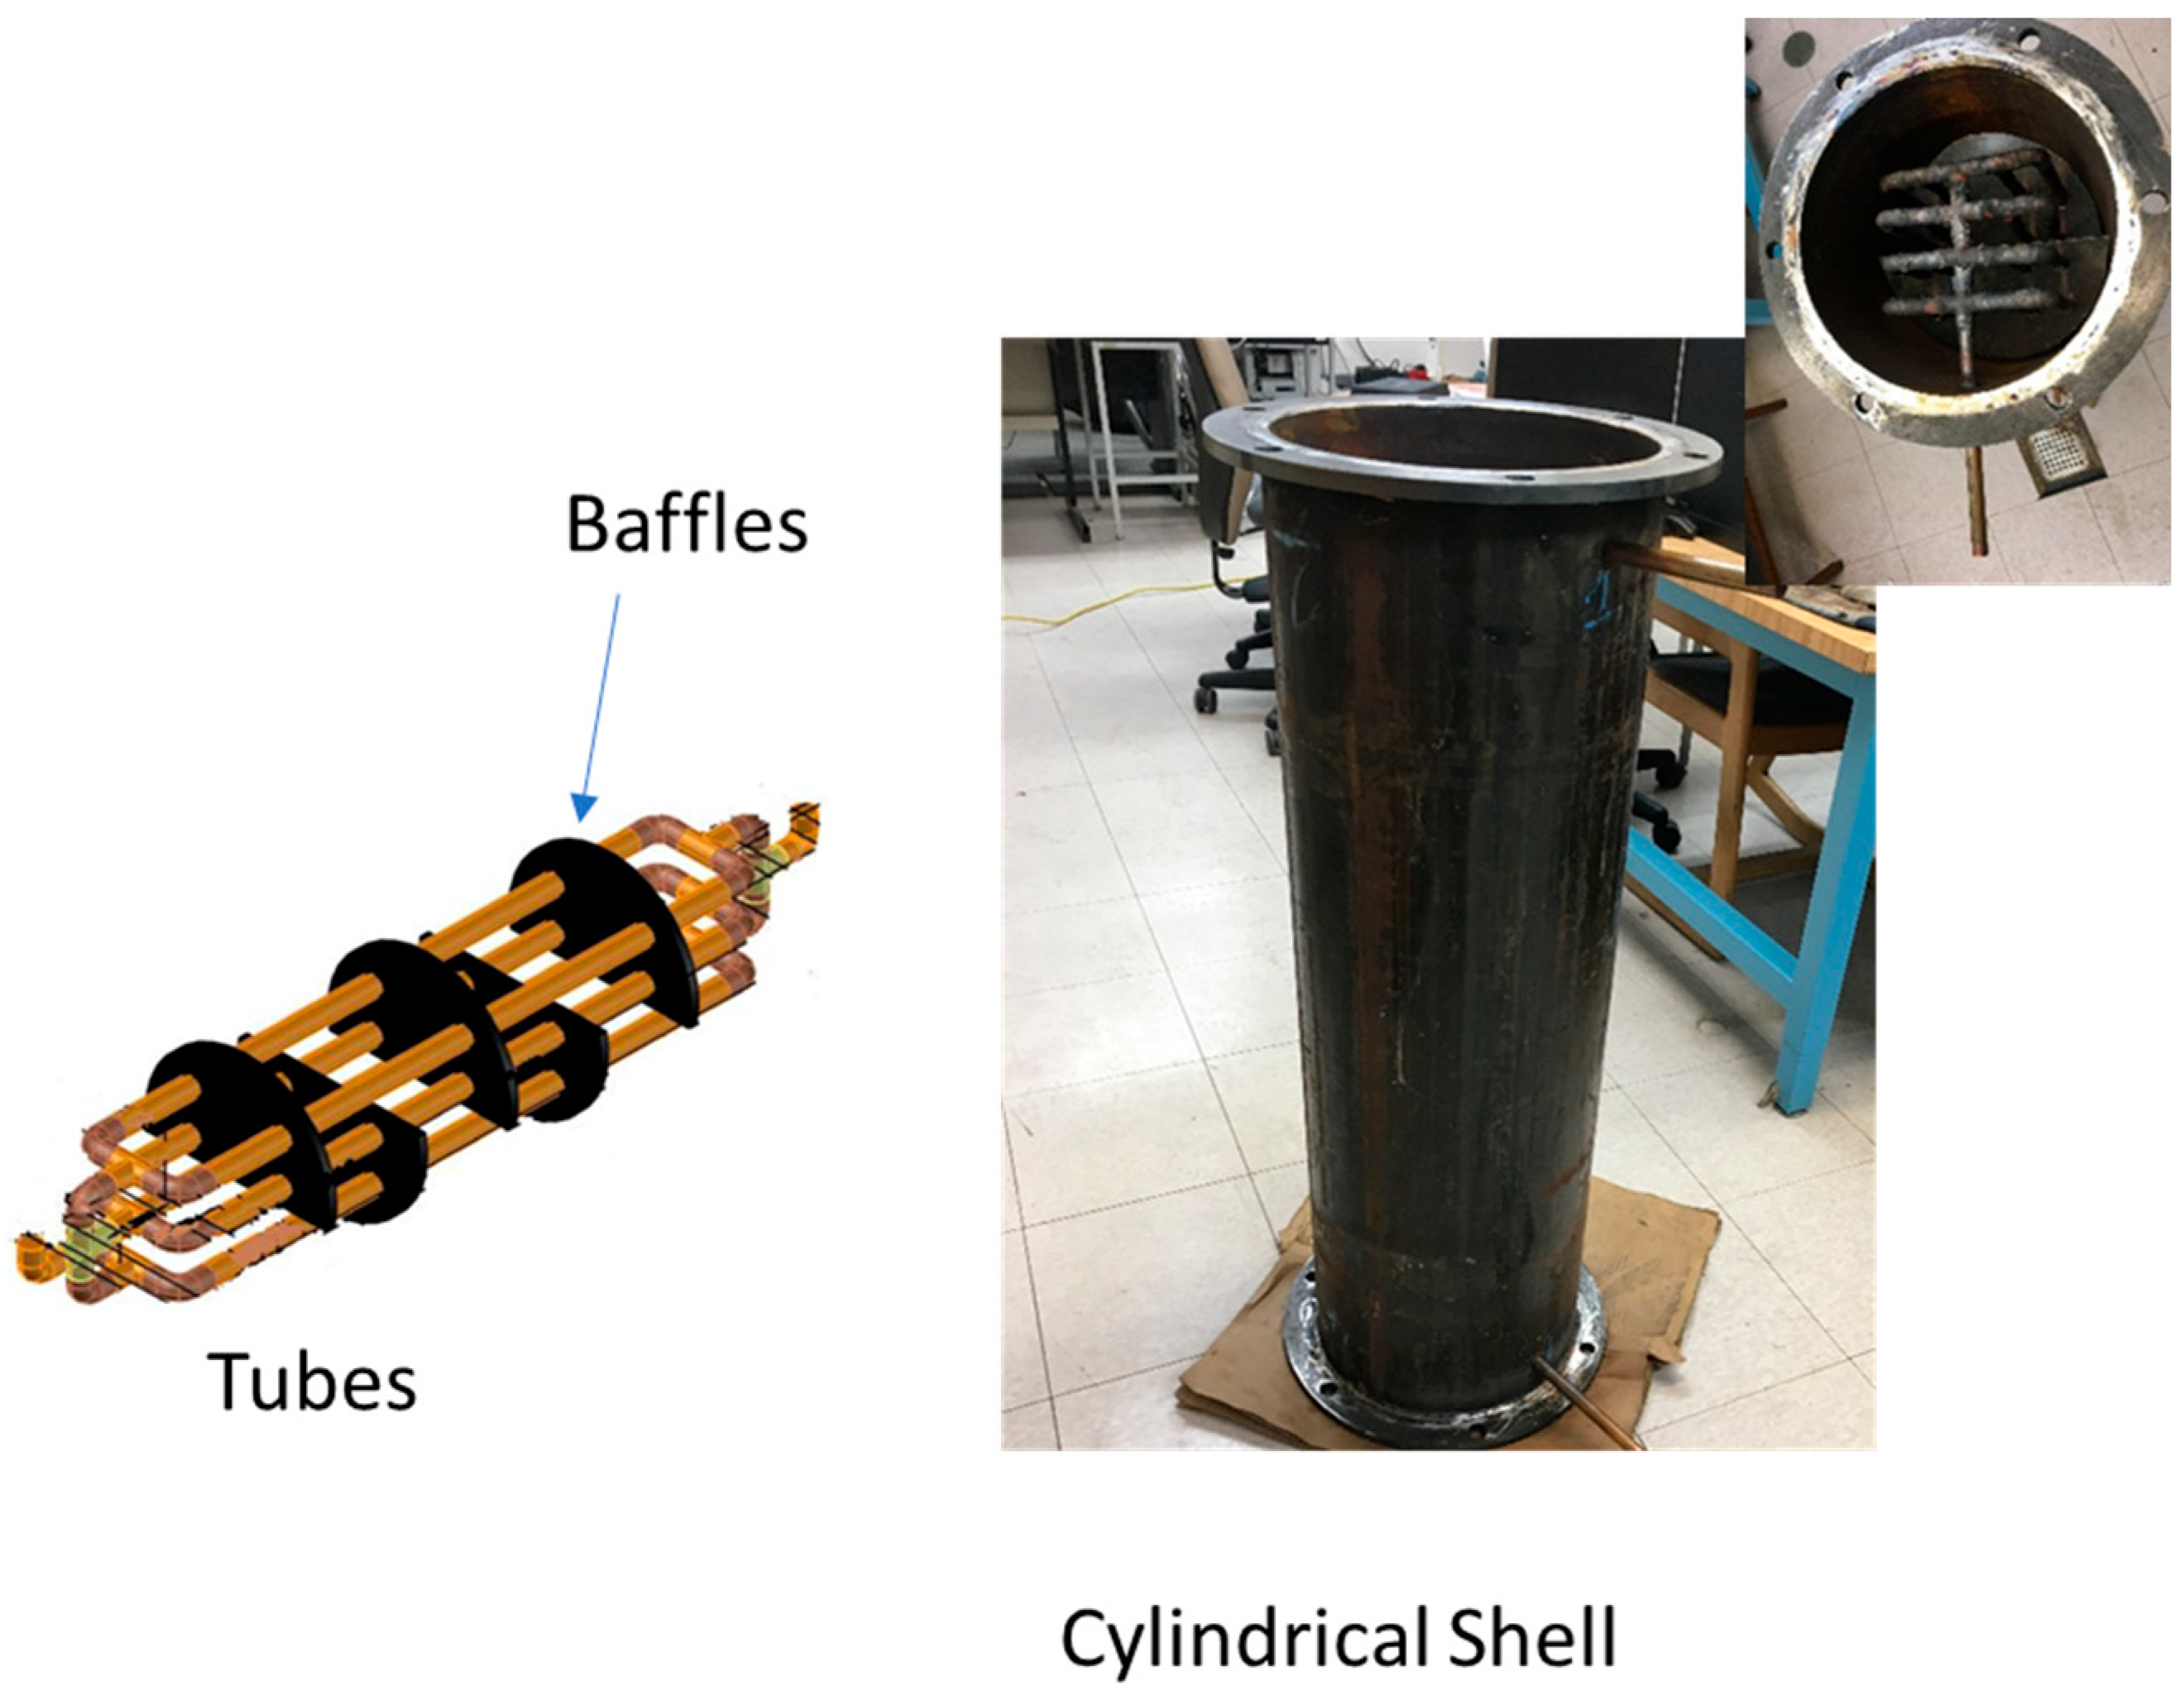
In the pioneering studies conducted within our research team (that is, CAESECT Lab), a lab-scale STHE has been designed by our team as shown in
Figure 1, and the system has been evaluated to investigate the effects of tube shape, flow direction, and water flow rates on water and testing space temperature changes during the poultry litter co-combustion process [
4]. Then, follow-up research was performed to estimate heat transfer coefficients and evaluate performance in the pilot-scale twisted tube-based STHE [
20]. The STHE consisted of one shell, sixteen twisted tubes, and six segmental baffles. The objective of this present research work is to investigate the energy and exergy analysis of the designed STHE, in order to identify the system inefficiencies and the potential improvements by studying the effect of hot and cold fluid temperatures and flow rates, as well as ambient conditions, on the STHE system performance. The system investigated here is a closed-loop system that comprises the heat exchanger, the water tank, and two different arrangements of the air–water space heaters used in heat energy generation from the poultry litter co-combustion process. The counterflow arrangement of hot fluid (flue gas) flowing through the shell and cold fluid (water) flowing inside the tubes was used throughout the experiments conducted in this study. Furthermore, simulation of four different scenarios was performed to determine the optimal conditions to maximize exergy efficiency and minimize exergy loss in the designed STHE.
2. Materials and Methods
2.1. Experimental Set-Up
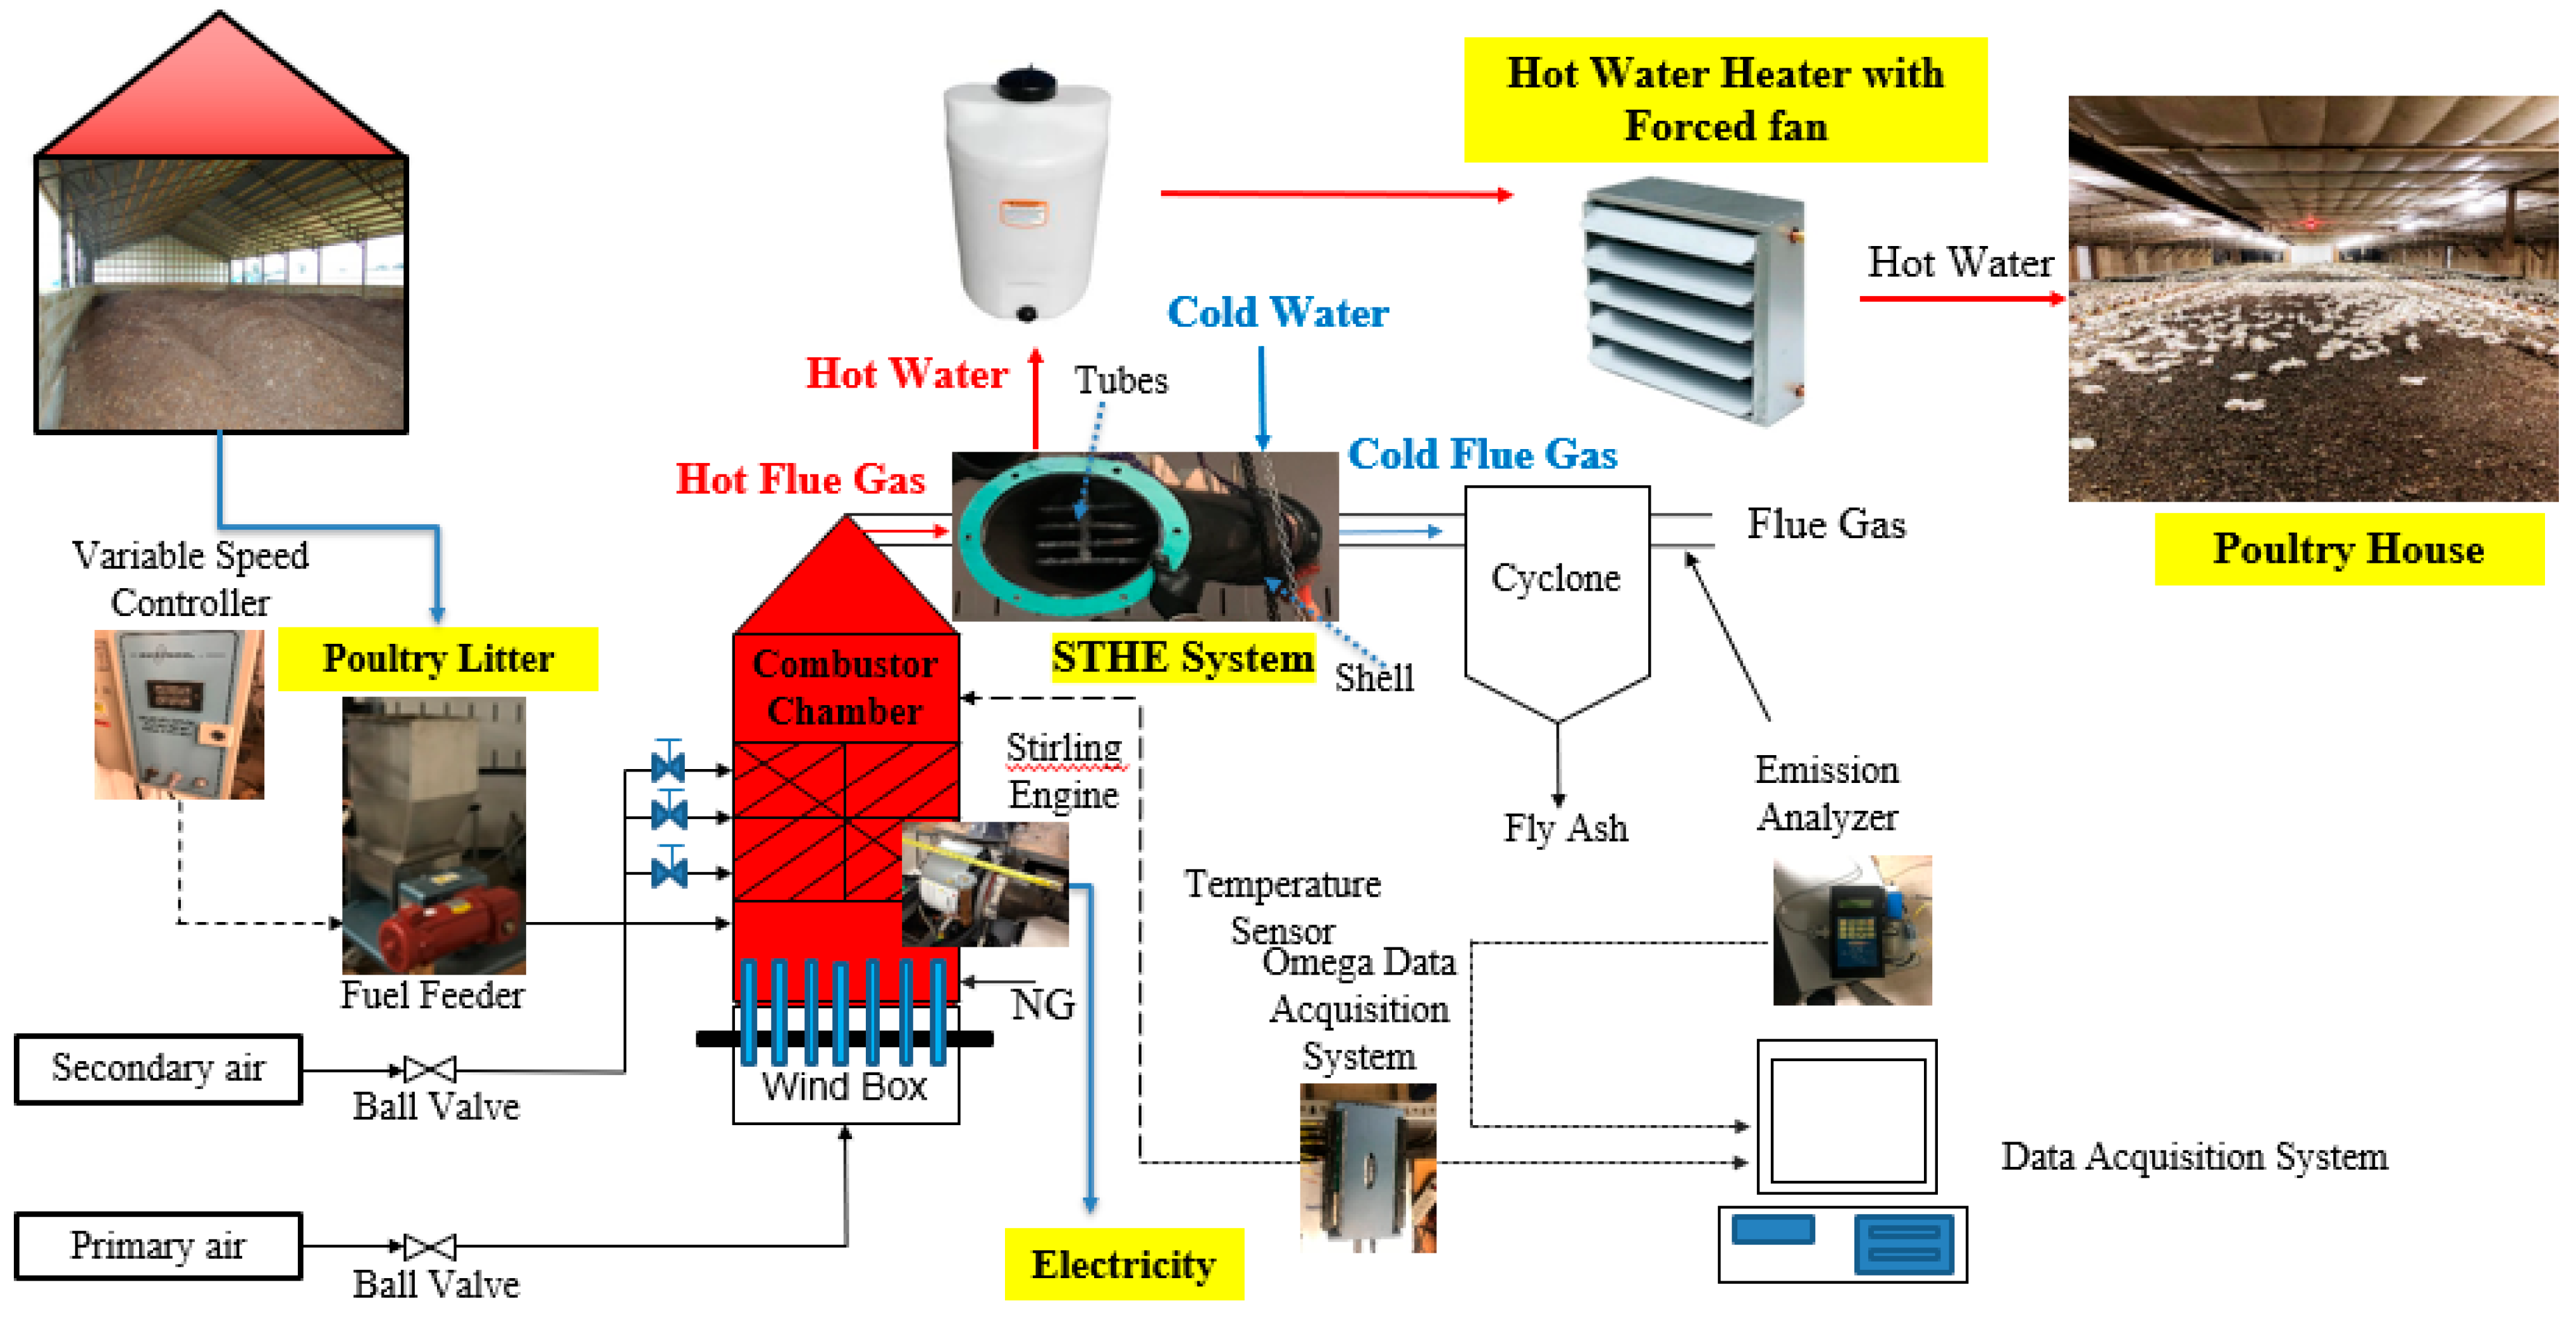
Figure 2 shows the conceptual diagram for the existing lab-scale fluidized-bed combustion (FBC) system, designed and fabricated for use in the Center for Advanced Energy Systems and Environmental Control Technologies (CAESECT). This FBC system had a diameter of 304.8 mm and a height of 1500 mm. The chamber was fabricated with a carbon steel pipe, covered inside with a 12.7 mm thickness refractory ceramic to reduce heat loss. The Primary Air (PA) for combustion was supplied at the bottom of the chamber at varying speeds. Above this line, the feed (poultry litter) was introduced from a screw feeder at a varying rate and the secondary air lines were introduced tangentially to the bed at heights of 650 mm, 850 mm, and 1100 mm [
4]. The screw-type feeder (Acrison, Moonachie, NJ, USA) was used to supply materials into the chamber, with a speed motor controller used to change the fuel feeding rate via changing rotational speed (rpm) of the screw feeder’s motor. The combustion air was supplied by two streams, primary air (PA) and secondary air (SA). PA was injected from a 1/8 hp blower through the wind box and primary air distributor, which allowed PA to act as both fluidization and combustion air. SA was injected symmetrically through four nozzles above the PA distributor at three different heights from a 1/125 hp blower. Airflow rates of both PA and SA were controlled by using the voltage regulator. A cyclone was fitted to the combustor exit to collect fly ash. A 1 kW free piston Stirling engine (E1.4B-00001), along with a control box from the Microgen Company, was integrated into this existing lab-scale FBC system at a height of 406.4 mm to simultaneously generate electricity and heat from various kinds of biomass resources. The cooling system for the Stirling engine include a radiator, cooling fan, and hot water pump in a closed-loop system. The heat recovery system installed comprised the designed STHE used to condense the total heat generated, which passed through the water-to-air heaters that were positioned in the poultry farm for space heating of the farm, as shown in
Figure 2. The collected poultry litter with 20–25% moisture content was combusted with natural gas in the lab-scale FBC at am 80:20 percent ratio. The STHE in this study was designed, fabricated, and inserted between the FBC system and the cyclone.
The specific heat of flue gas during the poultry litter and natural gas co-combustion process was calculated based on fuel composition, excess air (EA), and flue gas temperature. Fuel composition was assumed to be constant because the study’s poultry litter samples were collected from one farm (Bethel Farm, Salisbury, MD, USA), which also maintained a consistent farming process (e.g., bedding materials, cleaning periods, and farming practices).
For this new study, co-combustion of 7.08 kg/h poultry litter and 0.85 m3/h natural gas process was assumed to be the ideal case, whereas the complete combustion reaction for carbon, hydrogen, and sulfur in fuels with air was assumed to produce the flue gas and unburned residual products (i.e., ash). Nitrogen in poultry litter was not expected to react with oxygen because flue gas temperature during the co-combustion was less than 1000 °C. The operating parameters of the STHE in this investigation were 46.7 °C, 51.1 °C, 471 °C, and 157 °C for water-in temperature, water-out temperature, inlet flue gas, and exit flue gas temperatures, respectively. The mass flow rates of water and flue gas were 0.271 kg/s and 0.016 kg/s, the specific heat capacities were 4.19 kJ/kg·K and 1.025 kJ/kg·K for water and flue gas, and the ambient temperature was 8.8 °C.
The STHE in this study was arranged for counterflow with flue gas passing through the shell and water flowing through the twisted tubes, as shown in
Figure 2.
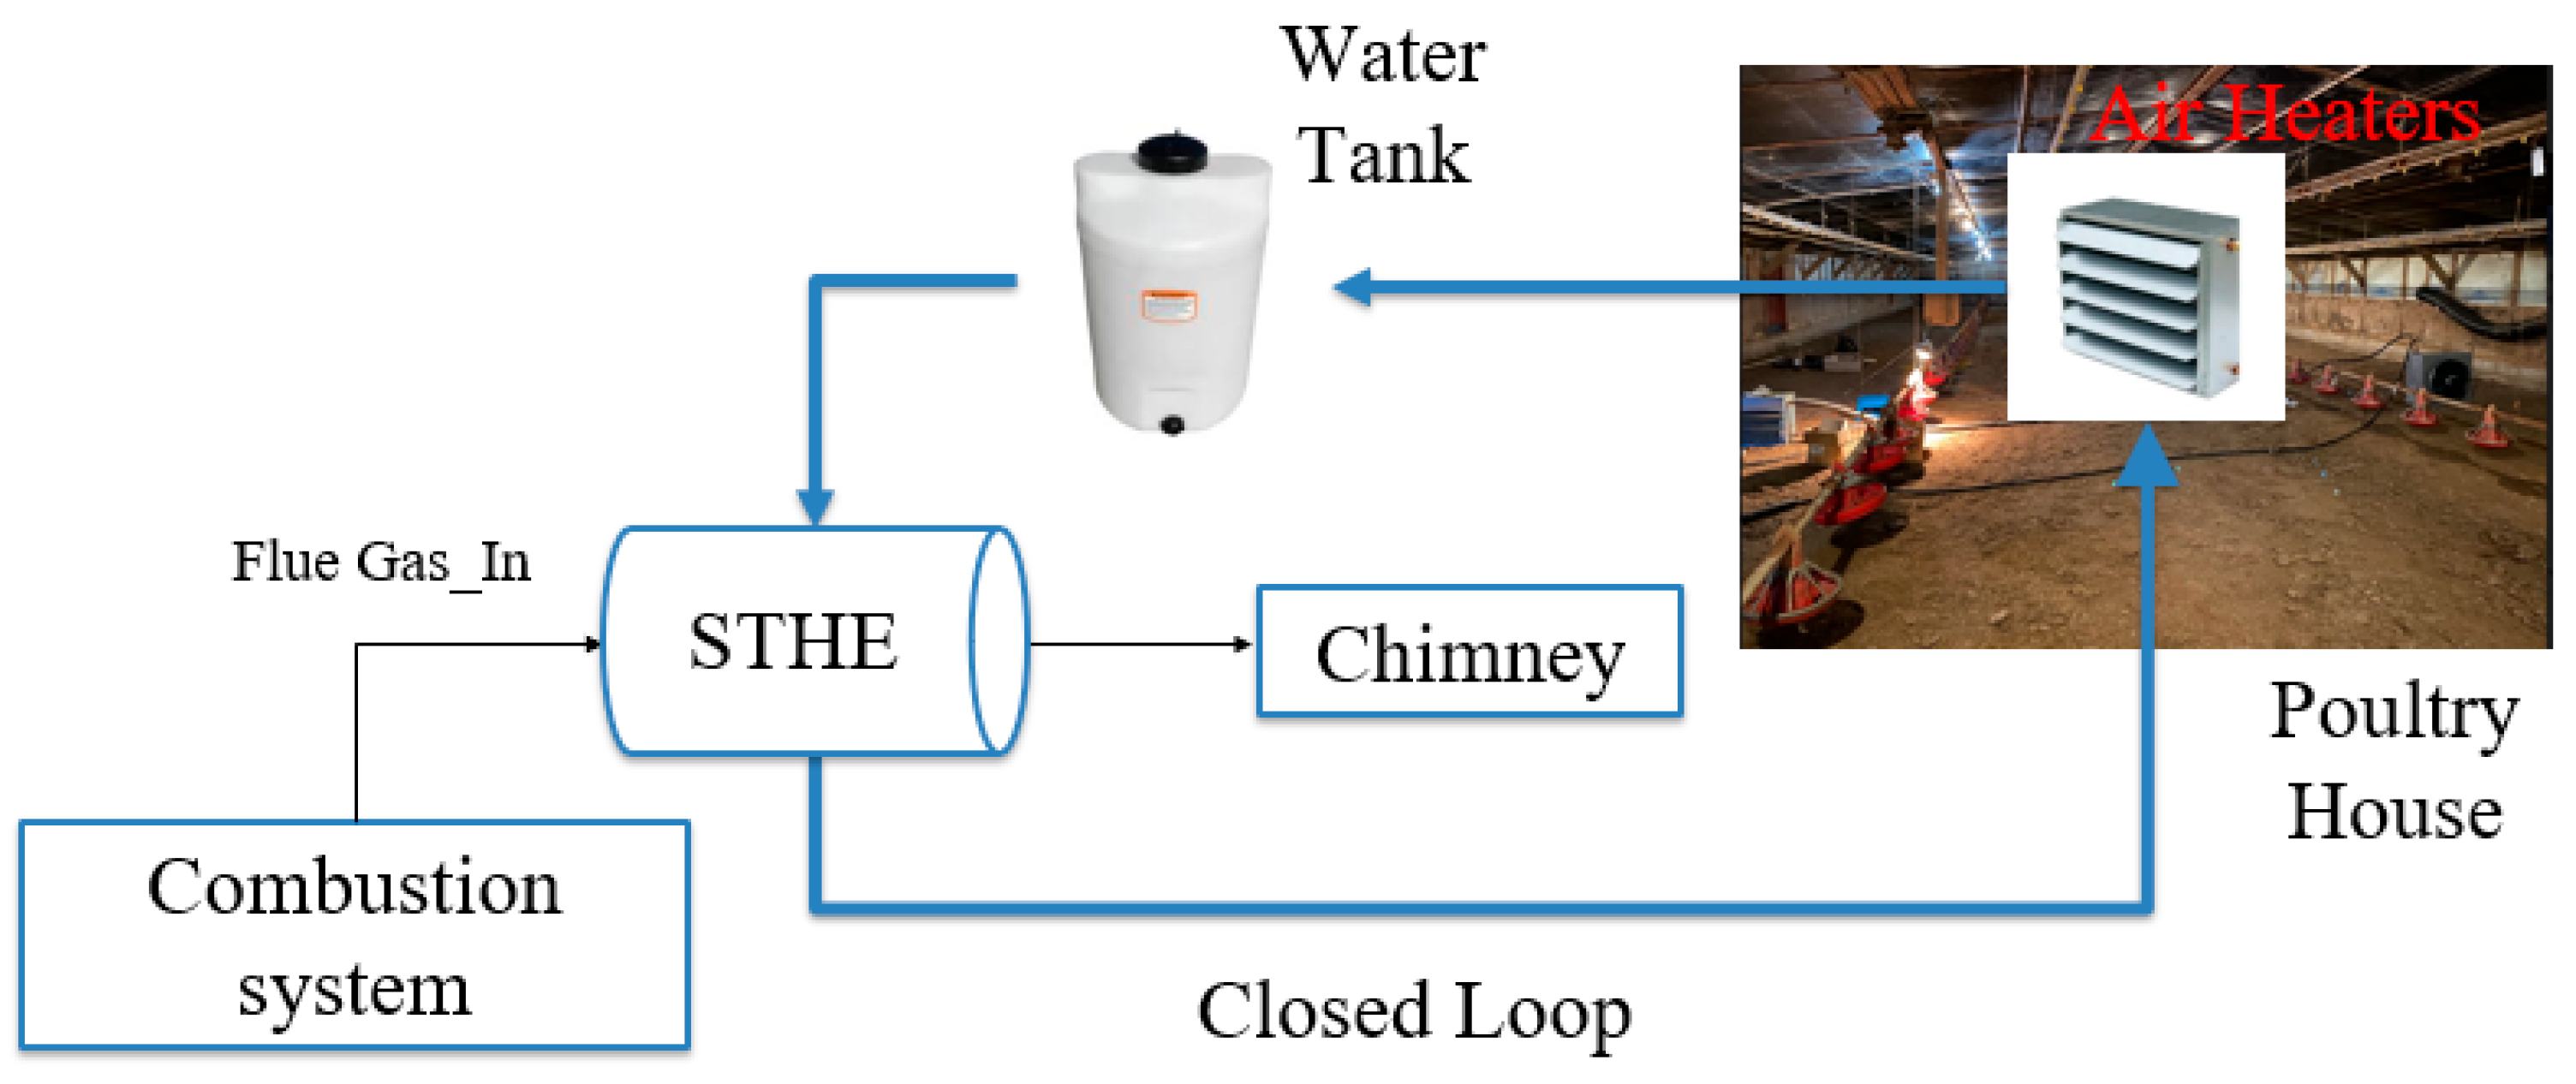
Figure 3 shows the connection of STHE, water tank, and air heaters in a closed loop.
2.2. Energy Analysis Models
We used the First Law of Thermodynamics, in terms of the conservation of energy, to quantify the amount of heat energy transferred from the hot flue gas to the water being circulated in a closed-loop system to, ultimately, provide heat to the poultry house. The complete energy analysis of the STHE in this study involved the estimation of heat load, effectiveness, overall heat, and thermal efficiency. The models used in this analysis are shown below in Equations (1)–(8) for the energy analysis. Heat transfer of the pilot-scale STHE system was determined by the heat load (or thermal energy), also known as heat flow rate, and was calculated as Equation (1). For this study, mass flow rate of the flue gas was determined theoretically via a mass balance, as shown in Equation (2).
where
= heat load, in kW;
= mass flow rate, in kg/s; cp = specific heat, in J/kg·K; and ∆T = change in temperature, in K.
The effectiveness (
) of a heat exchanger is defined as the ratio of the actual heat transfer to the maximum possible heat transfer. This term is used to express the efficiency of the heat exchanger. If external heat losses are low, energy efficiency of the exchanger should be higher than 90%.
Actual heat transfer is given as
where heat capacity rate for the hot flue gas is
, heat capacity rate for cold fluid (water) is
and minimum heat capacity rate between the two fluids (Cmin) = min(
,
) in J/s·°C; Th,i and Th,e = inlet/exit temperature of hot fluid, in °C; Tw,i and Tw,e = inlet/exit temperature of cold fluid, in °C;
= mass flow rate of flue gas, in kg/s;
= mass flow rate of cold fluid (water), in kg/s;
= specific heat of flue gas, in J/g °C; and
= specific heat of cold fluid (water), in J/g·°C. Maximum possible heat transfer (
max) is determined by the minimum value of heating capacity between the hot flue gas and the cold fluid.
The thermal efficiency of the STHE is often calculated by the ratio of output energy to the input energy. The theoretical efficiency is mostly determined using the concept of effectiveness, as shown in Equation (3). A true estimation of the efficiency of the STHE is based on the concept of Carnot cycle, given as
The Second Law of Thermodynamics indicates that a Carnot engine operating between two given temperatures has the greatest possible efficiency of any heat engine operating between these two temperatures, but irreversibility in any spontaneous system reduces the efficiency. The specific value of Carnot efficiency varies throughout a heat exchanger, as both hot and cold temperatures change; thus, Equation (7) requires integrating the temperature over the length of the exchanger.
The Overall Heat Transfer Coefficient (U) is expressed as
where Q = heat load of flue gas; A = heat exchanger area of tubes and arrangements; LMTD = Log Mean Temperature Difference, determined from two temperature differences ∆t1 and ∆t2 at each end of the heat exchanger, which can be expressed as
where ∆t1 = T1 − t2 and ∆t2 = T2 − t1; T1 = flue gas temperature at the inlet (°C); T2 = flue gas temperature at the exit (°C); t1 = water temperature at the inlet (°C); and t2 = water temperature at the exit (°C).
Thus, using the expression from Qian et al. [
20], Equation (6) becomes
2.3. Exergy Analysis Models
For the purpose of exergy balance, all types of exergy associated with material, heat, and work streams involved in a process have to be calculated using Equations (9)–(19) for the exergy analysis. The total exergy of a flow stream is expressed in terms of physical exergy (EX
ph), chemical exergy (EX
ch), kinetic exergy (EX
KE), and potential exergy (EX
PE) by [
21] as
Neglecting kinetic and potential terms, the total exergy of a material stream is expressed as the sum of the chemical exergy and physical exergy, as shown in Equation (10). The physical exergy is defined as the maximum work potential obtainable by taking the mass stream at thermal and mechanical equilibrium with the environment [
22]. The chemical exergy is associated with the departure of the chemical composition of a system from its chemical equilibrium. The chemical exergy is an important part of exergy of the combustion process.
The physical exergy is expressed as
where
is termed the specific exergy, defined as
The chemical exergy is expressed as an ideal mixture:
For the STHE in this study, only physical exergy was considered at the ambient temperature (To) and pressure (Po); then, Equation (12) was further expressed as follows:
Thus, inlet and outlet exergy for both flue gas and water were calculated as shown in Equations (16) and (17). The exergy loss is expressed as the difference between the inlet and outlet exergy values of the streams, as shown in Equation (18).
where
= specific heat of flue gas;
= specific heat of water;
= mass flow rate of flue gas;
= mass flow rate of water; Th,1 and Th,2 = in/out gas temperature; Tw,1 and Tw,2 = in/out water temperature; and T
0 = ambient temperature.
Overall exergy efficiency provides a more accurate description of how energy is being used. In other words, the theoretical ‘minimum’ exergy requirement of a device represents the best possible performance in reality. It can be expressed as
2.4. Experimental and Simulation Analysis of the Air–Water Space Heaters’ Arrangement
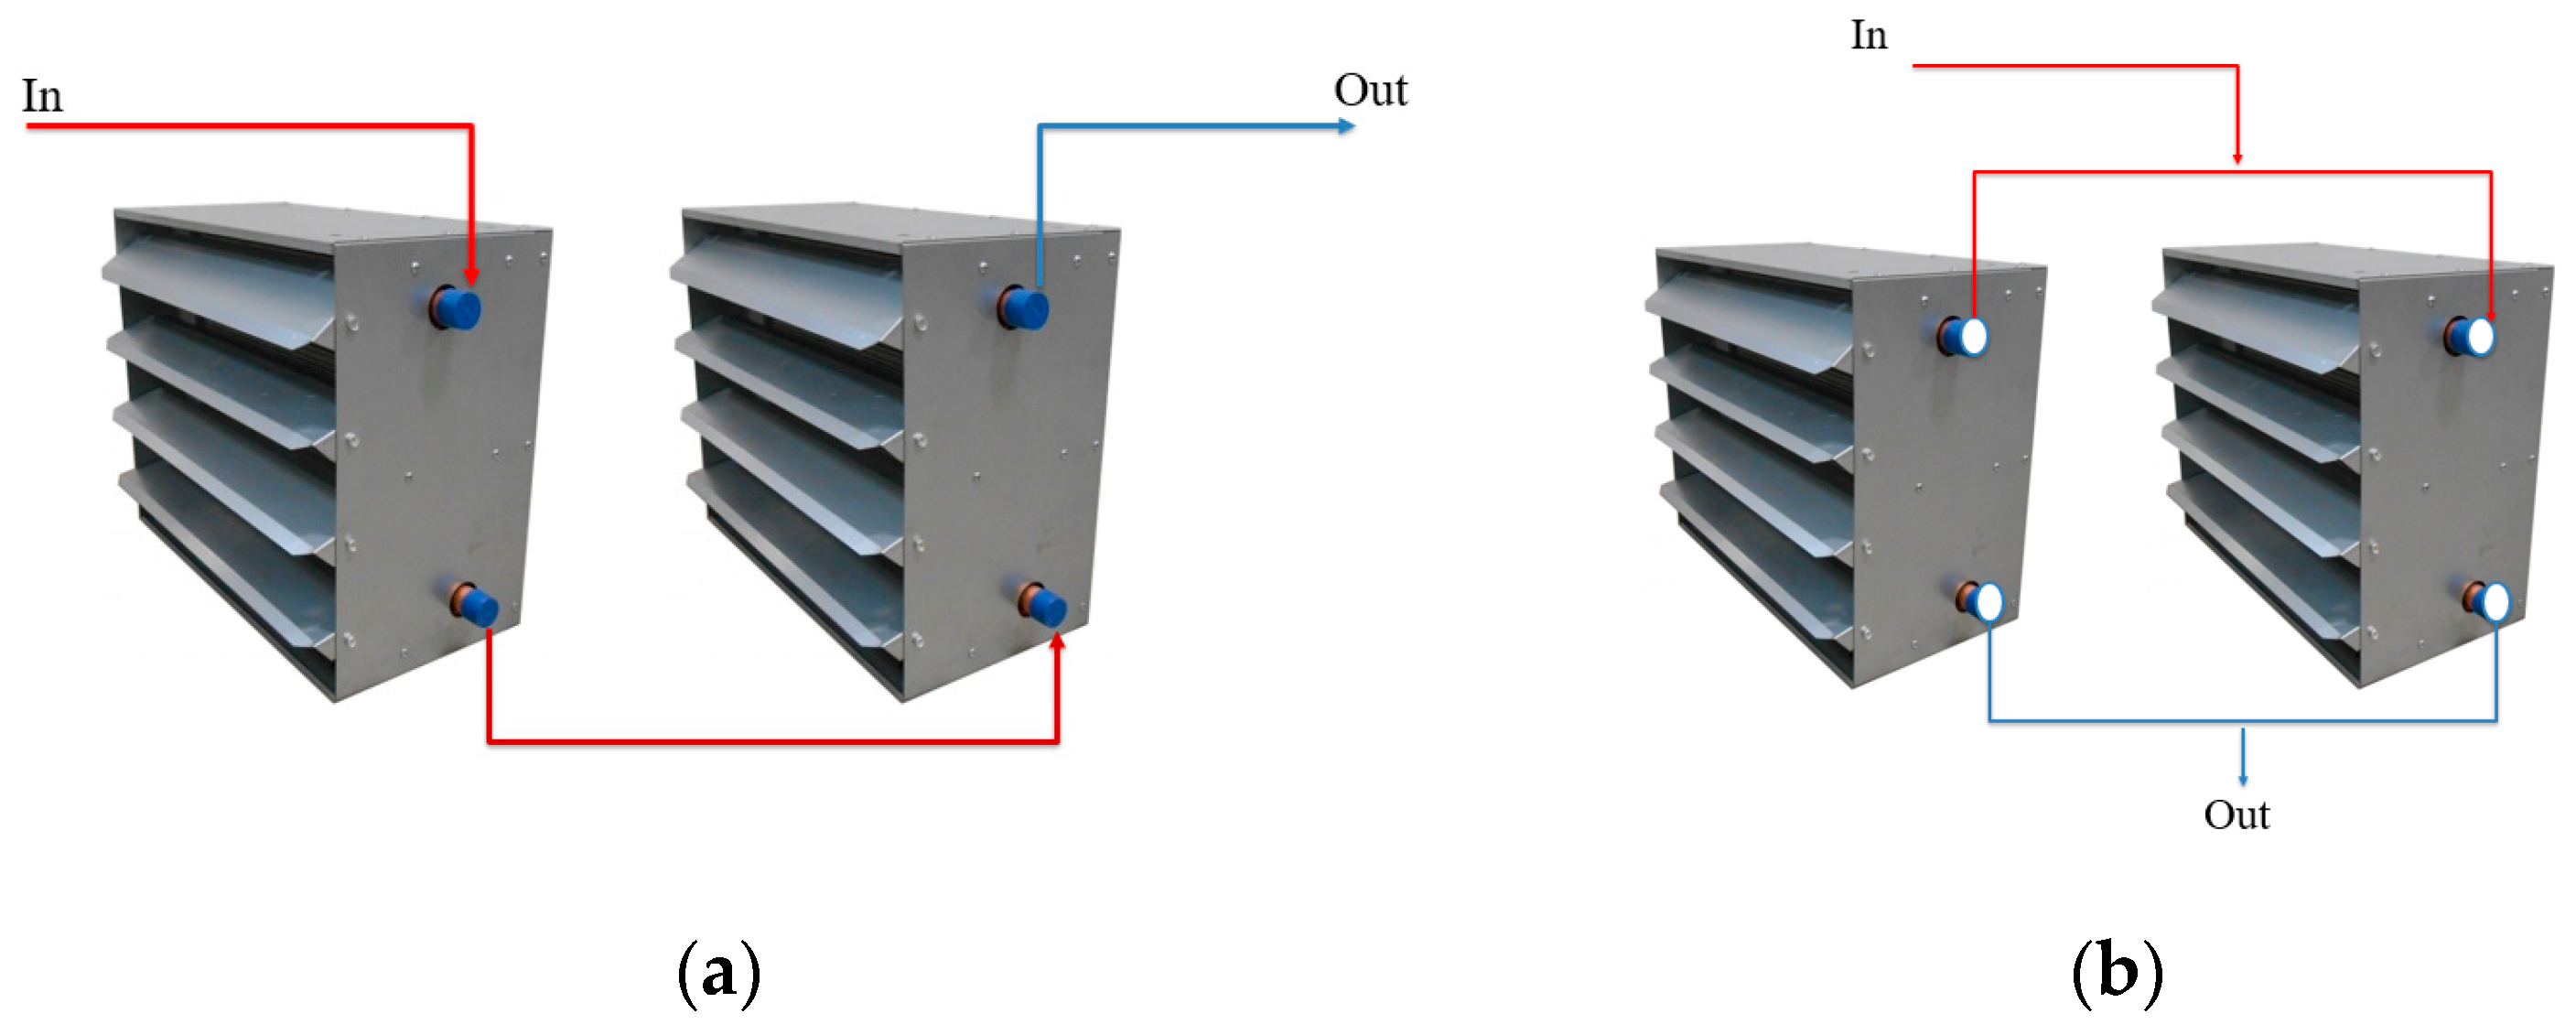
Series of experiments were conducted using serial and parallel arrangement of the air heaters with hot water flowing in pipes, as shown in
Figure 4a,b. Hot flue gas flowed in the shell part of the STHE, releasing heat to the water flowing in the twisted tube in a counterflow connection and in a closed loop with the air heaters. Both steady and transient state analyses were performed to determine the optimum arrangement of the air heaters. Two thermocouples were positioned to measure the temperature of the flue gas entering and exiting the STHE, while water circulation temperature and flow rates were measured as well, using vortex flow meters installed with the pump. Using both energy and exergy models, the thermal efficiency of both serial and parallel arrangement of the air–water space heaters was compared. Upon the determination of the optimum arrangement with the least exergy loss, simulations of different case scenarios were performed to study the heat loss during the co-combustion process of poultry litter using the twisted STHE. The effect of environment temperature (T
0) and the operating conditions such as the flue gas mass flow rate, water flow rate, and inlet and exit temperature of both the flue gas and water were studied in relation to exergy loss and exergetic efficiency.
3. Results and Discussion
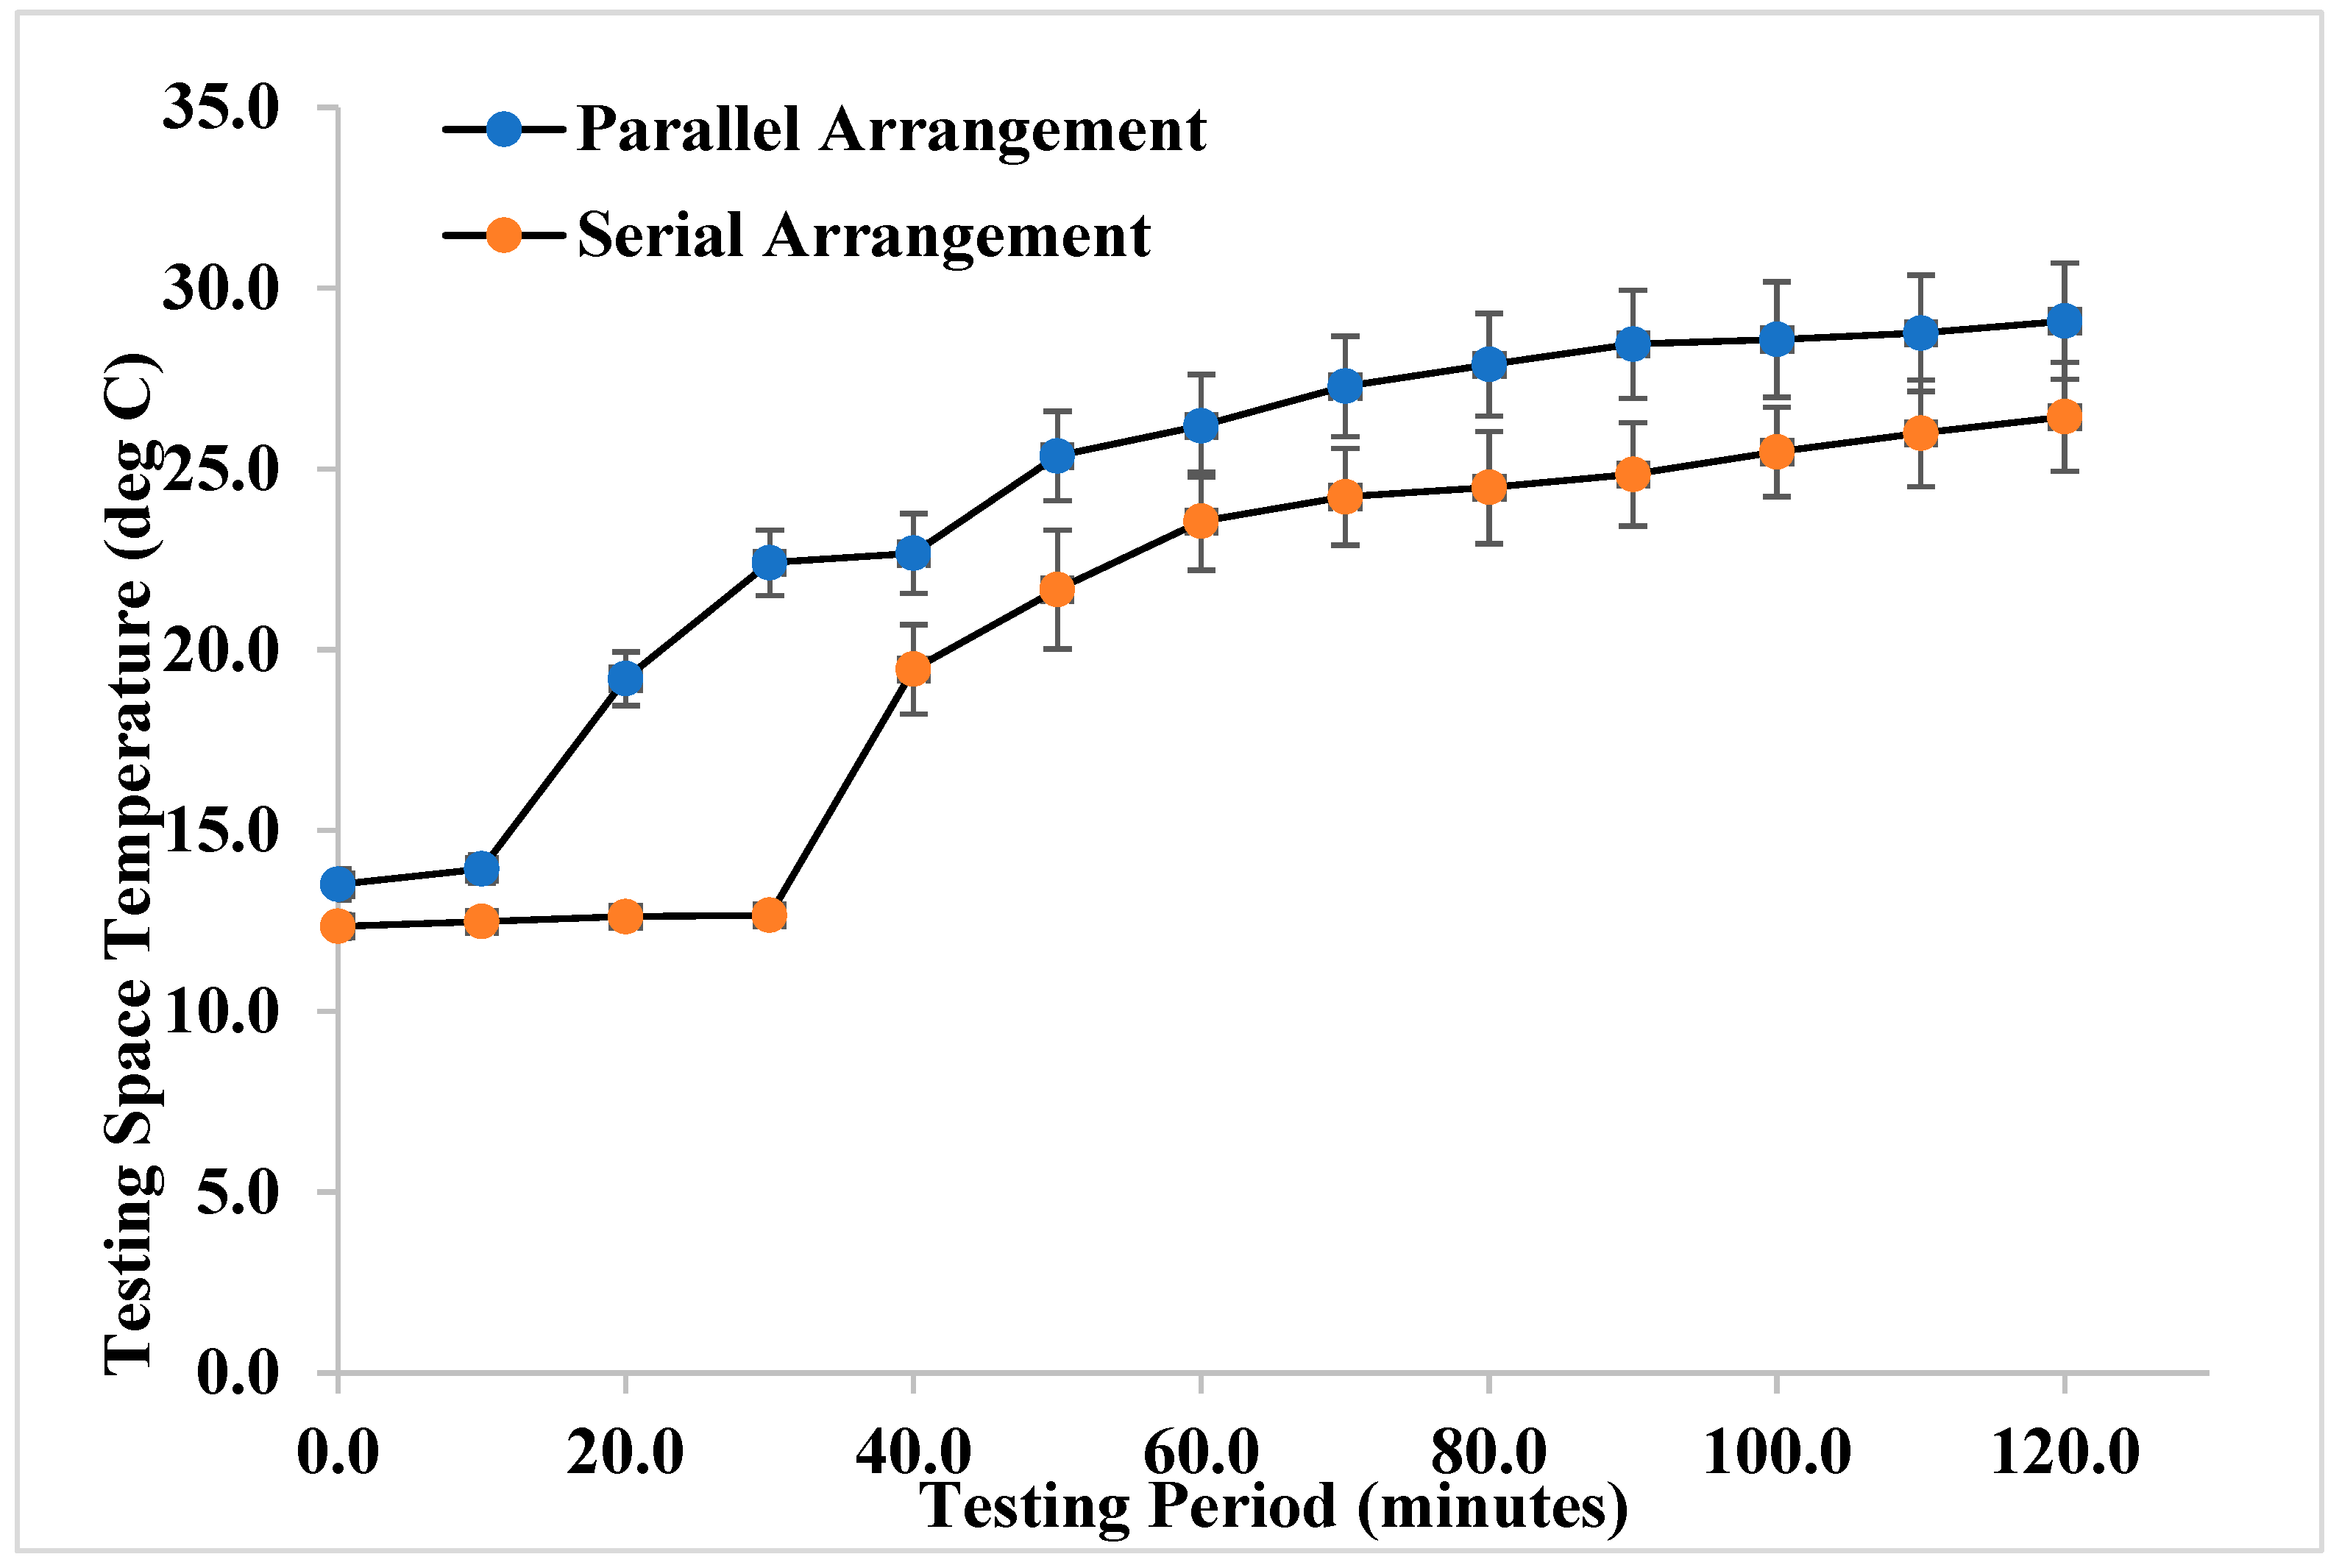
Data were obtained at a 10-min interval from the moment that poultry litter was fed into the combustion chamber and started co-combustion with natural gas. As shown in
Figure 5, testing space temperatures with different air heater arrangements, under the same operating conditions with the flue gas mass flow rate of 0.016 kg/s and water flow rate of 0.271 kg/s, were monitored. The uncertainty in the experimental temperature data collected was calculated as shown by the error bars in
Figure 5. Results indicated that the temperature inside the testing space was raised from 12.2 to 26.4 °C (heat gained was 14.2 °C) with the serial arrangement of air heaters, while the temperature in the testing area increased from 13.5 to 29.1 °C (heat gained was 15.6 °C) for the parallel arrangement after 2 h of the co-combustion test. This observation indicates that the parallel arrangement has a better performance than the serial arrangement.
3.1. Energy Analysis of Serial and Parallel Arrangement of the STHE
For a better evaluation of the STHE, experimental data obtained during a 2 h co-combustion test of poultry litter and natural gas were evaluated for a complete energy analysis in the transient phase, as shown in
Table 1 and
Table 2. The overall heat transfer coefficient for serial arrangement of the air–water heater was 29 W/m
2·K, higher than that of the parallel arrangement (24 W/m
2·K). The theoretical efficiency in terms of STHE effectiveness obtained after 2 h of testing was 82.6% for serial arrangement and 75.8% for parallel arrangement of the air heaters. Testing space temperature along with overall heat transfer coefficients and effectiveness infer that the serial arrangement is a better option to distribute the heat from the STHE into the poultry farm house for space heating purposes.
3.2. Exergy Analysis of Serial and Parallel Arrangement of the STHE
Table 3 and
Table 4 summarize the exergy analysis results of STHE with serial and parallel arrangement. It can be seen that exergy loss increased for serial arrangement from 0.77 kW to 2.47 kW as the flue gas temperature increased. At the maximum flue gas temperature, at exactly 2 h of testing, exergy loss was observed to be 2.47 kW and the exergetic efficiency was 22.1%. For parallel arrangement, exergy loss increased continuously from 0.99 to 2.34 kW until 70 min, and then started to decrease slightly (in the range between 2.05 kW and 2.24 kW). At 2 h of testing, exergy loss was 2.05 kW and exergetic efficiency was 25.5%. Therefore, results indicate that the parallel arrangement has a better exergetic performance than the serial arrangement.
It has been established from the energy analysis that the First Law efficiency (refer to the conversion efficiency) itself is not enough to account for a complete analysis of waste-to-energy processes, as it does not report the quality of energy available to perform work. In comparison, the energy efficiency of the parallel arrangement was 75.8% (in
Table 2) while the exergetic efficiency was only 25.5% (in
Table 4). This is due to the huge exergy destruction after 2 h duration of experimentation at an ambient temperature of 8.8 °C, as shown in
Figure 5. Exergy destruction is a measure of resource degradation. Although exergy efficiency measures the quality of exergy harnessed by the system, exergy destruction ratio assesses the degraded resources and specifies the elements in the system where destruction occurs. Exergy destruction is the lost work potential due to irreversibility. For both arrangements of the air heaters, results obtained show that exergy destruction increases as environment temperature increases.
3.3. Effect of Ambient Temperature on Exergy Changes
From the definition of exergy, the ambient condition plays a critical role in determining the maximum work that a system can achieve. This study investigated the effect of ambient temperature on the exergy loss and efficiency of the STHE under the operating conditions corresponding to the maximum hot air temperature in the poultry farm, that is, after two hours of testing, as shown in the last rows of
Table 3 and
Table 4 for both the serial and parallel arrangements. The selected ambient temperature (8.8–25 °C) was varied to determine the maximum work the STHE system could achieve in relation to the environment during the low- and mid-temperature seasons in Maryland (especially winter, spring, and fall). It was observed that, with an increase in ambient temperature from 8.8 to 25 °C, exergy loss increased from 2.47 to 2.62 kW and exergetic efficiency reduced from 22.1 to 12.7% for the serial arrangement, while, for the parallel arrangement of air heaters, an increase in exergy loss from 2.05 to 2.18 kW was observed with a decrease in efficiency from 25.5 to 16% under the same operating conditions (i.e., constant mass flow rates for flue gas and cold fluid). This is true of a system as it is being brought into equilibrium with dead- state conditions. In a previous study conducted by Belitor et al. [
23] on a coal- based thermal power plant turbine cycle, high-temperature ambient conditions cause similar trends in exergy losses among all components in the heat engine/turbine cycle as compared to a 23–25 °C ambient temperature. The researchers observed that the high ambient temperature of 31 °C resulted in a much lower efficiency of 41.24%, compared with low-temperature ambient conditions of 24 °C, which had values of 44.16%.
Overall, comparison of the two water-to-air heater arrangements using an exergy analysis approach shows that the exergy losses were lower—corresponding to higher exergetic efficiency—for the lowest ambient temperature used (i.e., t = 8.8 °C), and the exergy losses increased as the ambient temperature approached the dead-state temperature of 25 °C. Thus, the parallel arrangement gave a better performance with higher exergetic efficiency than the serial arrangement of the water heaters used for space heating of the poultry house. To further investigate the performance of the STHE system design and maximize its efficiency using parallel arrangement of heaters, simulations were performed for four scenarios under different operating conditions for both flue gas and cold fluid flow.
3.4. Simulation of Exergy Analysis for Parallel Arrangement
Further simulations were performed with optimum operating parameters obtained for the parallel arrangement of heaters, since this gave the highest exergetic efficiency with minimum exergy loss. Also, the selected ambient temperature used for the scenario simulation was 8.8 °C (282.04 K), which was lower than the dead-state temperature, because using a lower ambient temperature may lower the exergy loss and increase efficiency.
3.4.1. Effect of the Cold Fluid Inlet and Exit Temperature on the STHE Exergetic Performance
As shown in
Figure 6, the exergy loss rate decreased from 2.39 kW to 0.80 kW and efficiency increased from 13.2% to 70.8% with increase in cold fluid inlet and exit temperature of 32.25 to 48.85 °C and 36.15 to 61.15 °C, respectively. In this case study, water and flue gas flow rates were kept constant at 0.271 kg/s and 0.016 kg/s, and the inlet and exit flue gas temperatures were kept constant at 481.3 °C and 151.3 °C, respectively. The ambient temperature was kept constant as well at 8.8 °C. As more work is performed by the hot flue gas to heat up the water (that is, an increase in water temperature difference between the inlet and exit streams) at the inlet exergy of 2.75 kW, the system efficiency increases.
Further in this scenario, the exit flue gas temperature measured at the chimney of the combustion system was varied from 68.35 to 248.35 °C, as well as the water inlet temperature (32.25–48.85 °C) and cold fluid exit temperature (36.15–61.15 °C), but the inlet flue gas temperature and water and flue gas flow rates were kept constant at 481.3 °C, 0.271 kg/s, and 0.016 kg/s, respectively. Exergy loss rate decreased with increasing exit flue gas temperature and increasing exit water temperature. Maximum exergetic efficiency of 92.2% was obtained at the inlet flue gas temperature of 481.3 °C, exit gas temperature of 248.4 °C, and inlet water and exit water temperature of 48.9 °C and 61.1 °C, respectively. As shown in
Figure 6, the higher the flue gas temperature difference between the inlet and exit streams, the higher the exergy loss and the lost work potential. This is quite the opposite for water temperature difference between the inlet and exit streams.
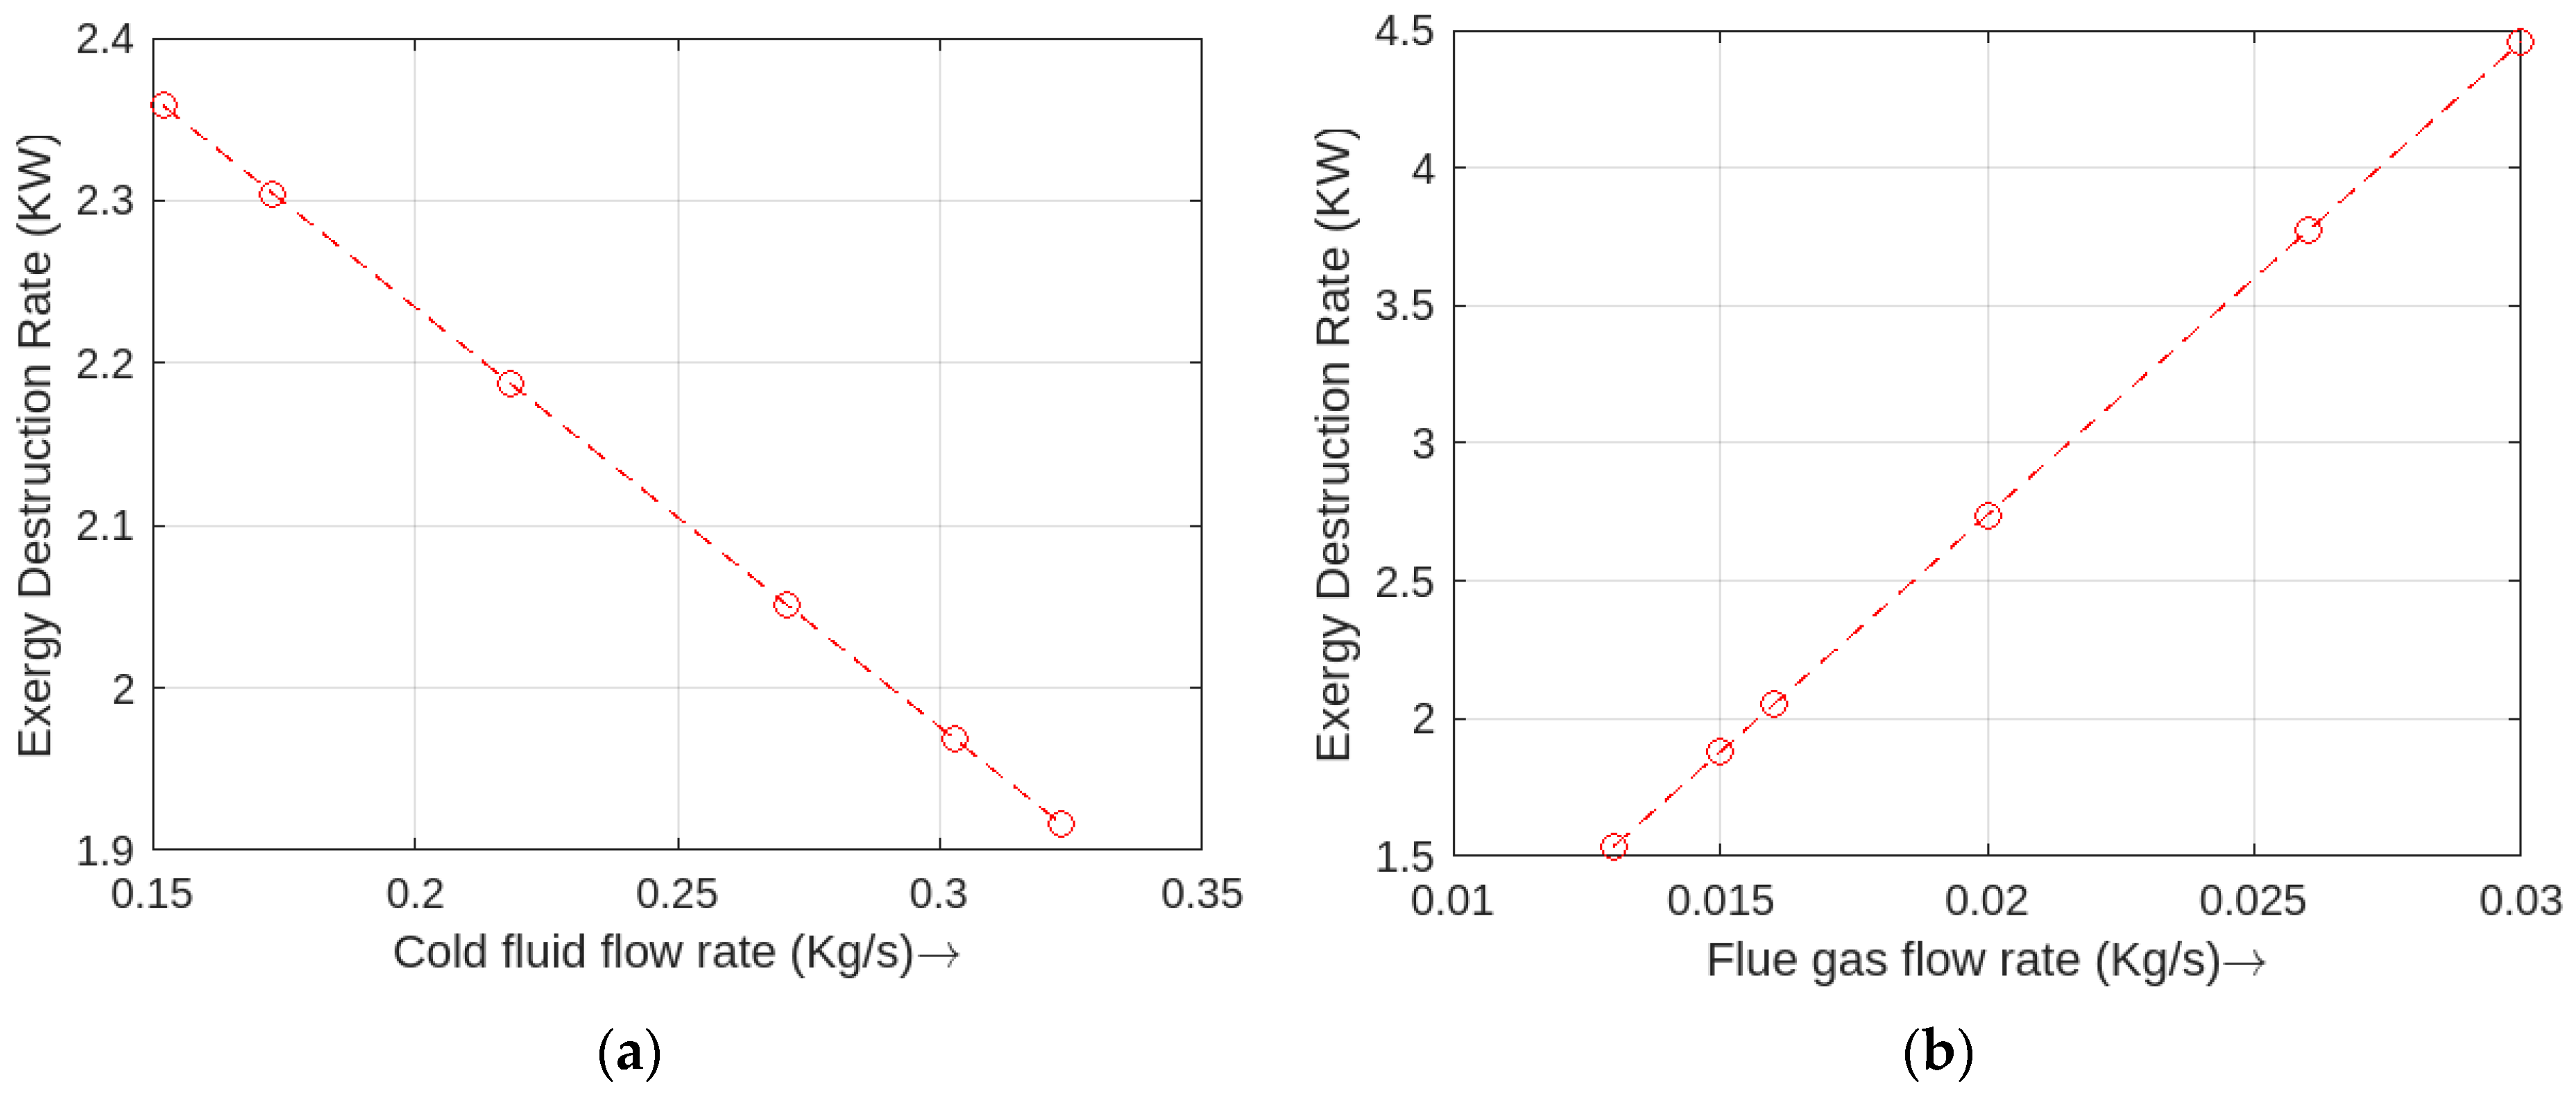
3.4.2. Effect of Cold Fluid Flow rate on Exergy Performance
The impact of varying flow rate of water between 9.1 L/min and 19.4 L/min on the heat transfer characteristics and exergy loss were investigated at constant hot flue gas inlet temperature, hot flue gas exit temperature, cold fluid inlet flow temperature, cold fluid exit flow temperature, and hot flue gas flow rate of 481.3 °C, 151.3 °C, 46.1 °C, 51.1 °C, and 0.0016 kg/s, respectively. As shown in
Figure 7a, it was observed that exergy loss decreased from 2.36 kW to 1.92 kW and efficiency increased from 14.3% to 30.3% as the cold fluid flow rate increased. This means that increasing the cold fluid flow rate at a constant exergy, supplied at 2.75 kW, decreases exergy destruction rate. Conversely, as the flue gas mass flow rate increased from 0.013 to 0.03 kg/s (103.2 to 108 lb/h), as shown in
Figure 7b, exergy destruction rate increased from 1.54 to 4.46 kW, while efficiency decreased by more than 50%.
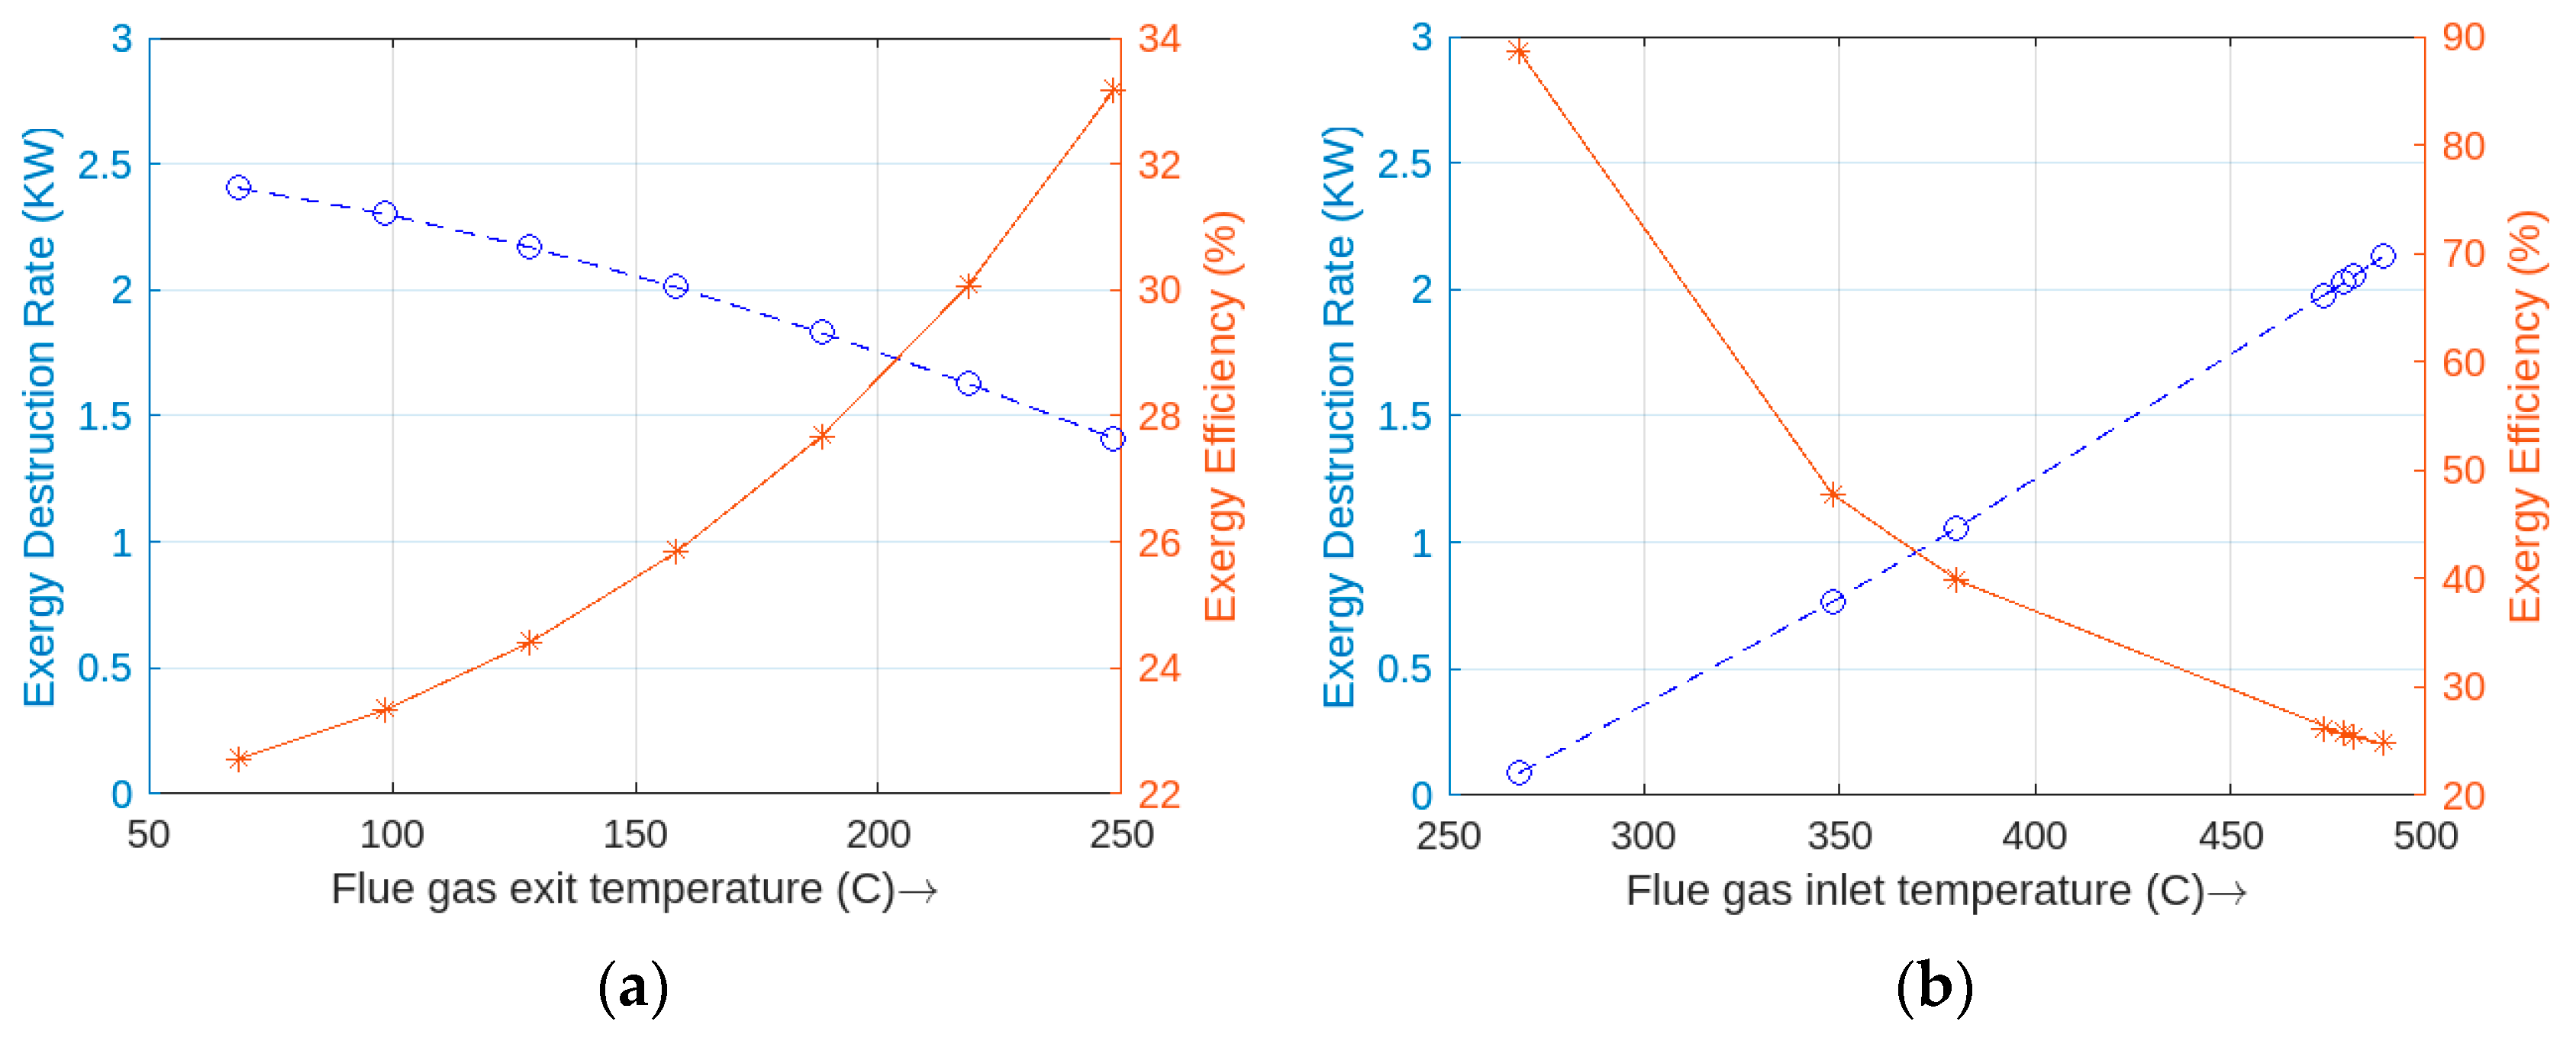
3.4.3. Effect of Flue Gas Temperature Difference on the Exergy Performance
Figure 8a depicts the impact of increasing flue gas exit temperature from 68.35 to 278.35 °C on the exergy destruction rate of the STHE under constant flue gas inlet temperature of 481.3 °C, constant water inlet and exit temperatures of 46.1°C and 51.1 °C, and constant mass flow rates of flue gas and water of 0.016 kg/s and 0.271 kg/s, respectively. Simulation results showed that exergy efficiency increased from 22.5% to 33.2% as flue gas exit temperature increased, while exergy loss decreased. Conversely, at a constant exit flue gas temperature of 151.3 °C and constant water in/exit temperature, the effect of varying flue gas inlet temperature (268.0 °C to 481.3 °C) showed, in
Figure 8b, that exergetic efficiency decreased largely from 88.6% to 25.5% as exergy loss increased (i.e., exergy loss increased with increase in flue gas inlet temperature).
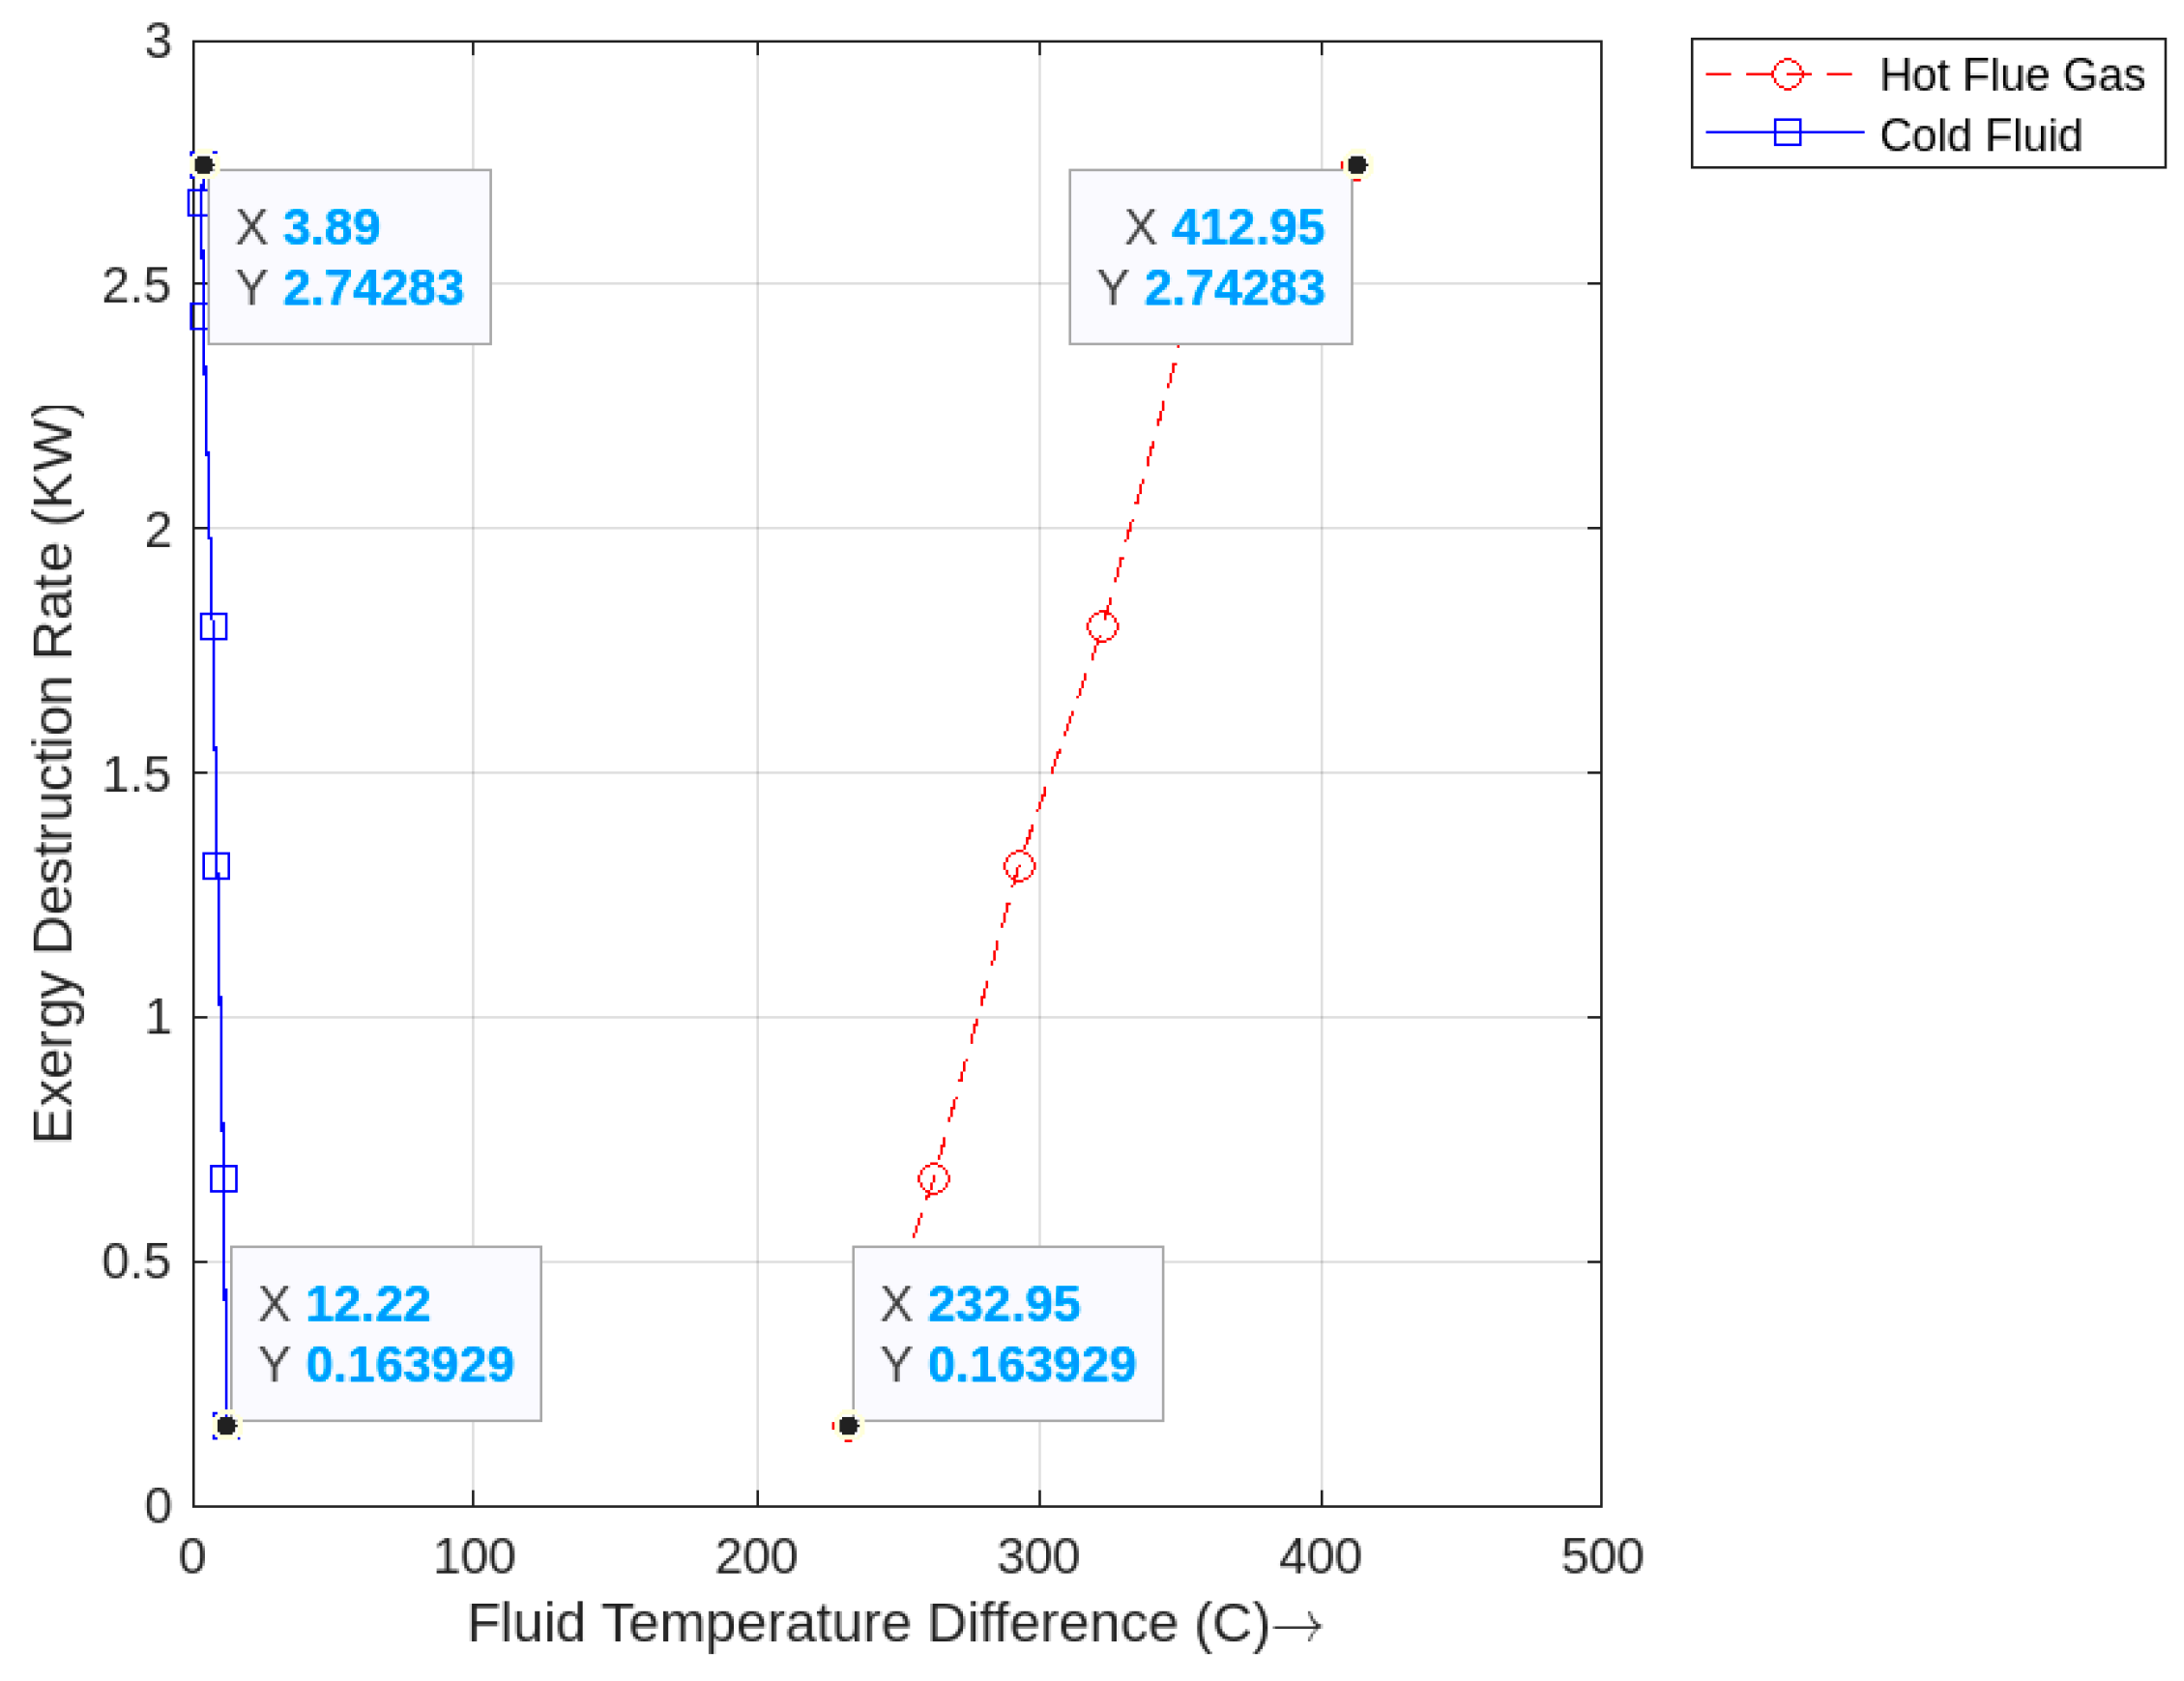
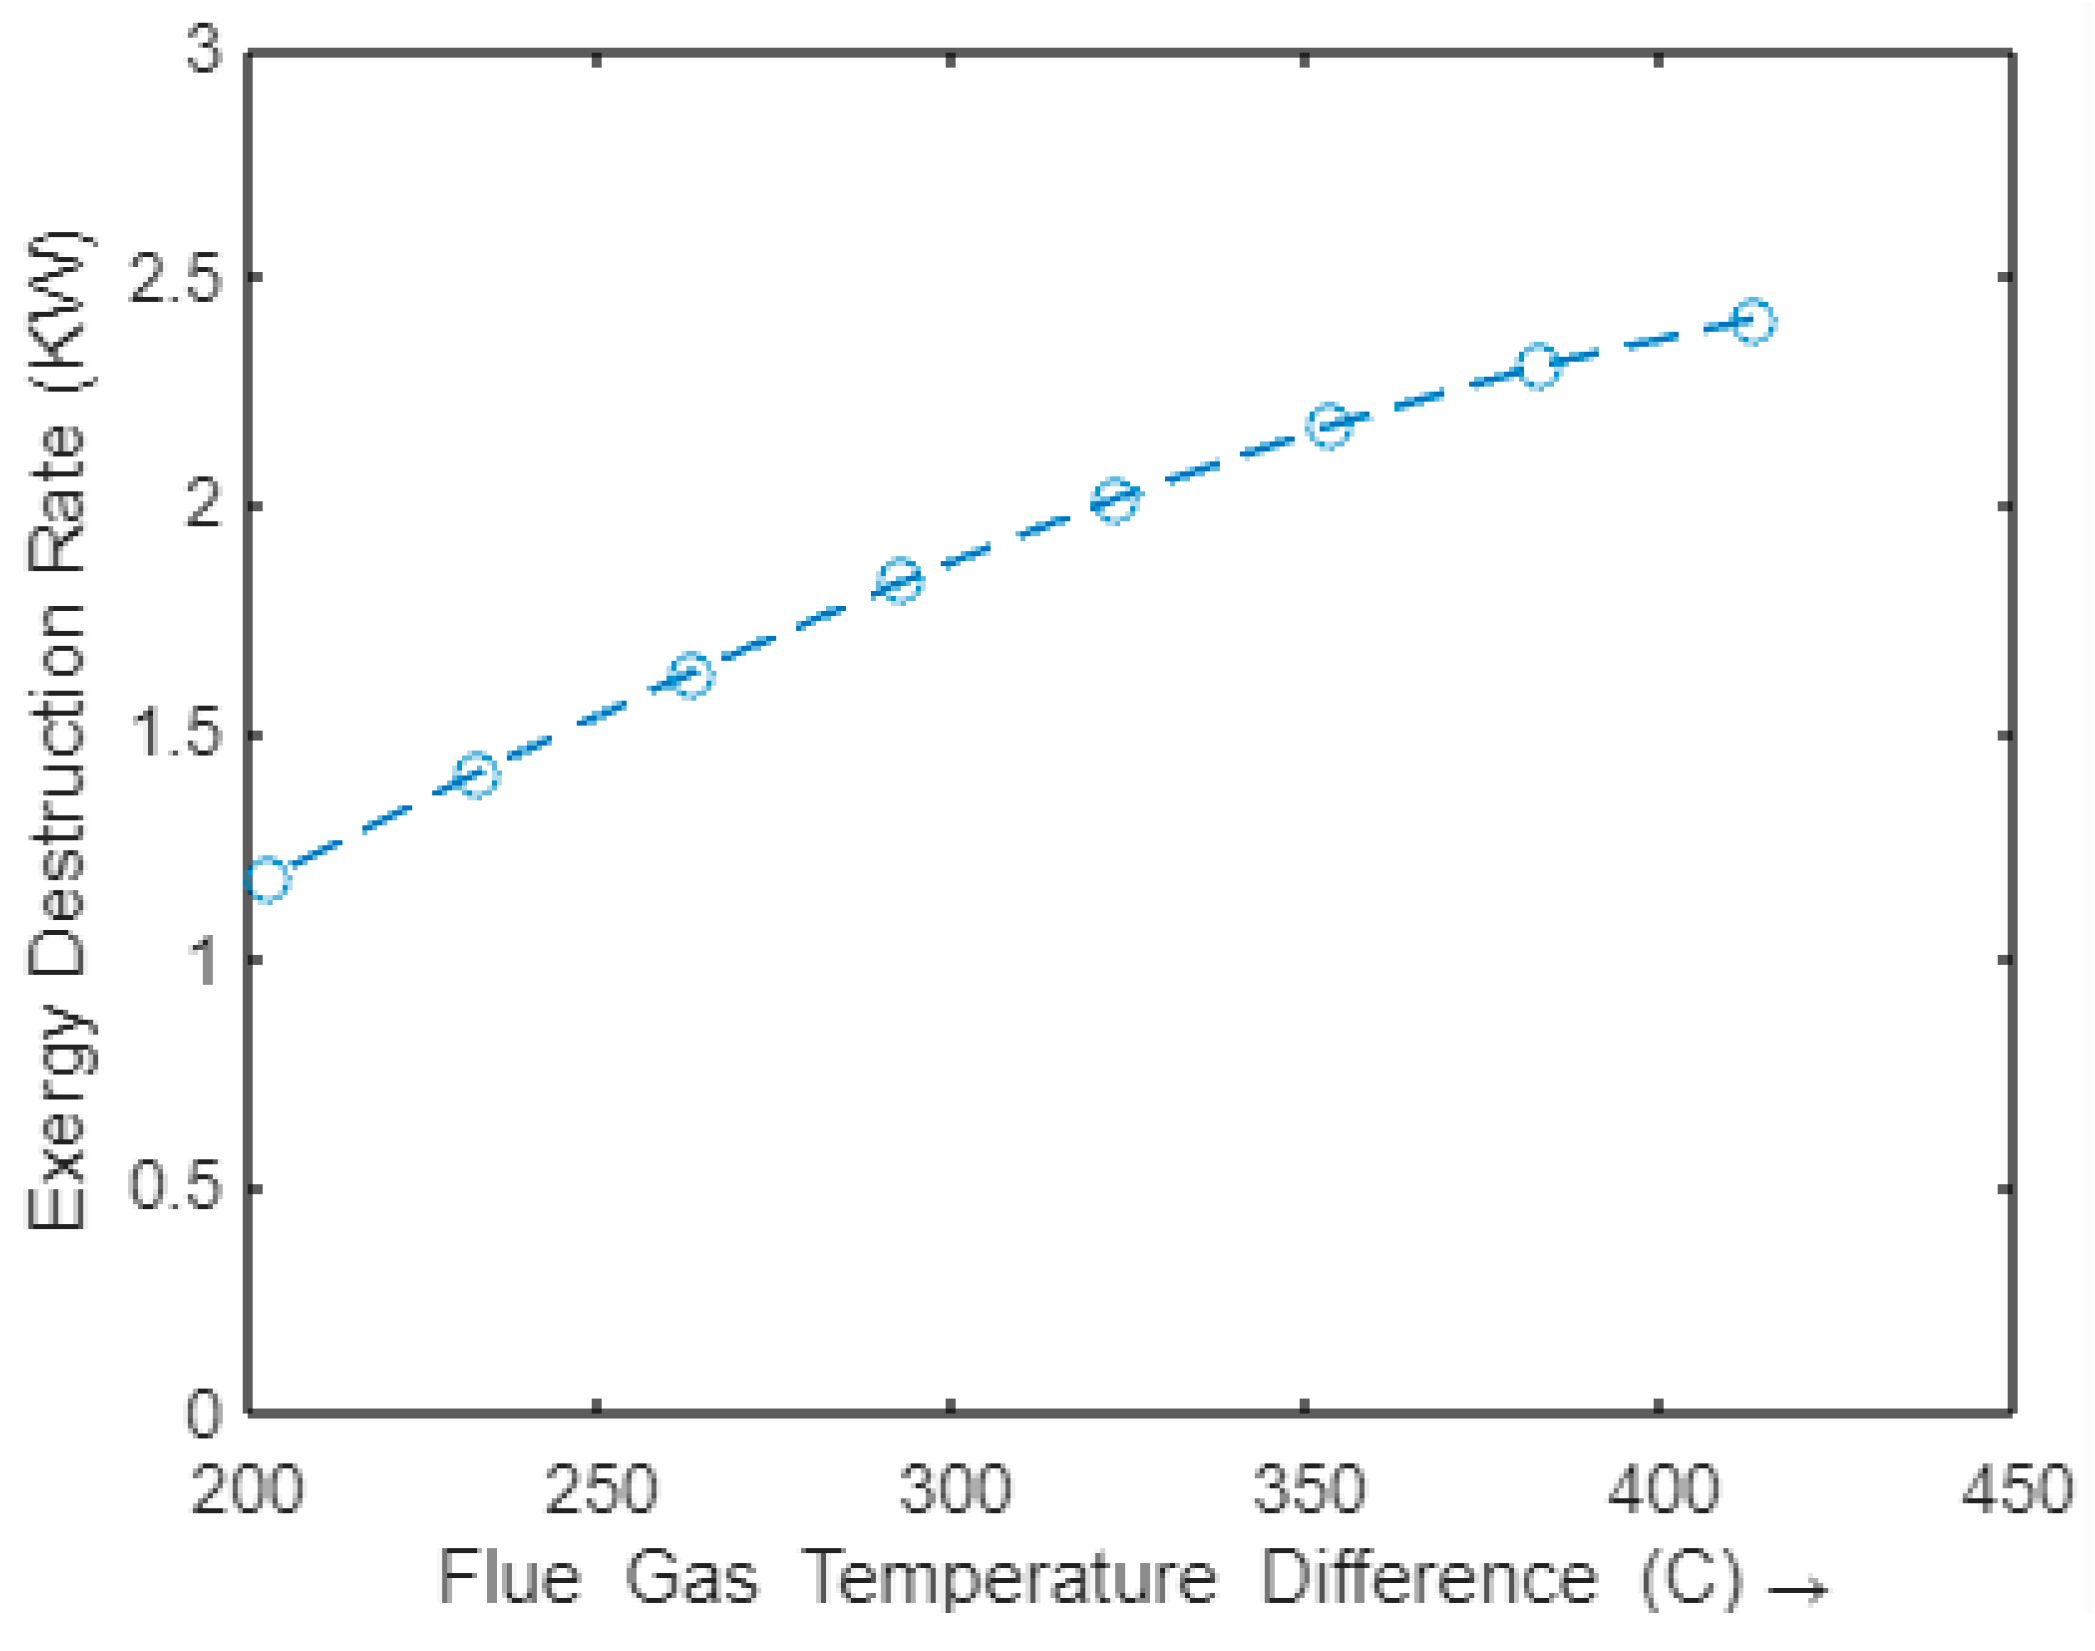
Figure 9 shows that exergy loss increased as the differences between inlet and exit flue gas temperature increased. That is, as the exit temperature of the flue gas increased and became closer to the inlet temperature, the exergetic loss increased, while efficiency decreased. This implies that, to lower the cost of the STHE, a larger delta T (i.e., temperature difference) between the hot and cold streams is needed throughout the exchanger to extract a greater amount of heat from the fluid, which further increases the exergetic loss while maintaining an energy balance. This was confirmed in a study by [
17], in which it was observed that higher temperature differences between hot and cold fluids resulted in higher exergy loss. Thus, results indicated that losses due to finite temperature difference are the main cause of exergy loss in heat exchangers [
24].
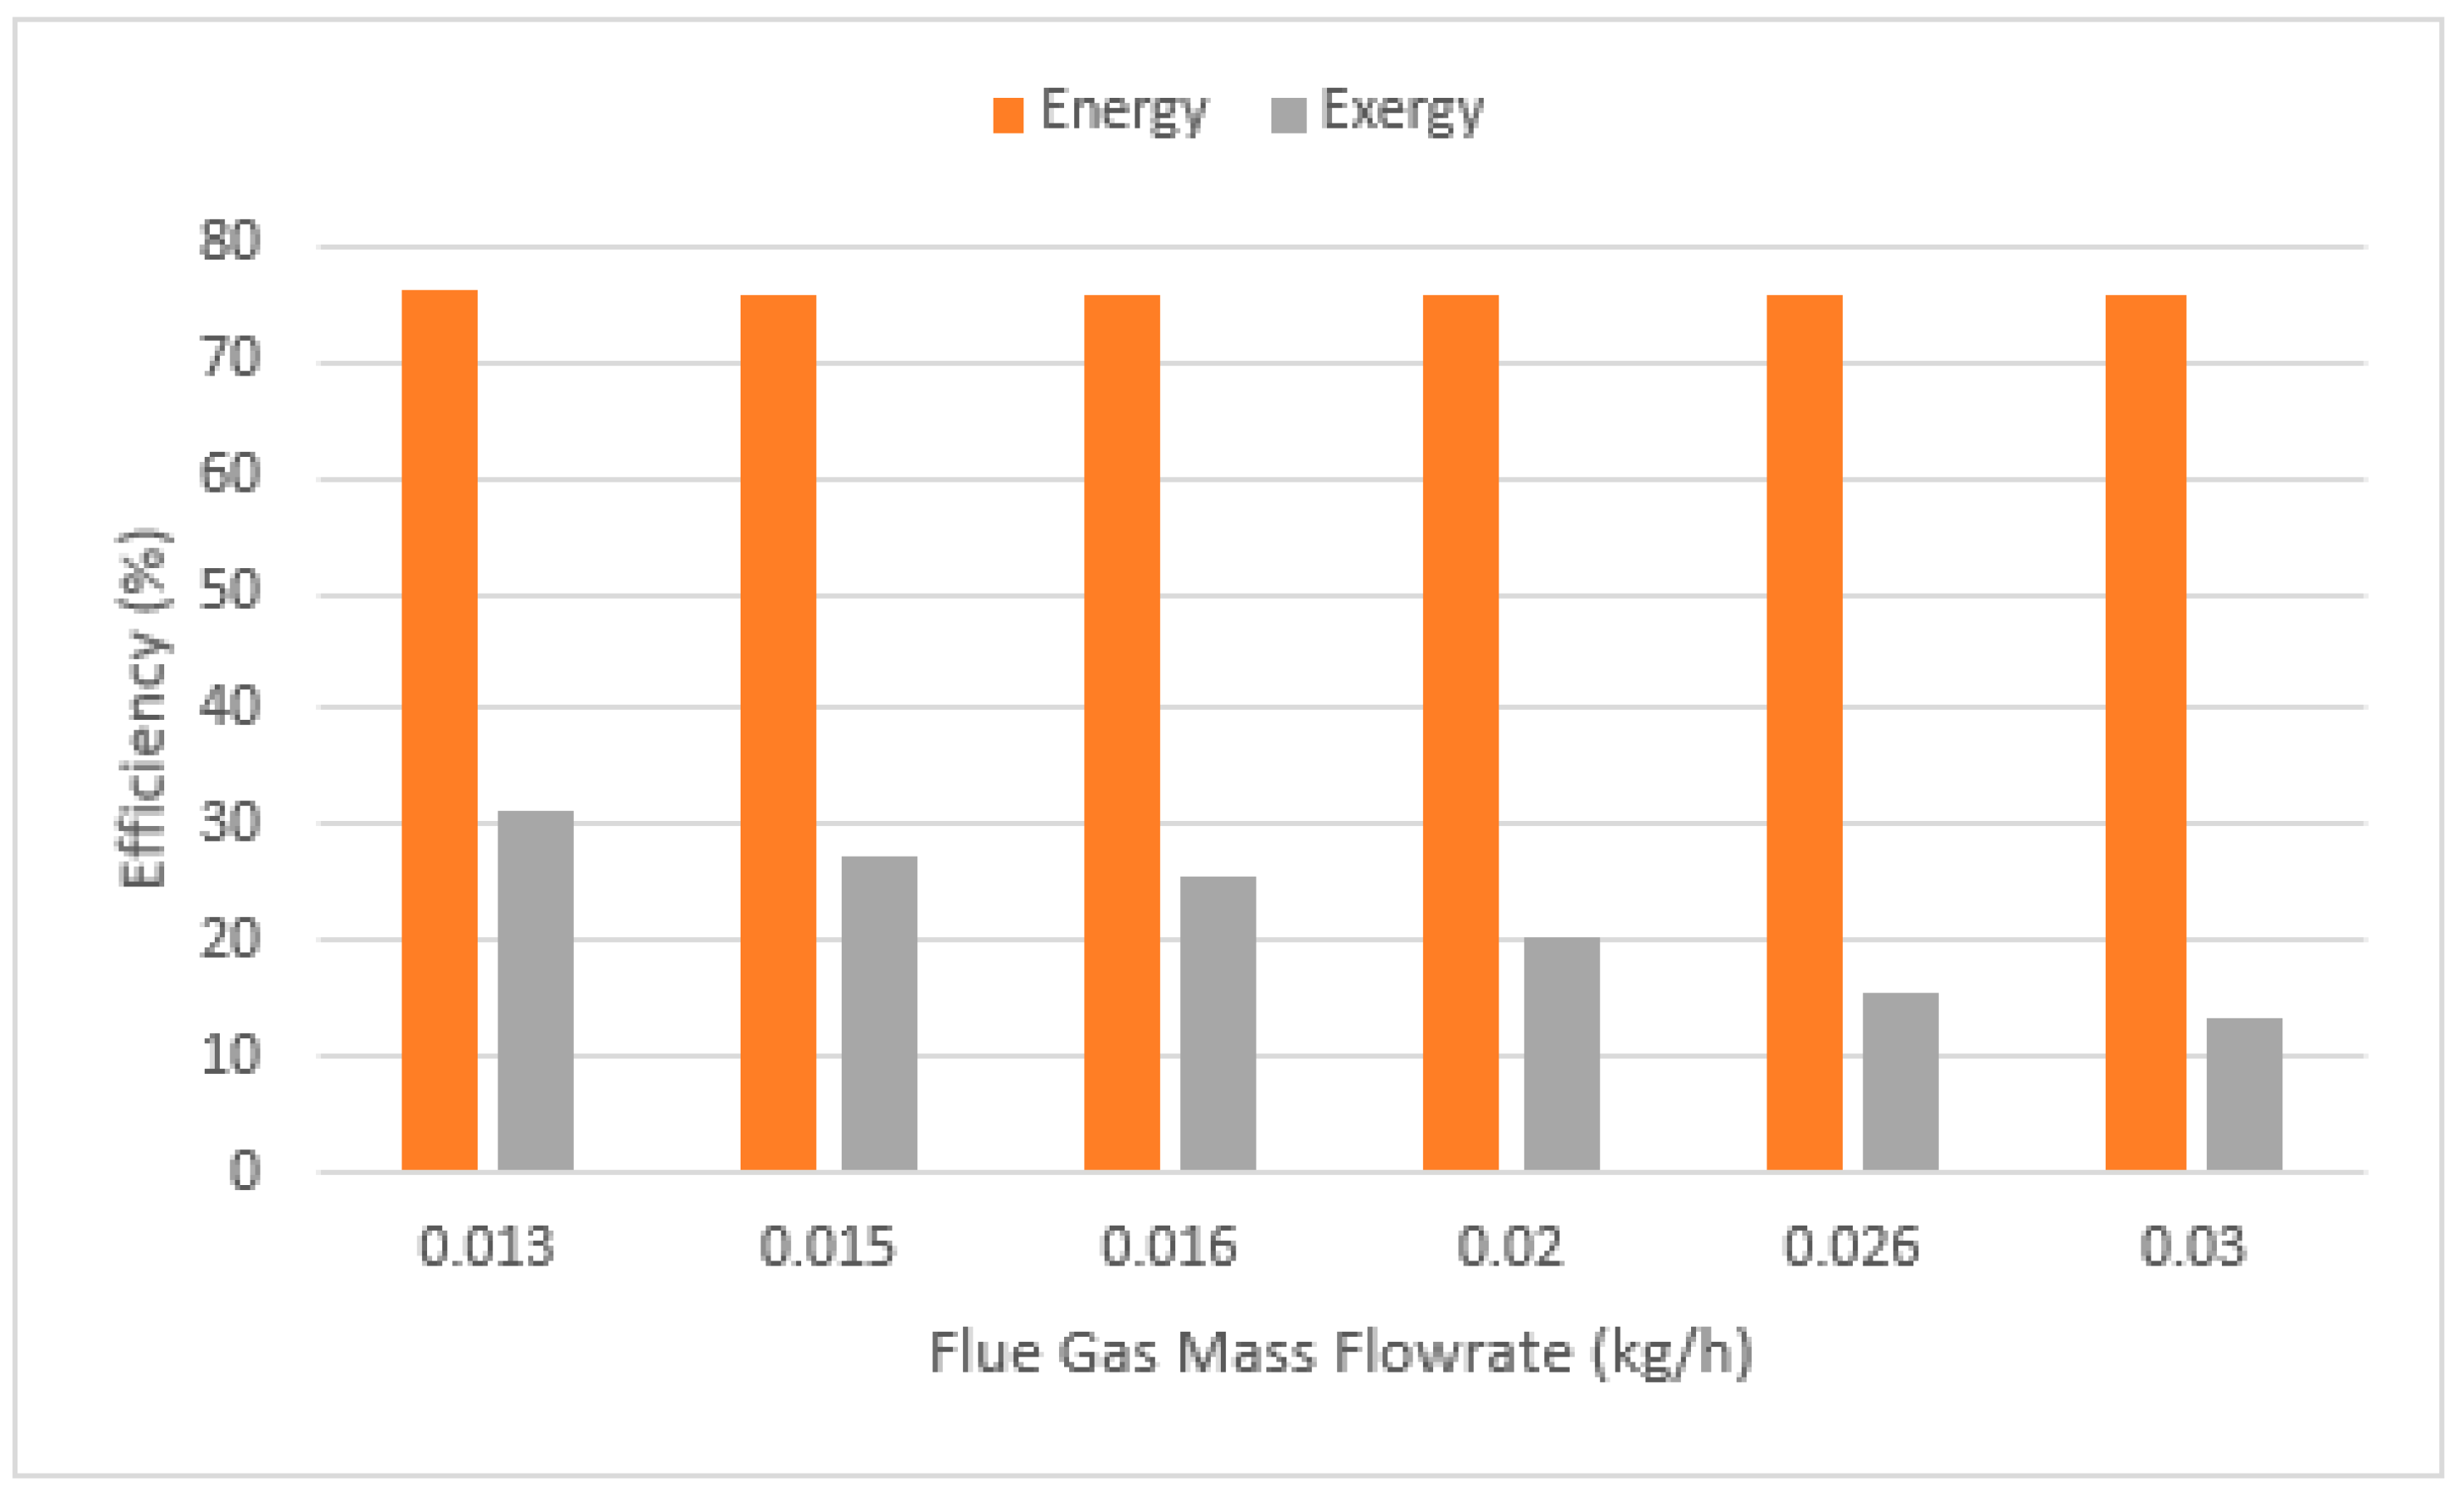
3.4.4. Effect of Flue Gas Flow rate on the Exergy and Energy Performance
The effect of flue gas mass flow rate on the STHE exergy destruction rate was investigated at a constant cold fluid flow rate of 0.271 kg/s, constant inlet and exit flue gas temperatures of 481.3 °C and 151.3 °C, and constant inlet and exit cold fluid temperatures of 46.1 °C and 51.1 °C. As the flue gas mass flow rate increased from 0.013 to 0.03 kg/s (103.2 to 108 lb/h), exergy destruction rate increased from 1.54 to 4.46 kW, while efficiency decreased by more than 50%, as shown in
Figure 10. Under the same operating conditions, energy efficiency remained constant at 75.8%, while the overall heat transfer coefficient increased from 19.4 to 44.8 W/m
2·K with increasing flue gas flow rate, as shown in
Figure 10. In addition, the heat load of flue gas was increased by increasing the mass flow rate of flue gas because the increasing feeding rates of poultry litter elevated heating values.
4. Conclusions
The exergy and energy performance of the lab-scale STHE used for a poultry litter and natural gas co-combustion process has been investigated in this study. Specifically, the exergy analysis carried out in this study provided information on the amount of exergy loss and inefficiency in the energy conversion system. For both analyses of the experimental data, the mass flow rates for flue gas and water, as well as the ambient temperature, were kept constant. In the first part of the study, energy and exergy efficiency of the STHE under both serial and parallel arrangements of air–water heaters were compared. Energy efficiency in terms of effectiveness was found to be higher for the serial arrangement than that of the parallel arrangement, while the exergetic efficiency obtained for parallel arrangement of the heaters was higher than the serial counterpart. These results indicate that a parallel arrangement gives a better performance than a serial arrangement in terms of maximum available work when the ambient conditions are factored in to observe the irreversibility in the system. Further simulation studies using the parallel arrangement show that lower ambient temperature favors higher exergetic efficiency and lower exergy loss. The effect of varying cold fluid flow rate (9.1 to 19.4 L/min) and flue gas flow rate (46.2 to 108 kg/h) on the STHE performance showed that exergy destruction rate decreased and efficiency increased with an increase in the cold fluid flow rate, while exergy loss increased and efficiency decreased with an increase in flue gas flow rate. As to the effect of flue gas temperature, exergy loss increased (1.18 to 2.41 kW) with increase in flue gas temperature at constant cold fluid inlet/exit temperature. The optimal operating conditions to improve the performance of the STHE were 46.8–57.6 kg/h, 16.3–19.4 L/min, 100–205 °C, 9–13 °C for the flue gas flow rate, cold fluid flow rate, flue gas delta T, and cold fluid delta T, respectively, at a lower ambient temperature below the dead-state condition. This study confirms that the integration of exergy and energy analysis can be used to identify the energy loss and improve performance of the poultry litter-to-energy conversion systems.


