1. Introduction
In the field of geotechnical engineering, the study of rock mass seepage is of paramount importance, encompassing multiple aspects such as mining, hydropower, and subterranean architecture [
1,
2,
3,
4,
5,
6,
7,
8]. Fluid within a rock mass can swiftly propagate through fractures or gradually migrate within matrix pores, while the factors influencing the permeability of the rock mass include porosity, fissure length, pore diameter, density, surface roughness of the fissure, connectivity, direction, surrounding stress, hydraulic gradient, and infill within the fissure, among others [
9,
10]. In compact fissured rock masses, interconnected fractures exhibit greater permeability [
11,
12,
13,
14]. Moreover, fluid dynamics typically adhere to the linear Darcy’s law [
15,
16]. To enhance the accuracy of predictions, researchers have proposed several representative concepts, such as Representative Elementary Volume (REV) [
17,
18], the fractal dimensions of fissure networks [
19,
20], and the distribution of fissure lengths [
21,
22] for computation and analysis.
Fracture, a common inhomogeneous structure in rocks, significantly influences rock mass seepage. Understanding fracture distribution and its seepage impact is essential, offering guidance for practical engineering. Research shows that fissure distribution and connectivity control rock mass permeability [
23]. Therefore, in-depth research into rock mass fracture characteristics is crucial to improve the accuracy of permeability predictions.
Fissure models, mathematical representations of fracture distribution and characteristics in rock masses, come in two main forms: two-dimensional planar models and three-dimensional spatial models. The former simplifies the modeling of high-density fractures, but only represents the cross-section of the rock mass, making it difficult to describe the complete fracture. The latter offers more accurate fracture descriptions but is computationally intensive and time-consuming. To simplify calculations and link equivalent permeability with simple fissure statistical parameters, a permeability prediction formula based on fissure parameter changes is necessary in practical engineering [
24].
Table 1 presents an introduction to the three primary models used to calculate the permeability of fissured rock masses.
However, the main problem with these three models is that they either do not calculate the parameters of the fracture and matrix pores in detail or require a large amount of computation. Therefore, the results obtained are only generalized model results and contain obvious errors.
This article describes a geotechnical engineering study on the permeability of fractured rock masses. The researchers chose mathematical models suitable for these masses’ permeability. They observed that fracture parameter distribution in nature often adopts forms such as random distribution, power law distribution, log-normal distribution, and Fisher function distribution.
Many studies have shown that the length distribution of natural fractures follows a power law distribution, implying that there are many more small fractures than large ones. This distribution reflects the fractal nature and complexity of fracture networks. Some research has also shown that the directional distribution of natural fractures follows a Fisher distribution, which is often used to describe the distribution of random variables with finite upper and lower bounds [
38].
In this study, Darcy’s law and the cubic law were used to describe the flow of water in pores and fractures, which applies to most rock mass seepage problems. The researchers also introduced a gravity term to consider the effect of gravity on water in fractures [
39]. The researchers used power law distribution and Fisher function distribution to describe the distribution characteristics of fracture length, aperture, and angle parameters based on their study of the distribution form of fractures in nature.
The study’s goal was to create a prediction formula based on a dual-media model of pores and fractures, associating equivalent permeability with the fracture network’s simple statistical parameters. Initially, a single-factor model was established, considering the effects of ideal fracture density, length, angle, and aperture on permeability. Then, a three-dimensional random fracture network was created based on parameters like matrix porosity, fracture density, length, the power law of length, direction, dip angle, dispersion coefficient, aperture, and the power law of aperture. The impact of each parameter and their interaction on permeability was analyzed. A CCD function formula was proposed to predict permeability as it has a statistical relationship with permeability, while facilitating a field estimation of rock mass permeability. A sensitivity analysis was conducted to determine each parameter’s contribution to permeability prediction, providing scientific and accurate data for engineering practice and aiding in the optimization of engineering design and execution.
In summary, the study provides a new way of predicting and evaluating the permeability of rock masses, which is of great significance for the better utilization and protection of groundwater resources. It can help to quickly estimate the permeability of rock masses based on field-observed fracture parameters, providing a basis for the exploration, development, and utilization of groundwater resources and the prevention and control of geological disasters. It can also be used to guide groundwater resource management and environmental protection.
2. Seepage Formula of Three-Dimensional Model
2.1. Seepage Formula in the Matrix
Fluid percolation within a homogeneous matrix block obeys Darcy’s law [
40], which can be expressed in terms of time using the following equation:
where u represents the velocity vector in m/s,
p denotes the pore water pressure in Pa,
εp represents the porosity of the matrix block,
S signifies the matrix block water storage coefficient in 1/Pa,
ρ represents the density in kg/m
3, and t denotes the time.
The linear water storage model is defined by the following equation [
41]:
where
Xf represents the fluid compressibility rate in 1/Pa, and
Xp represents the equivalent compressibility of the matrix block in 1/Pa. The active porosity (
εp) in the matrix is considered in the model. Closed porosity and non-flowing fractures, though included, are modeled as zones with zero Darcy velocity, implying no fluid flow contribution. This approach ensures that all important elements—including open porosity, closed porosity, and non-flowing fractures—are adequately addressed, reflecting the actual fluid flow conditions.
Within the block, the inherent velocity variable u corresponds to the Darcy velocity, which is the volume flow rate per unit area of the porous medium [
42].
where
k denotes the permeability of the matrix block in m
2, and
μ represents the hydrodynamic viscosity in Pa·s.
2.2. Water Flow Equation in Fracture
While natural rock fractures exhibit rough surfaces, variable apertures, and different contact ratios, indoor tests and numerical simulations often assume that an individual fissure maintains a constant aperture and adheres to the cubic law of seepage [
43]. This law can be expressed as follows:
where
q represents the flow rate in m
2/s,
e denotes the fracture width in m, g is the gravitational acceleration in m/s
2,
ν represents the fluid motion viscosity coefficient in m
2/s, and
J represents the hydraulic gradient, which is dimensionless.
Field outcrop investigations have revealed that the cumulative probability density function of fracture trace length follows a power law distribution, as described in the literature through the analysis of geometric characteristics of certain larger fractures [
44]:
where
α is the power law exponent,
L is the length of the fracture, and
Lmin is the shortest fracture length.
The orientation of fractures follows the Fisher distribution, which is commonly employed in the numerical modeling of discrete fracture networks. The probability density function of the Fisher distribution describes the angular deviation
θ (in SI units: rad) [
44]:
where
b is the dispersion coefficient or Fisher’s constant.
Here, θ represents the angle between the observed direction and the central direction, and b is the dispersion coefficient, which reflects the degree of concentration of the directional distribution. The larger the value of b, the more the observed direction concentrates in a certain direction; the smaller the value of b, the more dispersed the observed direction is.
Generally, it is commonly assumed that there is no correlation between the aperture and trace length of a fracture. Consequently, the probability density function of the fracture length can be considered as the form of the aperture ground distribution [
45]:
where
β is the power law exponent, d is the aperture of the fracture, and
dmin is the minimum aperture.
2.3. Effect of Gravity
This section studies how gravity affects water flow in rock masses, impacting seepage speed, groundwater levels, and leading to significant changes in the permeability of low-water-pressure rock masses. A gravity field was introduced in the model for the experiment. The findings led to the creation of a comprehensive seepage formula for fractured rock masses, offering a reliable tool for predicting and analyzing seepage behavior [
39]. This research is crucial for the development and use of groundwater resources, the prevention of groundwater pollution, and the aversion of geological disasters.
2.4. Equivalent Permeability
The concept of equivalent permeability is a parameter that describes the resistance to fluid flow in a porous medium (such as rock or soil). It depends on the physical properties of the porous medium (such as porosity and pore shape), the properties of the fluid (such as viscosity and density), and the direction and magnitude of fluid flow.
The concept of effective permeability is often used when dealing with fluid flow problems in complex geological systems, especially when there are multiple interconnected pore and fracture systems. For example, in petroleum reservoir engineering, effective permeability is used to describe the flow of oil, gas, and water in porous rocks.
Effective permeability is usually determined experimentally: for example, by driving a fluid through a rock sample and measuring the pressure difference and flow rate. In this case, effective permeability can be calculated using Darcy’s law:
where
Q is the Darcy velocity, typically in units of m/s;
K is the effective permeability, usually in units of m2;
and is the pressure gradient, usually in units of Pa/m.
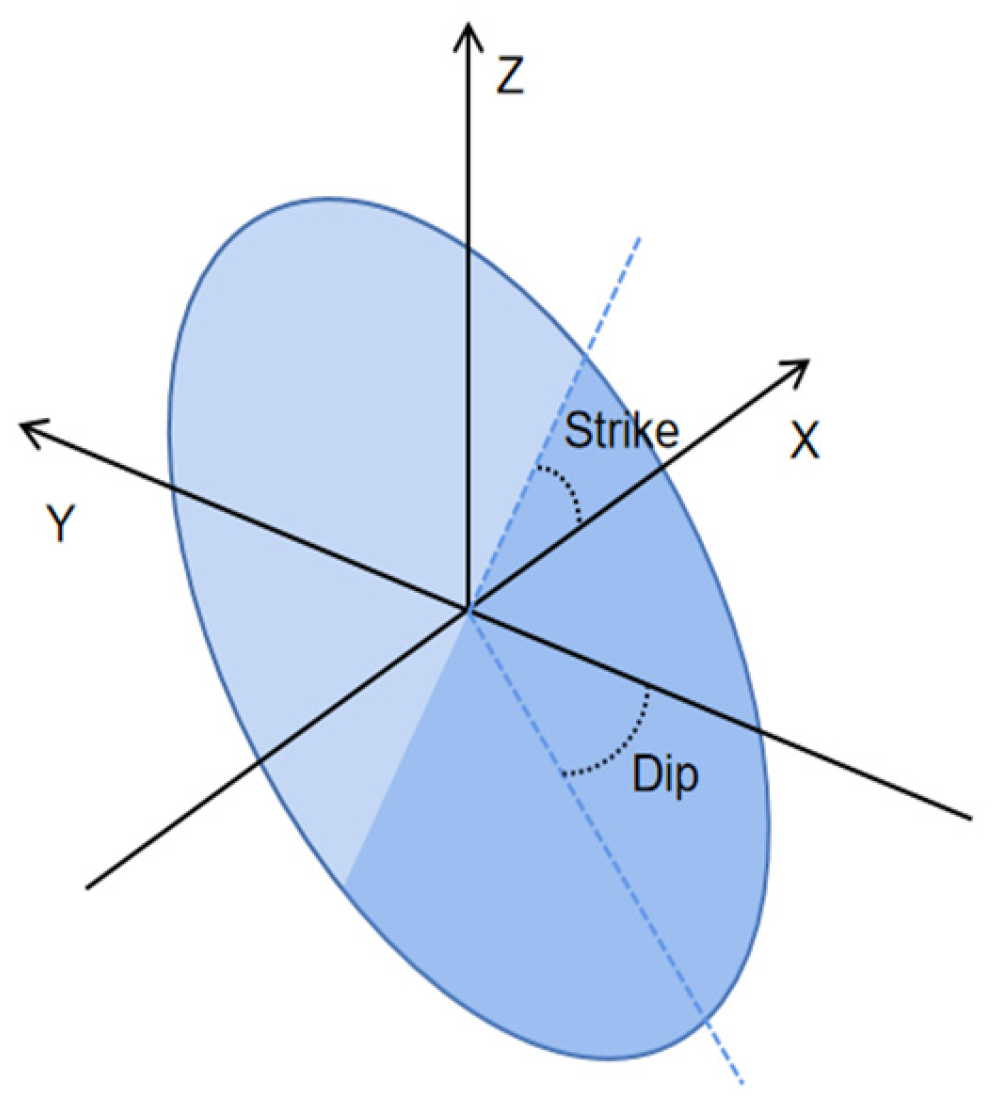
2.5. Strike and Dip
The strike and dip of fractures are important parameters for describing the spatial orientation of fractures in geology, as shown in
Figure 1.
Strike of a fracture: the strike is the angle between the projection of the fracture on the horizontal plane and the water pressure direction, usually represented in degrees. For example, if the projection of a fracture on the ground coincides with the water pressure direction, the strike of the fracture is 0 or 360 degrees.
Dip of a fracture: the dip is the inclination angle of the fracture in the vertical plane, usually represented in degrees. The size of the dip depends on the angle between the fracture plane and the horizontal plane. For example, if a fracture is parallel to the horizontal plane, the dip of the fracture is 0 degrees. If a fracture is perpendicular to the horizontal plane, the dip of the fracture is 90 degrees.
The strike and dip of fractures are shown in
Figure 1.
3. Numerical Model
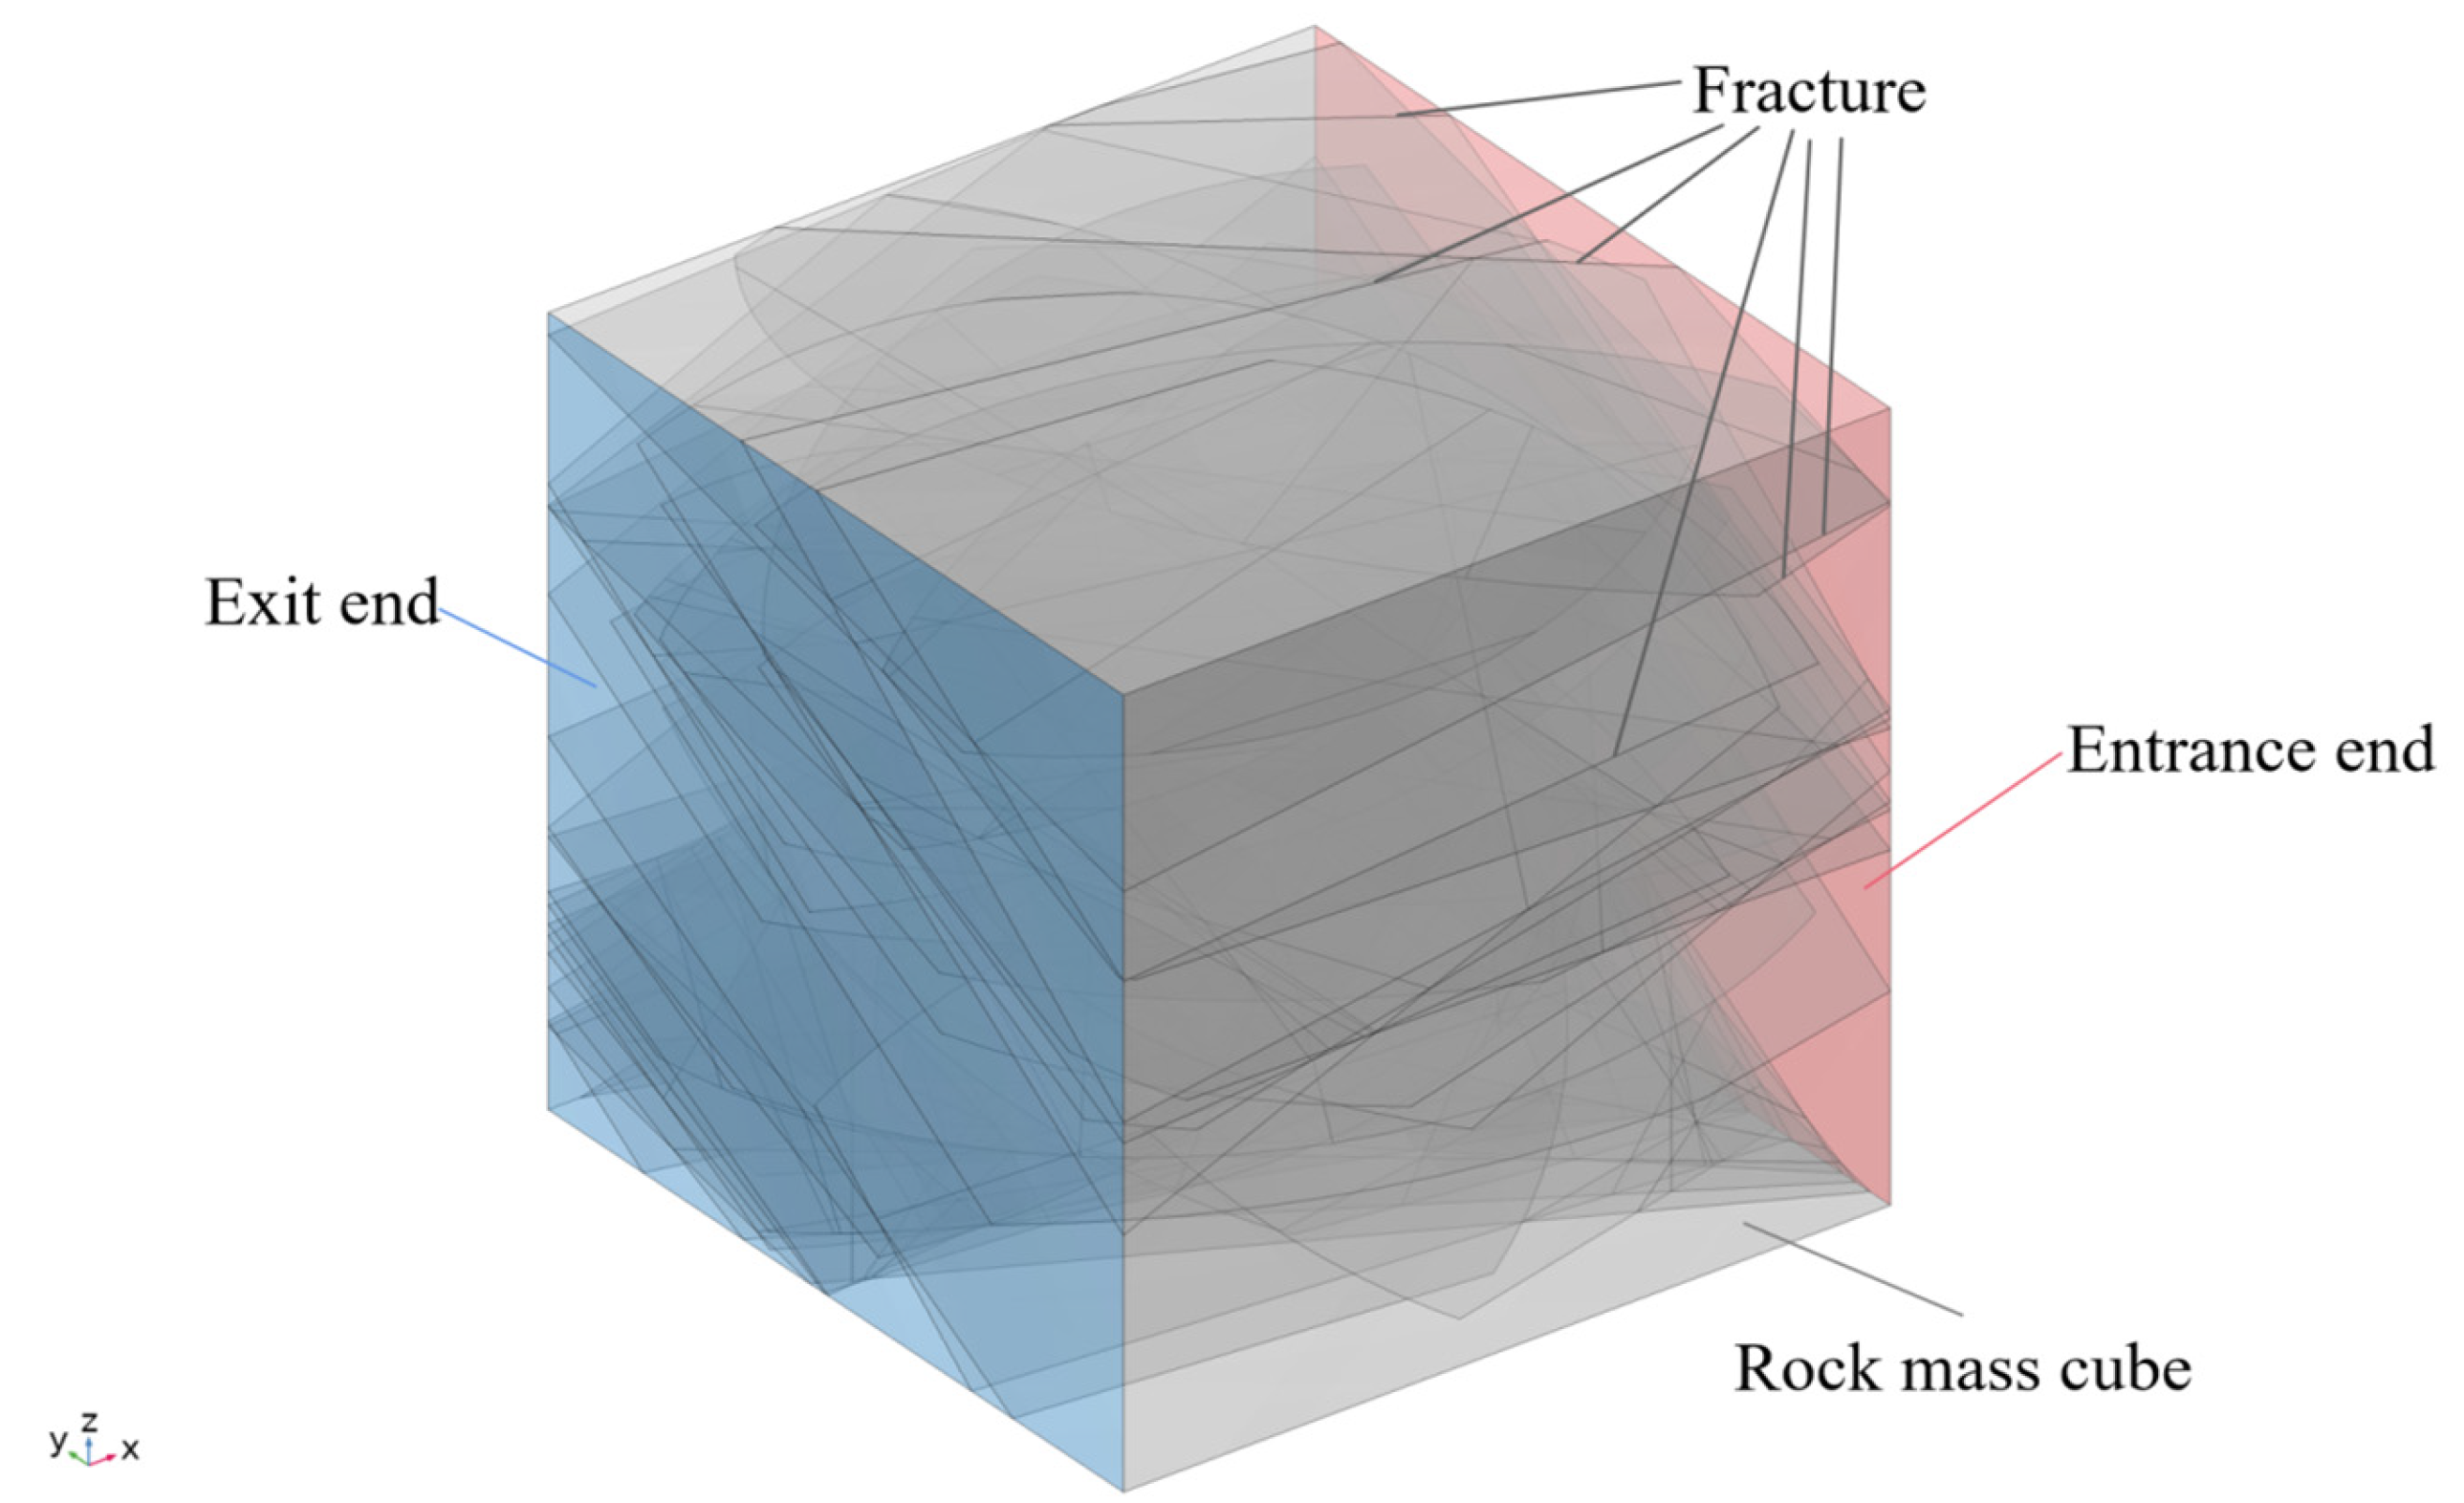
In this study, numerical simulation methods were used to investigate the fracture model. To make the fracture model conform to the distribution laws observed in nature, a series of cubic models with side lengths of 20 m were generated for this experiment; these are depicted in
Figure 2, with the blue part representing the exit end and the red part representing the entrance end. The study focused on data in three main areas:
Basic data, including lateral water pressure and matrix permeability.
Simulated geometric parameters of fractures and their directions.
The impact of the gravity field on groundwater movement.
This study incorporates the porosity of both the matrix and fracture sections, which were both set at 0.3. However, it is critical to highlight that these values are grounded in a macroscopic perspective of porosity. This implies that these values are representative of average properties across a larger volume, encapsulating both the solid matrix and the fracture network. This methodology is often utilized in the study of porous media, where it is impractical or impossible to measure or model each individual pore or fracture. Instead, an average or effective property is used to depict the behavior of the porous medium at a larger scale. While this approach simplifies the complexity of the actual system, it still provides a valuable and practical model for understanding and predicting the behavior of fluid flow in such systems.
During the simulations, the flow within the matrix follows Darcy’s law, while the groundwater flow within the fractures is described by a modified version of Darcy’s law. The flow processes encompass movement from matrix to matrix, matrix to fracture, fracture to matrix, and fracture to fracture. These processes and their outcomes will be demonstrated in the subsequent results section.
To accurately describe the flow regions, they were divided into a series of flow units, and triangulation algorithms were used to describe them as unstructured grids. The center of each grid was used as the research node. Each fracture is equivalent to an inner boundary, defined by a unique tangential method algorithm to describe fracture behavior without a large number of dense and tiny grid elements.
By using unstructured grids, it is possible to effectively separate matrix and fracture units, ensuring the accurate calculation of mass transfer between any two moving units. Therefore, the finite element method was chosen to implement the simulation process in this experiment. This method allows for more accurate and efficient simulations of complex geometries and varying material properties, which are often encountered in the study of seepage in fractured rock masses.
The model was constructed as follows:
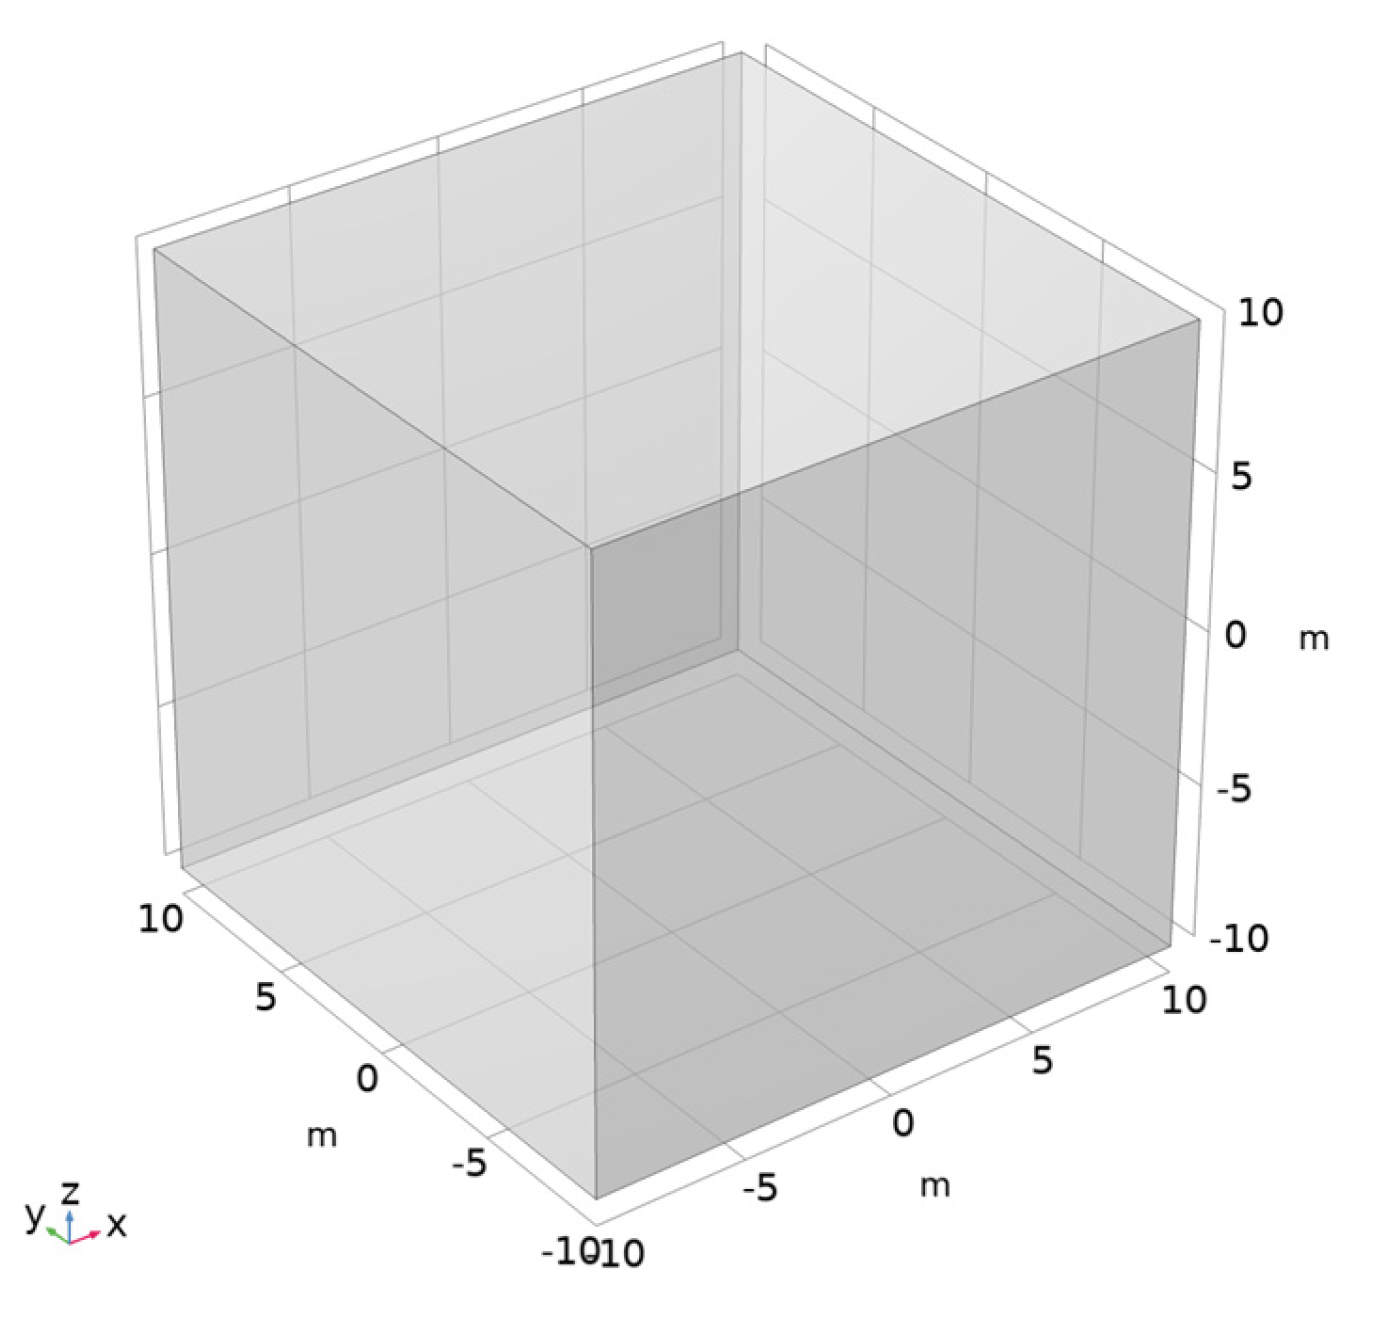
The methodology was initiated through the use of COMSOL’s Model Wizard to outline a three-dimensional model space. In this space, the controlling physics field was governed by Darcy’s law under steady-state study conditions. As presented in
Figure 3, the model framework was geometrically configured as a square with each side measuring 20 m.
In the materials phase, a rigorous process was undertaken to detail the model’s material parameters. This included defining the fluid density within the fractures as 1 × 10³ kg/m3, the dynamic viscosity as 1 × 10⁻³ Pa·s, and the fluid compressibility as 4.4 × 10⁻¹⁰ Pa−1, with a matrix porosity, permeability, and compressibility of 0.3, 1 × 10⁻¹⁴ m2, and 10−8 Pa−1, respectively.
In the following stage, boundary conditions were established, setting the left boundary as a pressure boundary with an initial pressure of 1 × 10⁷ Pa. The top and bottom boundaries were considered to be impermeable, while the right side was assigned as the outlet.
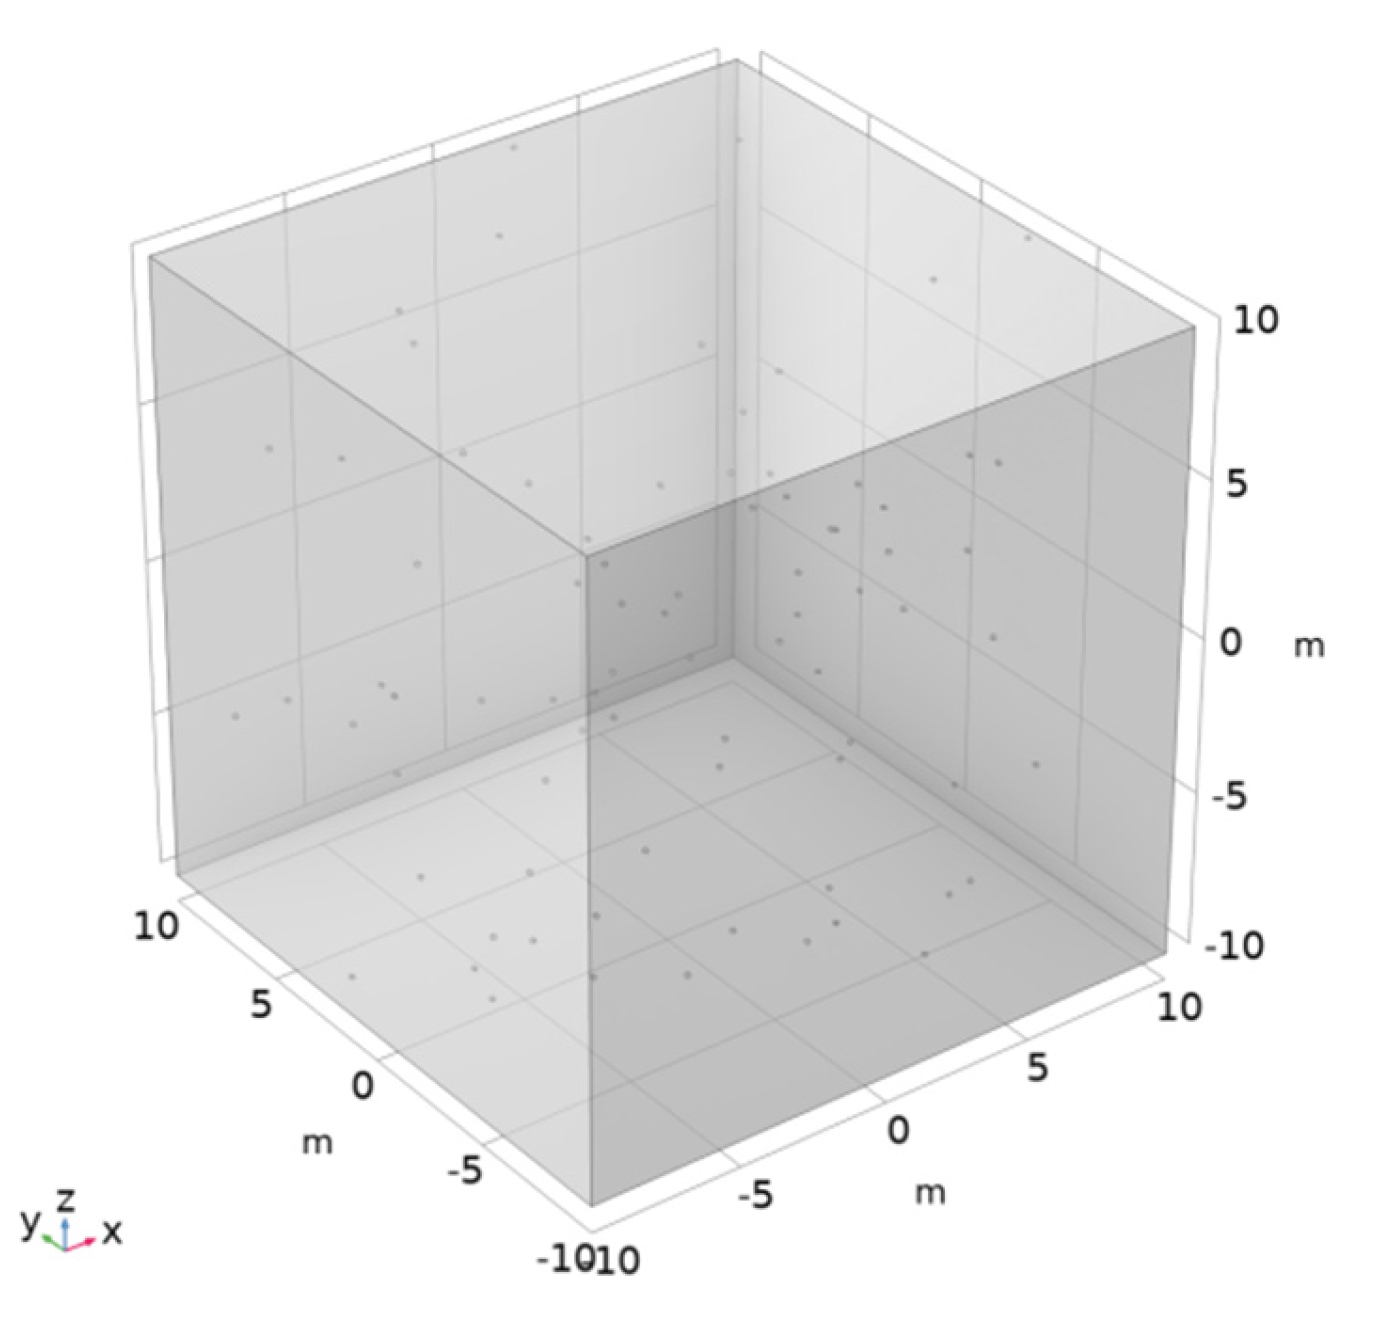
The identification of fracture attributes relied on a fracture density of 0.1/m
3, which corresponded to 80 fractures for the control group. A random simulator was engaged to produce the coordinates of the 80 fracture centers, as presented in
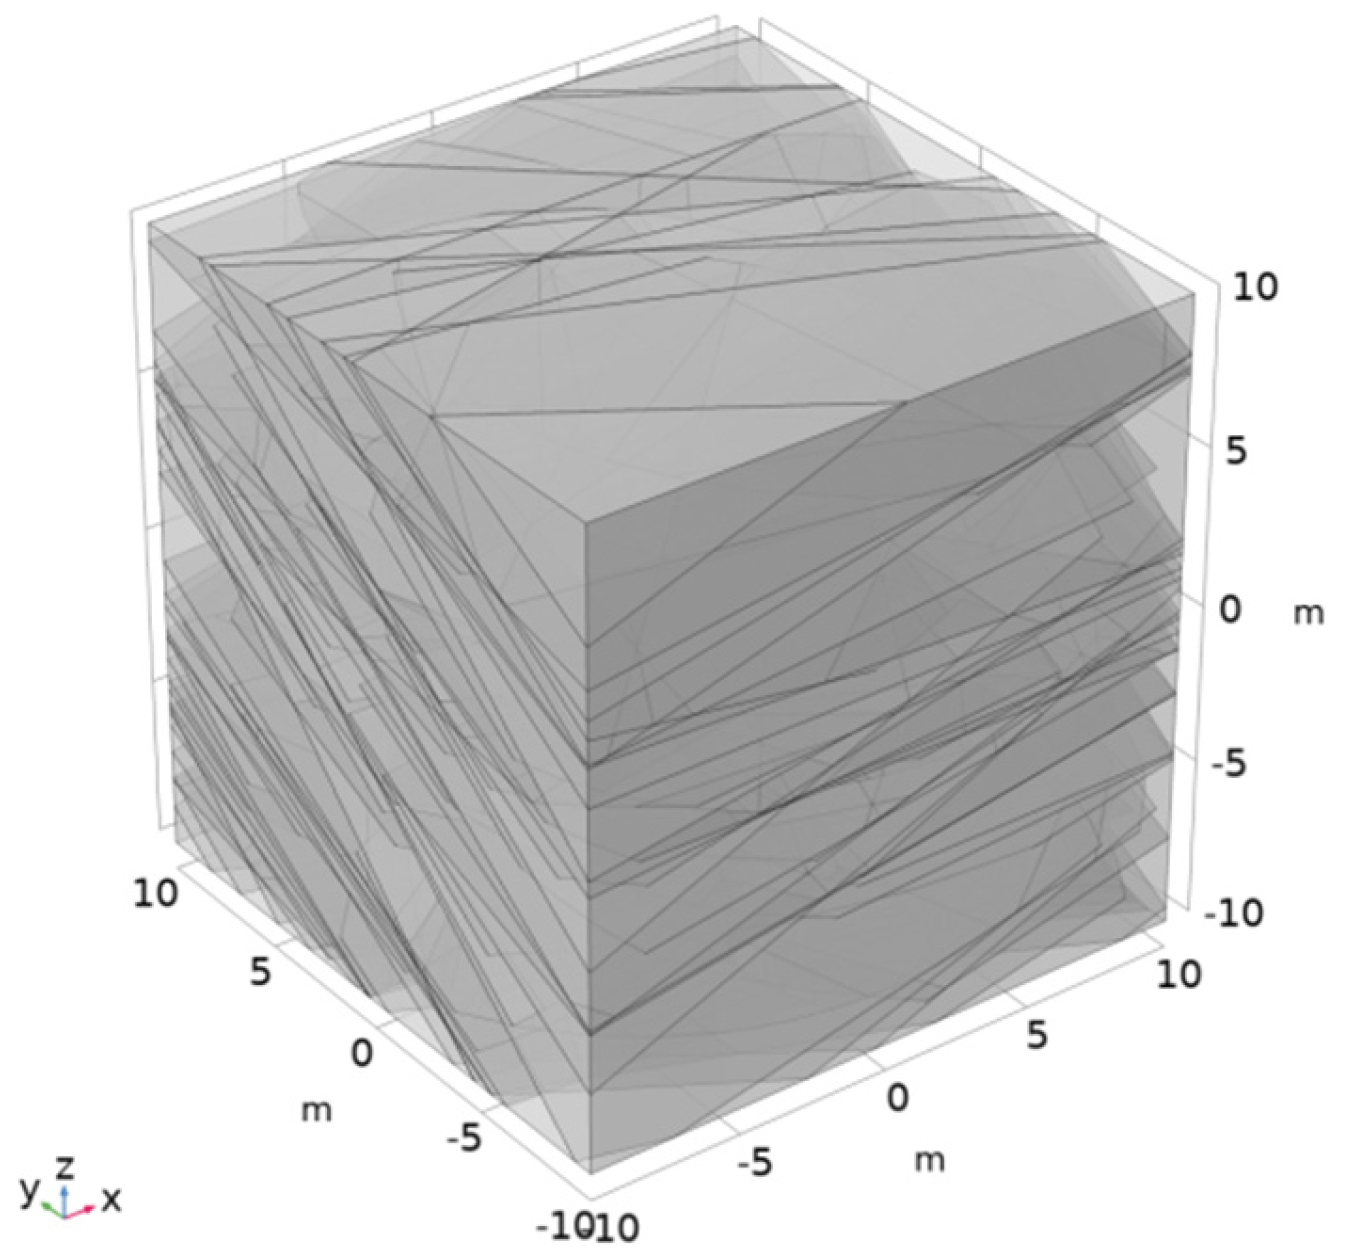
Figure 4. These coordinates were then used as guide points for setting the fracture parameters. Following the adjustments made to the fracture length, direction, and aperture based on the fracture parameters, the adopted standard conditions encompassed a fracture length of 11 to 20 m, a length power law index of eight, a strike and dip of 45° each, a dispersion coefficient of 8.05, a fracture aperture ranging between 0.1 and 0.6 mm, and an aperture power law index of 8eight. The numerical requirements related to these parameters were input into the random simulator. The resultant values were then incorporated into the fracture model, simulating the respective fracture conditions, as illustrated in
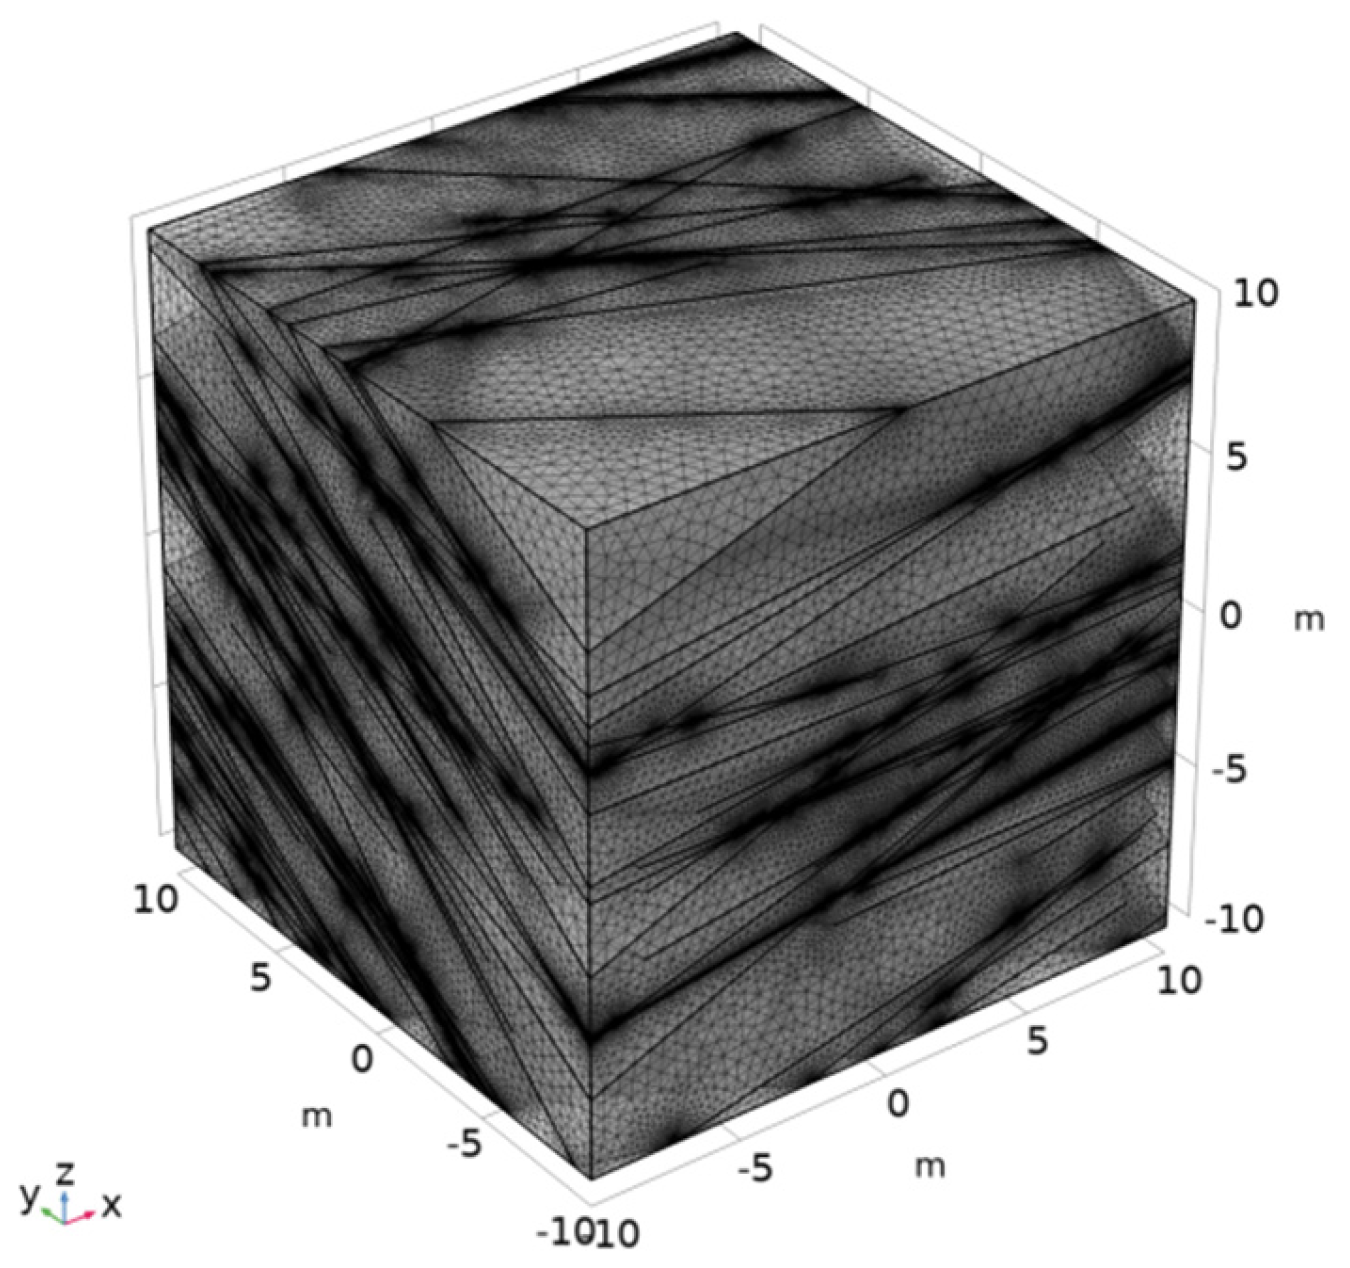
Figure 5. A boundary mesh was subsequently established, and following the fracture simulations, free meshes were generated for them, succeeded by computation, as depicted in
Figure 6.
Once the computations were finalized, the right end of the model, symbolizing the simulated outlet, was chosen for data gathering. The points of intersection between the fractures and the boundaries were pinpointed as data collection points for aggregate summation. The data from the right boundary was combined with the fracture seepage data to generate the final overall Darcy velocity data.
4. Results
4.1. Influence of Matrix Permeability in Rock Mass
This section analyzes the features and trends in the distributions of Darcy velocity fields and pore pressure in a stochastic fracture network model under the influence of single-factor changes.
Referring to Darcy velocity and pore pressure cross-section diagrams at different matrix permeabilities (
Figure S1), it can be seen that as the permeability of the matrix decreases, the movement of groundwater within the matrix weakens, while it strengthens within fractures. When the matrix permeability is relatively high, the distribution of Darcy velocities within the matrix is quite uniform. Conversely, when matrix permeability is low, the Darcy velocity fields show significant changes in fractures located at relatively close positions, with lower velocities in other regions. The pore pressure cross-sections illustrate the distribution changes under different matrix permeabilities. It can be observed that when the matrix permeability is high, the pore pressure distribution is uniform, and it begins to spread as the matrix permeability decreases.
Considering Darcy velocity and pore pressure cross-section diagrams under different water pressure conditions (
Figure S2), when water pressure is low, the flow direction in the model is not only in the direction of pressurized water but also gravity, indicating that gravity significantly influences flow speed. As water pressure increases, the flow direction gradually aligns with the water pressure direction, suggesting that the influence of gravity on seepage decreases. This trend can also be inferred from the changes in pore pressure.
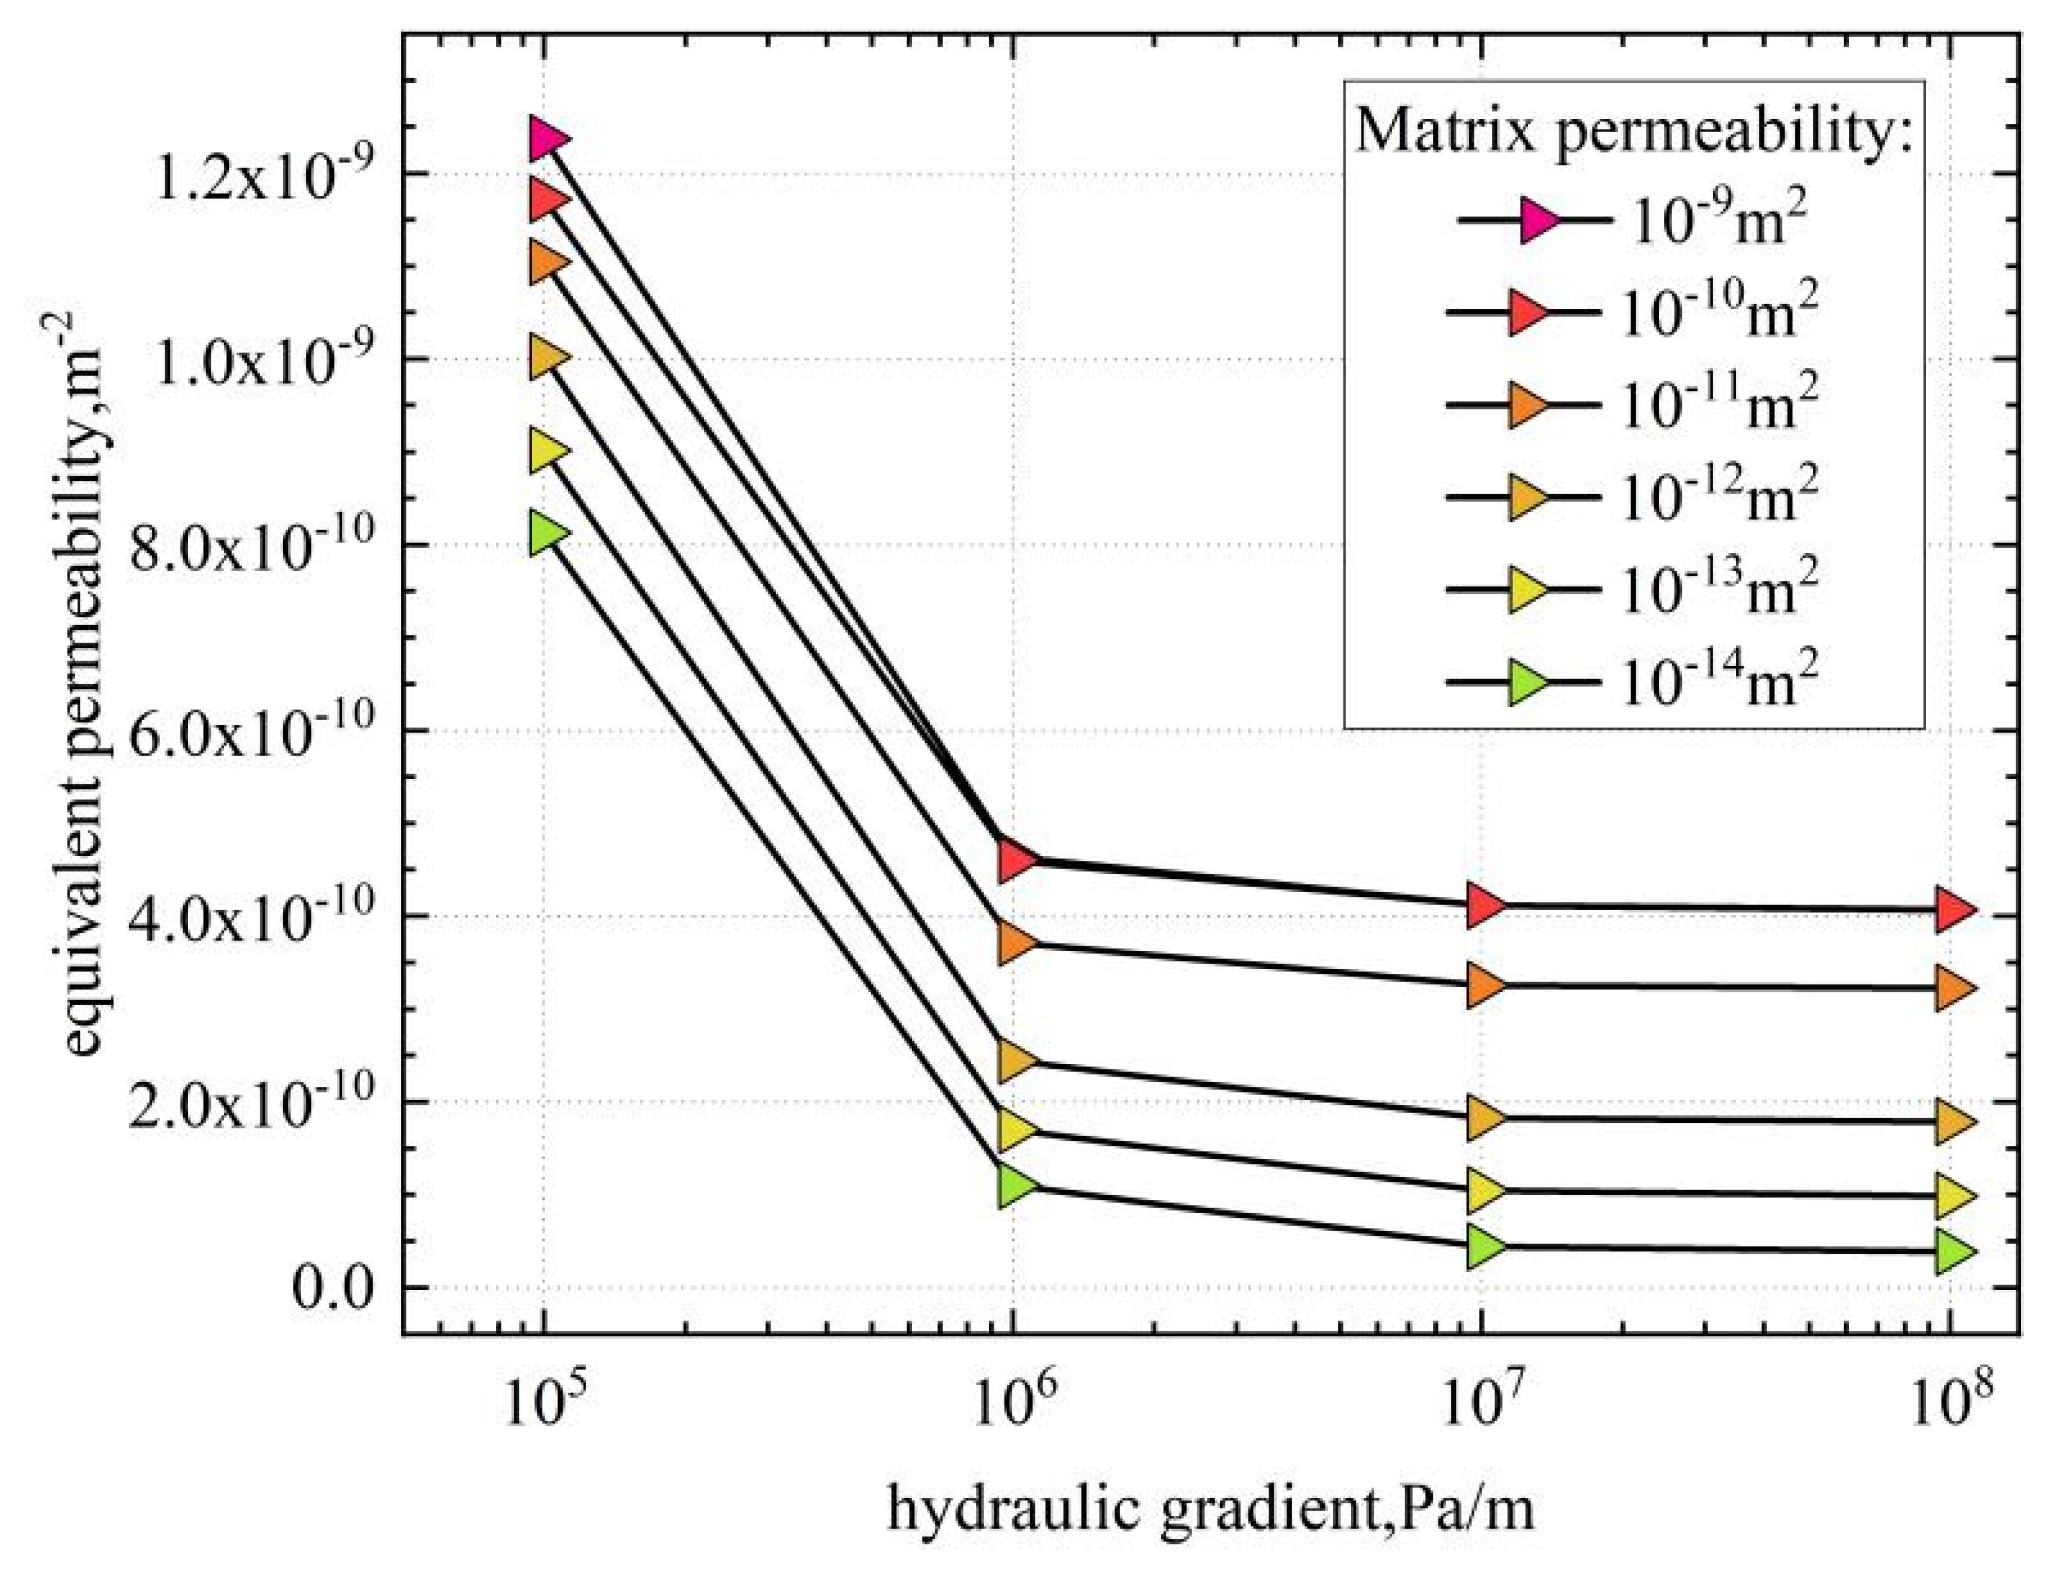
Figure 7 shows line graphs of the equivalent permeability under different matrix permeabilities at different water pressures. From
Figure 7, it can be observed that the influence of matrix permeability on equivalent permeability is consistent, i.e., the larger the matrix permeability, the greater the equivalent permeability, and vice versa. However, under different water pressure conditions, the equivalent permeability of different matrix permeabilities tends to stabilize at a hydraulic gradient of 10
7 Pa/m, indicating that at this hydraulic gradient, the influence of the gravity field on equivalent permeability is negligible. Therefore, this experiment selects a hydraulic gradient of 10
7 Pa/m, i.e., 10 MPa/m, as the experimental parameter to determine the impact of fracture distribution on equivalent permeability.
4.2. Single-Factor Analysis of Three-Dimensional Fracture Geometric Parameters
4.2.1. The Influence of Fracture Density
By combining the Darcy velocity cross-section and pore water pressure cross-section under different fracture densities (
Figure S3), it can be seen that as fracture density increases, the area of significant change in Darcy velocity decreases, groundwater flow significantly increases, and water movement in the matrix decreases. In the pore water pressure cross-section, it can be seen that as fracture density increases, the high-pressure area decreases, and the low-pressure area increases.
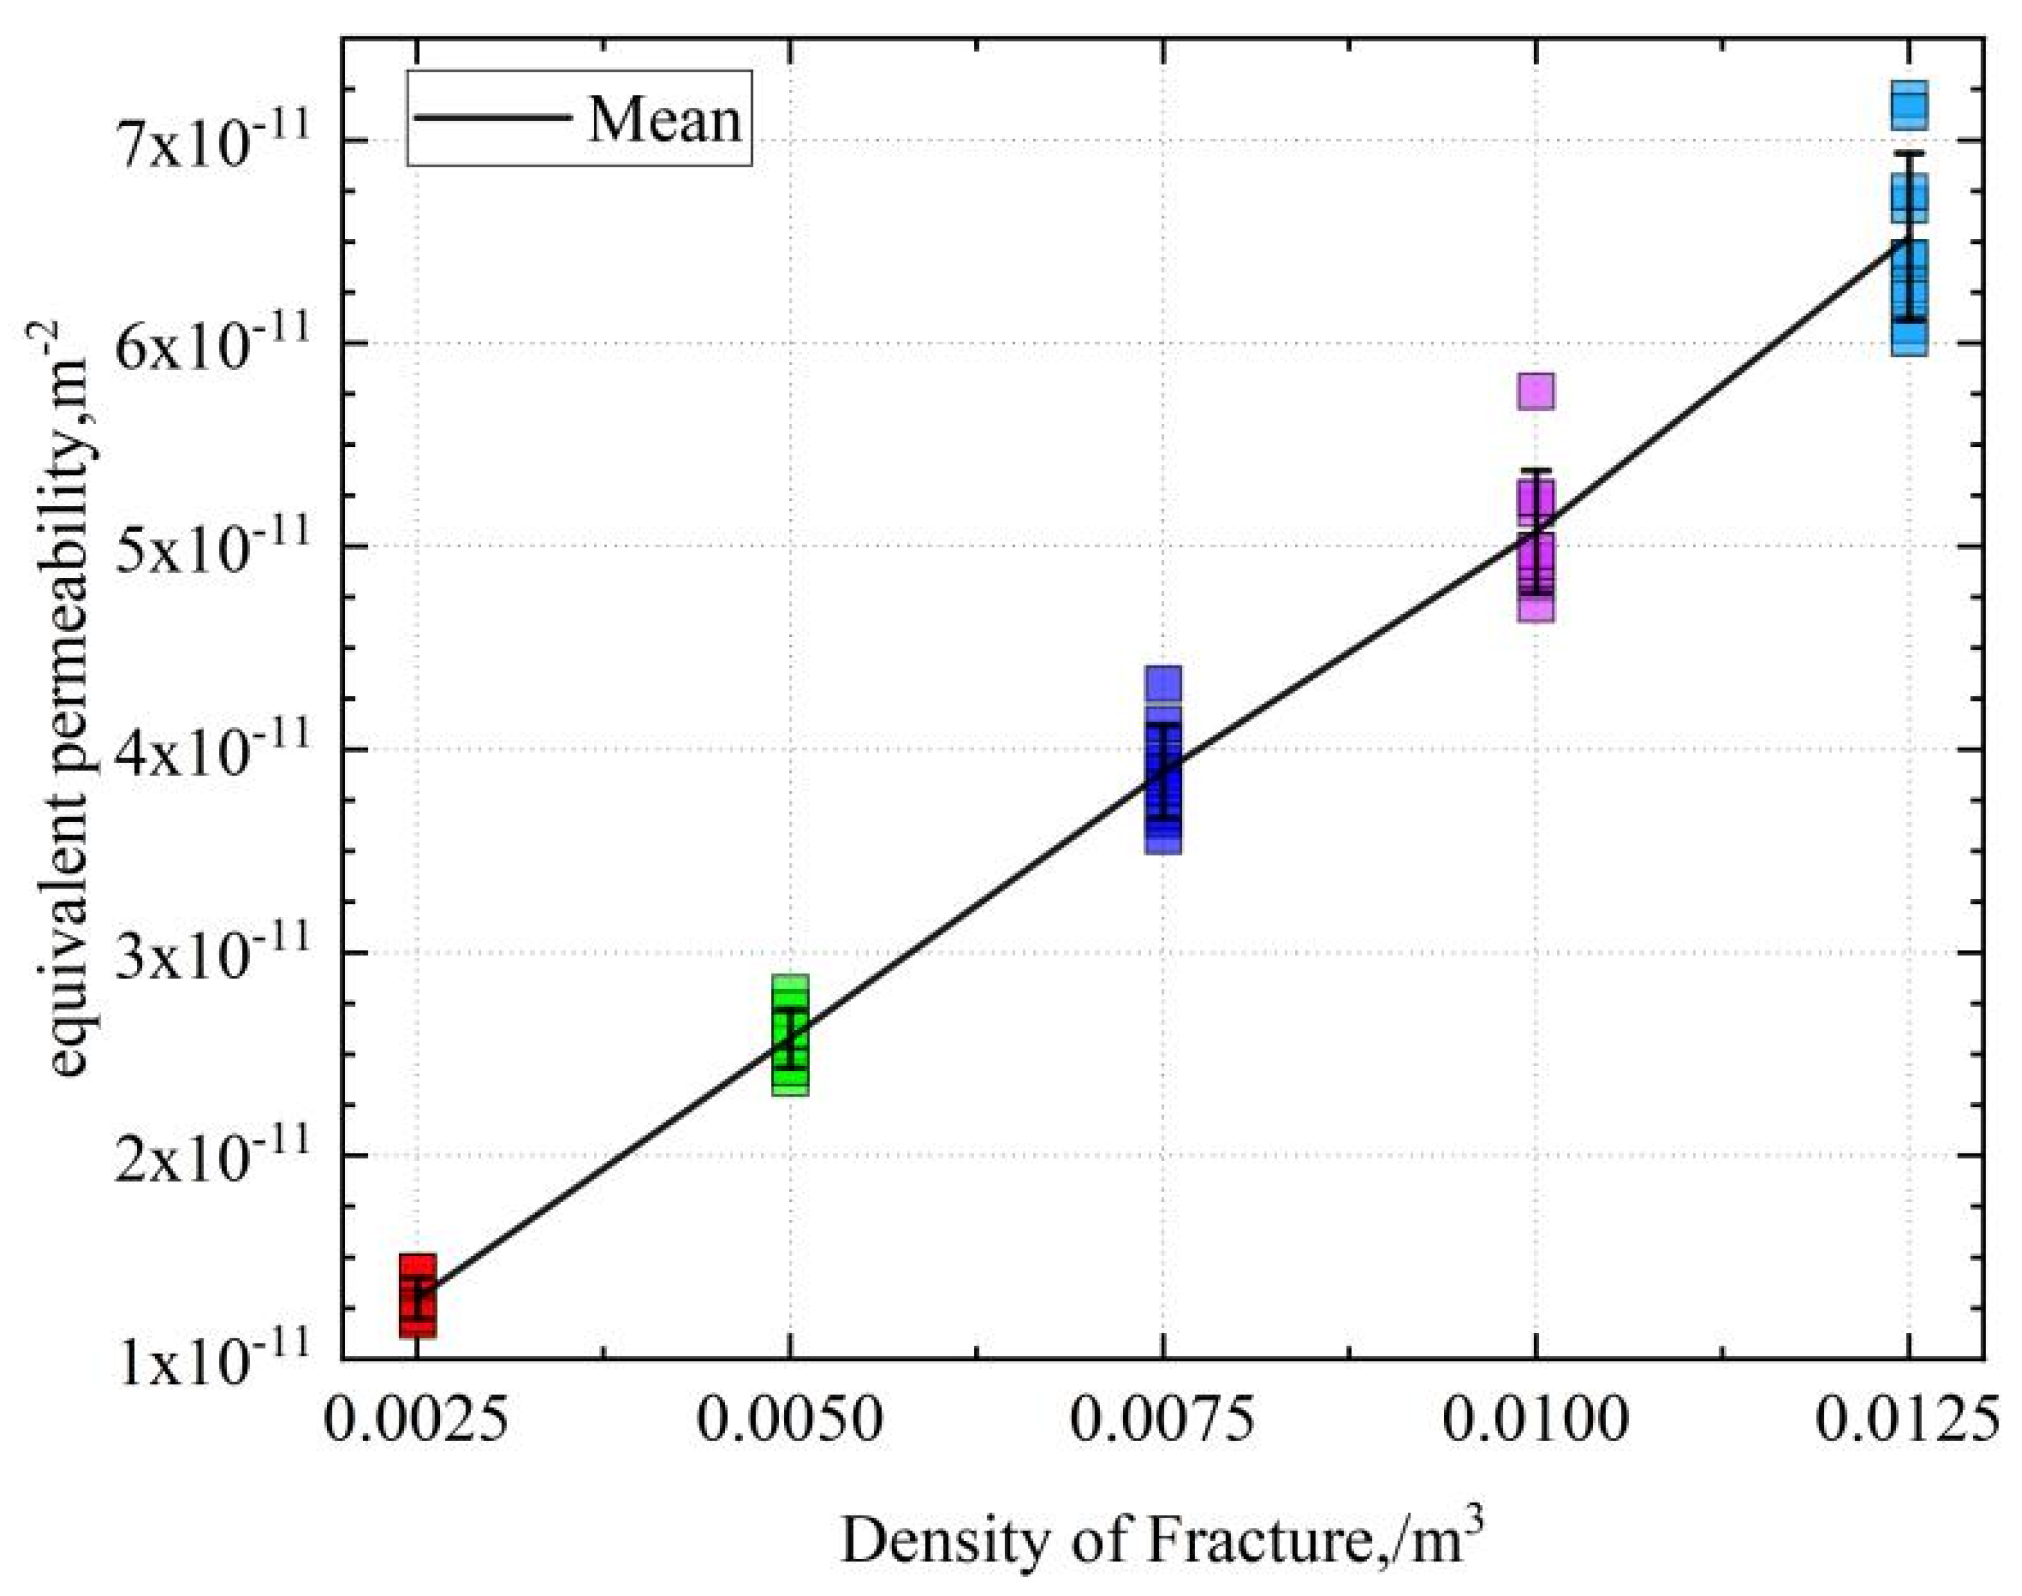
Figure 8 shows a scatter plot of equivalent permeability under different fracture densities. Obviously, the equivalent permeability increases linearly with the increase in fracture density.
4.2.2. The Influence of Fracture Length
Combining the Darcy velocity cross-section and pore water pressure cross-section under different fracture lengths (
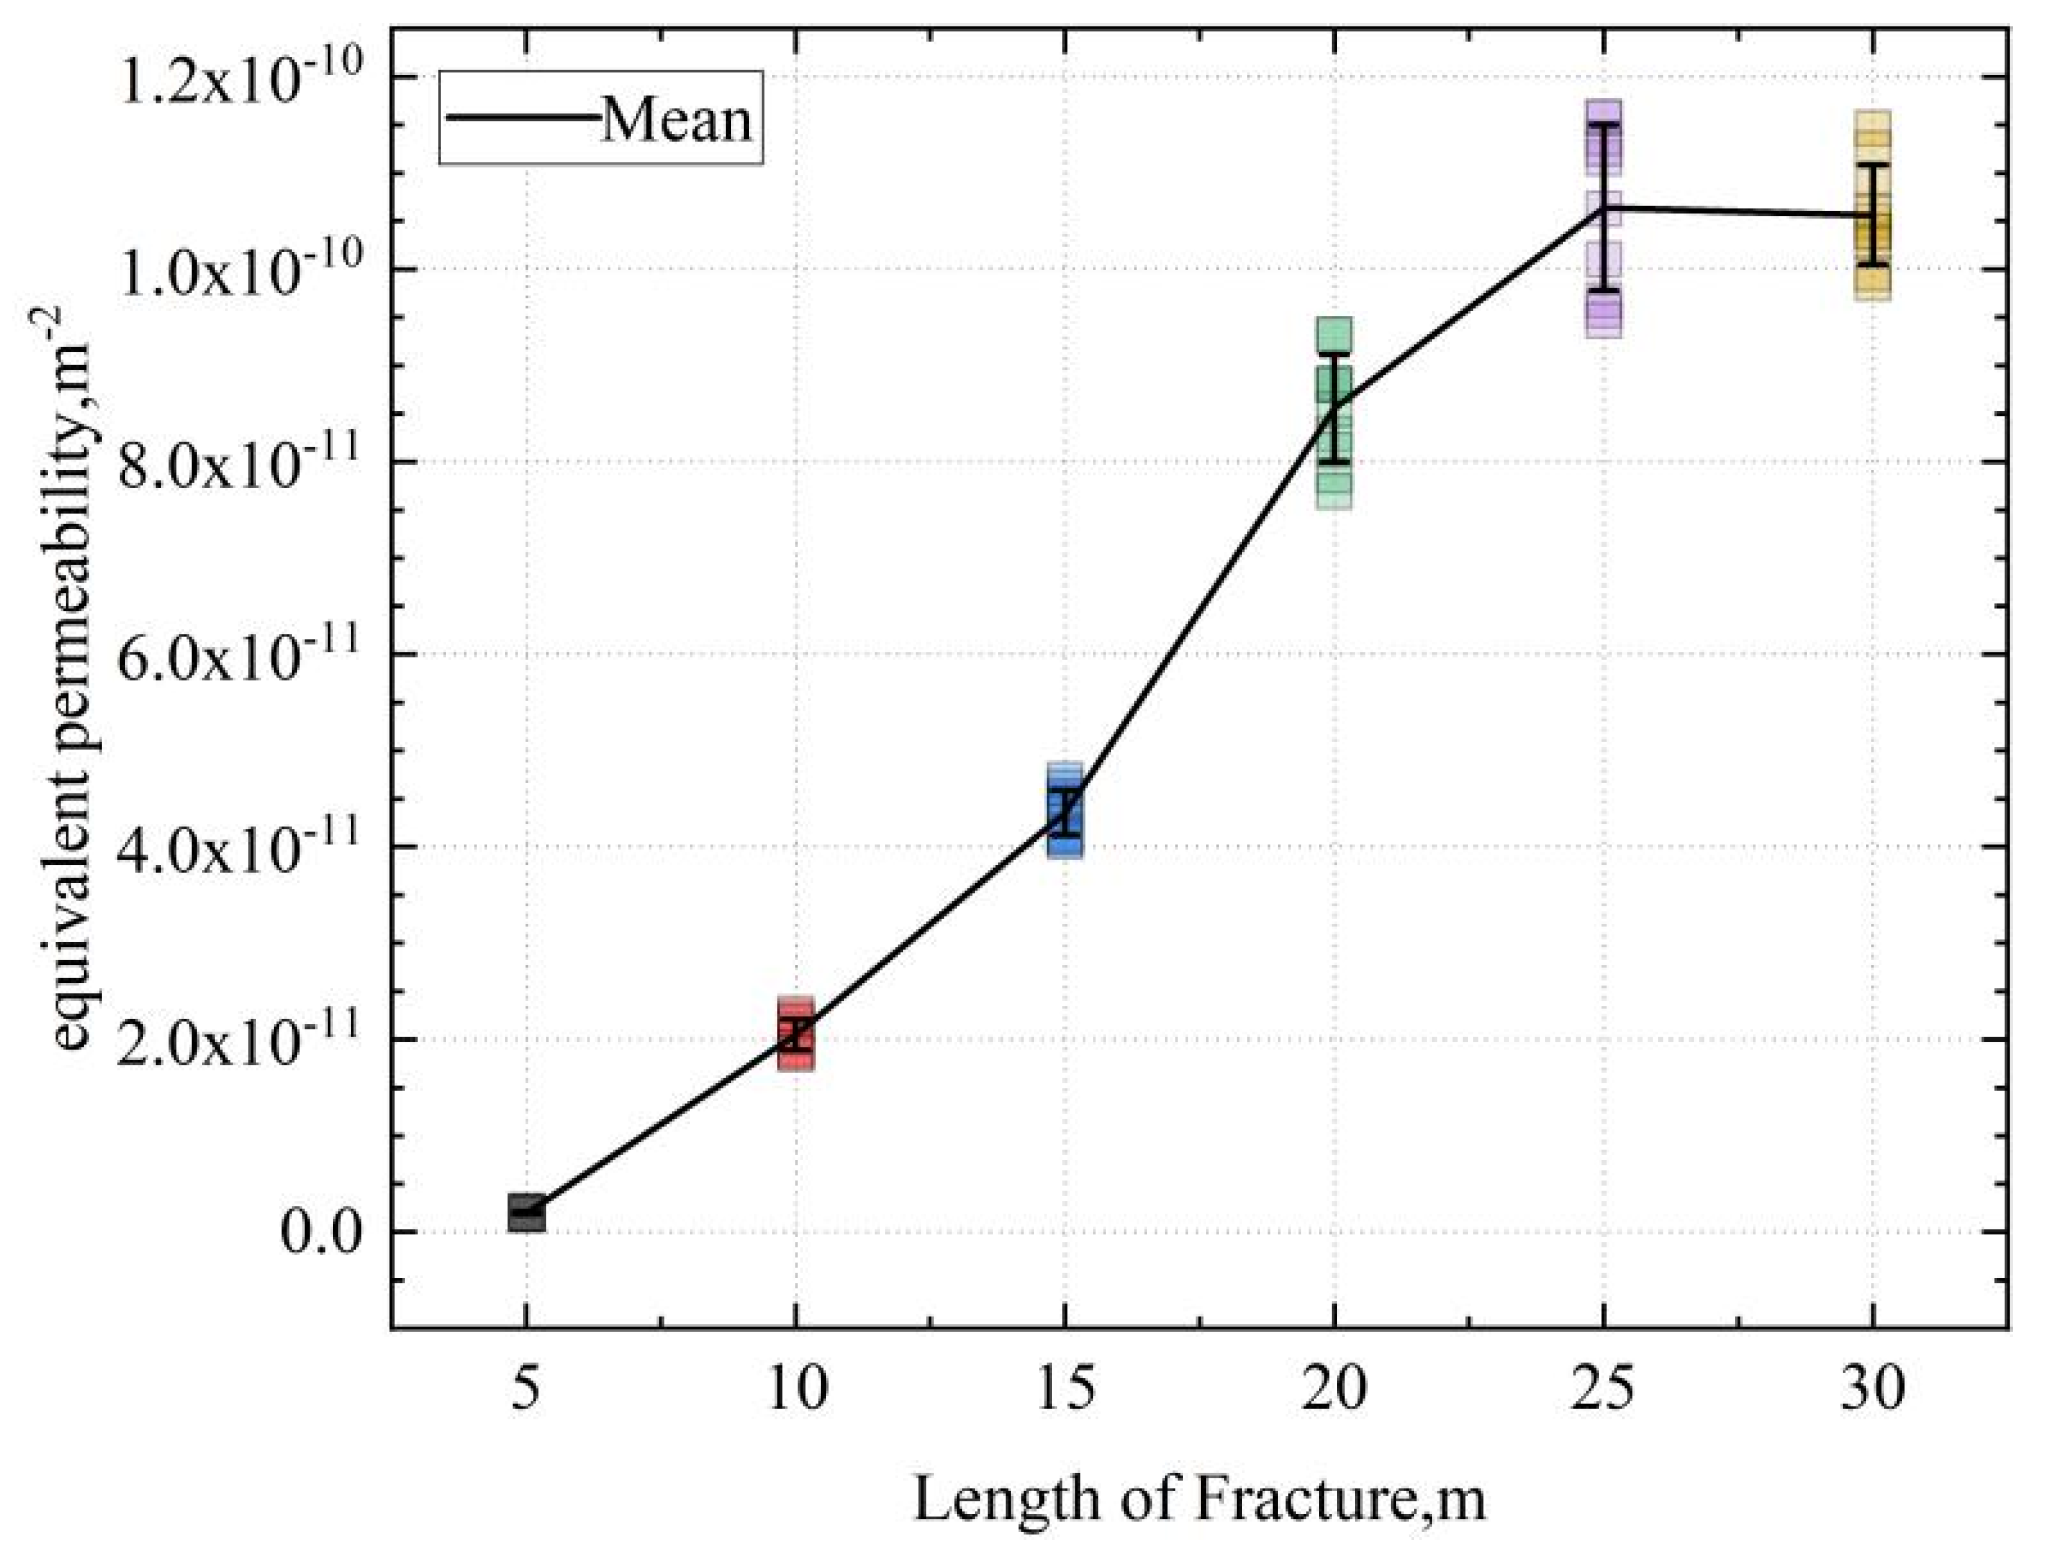
Figure S4), it can be seen that when the length is relatively low, there are many areas in the model where the Darcy velocity changes significantly, and the speed of groundwater in the matrix fluid is relatively high. As the fracture length increases, the area where the Darcy velocity changes significantly in the model decreases, and the speed of groundwater flowing in the matrix also decreases. From the changes in pore water pressure, it can be seen that as the fracture length increases, the high-pressure area decreases.
Figure 9 shows a scatter plot of equivalent permeability under different fracture lengths. Within the range of 5–20 m, the equivalent permeability increases significantly. When the length is greater than 20–25 m, the growth rate of equivalent permeability decreases, and when the length is greater than 25 m, the equivalent permeability can hardly increase.
When combining the Darcy velocity cross-section and pore water pressure cross-section under different fracture length ratios (
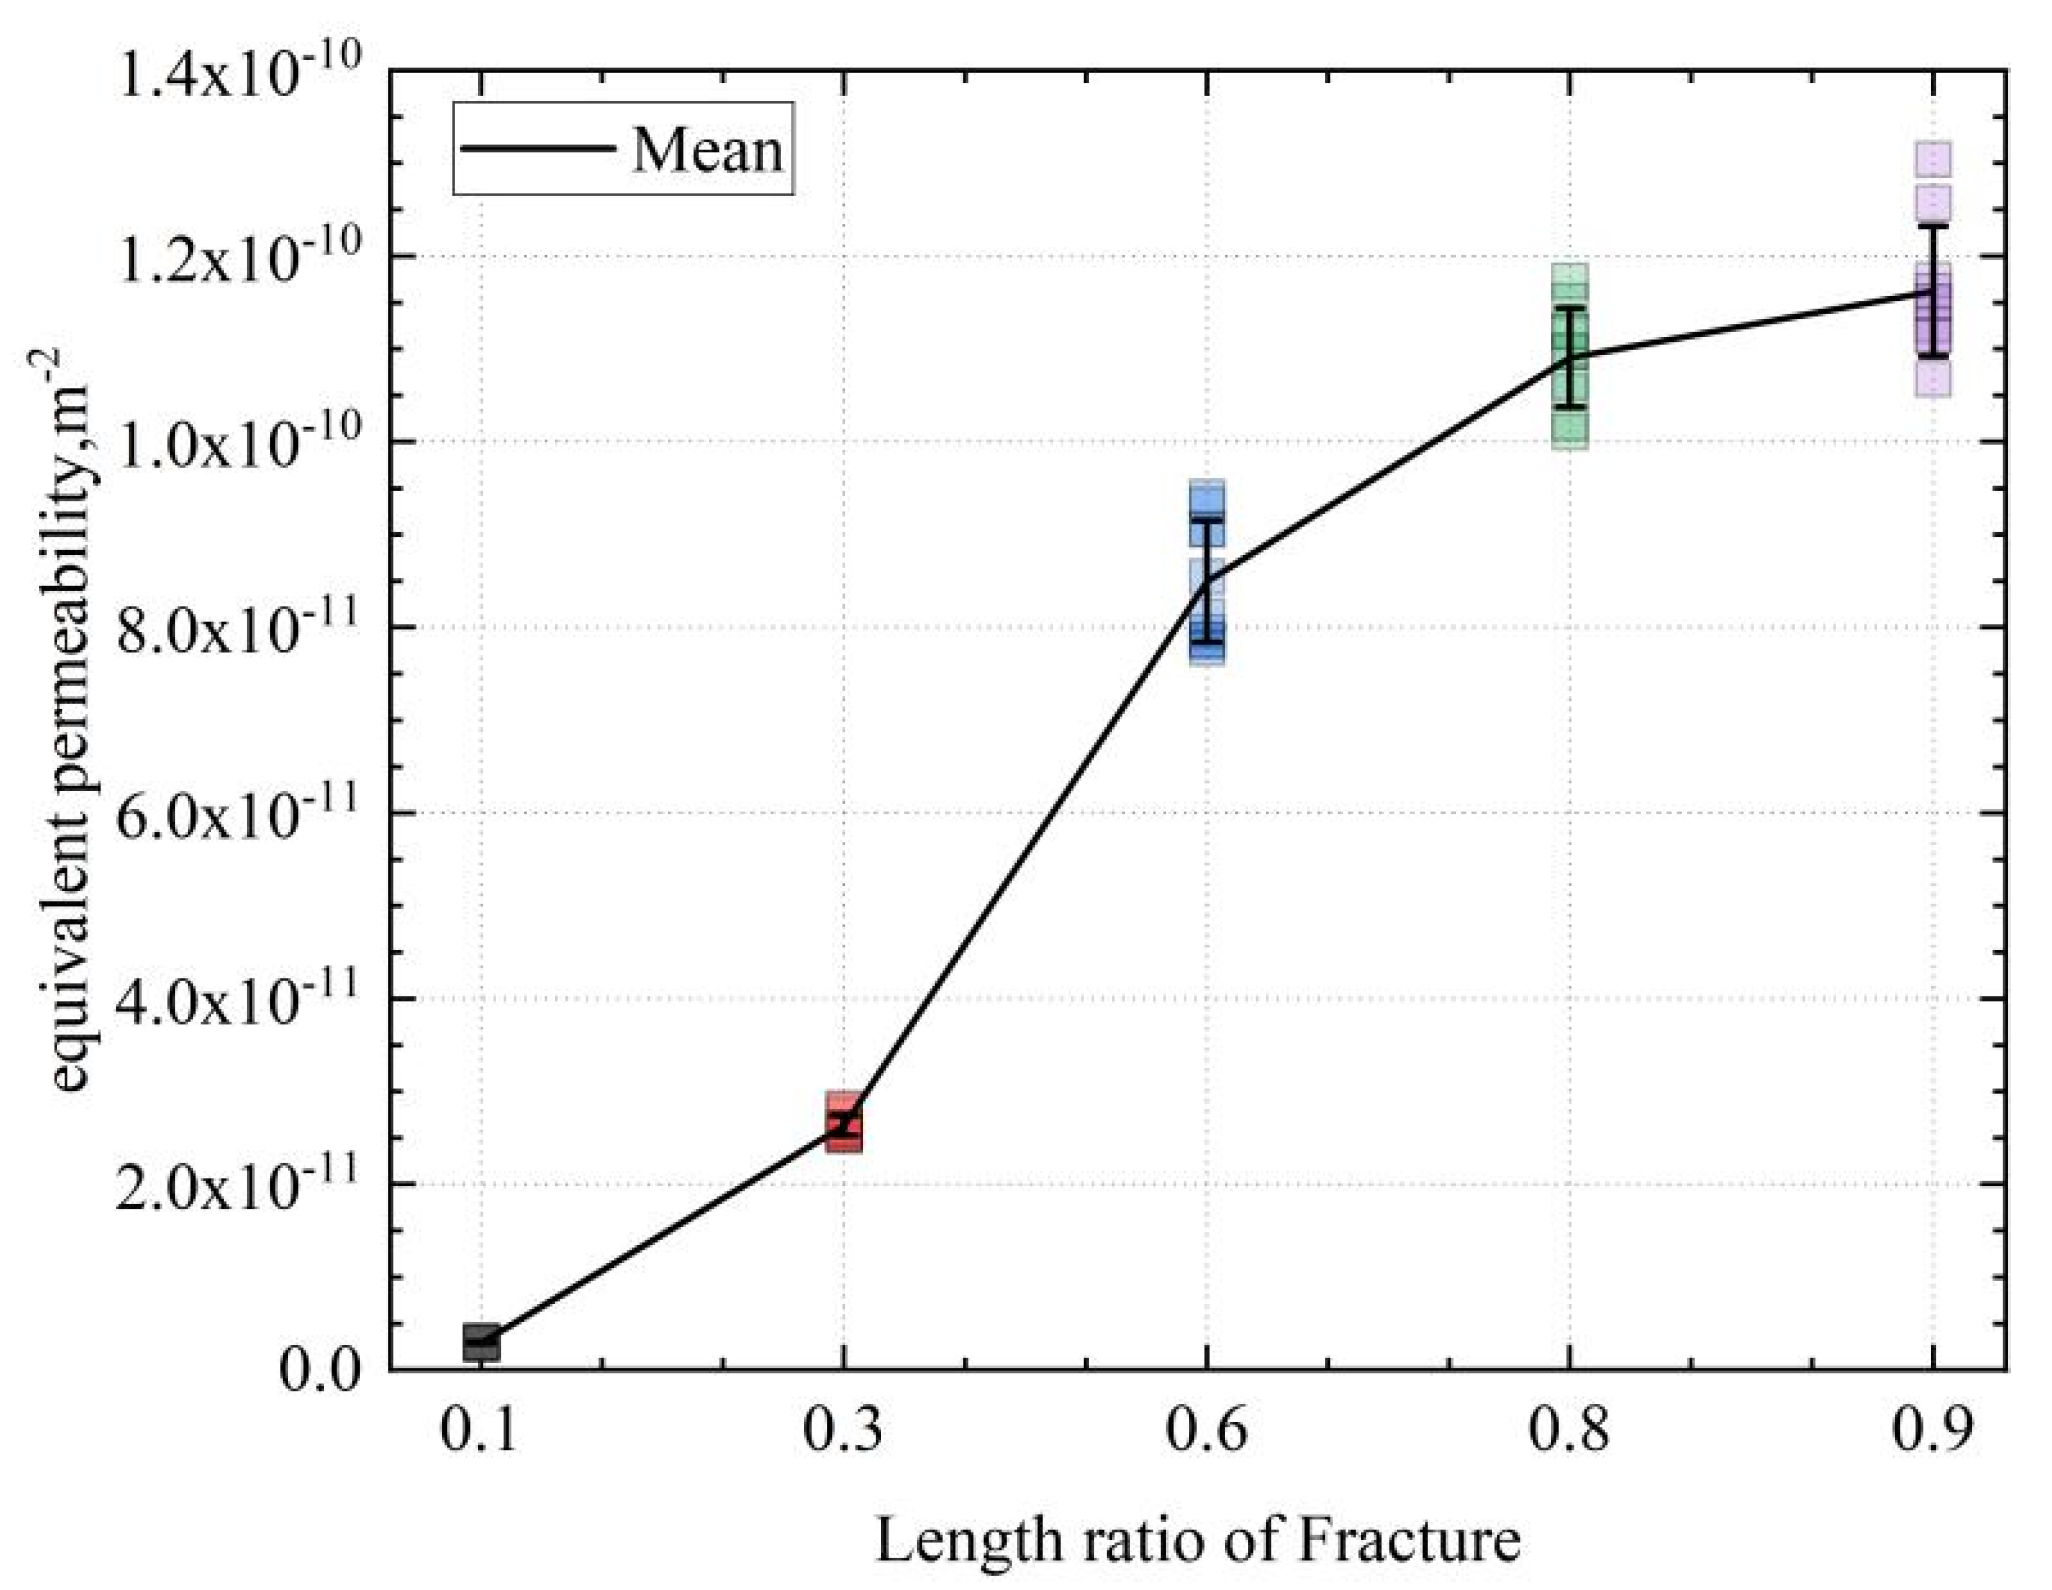
Figure S5), when the ratio of long to short fractures is closer to one, the distribution of Darcy velocity in the matrix becomes more scattered. When the ratio reaches 0.75, there are fewer areas in the model with high Darcy velocity in the matrix. Compared with low ratios, when the length ratio is higher, the distribution of pore pressure field is more uniform. The pressure isocline distribution is more uniform. This may explain why it is that as the length ratio increases, the impact of fractures on permeability gradually increases, while the impact of the matrix part on permeability decreases.
Figure 10 shows a scatter plot of equivalent permeability under different fracture length ratios. Within the range of 0.1–0.6, the equivalent permeability increases with the increase in the ratio, and the growth rate is relatively large. Within the range of 0.6–0.9, although the ratio does contribute to an increase in the equivalent permeability, the magnitude of this increase is relatively small compared to the previous scenario.
When combining the Darcy velocity cross-section and pore water pressure cross-section under different fracture length power laws (
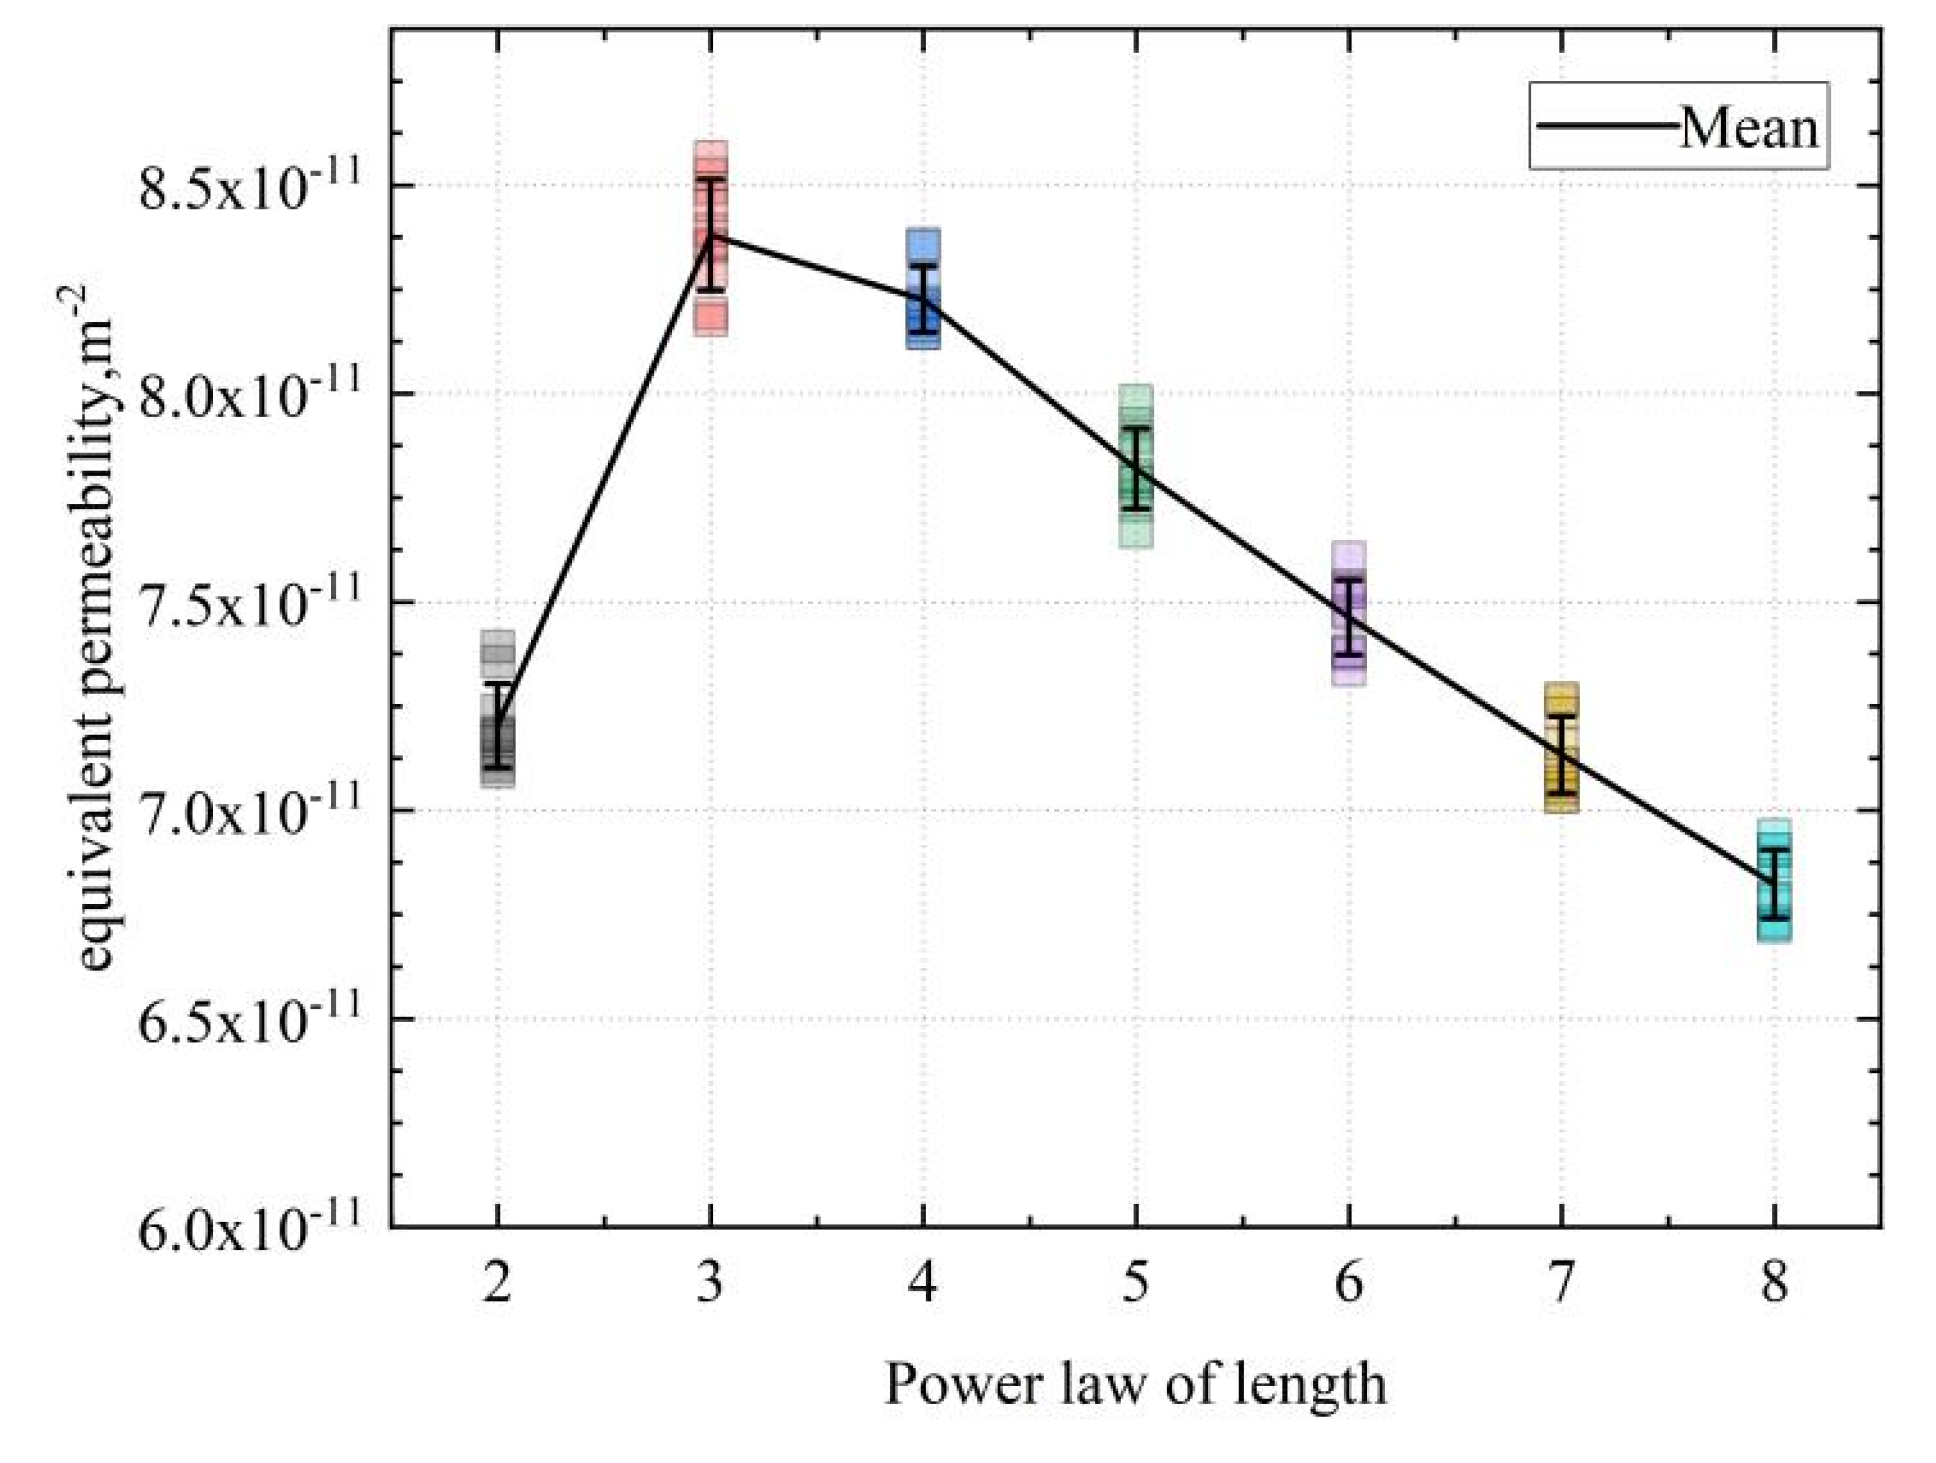
Figure S6), when the length power law increases, the area of the high-Darcy-velocity region expands, and at the same time, the maximum value of the low-Darcy-velocity region also decreases. It can be concluded that as the length power law increases, the main movement trajectory of groundwater in the matrix is more concentrated on the best movement path constructed by the fracture and the matrix, while in other parts of the matrix, the flow speed is significantly reduced. The pore water pressure distribution map shows that in the high-Darcy-velocity area, as the length power law changes, the pressure changes are also very obvious, and the isobaric lines in the high-Darcy-velocity area change significantly with the power law. The pressure changes in other areas are not obvious.
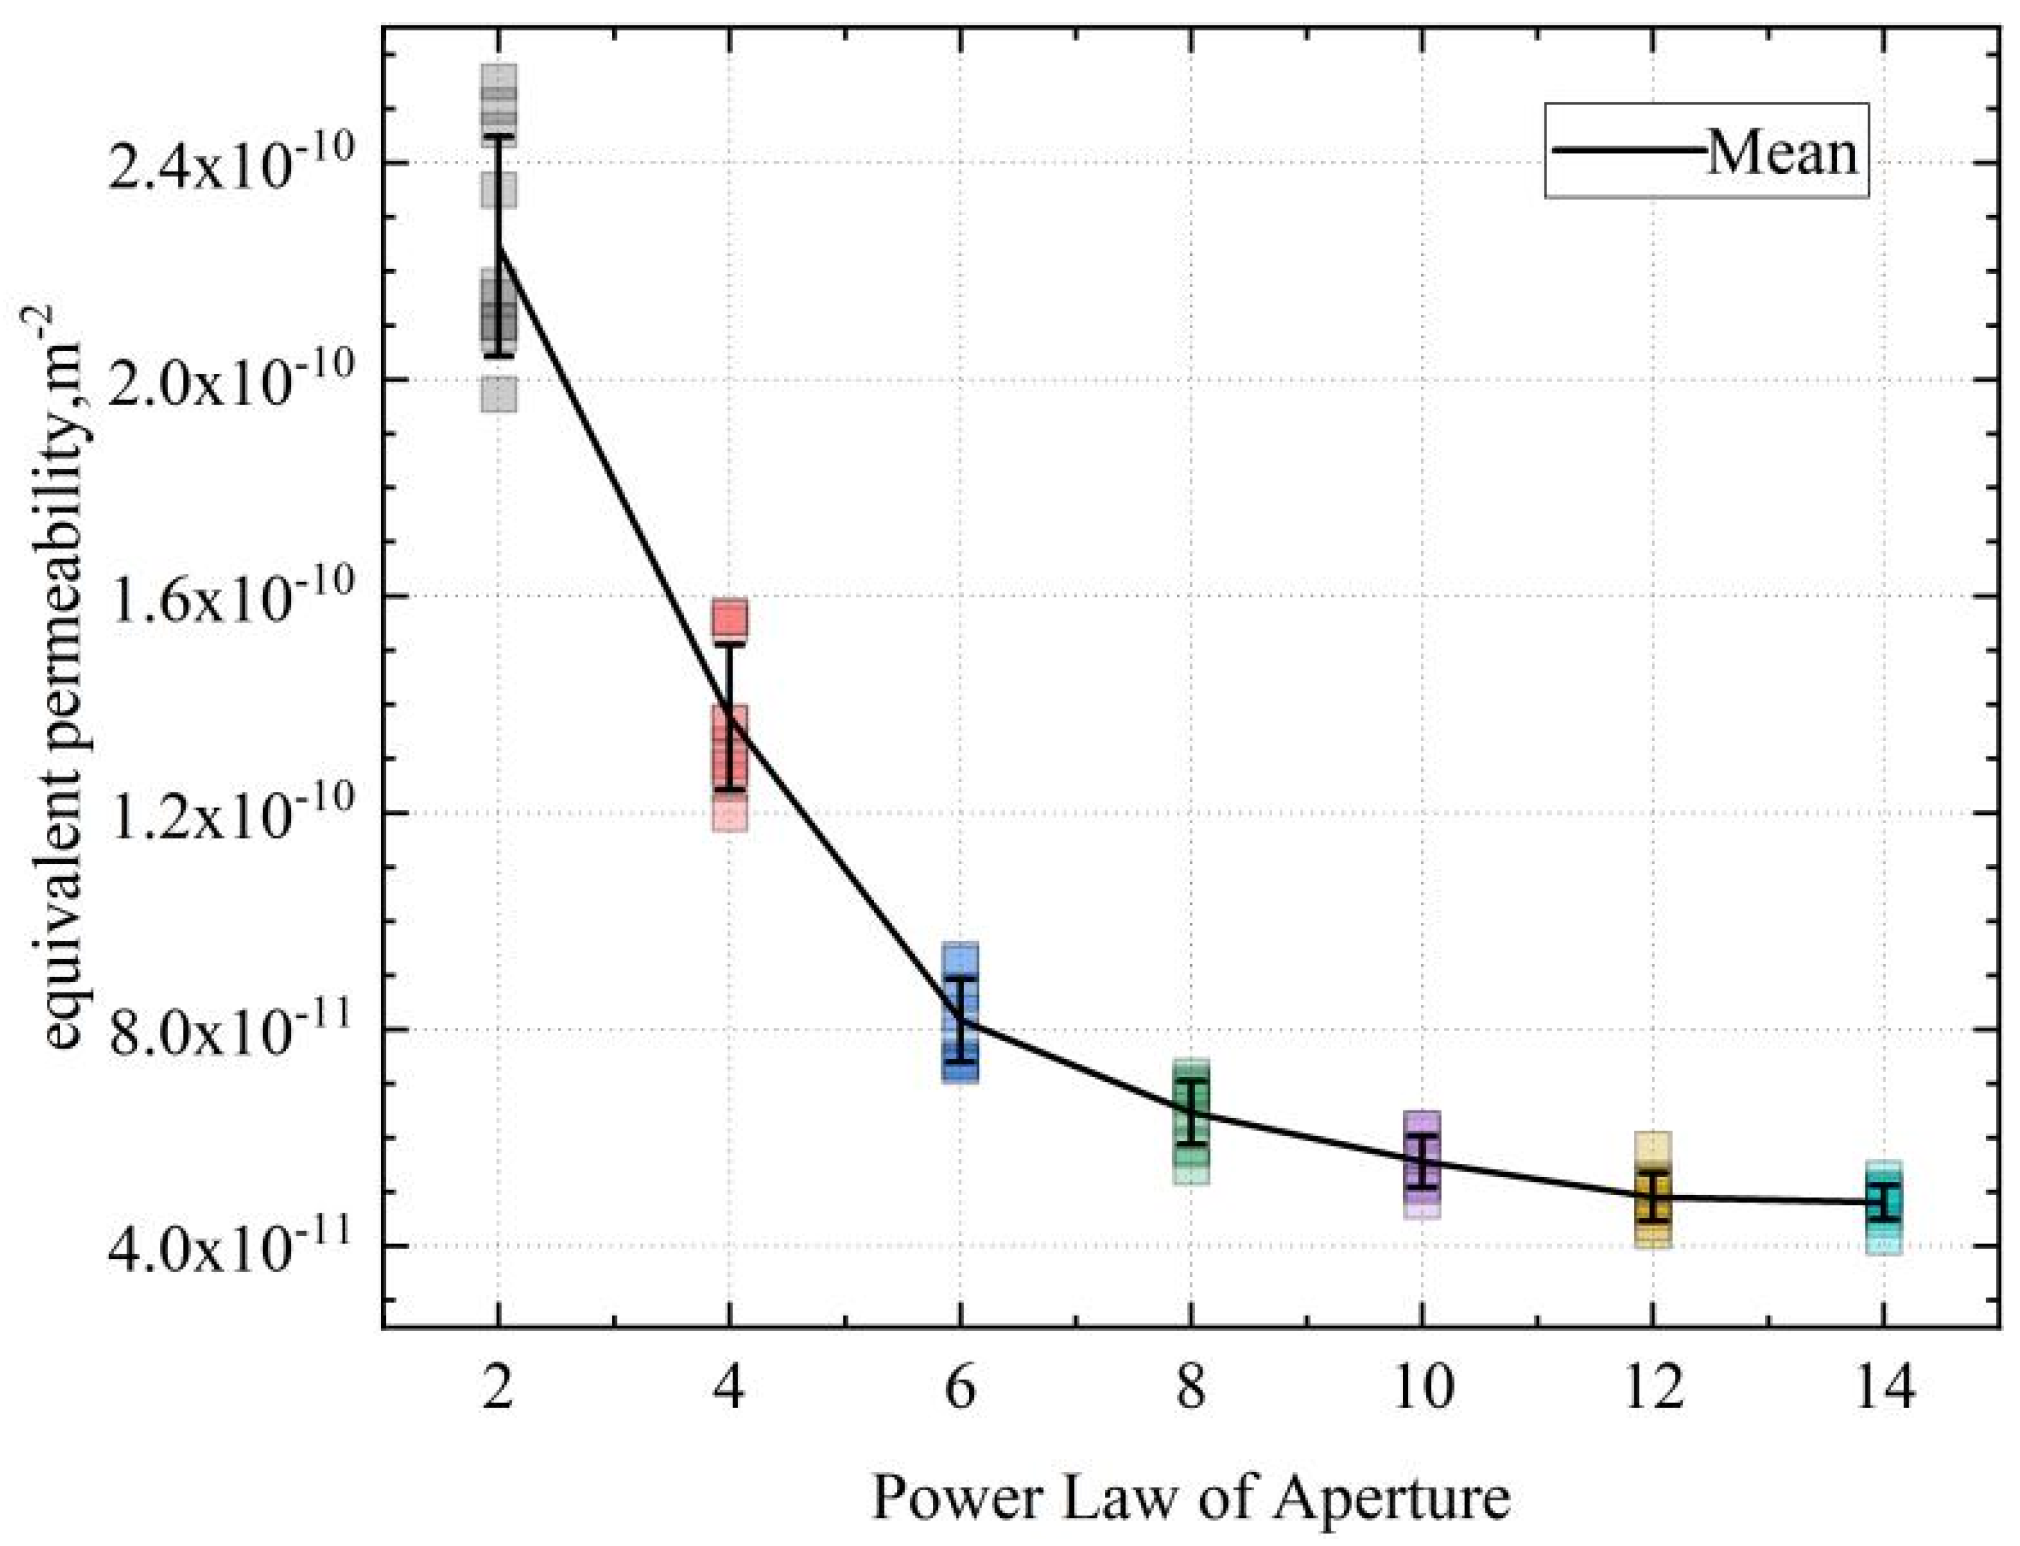
Figure 11 shows a scatter plot of equivalent permeability under different length power laws. When the power law is 2–3, the equivalent permeability increases significantly with an exponential growth in the power law. However, when the power law is 3–8, the equivalent permeability decreases significantly with an increase in the power law index. The trend is very obvious, which indicates that as the power law index increases, the fracture length overall decreases, and although there are some fractures that are relatively long compared to the whole, they have no significant impact on the equivalent permeability.
4.2.3. Fracture Angle
When combining the Darcy velocity cross-section and pore water pressure cross-section under different fracture angle strike and dip conditions (
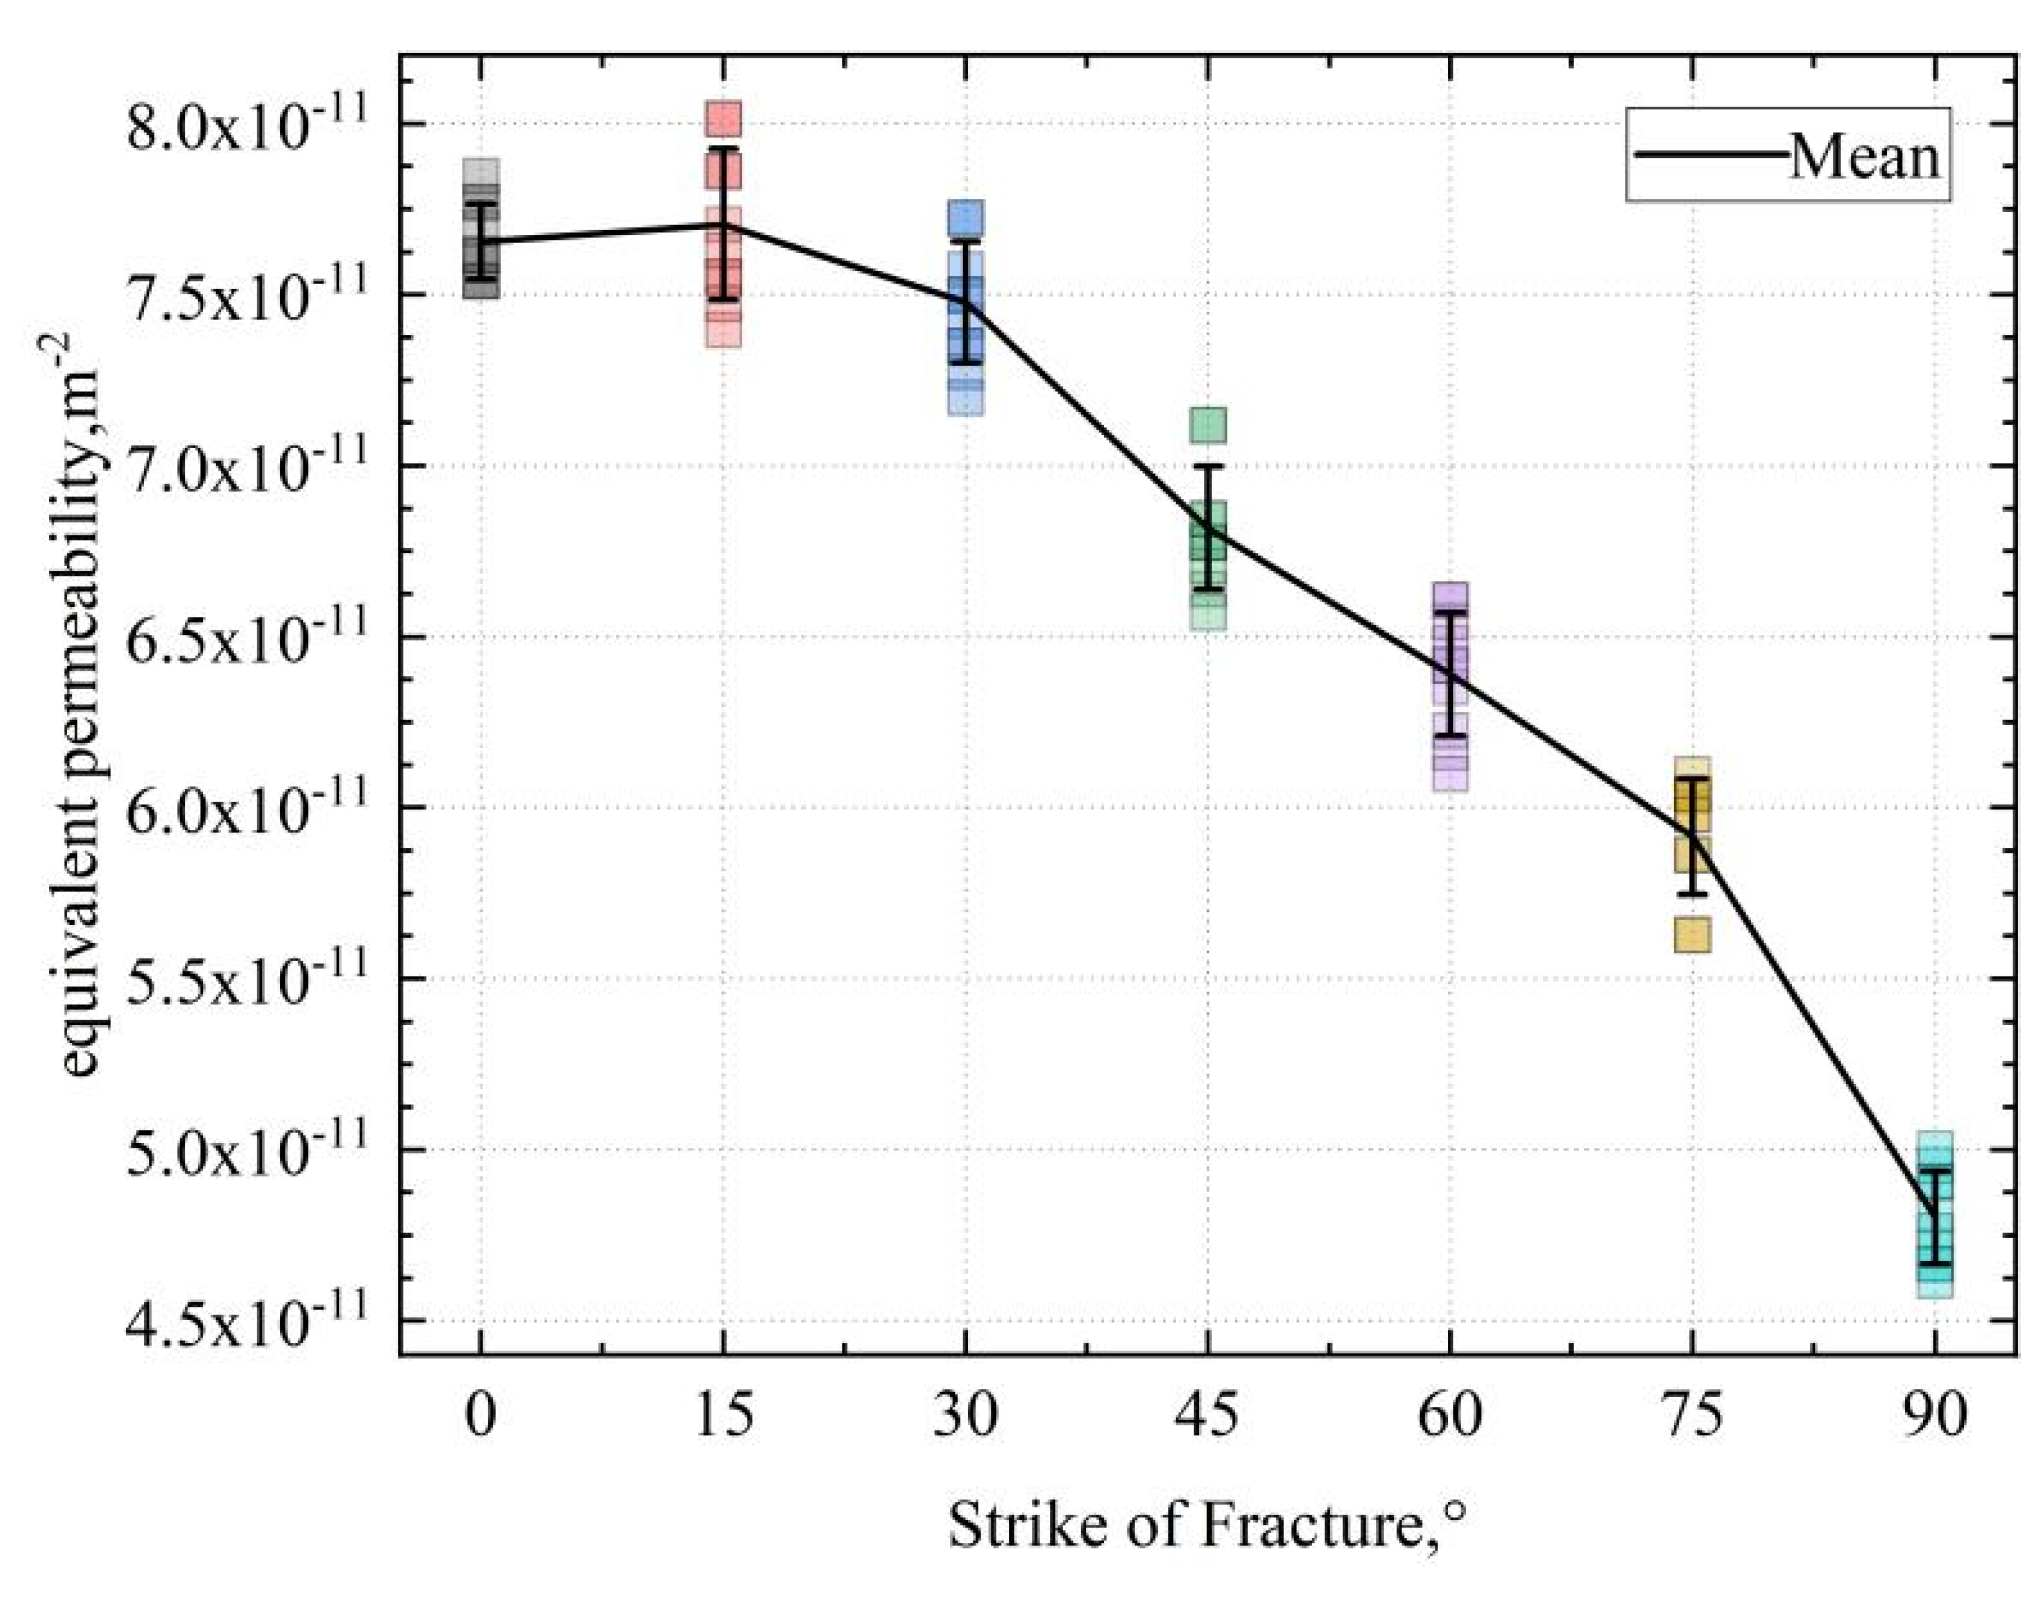
Figure S7), as the strike of a fracture changes from 0° to 90°, the groundwater seepage speed in the matrix first decreases and then increases, and the water flow speed in the fracture first increases and then decreases. The distribution of pore water pressure first increases and then decreases in high-pressure areas, while it first decreases and then increases in low-pressure areas.
Figure 12 shows a scatter plot of equivalent permeability under different strike of fracture directions, and it can be seen that as the direction increases, the equivalent permeability decreases.
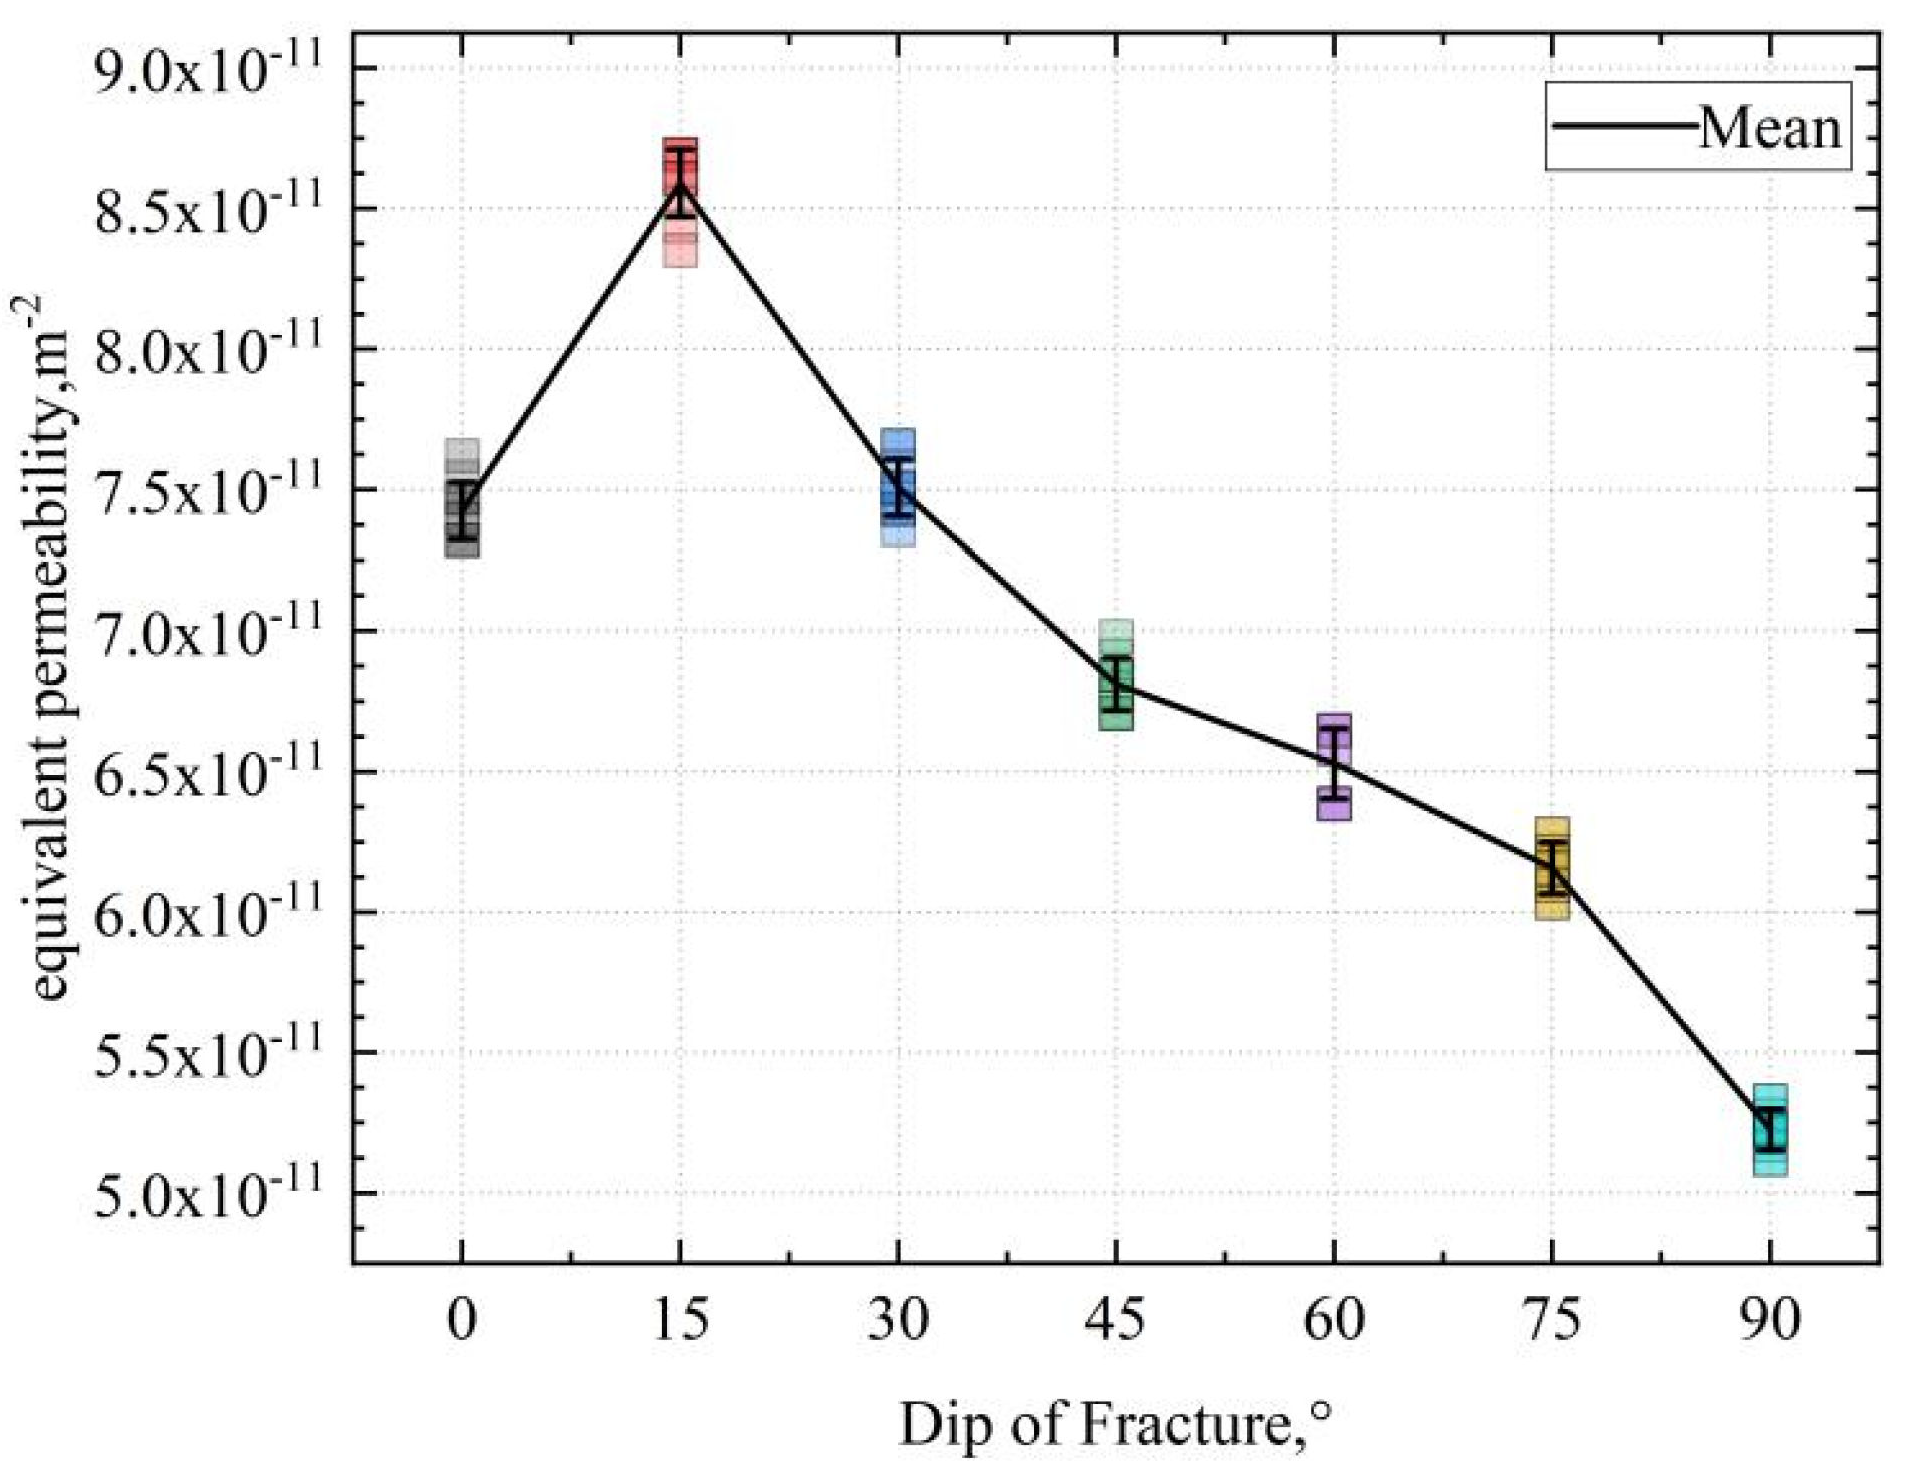
As the fracture dip angle changes from 0° to 90°, the groundwater flow in the matrix becomes more concentrated, and the distribution of low-speed areas and high-speed areas becomes more evident. The groundwater flow speed in the fracture decreases with an increase in the dip angle. The pore water pressure distribution map shows that the pressure distribution is two-tiered, and the area of rapid pressure change is more concentrated on the diagonal part of the vertical cross-section.
Figure 13 shows a scatter plot of equivalent permeability under different dip angles. In the range of 0–15°, the equivalent permeability increases with the increase in angle. In the range of 15–90°, the equivalent permeability decreases with the increase in angle.
When combining the Darcy velocity cross-section and pore water pressure cross-section under different fracture dispersion coefficients (
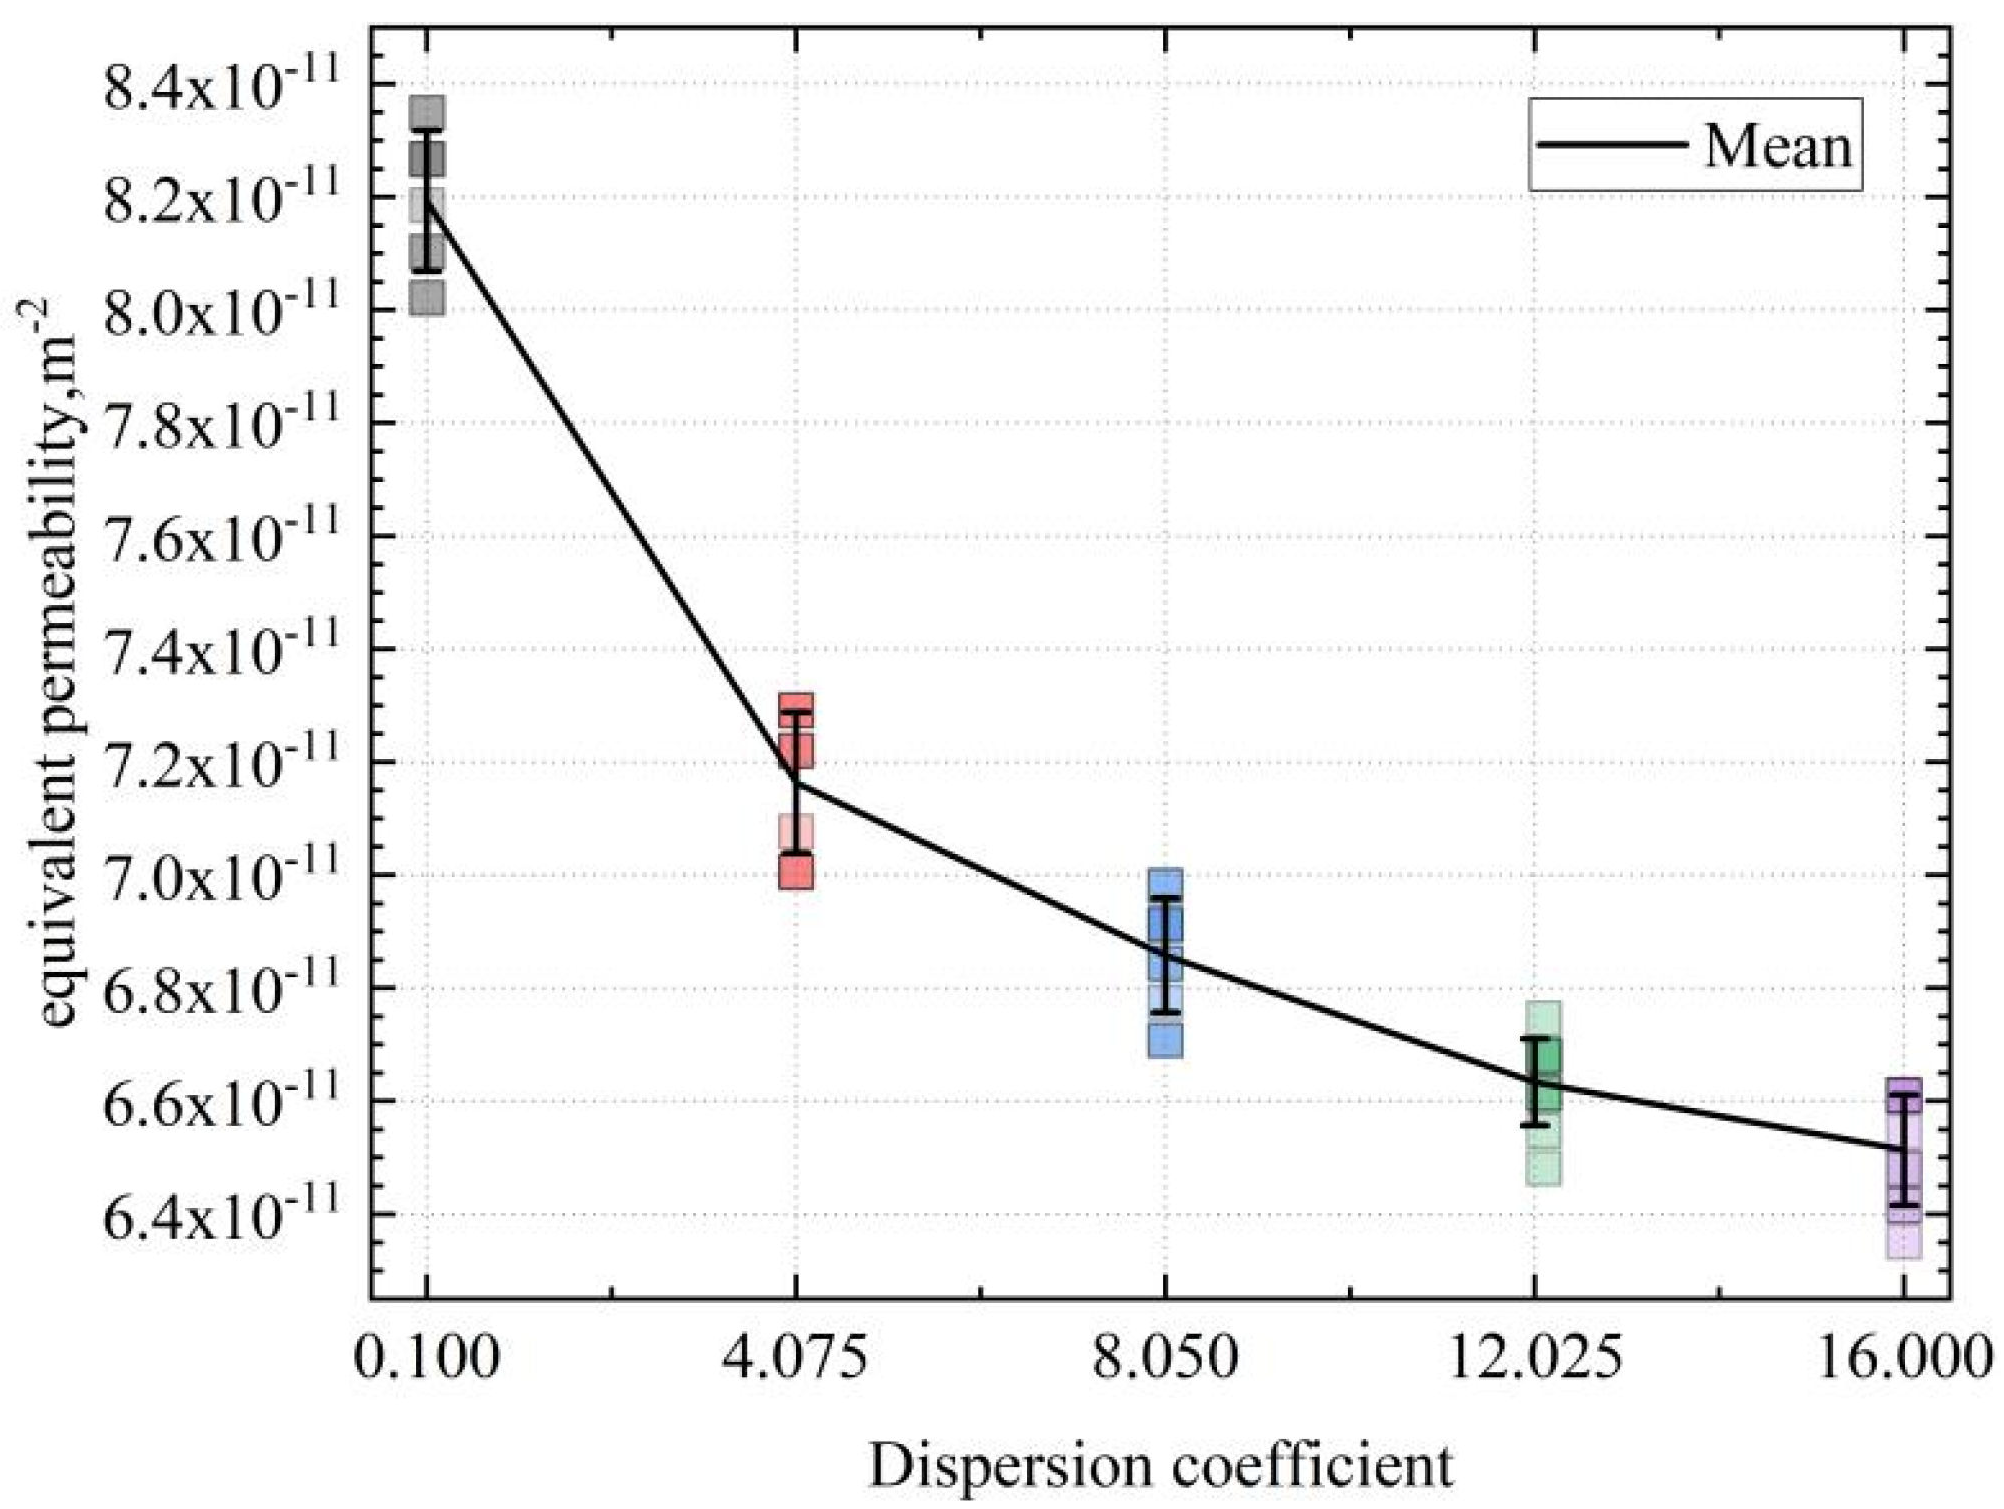
Figure S8), as the dispersion coefficient increases, the deviation of fracture direction and inclination decreases, the distribution of high-Darcy-velocity areas becomes more concentrated, and the groundwater flow speed in the matrix decreases overall. This indicates that as the dispersion coefficient increases and the deviation angle decreases, the fractures better construct network pathways in the pressure direction, making the groundwater flow more convenient. The pore pressure distribution map shows that the matrix pressure distribution is relatively uniform under low-dispersion-coefficient conditions, and with the increase in the dispersion coefficient, the pressure changes significantly at both ends of the fracture. This shows that the fracture acts as a channel to concentrate water in the matrix and transport it throughout the fracture network.
Figure 14 shows a scatter plot of equivalent permeability under different dispersion coefficients. As the dispersion coefficient increases, the equivalent permeability decreases. The reason for this is that the main axis direction chosen by the model is rather special. When the deviation angle of the fracture plane is large, the grid constituted by the fracture is more dispersed, which is conducive to seepage. When there is a smaller deviation angle, a large number of fractures cannot form a seepage network due to the main axis direction, causing a decrease in equivalent permeability.
4.2.4. Fracture Aperture
Based on different fracture aperture situations, the Darcy velocity cross-sectional map and pore water pressure cross-sectional map (
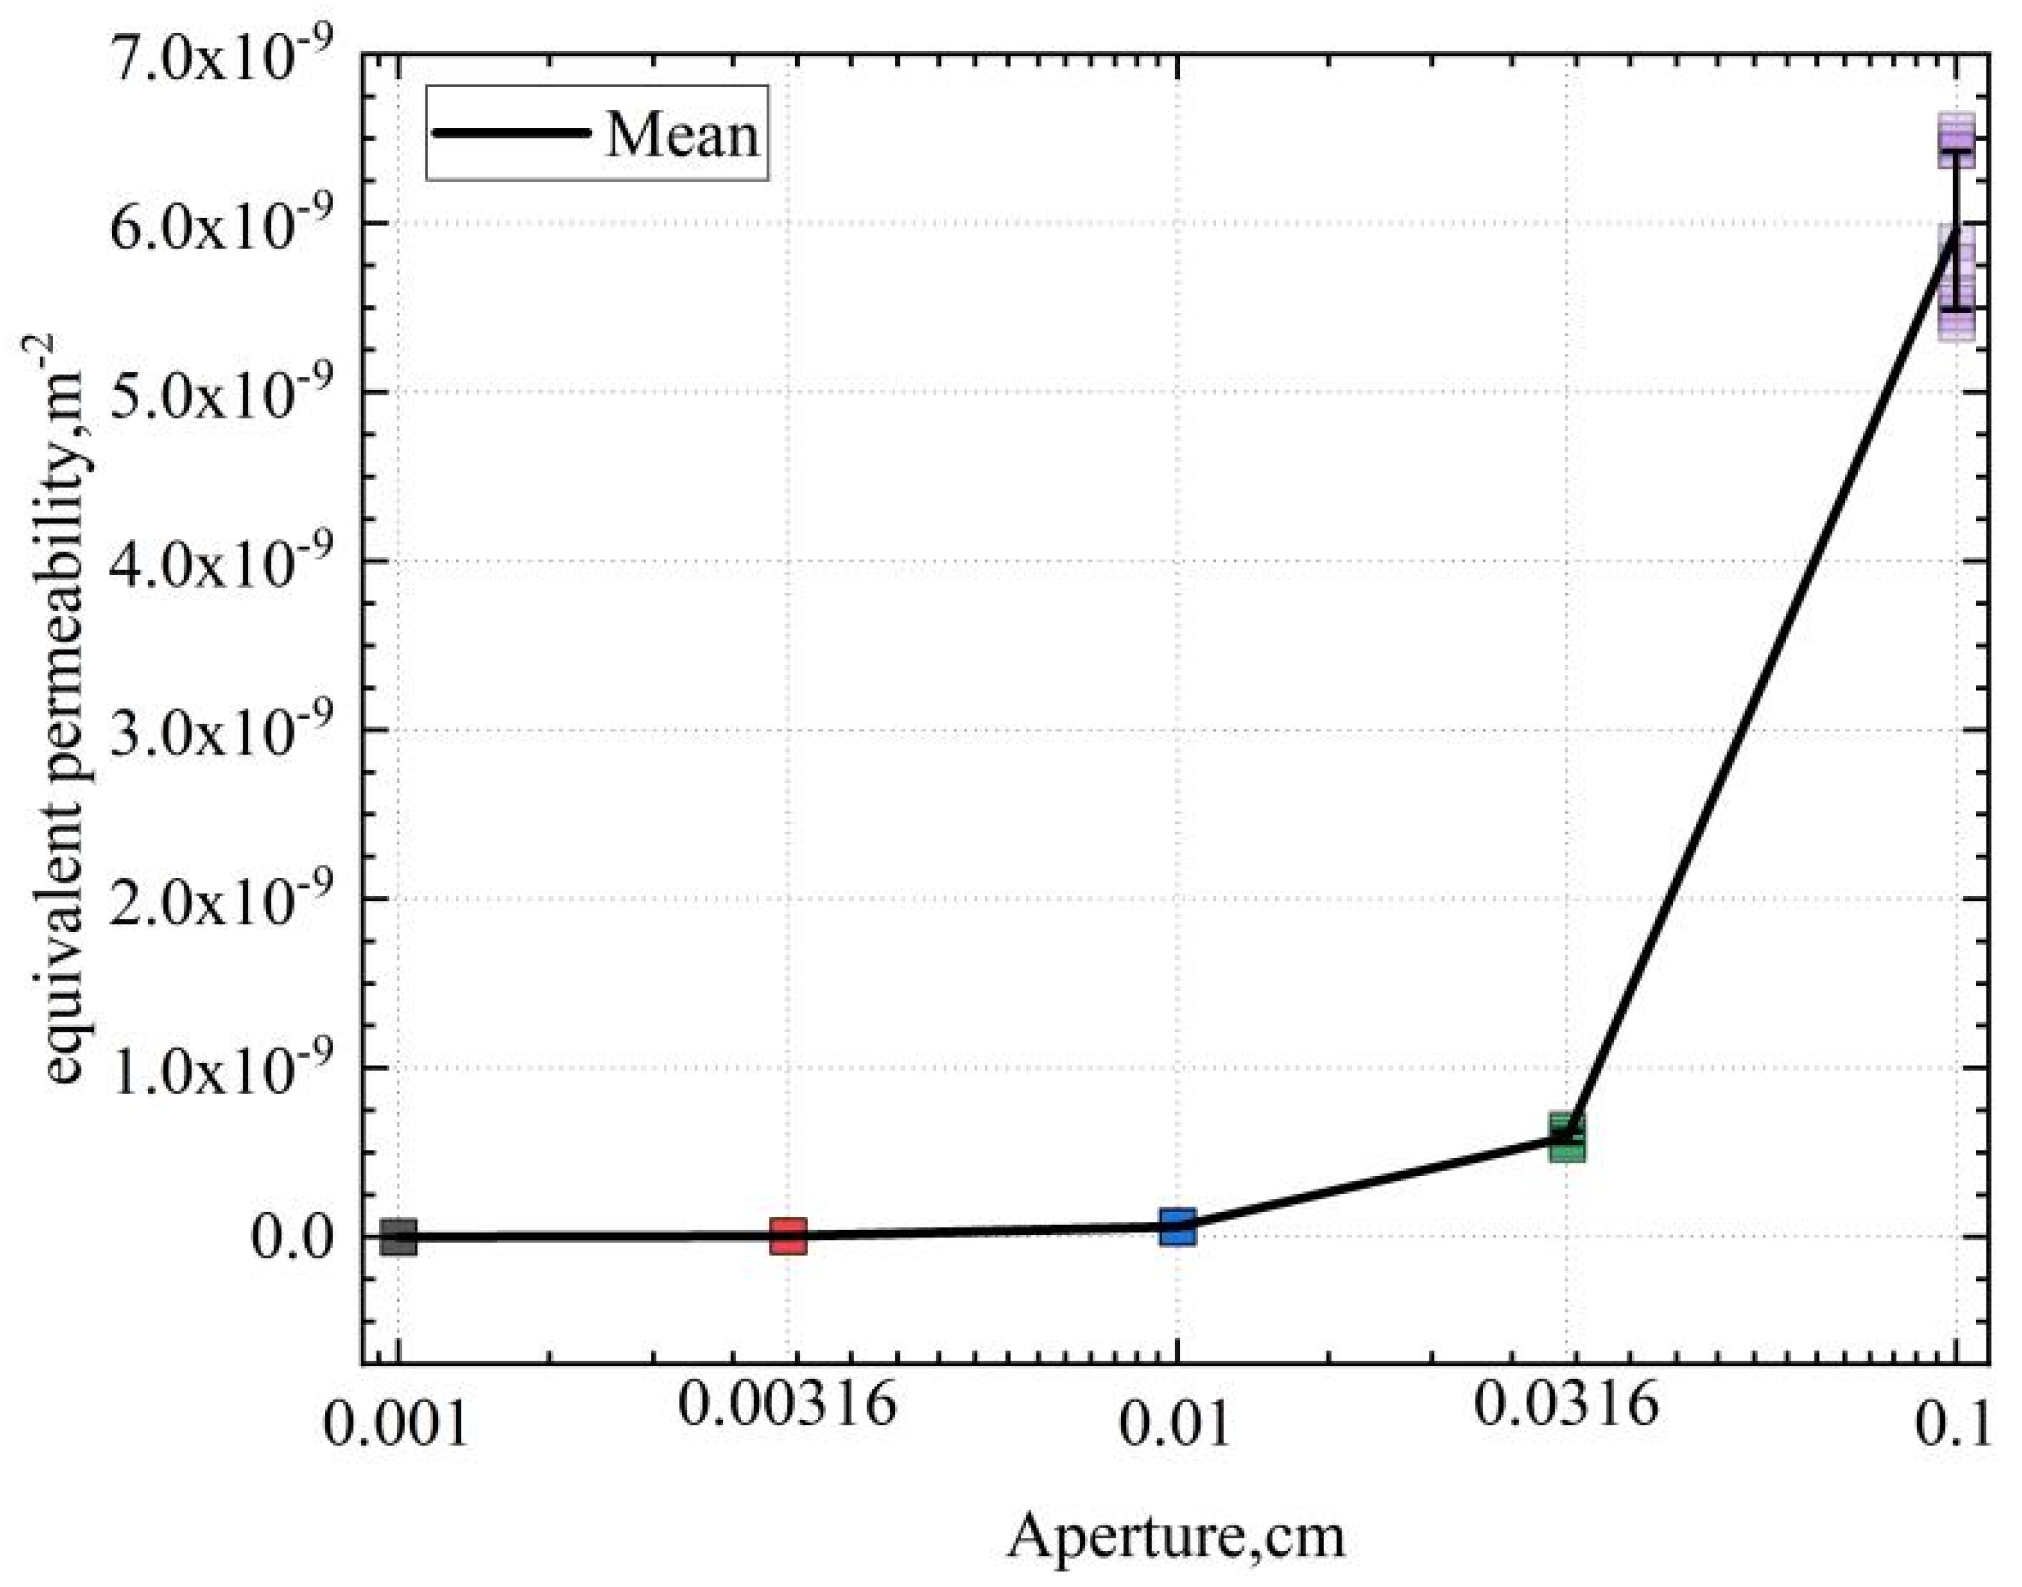
Figure S9) show that when the fracture aperture is relatively small, the Darcy velocity is evenly distributed in the model. As the fracture aperture increases, groundwater gradually shifts from primarily moving through the matrix to moving through the fractures. It can be seen that the speed of groundwater in the fractures increases, while the speed of groundwater moving through the matrix decreases. At the same time, the extreme variable area of Darcy’s speed at the end of the fracture increases. The changes depicted on the pore water pressure cross-sectional map show that as the fracture aperture increases, the area of the low-pressure zone expands, while that of the high-pressure zone decreases.
Figure 15 shows a dot-line graph of equivalent permeability at different apertures, which shows that the equivalent permeability significantly increases with the increase in fracture aperture.
When combined with the Darcy velocity cross-sectional map and pore water pressure cross-sectional map under different aperture ratio situations (
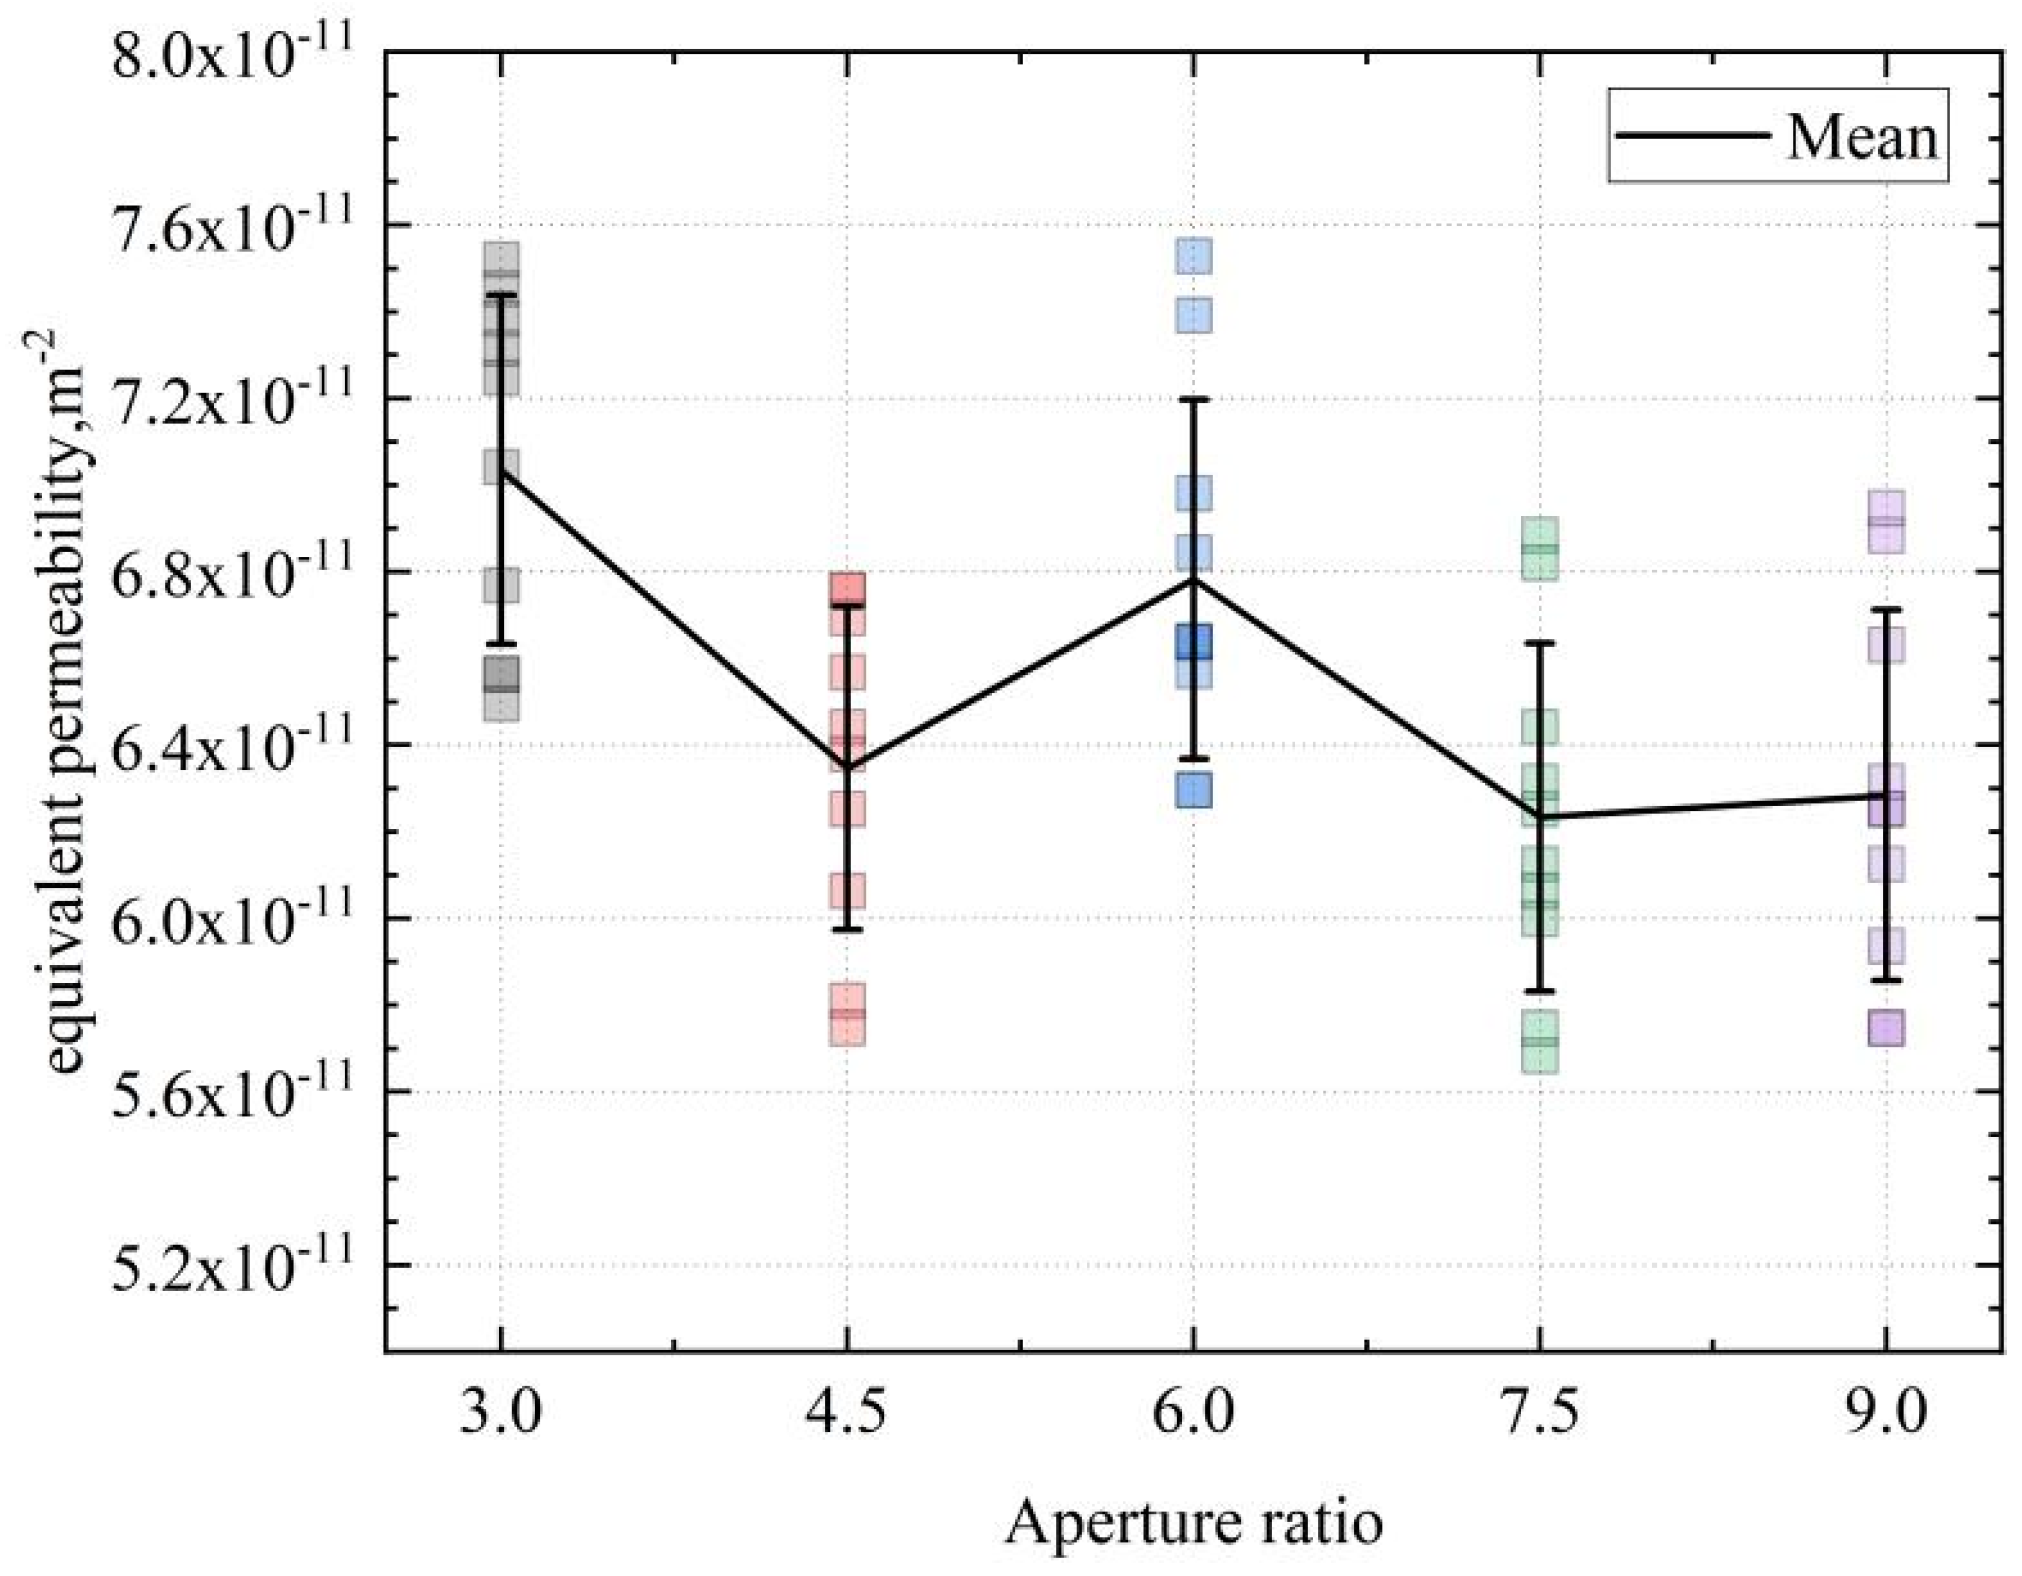
Figure S10), as the ratio increases, the overall aperture of the fracture increases, making the groundwater flow more smoothly in the fractures, and the seepage effect in the matrix decreases. This causes the Darcy velocity in some areas to decrease, but the seepage effect in the fracture increases. The change in pore water pressure is not very significant.
Figure 16 shows a dot–line graph of equivalent permeability at different aperture ratios. A change in the ratio causes a more fluctuating change in equivalent permeability. Overall, as the ratio increases, the equivalent permeability decreases somewhat.
When combining the Darcy velocity cross-sectional map and pore water pressure cross-sectional map under different fracture aperture power law situations (
Figure S11), when the aperture density value is relatively small, the area of the high-Darcy-speed region is larger. As the aperture power law increases, the area of the high-Darcy-speed region decreases, and the area of the low-Darcy-speed region increases. The change in pore water pressure means that as the aperture power law increases, the low-pressure zone decreases, and the overall pressure distribution of the model becomes more even. The effect of the fracture on the pressure distribution also decreases with the increase in aperture density.
Figure 17 shows a dot–line graph of equivalent permeability under different aperture power law index conditions. As the aperture power law increases, the equivalent permeability decreases somewhat.
In summary, factors such as matrix permeability, fracture aperture, fracture density, water pressure, fracture length, and fracture angle have a significant impact on the movement of groundwater in the geological medium and the distribution of pore water pressure. Changes in these factors lead to different distribution patterns of Darcy’s speed and pore water pressure.
5. CCD Analysis
The previous sections mentioned several significant parameters. In addition to the impact of each parameter on the model response, the interactions between these parameters may also have a significant impact on the model output. Therefore, this section focuses on a variance analysis of fracture parameters on the numerical value of equivalent permeability.
5.1. Model Variance Analysis
In experiment design and data analysis, variance analysis (ANOVA) is a commonly used statistical method for assessing the impact of one or more factors on the results. In this analysis, a quadratic model was used to analyze the impact of eight factors (A—length, B—length ratio, C—power law of length, D—strike angle, E—dip angle, F—dispersion coefficient, G—aperture size multiple, H—power law of aperture), as well as their interactions and quadratic terms, on the response variable K (
Table S1).
Firstly, the F-value of the overall model is 54.56, which is a relatively high value. The F-value is obtained by dividing the mean square of the model (Mean Square Model) by the mean square of the residuals (Mean Square Error), representing the variability of the model compared to the residuals. A larger F-value means that the model explains most of the variability in the data, rather than random noise. At the same time, the p-value of the model (3.015 × 10⁻²⁷) is much lower than 0.05, which is the threshold usually used to determine significance. The p-value represents the probability of obtaining the current observation result or a more extreme situation if the null hypothesis (here, the null hypothesis is that all factors have no impact on the response variable) holds. Therefore, a small p-value means that there is enough evidence to reject the null hypothesis and accept the alternative hypothesis (at least one factor has an impact on the response variable). These two results together indicate that the impact of this numerical model on the equivalent permeability is significant; that is, at least one factor has a significant impact on the response variable.
Next, the impacts of various factors, as well as their interactions and quadratic terms were considered. It was found that the p-values of A—length, B—length ratio, C— power law of length, D—strike angle, E—dip angle, F—dispersion coefficient, H—power law of aperture, some of their interactions (AB, BC, CE, CH, DE), and their quadratic terms (A2, B2, D2, E2, F2, H2) were all less than 0.05, indicating that these factors have a significant impact on the response variable. This result suggests that these factors are important in the model and have a significant impact on the response variable. However, it can be noted that some factors, such as G—aperture size multiple, its related interactions (AG, BG, CG, DG, EG, FG, GH), and its quadratic term (G2), had p-values greater than 0.05. This indicates that these factors do not have a significant impact on the response variable. This might mean that under the experimental conditions of this model, these factors have a smaller impact on the response variable, or their impact is masked by other factors. This provides valuable information for subsequent optimization design and process control: more attention may need to be paid to those significant factors, while reducing attention paid to the non-significant factors.
During variance analysis, attention should also be paid to residual analysis. Residuals are the differences between the actual observed values and the model-predicted values. If the model fits the data well, the residuals should be randomly distributed with no identifiable patterns. In this analysis, it was noted that the sum of squares of the model’s residuals and lack of fit were both relatively small, indicating that the model fits the data well with no obvious lack of fit.
This analysis was aimed at understanding the impacts of different factors and their interactions on a response variable and how the results should be interpreted. It was based on p-values, which measure the statistical significance of the factors. Factors with p-values of less than 0.05 were considered significant. The analysis also considered the residuals, which are the differences between the observed and predicted values. This indicates a good fit of the model to the data.
5.2. Prediction Equation of the Equivalent Permeability Coefficient
Through the application of optimal design methodologies, we scrutinized the correlation among the effective parameters, which included equivalent permeability, fracture density, fracture length, length power law, angle, dispersion coefficient, fracture opening, and opening power law. The selection of this model was predicated upon the highest order polynomial regression; within the model, supplementary components are significant, and the model is devoid of aliases. Based on the sum of squares for sequence models proposed by the software, a quadratic model was chosen for the inflow rate. When implementing regression analysis, the equivalent permeability was considered the respective function of fracture density, length, length power law, angle, dispersion coefficient, opening, and opening power law. Equation (1) illustrates the model, wherein variables adopt their encoded values, representing the square root of equivalent permeability: (i) fracture length (A), (ii) length ratio (B), (iii) power law of length (C), (iv) strike angle (D), (v) dip angel (E), (vi) dispersion coefficient (F), (vii) aperture size multiple (G), (viii) power law of aperture (H). Upon excluding insignificant parameters of equivalent permeability, the final empirical equation, taking into consideration the encoded factors, is as follows:
where
- -
A: Fracture length (unit: m)
- -
B: Length ratio
- -
C: Power law of length
- -
D: Strike angle (unit:°)
- -
E: Dip angle (unit:°)
- -
F: Dispersion coefficient
- -
G: Aperture size multiple
- -
H: Power law of aperture
- -
ρ: Fracture density (unit:/m3)
- -
d: Aperture (unit: mm)
The plus sign preceding the formula represents the synergistic effect on the inflow rate, while the minus sign delineates the antagonistic effect.
One may consider the coefficients of the parameters in Equation (1) to evaluate their influence on equivalent permeability. Eight coefficients are employed in the equation, among which four of the parameters have a direct impact: fracture density, length, angle, and opening. The parameters that have an indirect effect are the indices of length power law, angle dispersion coefficient, and opening power law. These indirect parameters cannot independently influence the equivalent permeability, but in conjunction with other direct parameters, they can affect equivalent permeability. Hence, the interactions among parameters and individual effects are equally vital factors.
Furthermore, Equation (1) elucidates the weighted factors of each parameter on equivalent permeability. Upon this foundation, fracture opening is the most significant weighted parameter, as its alterations markedly influence equivalent permeability. Due to the magnitude of the weight factors, marginally smaller than that of fracture opening, the variation in fracture density is the second most influential parameter. The remaining two, angle and length, are parameters that have a direct impact and also have significant impact on permeability.
5.3. Fit Statistics Analysis
Fit statistics are crucial in evaluating the quality of models used for analyzing a given dataset and their predictive capability (
Table S2).
The standard deviation (Std. Dev.) was 0.0706. This reflects the dispersion or spread of data points around the mean. A lower standard deviation indicates that data points are close to the mean, indicating high measurement accuracy.
The coefficient of variation (C.V. %) was 0.5854%. This represents the ratio of the standard deviation to the mean, which is commonly used to describe the relative variability of data. This ratio is particularly useful when changing data units or comparing data with different units.
The coefficient of determination (R2) was 0.9820. This is a statistical measure of the model’s predictive capability, representing the proportion of data variability explained by the model. An R2 value close to one indicates that the model can explain a significant portion of the data variability, thus demonstrating strong predictive ability.
The adjusted coefficient of determination (Adjusted R2) was 0.9640. This measure takes into account the number of independent variables in the model. When multiple predictor variables are present in the model, the adjusted R2 is a more reliable measure.
The predicted coefficient of determination (Predicted R2) was 0.9084. This is an indicator of the model’s ability to predict unknown data. The small difference between the predicted R2 and the adjusted R2—less than 0.2—suggests reasonable consistency between these two metrics. Adeq Precision measures the ratio of signal to noise. An ideal ratio of greater than four is desirable. The ratio for this model was 43.079, indicating sufficient signal. This model can be utilized for navigating the design space.
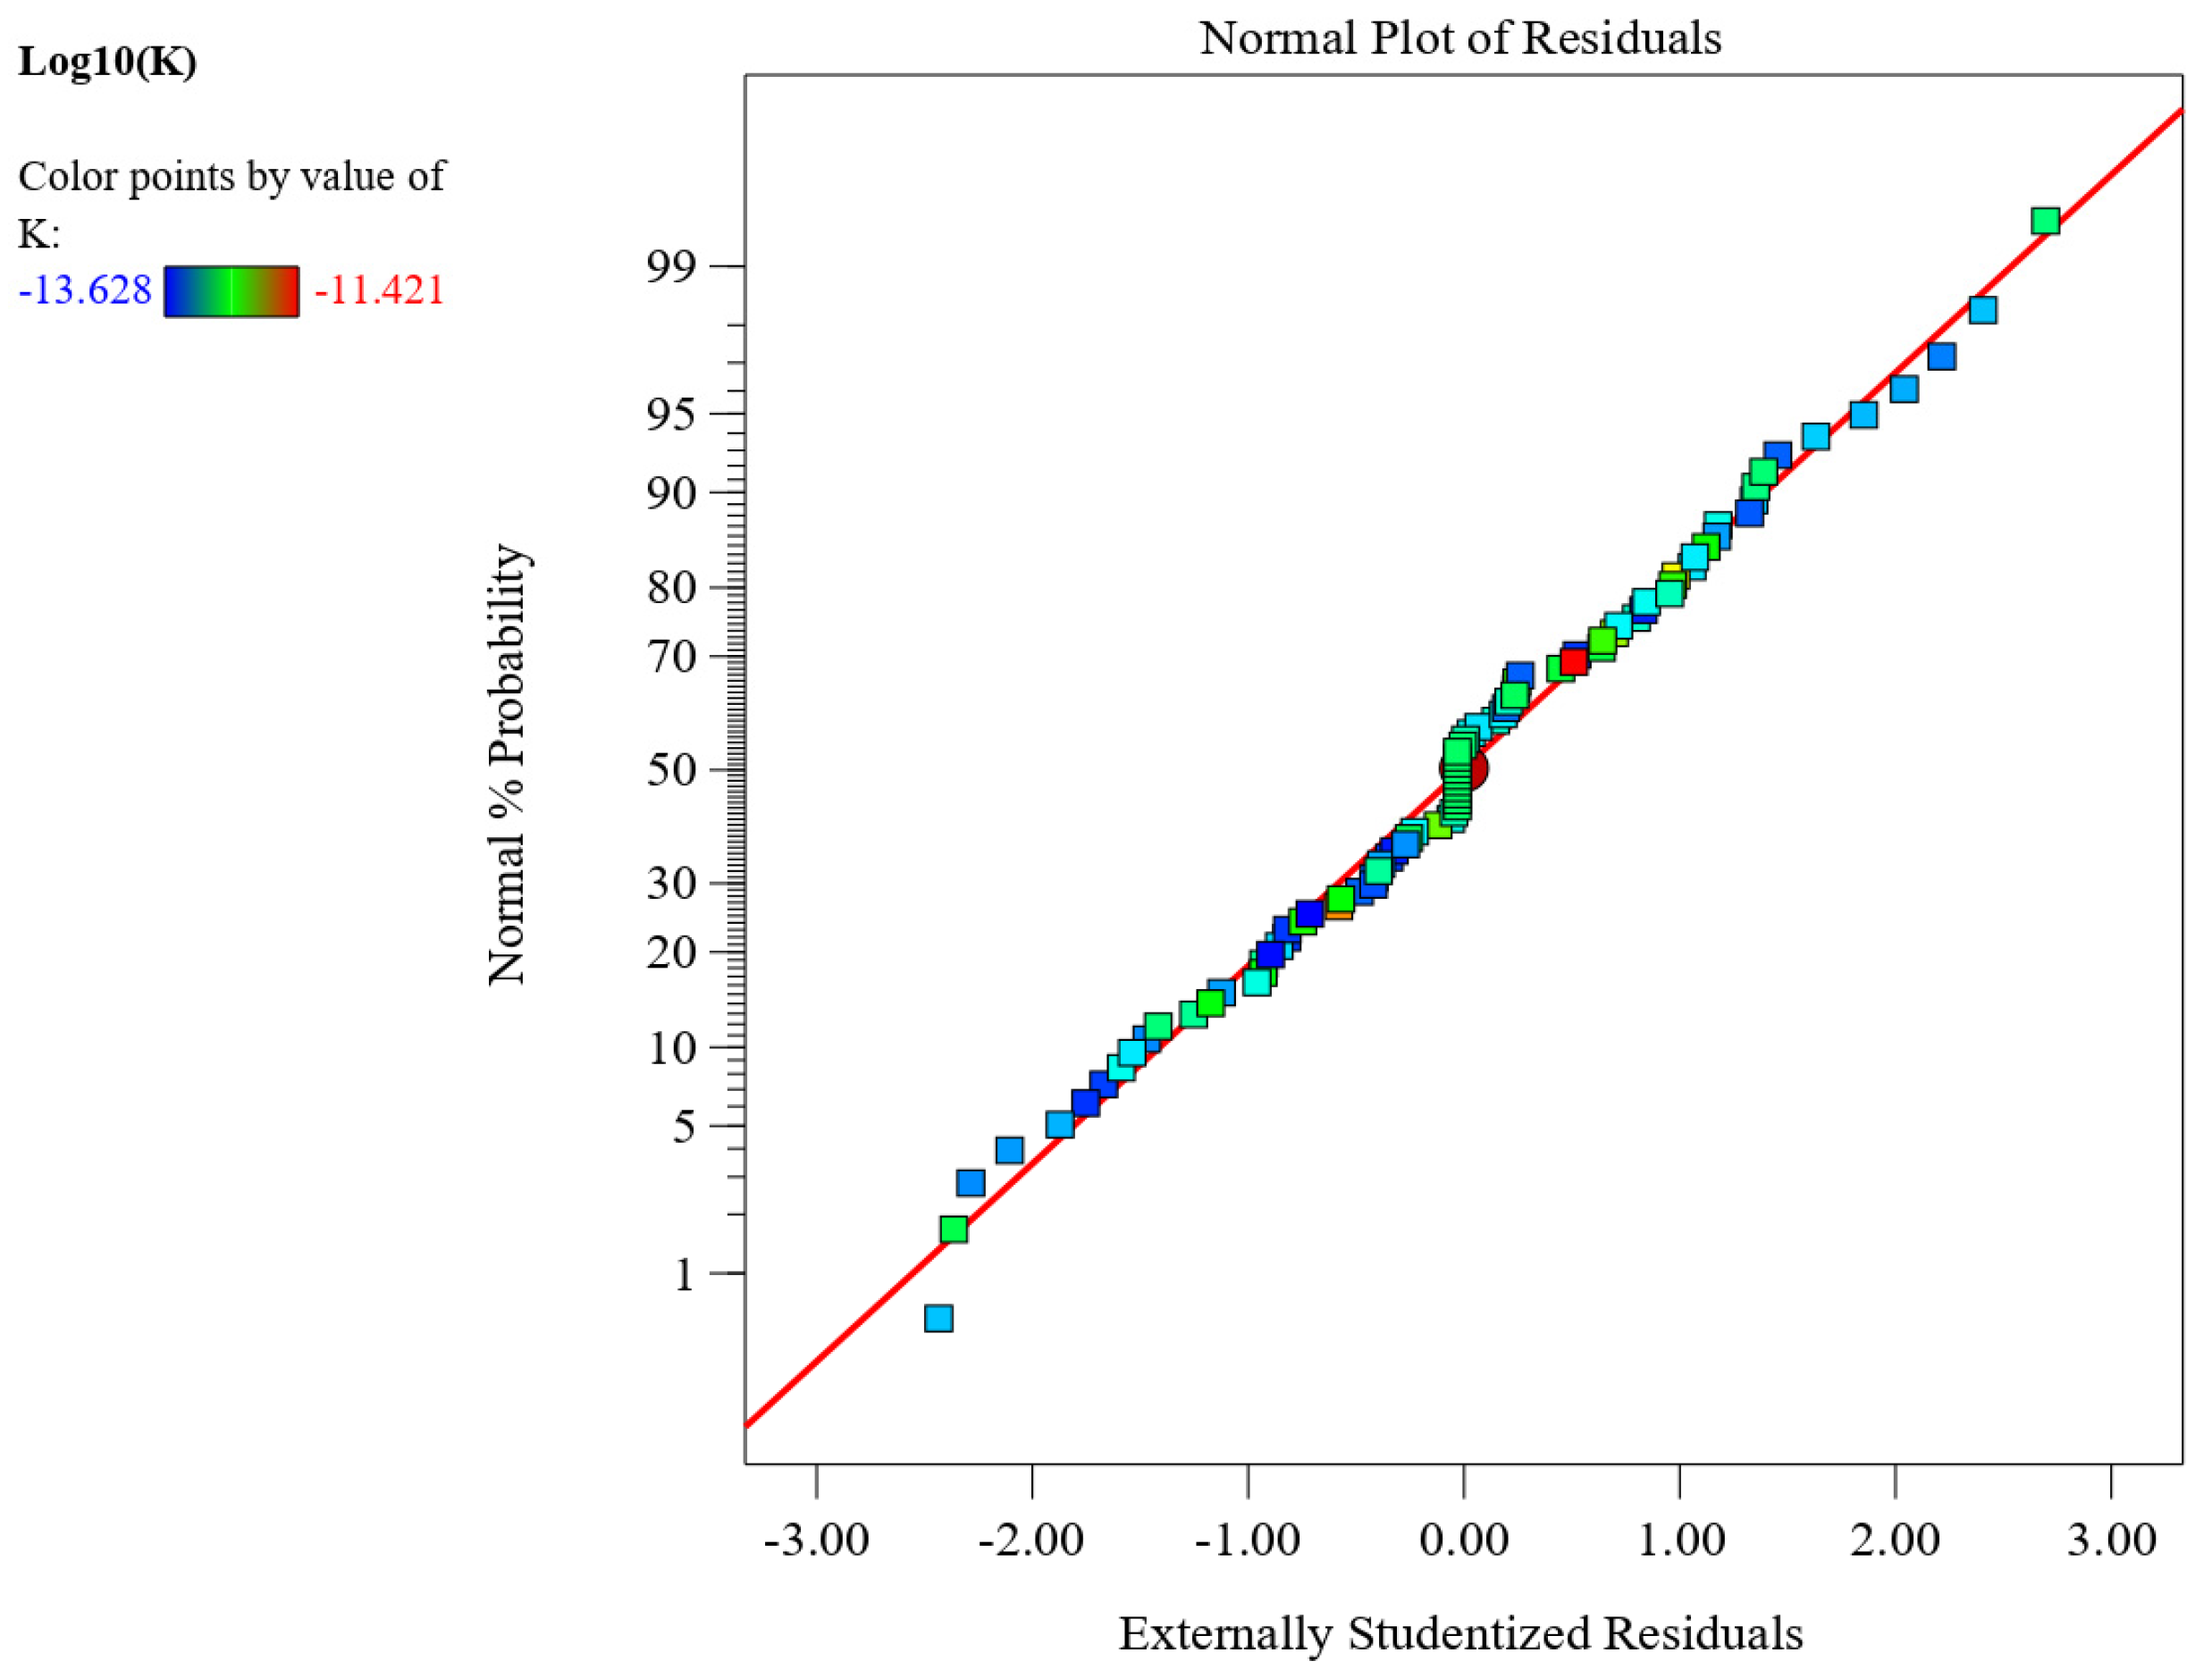
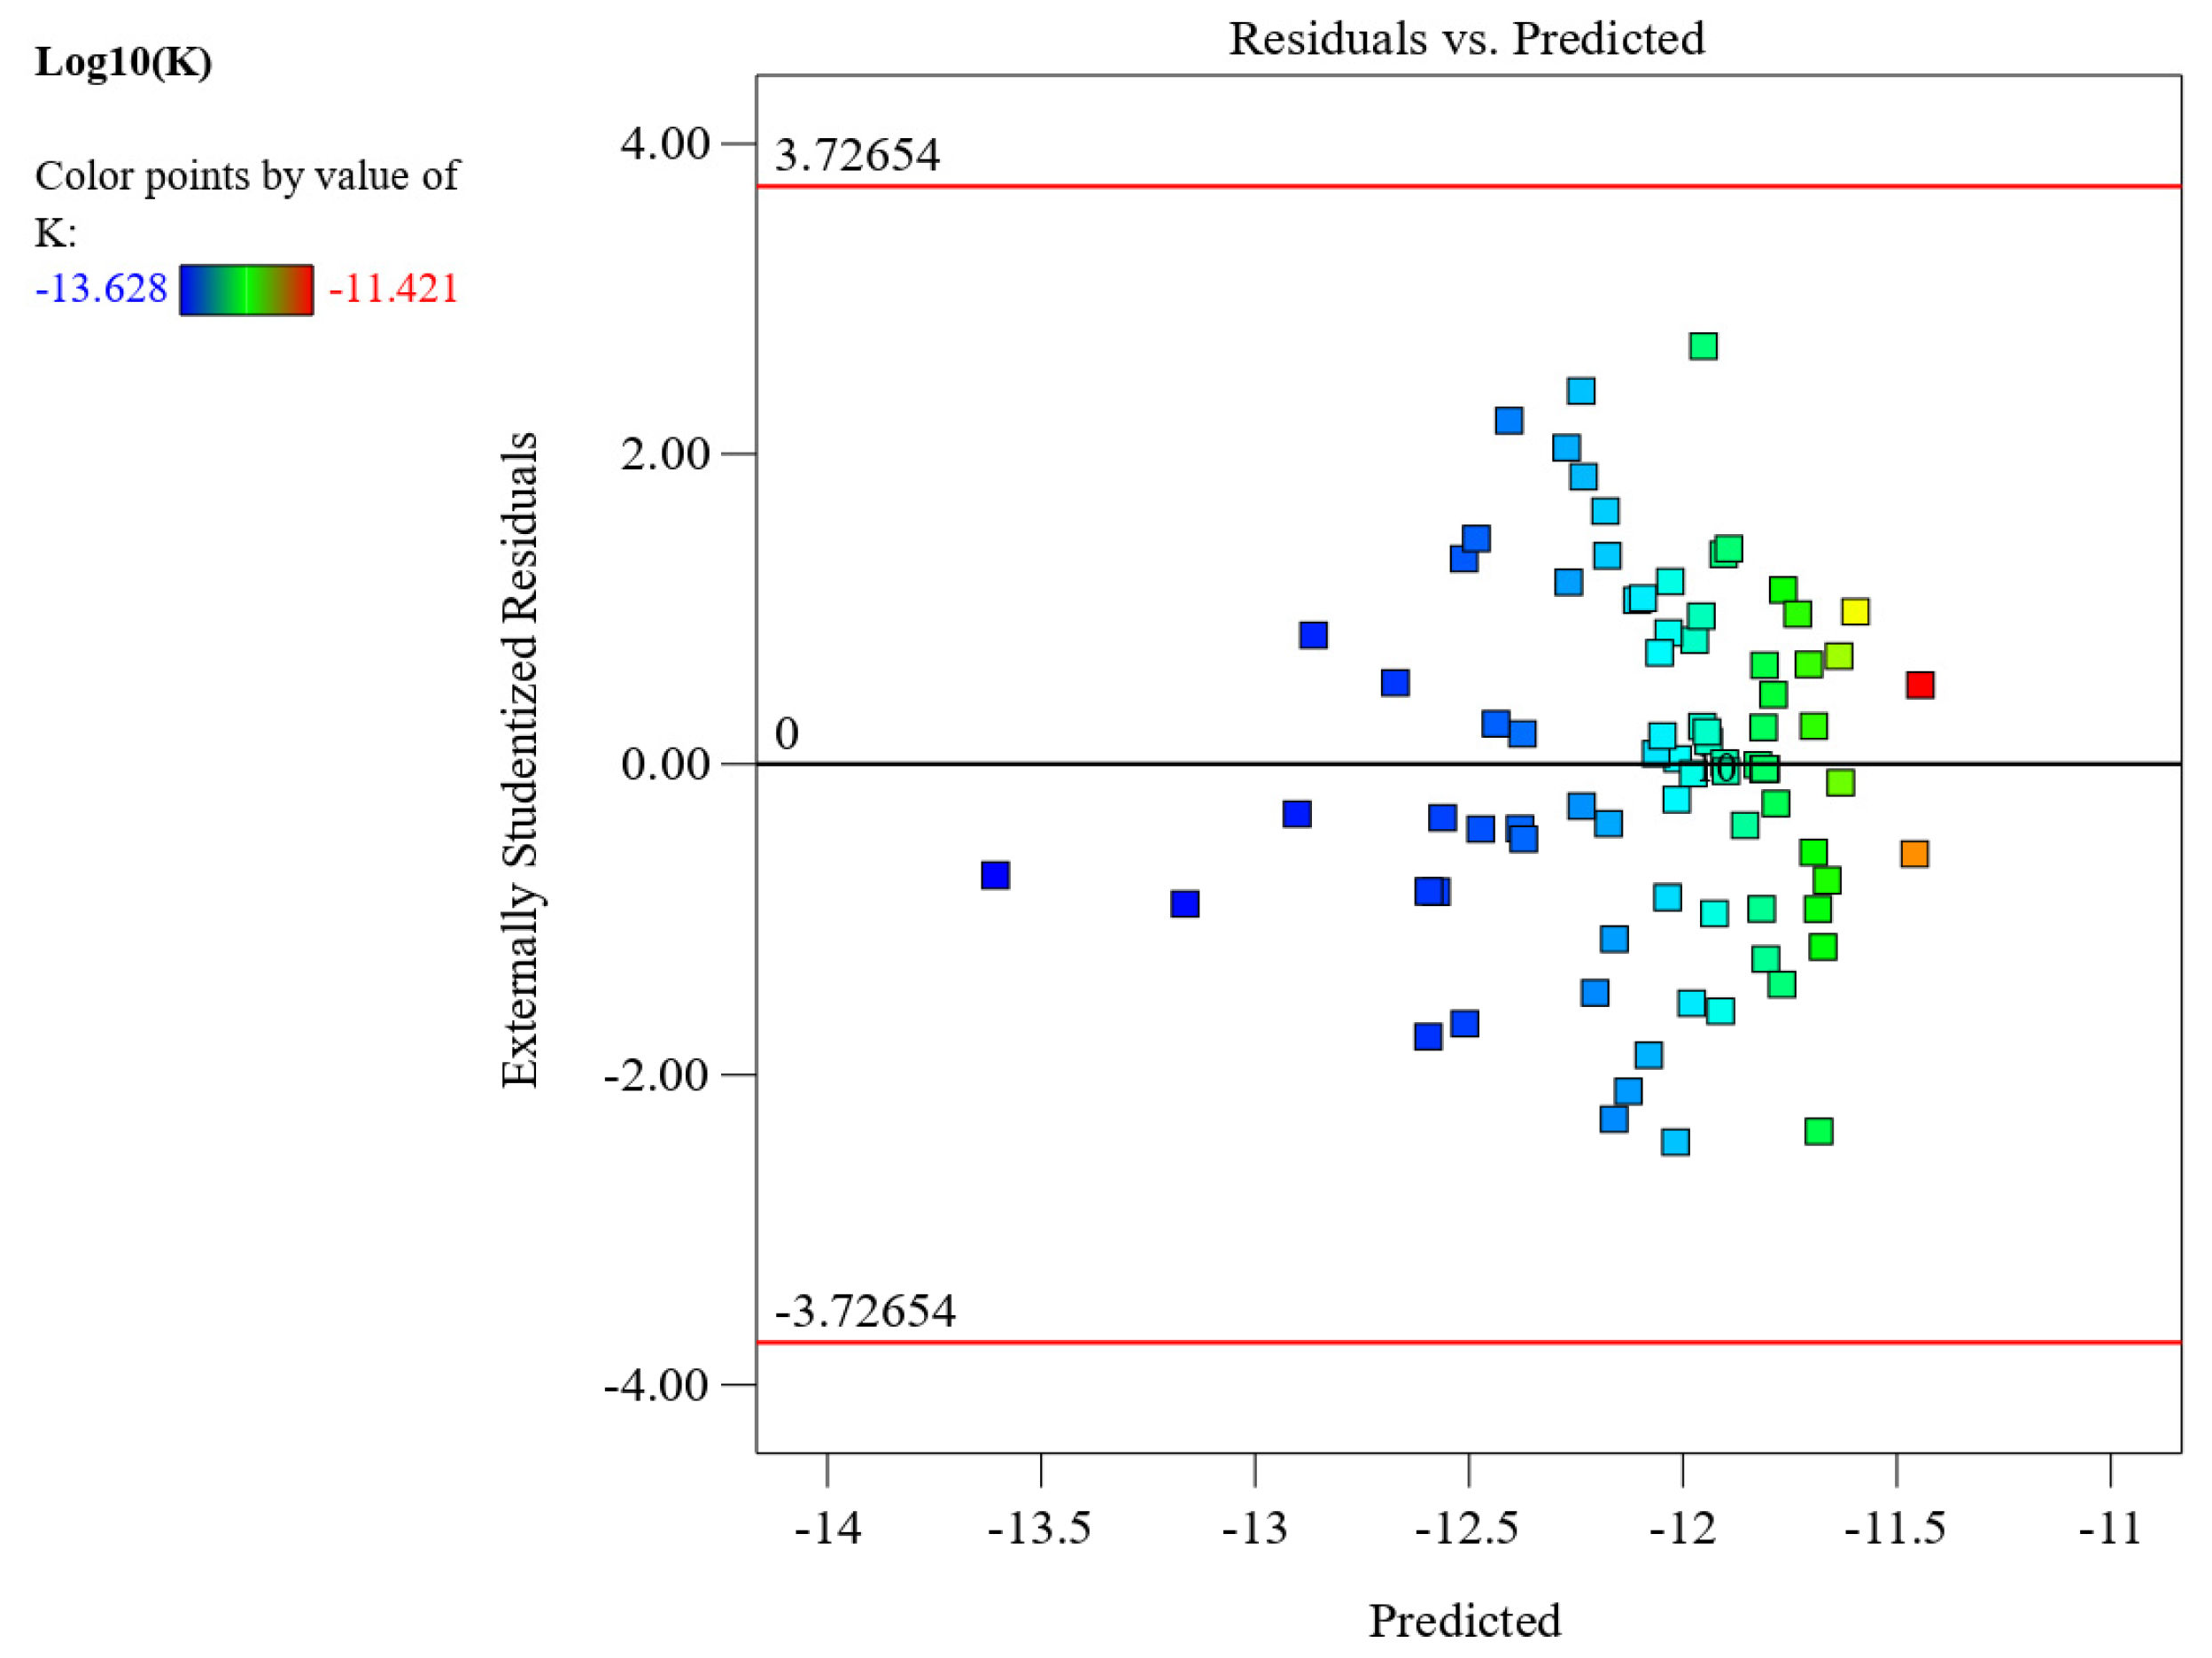
Figure 18 and
Figure 19 depict the statistical normality plot of residuals and the residual prediction comparison plot for the simulated results. The data distribution is predominantly concentrated within the predicted range, suggesting that the numerical simulation results fulfill the statistical criteria.
5.4. Validation of the Predictive Formula for Equivalent Permeability Coefficient
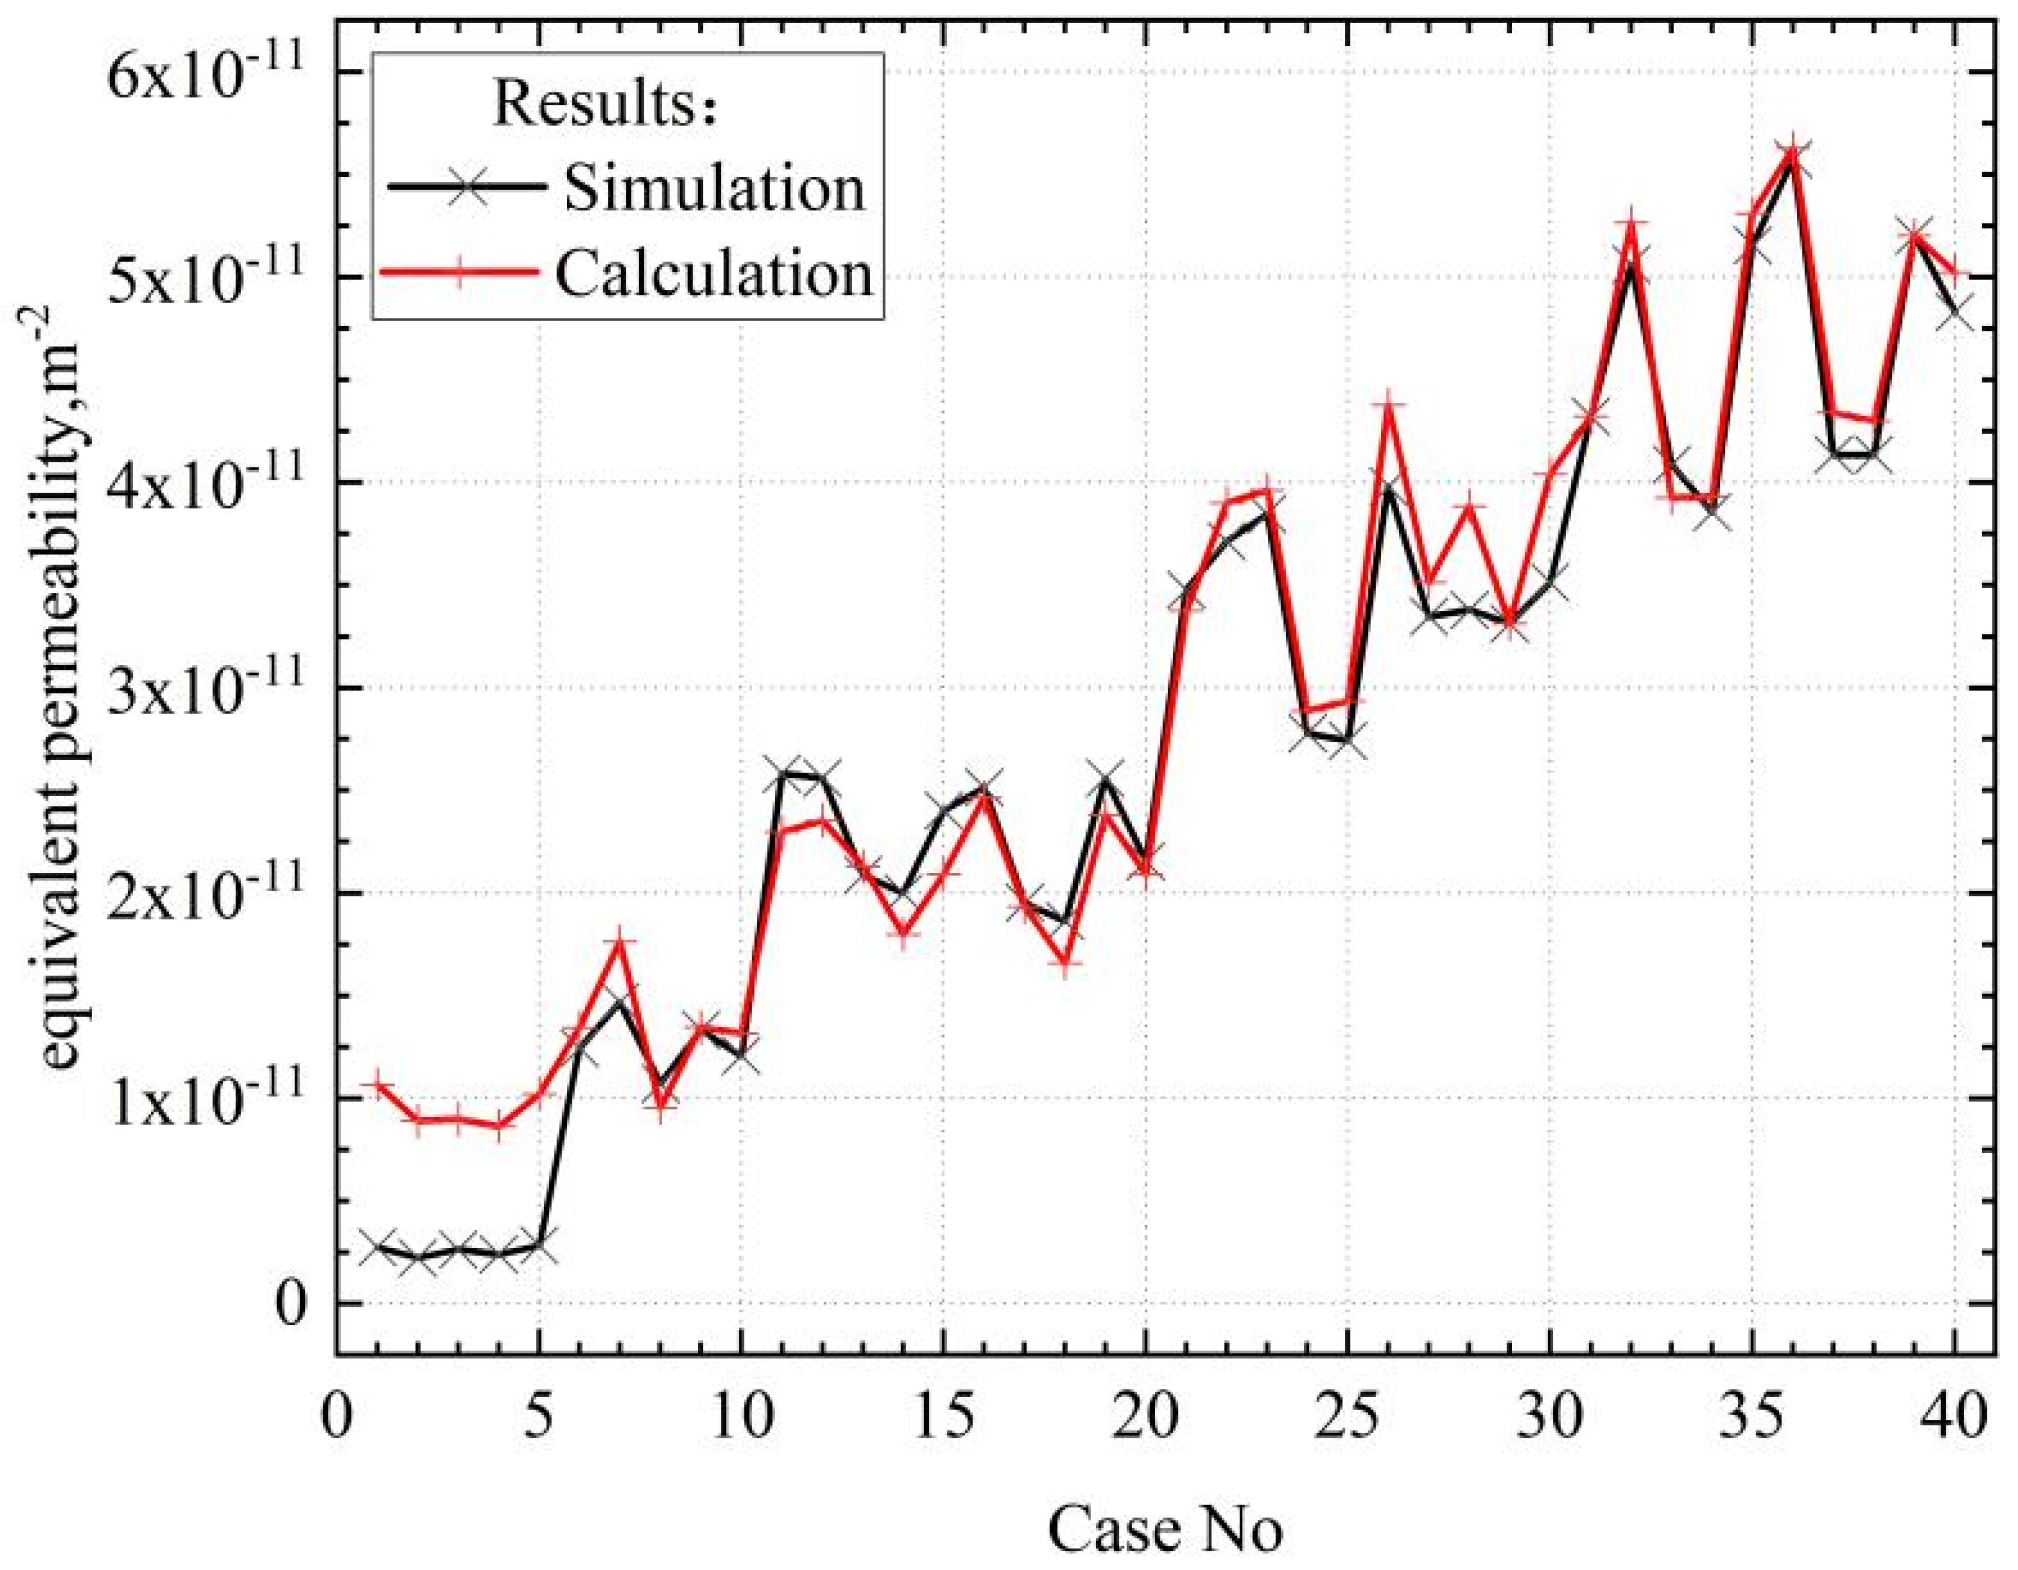
In order to ensure the accuracy of the theoretical formula derived in this study for practical applications, a series of experiments were conducted to validate the obtained formula. Firstly, a set of data was generated through random numerical simulations and used as a benchmark. Then, the obtained formula from this study was applied to calculate these data, and the results were compared with the numerical simulation results. By comparing the two, the accuracy of the formula can be evaluated. If the calculated results from the formula closely align with the numerical simulation results, it can be considered accurate. If there are significant differences between the two, further examination of the formula is required to identify potential sources of error and make necessary adjustments. This validation process is an important step in scientific research, ensuring the reliability and effectiveness of the formula derived from the theoretical model in practical applications.
Figure 20 represents the comparison of the calculated results and the numerical simulation results and indicates a high degree of fit between the two within the range of higher equivalent permeability. This not only demonstrates the accuracy of the formula but also indicates that the formula derived in this model can effectively predict and explain experimental phenomena. The high level of fit confirms the reliability of the formula and validates its utility in numerical simulation predictions.
Numerical modeling was used in this study due to its versatility in managing diverse conditions and parameters and its adaptability to complex structures and boundary conditions, especially when experimental setups are impractical. The goal was to establish a reliable theoretical framework for predicting fluid flow in rock bodies, acknowledging the importance of experimental validation.
The methods used in this simulation are supported by experimental designs from a multitude of papers and are rooted in the relevant literature and numerical calculations [
46,
47]. Many articles [
48,
49,
50] confirm the precision and feasibility of using COMSOL Multiphysics to predict seepage in fractured rock mass. The derived equation aligns well with COMSOL results, attesting to its accuracy and reliability. It is notably efficient in rapidly estimating rock bodies’ equivalent permeability from field fracture outcrops, ensuring accuracy.
This section investigates the equivalent permeability of discrete fractures and analyzes the magnitudes and mechanisms of the individual parameters’ influence on permeability. Based on the analysis of numerical simulation results, several conclusions can be drawn.
A theoretical numerical formula, namely the equivalent permeability of discrete fractures, is proposed. This equation was derived by analyzing the variations of each parameter.
This formula is useful for estimating the permeability of discrete fractures. Due to its ease of application and minimal required time and financial investment, it may be the preferred choice for practitioners in the field of geological engineering. The findings of this study can assist geological engineers involved in geotechnical and underground engineering in addressing flow rate issues.
6. Conclusions
In this study, a discrete fracture model was constructed using COMSOL 6.0, which accurately describes the fluid flow behavior within natural fractures and the mass transfer between the matrix and fractures. This model provides a basis for predicting and evaluating rock mass permeability. Through in-depth analysis of the numerical simulation results, the following key conclusions have been drawn:
- (1)
The equivalent permeability of rock mass is not only influenced by the morphology and properties of fractures but also correlated with the permeability of the matrix. When considering the influence of gravity, significant fluctuations in equivalent permeability are observed when the hydraulic gradient is below 10 MPa/m. However, when the hydraulic gradient exceeds 10 MPa/m, the equivalent permeability tends to stabilize. This finding suggests that when conducting three-dimensional numerical simulations of rock mass permeability, attention should be given to the impact of gravity on the results, especially under lower-pressure conditions.
- (2)
An increase in fracture density leads to a linear increase in rock mass permeability. Fractures parallel to the hydraulic direction contribute more to the flow and can significantly alter the permeability. In contrast, fractures perpendicular to the hydraulic direction, unless intersecting with other fractures to form a connected fracture network, have a negligible impact on permeability. Fracture length is positively correlated with rock mass permeability. When there are prominent, interconnected major fractures, the permeability significantly increases, while the flow within the surrounding porous regions decreases significantly. Fracture aperture has a significant influence on permeability. With an increase in fracture aperture, the permeability rapidly rises, enhancing flow from the matrix to the fractures, while the flow within the matrix significantly decreases.
- (3)
Factors such as fracture orientation, fracture length, and fracture aperture in a random fracture network also have noticeable effects on equivalent permeability, although their influence is relatively small compared to fracture aperture. Additionally, parameters such as the length power law index, the aperture power law index, and the dispersion coefficient significantly affect equivalent permeability. Among all the considered factors, the ratio of maximum to minimum aperture has little to no effect on equivalent permeability.
- (4)
A predictive formula for calculating the equivalent permeability of discrete fractures (Equation (10)) is proposed in this paper. The findings of this research may assist geological engineers involved in geotechnical and underground engineering in addressing the issue of equivalent permeability. Considering that this formula is based on assumed parameters, it can be adjusted and recalculated based on field data for practical engineering applications.
There are some remaining issues in this study:
This model primarily considers Darcy flow when accounting for fluid movement. Darcy’s law is a physical law describing the flow of groundwater in saturated soil or rock. However, there are times when real situations may not correspond with the descriptions provided by Darcy flow, such as in media with an exceptionally low permeability, or under unsaturated conditions, where fluid behavior might deviate from Darcy’s law. If the actual situation is one of non-Darcy flow, then this model becomes inapplicable. This limitation could impose restrictions on the application of the model, especially when dealing with fluid flow problems that do not adhere to the assumptions of Darcy flow.
Furthermore, the model introduces some assumptions and simplifications when dealing with fracture characteristics. The roughness of fractures and their infillings are not considered in this model. These factors could significantly affect the fluid flow properties of fractures in real situations. Additionally, the model presumes the porosity within fractures and determines the permeability of fractures based on the cubic law. These assumptions might overlook some critical details in actual engineering practices, such as the geometric properties of fracture surfaces and the impact of the infillings inside fractures.
The model also presumes that the aperture of a fracture is constant. However, in actual field conditions, the aperture may not be consistent at different locations within a single fracture. This assumption could lead to the model’s inability to accurately predict the fluid flow behavior in fractures with varying apertures.
Hydraulic coupling is a crucial factor in many groundwater flow and transport problems, but it is not considered in this model. Hydraulic coupling refers to the interaction between water flow and the mechanical properties of rocks; for instance, flowing water can alter the stress state of rocks, which can in turn influence water flow. Neglecting hydraulic coupling could lead to the model’s inability to accurately describe certain phenomena in actual engineering practices, such as groundwater flow under high pressure.
The model presumes that the permeability and porosity of the matrix are uniform. However, in actual engineering conditions, the permeability and porosity of the matrix at different locations might not be consistent. This assumption could lead to prediction biases in the model when predicting the fluid flow behavior in areas where the permeability and porosity of the matrix change significantly.
The research model, primarily applicable to shale, presupposes that water flow velocity in fractures follows Darcy’s law. Hence, application of this model requires groundwater flow conditions to comply with Darcy’s law. The model may not apply if groundwater behavior deviates from this law under certain geological conditions or in specific media.
The model also assumes known, uniformly distributed fractures in the rock body with parameters like aperture, direction, and connectivity, an idealized premise often inconsistent with complex real-world rock body fractures. Therefore, the application of the model necessitates result adjustments to be made based on actual geological conditions and fracture parameters.
The model’s outcomes, rooted in theoretical calculations and lacking in experimental validation, offer limited predictions about rock body permeability. This limitation and the necessity for experimental validation must be considered when using the model’s results for actual engineering design or decision making.
In conclusion, while this model provides a valuable tool for handling fluid flow problems, it also contains limitations and assumptions. These assumptions might not apply in certain specific application scenarios. Therefore, these limitations need to be considered when using this model, and appropriate adjustments or corrections should be made when necessary. For those problems that this model cannot handle, other models or methods might need to be sought after. Future research could consider improving this model so that it is able to deal with a wider range of problems and situations.


