1. Introduction
To meet the increasing demand of national oil energy strategic reserves, reservoir water injection is widely used to improve oil recovery in oilfields. However, the incompatibility between injected water and groundwater, the high mineralization of extracted water, and the drastic fluctuation of equipment operating parameters have led to an increasing phenomenon of pipeline fouling [
1,
2]. Therefore, scaling not only affects the normal production of oil fields and increases the safety risks of oil field production but also damages the economic benefits of oil field development.
Although the traditional descaling and anti-scaling methods have a certain effect on descaling and anti-scaling, they often “treat the symptoms rather than the root cause”, which needs to be further explored. Targeted analysis of scaling causes and anti-scaling measures is not only the need for efficient and stable operation of an oilfield water injection and gathering system but is also an important way to maintain normal production and improve the comprehensive benefits of oilfield development [
3]. In view of this, the group and an oilfield jointly proposed a new “change passive scaling into active scaling” descaling method, invented and designed a fixed-point descaling device for pipe networks based on the principle of a shallow pool, and developed a collection and aggregation device applicable to a CaCO
3 scale type oilfield [
4,
5]. This technology has changed the conventional anti-scaling and descaling ideas, artificially designed the scaling environment of simulated fluid, realized the fixed-point aggregation and rapid descaling of fluid in a specific device, and ensured that the scaling of subsequent process pipelines was minimized or even not scaled [
6,
7].
However, scale formation is a complex and dynamic process, and the mechanism of crystal growth is mainly surface heterogeneous nucleation and homogeneous precipitation in solution. The study of crystal growth mainly focuses on the surface properties of materials. Some scholars have found that the adsorption of sediments depends on surface free energy. Zhang Zhongbi [
8,
9] studied the relationship between CaCO
3 fouling growth and material surface properties through experiments. The results show that the increase in material surface energy can directly affect the increase in the material surface scaling amount, and low surface energy has a certain scale inhibition performance. Czetler [
10] found that the scaling behavior of metals and polymers can be affected by changing the energy properties of the heat transfer surface. The experimental results show that the reduction in the surface energy of the material will lead to the reduction in the scale inhibition performance and the enhancement of the scale inhibition performance. Wan Zhihao [
11] studied the surface coating of the enhanced tube and found that, for the enhanced tube with lower surface energy, it is more difficult for the pollutants in the fluid to adhere to the heat transfer surface after contact with the heat transfer surface. In addition, the surface energy is positively correlated with the progressive anti-fouling ability of the coated tube [
12].
At the same time, the roughness of the material has a certain relationship with the growth of dirt on the surface of the material. Kong Xiangbing [
13] studied the growth characteristics of particle fouling in heat exchanger tubes by establishing a platform for fouling growth characteristics in tubes. It is found that the greater the surface roughness, the faster the ash deposition rate. Keyasar [
14] investigated the relationship between heat transfer surface properties and the nucleation rate of fouling crystals. It was found that the adhesion strength of crystals to the heat transfer tube surface increased as the roughness of the heat transfer tube surface increased. This led to the formation of fine fouling crystals on the heat transfer tube surface. Bansal et al. [
15] showed that materials with rough surfaces can provide more fouling nucleation sites than materials with smooth surfaces. New nucleation sites can be formed through the fouling layer and the fouling is enhanced.
Keogh et al. [
16] experimentally studied the surface properties of different materials, and it was found that the surface wettability is related to the material. The smaller the contact angle, the stronger the wettability and the lower the growth energy of the nucleation layer. Yamanaka et al. [
17] studied the growth behavior of calcium carbonate crystals on different substrates using atomic force microscopy. They found that the smaller the contact angle of the droplets, the more hydrophilic the material is and the more pronounced the heterogeneous nucleation on the material surface is. Andreas et al. [
18] found that in the presence of an oil–water interface, fractional wettability leads to the formation of a shell composed of small calcite crystals around the hydrophobic spheres, while larger crystals are formed on the hydrophilic spheres.
Scholars have carried out relevant research studies on the influence of material types on the growth of fouling. However, the optimization of the flow unit material of the aggregation fouling device is limited to the qualitative analysis of metal materials and the influence of metal material types on the fouling laws. The influence mechanism of non-metallic materials and surface physical properties on crystallization fouling is still unclear. There are few studies on non-metallic materials to promote fouling in agglomeration devices. Therefore, based on the preliminary research of the project, this paper intends to systematically carry out dynamic simulation shear experiments of different non-metallic materials and study the growth law of crystal fouling on the surface of different materials from the macro-scale. Secondly, based on the surface wettability, surface free energy, and surface roughness of different materials, SEM is used to further study the fouling pattern and reveal the intrinsic mechanism of the material type affecting the growth of precipitated fouling. Finally, the law of the influence of the physical properties of the material surface on the friction factor of the material is investigated based on the experimental platform of the indoor loop channel. The research of this paper provides some theoretical basis and technical support for further optimization of the scale reduction stacking device.
3. Results and Discussion
3.1. Effect of Non-Metallic Material Type on CaCO3 Crystallization Fouling Growth
Under the same experimental conditions (stirring speed 150 r/min, water temperature 25 °C), eight kinds of non-metallic hanging pieces were suspended in the middle of the solution, and the volume of each solution was 500 mL. After 6 h, 12 h, 18 h, 24 h, 30 h, and 36 h dynamic simulation shear experiments, the influence of different material types on the amount of fouling was different. Based on the weighing method, the amount of fouling was measured. The variation of the amount of fouling per unit area of the material with time is shown in
Figure 4.
The following can be seen from the above figure: (1) With the extension of reaction time, the order of the scaling amount per unit area of non-metallic materials was FRP > PVC > PP > PC > HDPE > PET > PEEK > PTFE. (2) When the reaction times were 6 h, 12 h, and 18 h, the amount of FRP fouling increased first and then decreased, and the amount of PVC and PP fouling decreased first and then increased. (3) After the reaction time was more than 18 h, the difference in the fouling amount of each material increased gradually, and especially the FRP material had a greater tendency to form scale and higher fouling than other materials. (4) Compared with other materials, PTFE and PEEK had lower scaling increments and certain anti-scaling performance.
Domestic and foreign scholars have shown that the first stage of the scaling reaction is the scaling induction period; this stage of scaling often has slow growth until after the induction period, were there will be a substantial increase in the scaling phenomenon [
21]. Based on this and
Figure 4, the following is concluded: (1) The fouling amount of FRP, PVC, PP, PC, and PET is small at the beginning of the reaction, and the increase in the fouling amount per unit area of the material increases obviously after 18 h, so it can be judged that the fouling induction period of these materials is about 18 h. (2) PEEK and PTFE, two materials after FRP, PVC, PP, PC, and PET, increased significantly in the 18 h period compared to a certain increase before, so the induction period is judged to be about 18 h. (3) The amount of HDPE fouling increased significantly after 24 h, so the induction period is about 24 h.
In summary, after the scaling reaction under the same experimental conditions, it can be found that there are some certain differences in the amount of scaling on the surface of eight kinds of materials, and the amount of scaling of each material does not increase with the reaction time. Among them, the amount of FRP fouling increased first and then decreased during the induction period, and the amount of PVC and PP fouling decreased first and then increased during the induction period. The fouling induction period of each material is different, and some materials have no obvious increase in the amount of fouling even through the induction period. These phenomena indicate that the material type has a significant effect on the growth of CaCO3 crystallization fouling.
3.2. Effect of Surface Physical Properties of Non-Metallic Materials on the Growth of Crystallization Fouling
3.2.1. Surface Wettability of Materials
Contact angle is an important characterization of surface wettability. The wettability of mineralized water on the surface of the material is closely related to the growth of fouling crystals. In view of this, this paper reveals the influence of wettability on the growth mechanism of crystallization fouling by analyzing the surface contact angle of different materials and the amount of fouling per unit area after a 36 h reaction time and its relationship with crystal morphology and grain distribution. The contact angle of mineralized water on the surface of each material was obtained with an SDC-100 contact angle measuring instrument. The experimental results are shown in
Figure 5.
From
Figure 5, it can be found that when the contact angle of mineralized water on the surface of materials was in the interval of 78~93°, the scaling amount per unit area of all materials except PEEK materials decreased with the increase in the contact angle. This is due to the following: (1) In this interval, as the contact angle increased, the material surface was more hydrophobic, and foulants’ adhesion capacity on the surface weakened; meanwhile, the corrosion rate of the fluid on the formed crystal evolution foulants rose, which was not conducive to the growth of foulants. (2) Due to the increase in the indirect contact angle in this area, the surface wettability becomes worse, and the contact resistance between dirt and surface increases, the nucleation potential of dirt crystallization increases, and the nucleation rate becomes lower [
22], thus affecting the fouling amount. (3) The unit area of the surface of the FRP test piece was significantly larger than that of other materials, and its surface had polar functional groups such as hydroxyl and carboxyl groups, which had a certain degree of chemical binding with calcium carbonate [
23], which is conducive to scaling. (4) The hydrophilic surface grain distribution is dense and can be connected into sheets and the surface will form “crystal flowers” (see
Figure 5), resulting in an increased dirt mass.
For PEEK material, although its wettability is slightly better than that of PET material, the scaling amount per unit area is much lower than that of PET. Thus, it cannot simply explain the scale formation characteristics of the material surface by wettability, and it is necessary to further explain the influence of other surface properties on the crystal growth mechanism.
3.2.2. Surface Free Energy of Materials
The surface free energy of each material and its fouling amount for a 36 h reaction are summarized in
Figure 6.
From
Figure 6, it can be seen that, except for the two materials of PET and PEEK, there is a very obvious relationship between the free energy of the surface of the material and the amount of fouling per unit area: the higher the surface free energy of the material, the greater the amount of fouling on the surface [
24]. The reasons for this phenomenon are as follows. (1) The larger the surface energy of the material, the stronger the adhesion between the CaCO
3 crystal scale and the surface and the lower the probability of being peeled off by external forces. (2) The different surface energies of different materials lead to their different catalytic abilities for the formation of ionic bonds in the reaction between Ca
2+ and CO
32− [
25]. Therefore, the surface of materials with high surface energy is more favorable for the formation of ionic bonds between calcium ions and carbonate ions [
26]. (3) The surface of the test piece with higher surface free energy has higher energy [
27], which is more suitable for the growth of new phases and is easier to nucleate. Therefore, the higher the surface energy, the more conducive the material is to the increase in scaling. (4) High surface energy materials have high attraction to free crystals [
28], and thus scaling factors adhere more easily to high surface energy surfaces.
For the two materials of PET and PEEK, although their surface energy is higher than that of PP, PC, and HDPE, the amount of fouling per unit area is much lower than these three materials. On the one hand, the reason is that the surface of PET and PEEK has high adsorption due to high surface energy, which makes the surface form many “crystal bracts”, while the crystal bracts do not grow “mature”, and the crystals are not full and small in size, resulting in low scaling. On the other hand, due to the influence of wettability (see
Figure 5), the increase in contact resistance between the material surface and the formed crystal scale under shear force is not conducive to scaling. Therefore, the determination of the fouling characteristics of the material surface is still limited to only wettability and surface free energy. The roughness of the material may also affect the fouling behavior, and the effect of roughness on the crystal growth mechanism needs to be further elaborated.
3.2.3. Surface Roughness of Materials
The roughness reflects the irregularity of the peaks and troughs of the surface texture at the micro-scale [
29]. In order to explore the influence of roughness on the scaling amount of the material surface, the surface roughness of each material after being sanded by the same sandpaper was measured with a TR200 roughness tester. The scaling amount and roughness law of each material surface after a 36 h reaction are summarized as shown in
Figure 7.
As can be seen from
Figure 7, the amount of fouling per unit area increases with the increase in roughness for all materials except PTFE. This is because of the following: (1) With the increase in surface roughness, the contact area between the fouling and surface also increases. (2) Strong mechanical interlocking is formed between the fouling crystal nucleus and the interface with relatively large roughness, so that the fouling needs greater peeling force when it falls off the rough surface. (3) A large increase in roughness means more nucleation sites [
30], and the nuclei are more likely to land when the scaling layer produces more nuclei, thereby increasing the number of crystals (see
Figure 8).
Although PTFE has a larger roughness than PC, HDPE, PET, and PEEK, its scaling amount is the least. This phenomenon is explained as follows. First, among all materials, PTFE has the worst surface wettability and the lowest surface free energy (see
Figure 5 and
Figure 6). The surface has insufficient adsorption on the crystal, and the fouling particles are easy to separate from the surface, resulting in a slow crystal scaling rate and loose fouling layer, which further affects the increase in the scaling amount. Second, it can be seen from the surface crystal distribution and morphology of these five materials (see
Figure 8) that the PTFE surface has the least “mature” grains and most of them are immature bracts, and the crystal particle distribution spacing is the largest, which makes the minimum amount of scaling.
3.3. Effect of Non-Metallic Material Surface on Grain Distribution and Crystal Morphology of Crystallization Fouling
Crystal Morphology of Crystallization Fouling on Material Surface
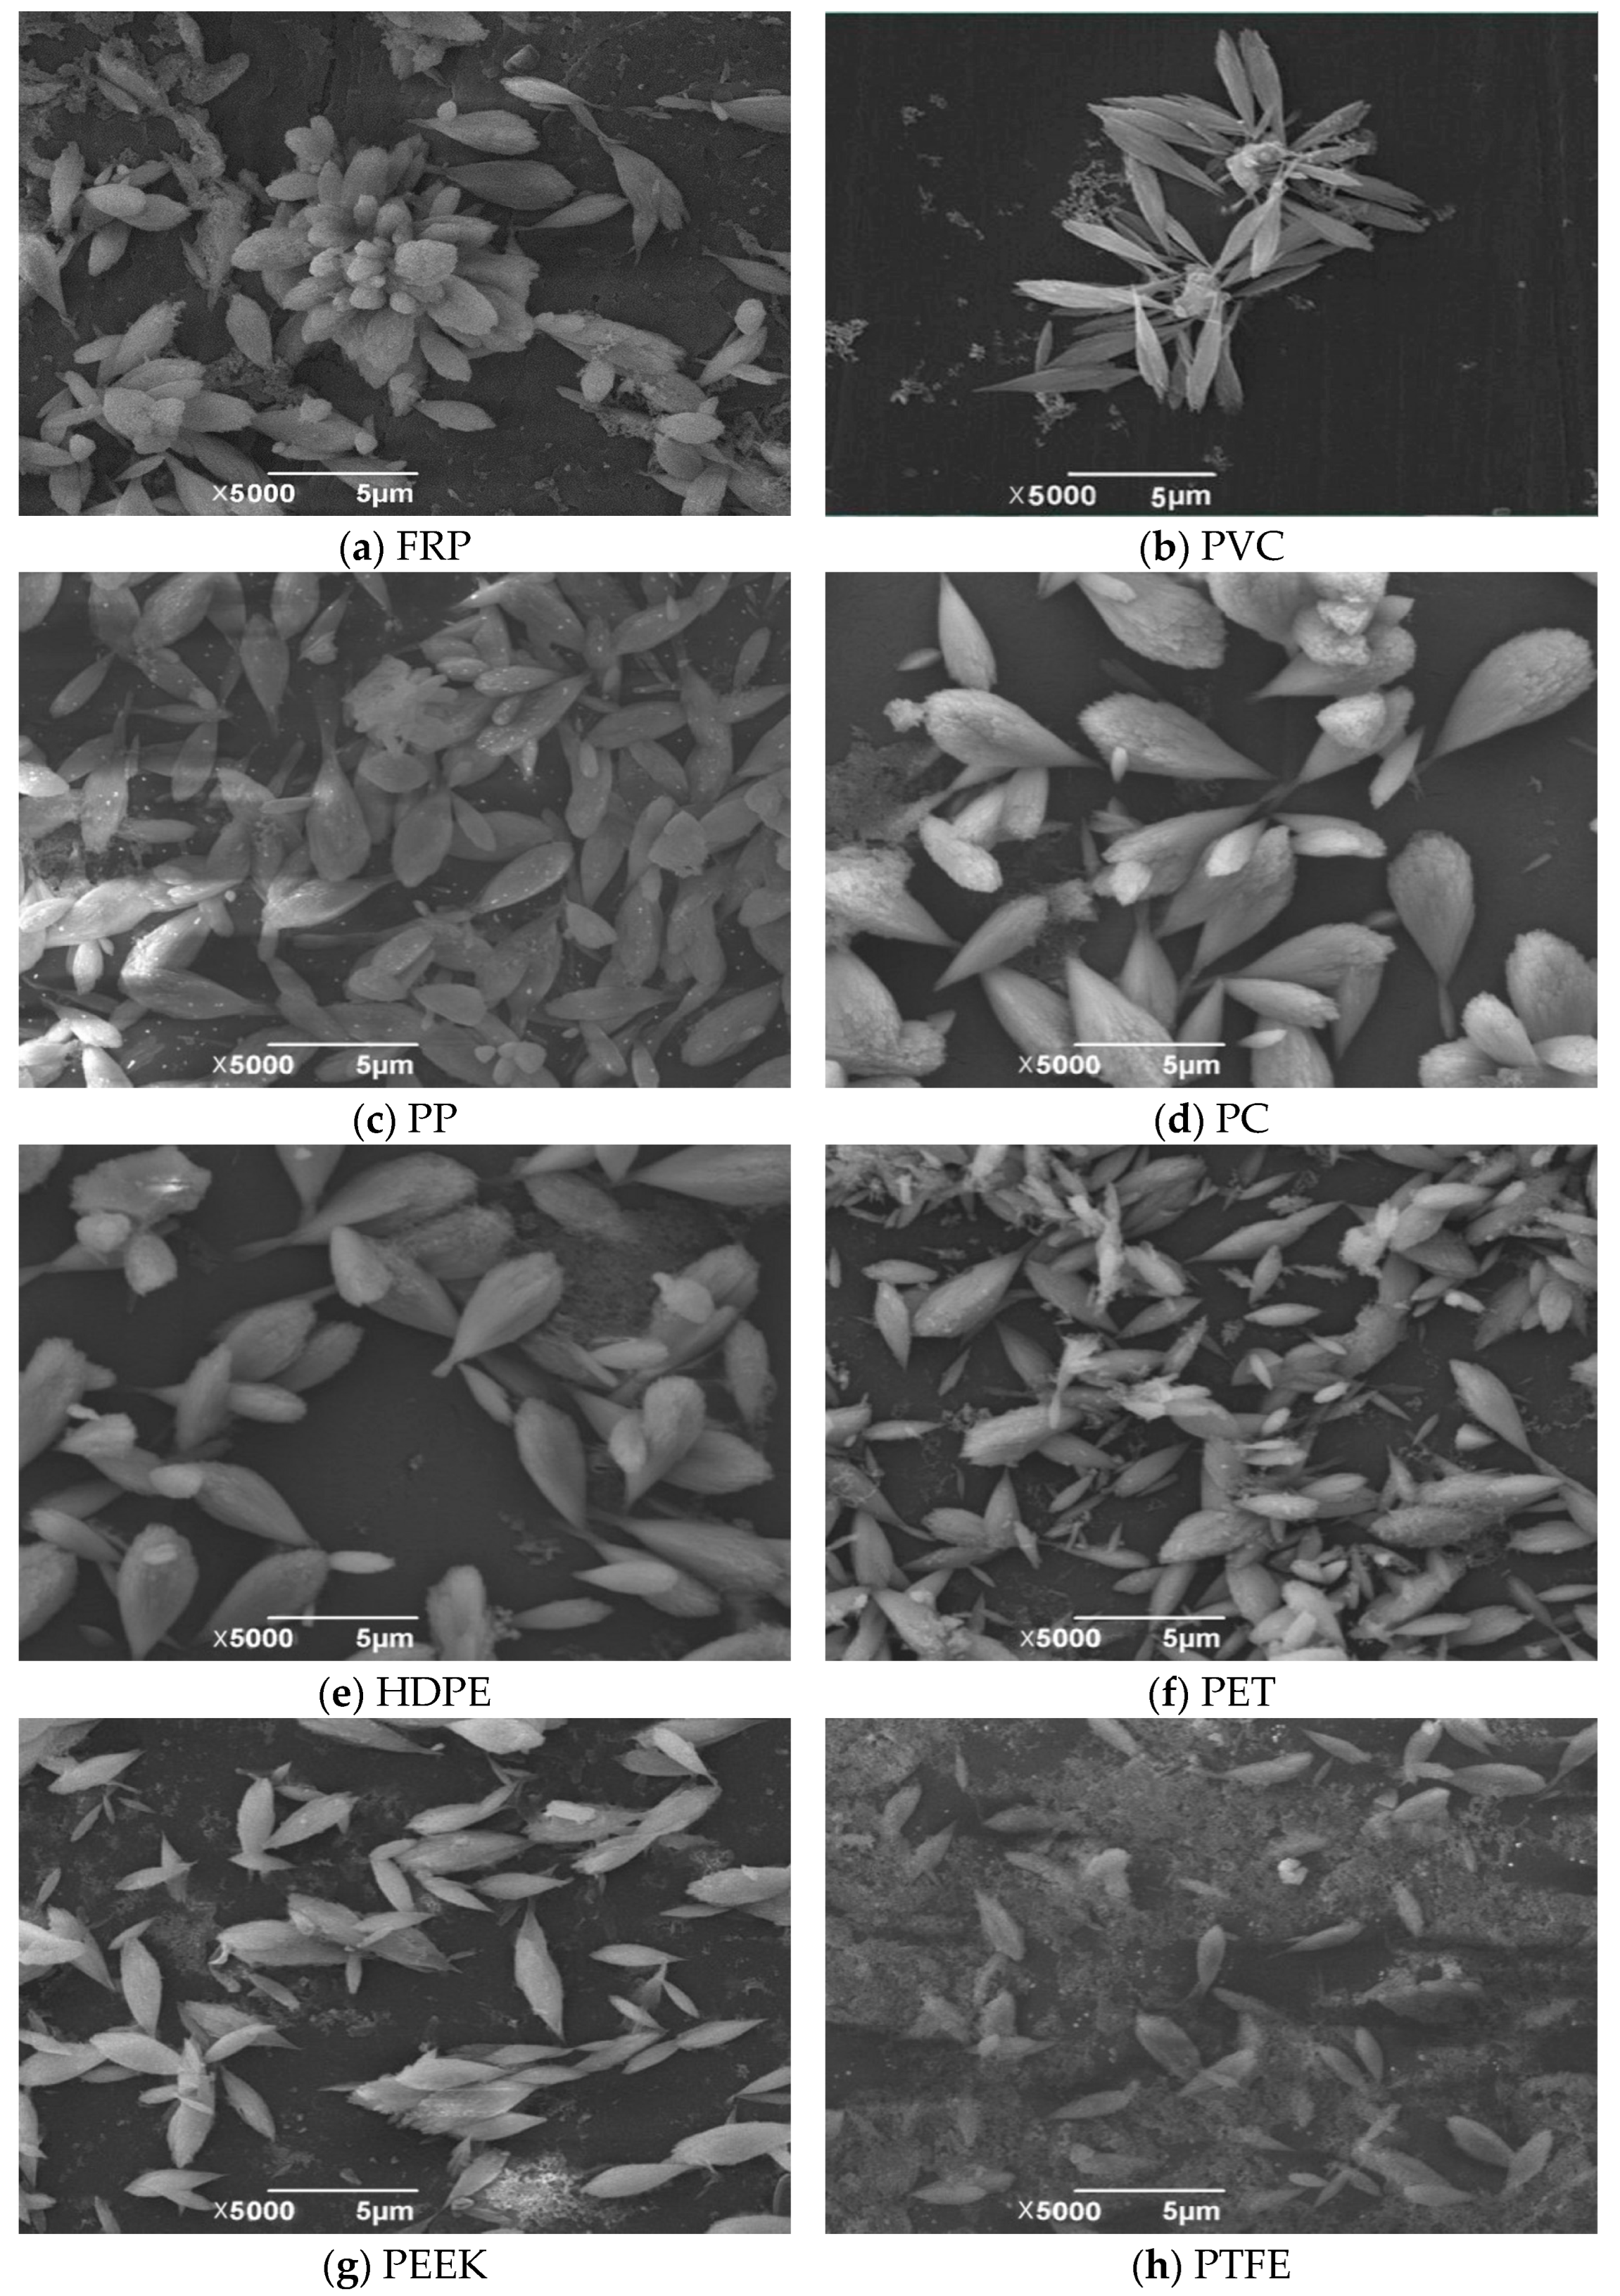
The surface crystals of each material were amplified to 5000 times by SEM to further observe the crystal morphology of the crystallization fouling. The experimental results are shown in
Figure 8.
It can be seen from
Figure 8 that the crystal types of eight kinds of non-metallic materials are mainly aragonite, and there are very few calcites on the surface of FRP, PVC, and PP. Among them, the aragonite crystals are mostly water droplets at the tip of the upper circle and lower tip, and most of the water droplets have “spike tentacles” at the tip of the crystal, while the calcite crystals are mostly rod and block. In addition, the formation of aragonite is mainly related to the chemical properties of the material surface. The surface of FRP has polar functional groups such as hydroxyl and carboxyl groups, and the polymer surface with hydroxyl functional groups will selectively generate aragonite [
31]. Although there is no hydroxyl functional group on the surface of polymers such as PVC, the hydrogen bond interaction will be gradually weakened and aragonite will be formed as part of the water penetrates into the material.
The surface crystal size of FRP, PVC, PP, PC, and HDPE is uniform and appears to be fuller, and the round ends are like a bract. The PET, PEEK, and PTFE surface crystal overall volume is small, less, and there are many small “immature” bracts.
The crystal coverage was higher and arranged more tightly on the surface of the FRP and PVC test pieces, and after magnifying the crystals, it can be seen that the new phase grown crystals covered the crystals in the pre-experimental period and gradually filled the inter-crystal voids; a layer of one stack then formed petal-like agglomerations, and the sensation of the layer was obvious, so the fouling layer underwent densification and the fouling weight increased. The crystal arrangement of particles on the surface of PP, PC, HDPE, PET, PEEK, and PTFE is loose, with large gaps, which can be easily peeled off by solution flushing and become detached from the material surface, which in turn make the fouling amount small and the fouling rate low.
It can be seen that the larger the crystal particle size, the closer the arrangement, and the more stacking layers, the more difficult it is to be washed away from the surface of the material by the fluid; thus, the larger the amount of scaling, the faster the scaling rate and the better the scaling performance.
3.4. Influence of Material Surface Properties on Friction Factor
With the friction factor data, we plotted the variation of friction factor subsets with surface energy, contact angle, and roughness for nine tubes at the same Reynolds number as shown in
Figure 9,
Figure 10 and
Figure 11.
- (1)
Under the same Reynolds number, different surface characteristics have different effects on the friction factor:
- (a)
When the pipeline material is different, with the same liquid flow in the pipeline friction factor with the increase and decrease in the contact angle, an increase in the contact angle will lead to poor surface wettability, while dirt and surface contact resistance increase, dirt crystallization nucleation potential increases, and the nucleation rate decreases, thereby reducing the friction factor.
- (b)
Except for the PET material, the friction factor of the same liquid flowing in different kinds of pipes increases with the increase in surface energy. The reason may be that although the surface energy of the PET pipe is high, its wettability is poor, its roughness is small, its surface is relatively smooth, the resistance between the pipe wall and the liquid is small, and the sliding phenomenon occurs easily when the liquid flows in the pipe [
32]. The joint drag reduction effect of wettability and roughness is more obvious than the surface energy, so the friction factor of the PET material does not increase due to the high surface energy. In addition to PET, there is a very obvious relationship between the surface free energy of the material and the scaling amount per unit area, that is, the higher the surface free energy of the material, the greater the scaling amount on the surface [
25], which increases the friction factor.
- (c)
In addition to the PTFE material, the friction factor of the same liquid flowing in different types of pipes increases with the increase in roughness. The reason may be that although the surface roughness of the pipe is large, the contact angle is large, the surface energy is low, and the adsorption force of the material surface to the liquid is low, which makes it difficult for the mineralized water to infiltrate and spread on its surface. In the case of liquid flowing in the tube, the effect of wettability and surface energy on drag reduction is more obvious than that of roughness, so the friction factor of the PTFE material does not increase due to roughness. Besides PTFE, the friction factor increases with the increase in roughness, because the contact area between fouling and surface increases with the increase in roughness. Moreover, the fouling crystal nucleus and the interface with relatively large roughness form strong mechanical interlocking, so that the fouling needs greater peeling force when it falls off the rough surface. Therefore, the increase in roughness will lead to an increase in the amount of scaling, thereby increasing the friction factor.
- (2)
From the macro point of view, the law of the friction factor changing with contact angle is more obvious relative to surface energy and roughness.
- (3)
With the increase in the contact angle, the reduction in the laminar friction coefficient is greater than that of turbulent flow. Moreover, it is found that the decrease between hydrophilic materials is more obvious than that between hydrophilic materials. The laminar flow curve of hydrophilic material decreases by 37.74%, and the turbulent flow decreases by 28.37% on average. The laminar flow curve of hydrophobic material decreases by 22.83%, and the turbulent flow decreases by 4.14% on average. The reason for this phenomenon is that, compared with turbulence, the velocity of laminar fluid is slower and the flow resistance of the material surface increases. The contact area between the liquid and the surface of the hydrophilic material is larger than that of a few materials, so the flow resistance is more obvious.
3.5. Contact Angle, Roughness, and Surface Energy Function Model
The surface free energy (G) and solid surface roughness (Ra) are selected as independent variables and the contact angle as the dependent variable to fit the corresponding relationship equation.
Because the surface of the experimental materials is mostly smooth and the surface roughness is small, the surface treated with different mesh sandpaper is selected; the value range of roughness is 0.02–0.4 , and the value range of material surface energy is 18–40 .
3.5.1. Experimental Results
According to the uniform design table and the horizontal value table of various factors, the experimental scheme of influencing factors of wettability is designed, and the experiments are arranged according to the experimental scheme. The results are shown in
Table 5.
3.5.2. SPSS Regression Analysis
Because the three factors of wettability have different units, and the surface roughness is not in an order of magnitude with the other two factors, in order to reduce the error of the fitting model, the variables need to be normalized before regression analysis.
The function is normalized and converted as follows:
where
—Normalized value;
—Value to be processed;
—The minimum value in the array to be processed;
—The maximum value in the array to be processed.
According to the value range of the independent variable and dependent variable affecting wettability, the normalized data are calculated by Formula (2), and the conversion function is:
After multiple regression analysis with SPSS software(22.0), the results are shown in Formula (3) and
Table 6,
Table 7 and
Table 8.
where:
—Contact angle, °;
G—Surface energy,;
Ra—Roughness,.
It can be seen from
Table 6,
Table 7 and
Table 8 that the model has good accuracy, and through the F test results, the T-test results of each coefficient are less than 0.05, and the VIF value after collinearity diagnosis is also less than 10, and all test results meet the requirements.


