Article

Effect of Jet Nozzle Position on Mixing Time in Large Tanks

Chemical Engineering Research Center, Laboratoire de Génie Chimique, 4 Allée Emile Monso CAMPUS INP—ENSIACET, 31400 Toulouse, France
*
Author to whom correspondence should be addressed.
Processes 2023, 11(7), 2200; https://doi.org/10.3390/pr11072200
Submission received: 1 June 2023 / Revised: 17 July 2023 / Accepted: 20 July 2023 / Published: 22 July 2023
(This article belongs to the Special Issue Recent Development of Mixing in Chemical Processes)

Abstract

:
The present investigation focuses on the impact of jet nozzle orientation on mixing time in a cylindrical tank. The aim is to identify nozzle positions that improve mixing performance and to elucidate the governing parameters that influence it. A water tank was employed for the experiment. The vertical inclination angle (α) and the horizontal inclination angle (β) of the jet nozzle determined the nozzle positions. Mixing time was determined using an inert tracer and spectrophotometry measurements. The findings show that the mixing time is significantly influenced by the position of the jet nozzle position. The accuracy of existing jet turbulence and the circulation models for the prediction of mixing time was evaluated for the different nozzle positions. Our results indicate that both models provide accurate predictions for the conventional centrally aligned (β = 0°), upward-pointing jet nozzle positions only (α > 0). For the other nozzle positions where β > 0° and at varying α, the data follow the same trends as the jet turbulence and circulation models; however, the proportionality constants vary. Shorter mixing times can be attributed principally to longer jet path lengths and therefore higher fluid entrainment and circulation as well as higher dissipation rates per jet length squared. However, it is suspected that the three-dimensional nature of the flow pattern generated in the tank also plays a non-negligible role since mixing is hindered when the nozzle points more towards the tank wall.

1. Introduction

Jet mixing is a widely used process that utilises kinetic energy from a pumped stream to blend miscible fluids in tanks or reactors [1,2]. It is particularly effective for large storage tanks where mechanical agitation is difficult to implement [3,4]. The process entails the recirculation of tank fluid in the form of a jet stream, which is directed through a nozzle and reintroduced into the bulk fluid of the tank. Jet-mixed tanks can be designed with an axial (i.e., vertical) jet or a side-entry jet that is inclined vertically as shown in Figure 1; the jets can be either upwards- or downwards-pointing. Revill [5] recommended that the jet be positioned such that it spans the longest tank dimension; this is across the liquid height, H, for an axial jet and across the diagonal for a side-entry jet.
The submerged jet has specific characteristics along its length, starting from the nozzle inlet up until several hundred nozzle diameters, dj. A jet typically forms a conical shape with a universal opening angle of approximately 11.80° regardless of the fluid type, nozzle diameter, and injection speed, uj [6]. The shear flow between a turbulent jet fluid and the surrounding ambient fluid can be divided into three regions [6,7]. The initial region consists of the potential core, which is a small, conical-shaped zone formed by mixing the jet and ambient fluid. The potential core possesses the flow characteristics of the nozzle inlet, i.e., the centreline velocity is equal to the velocity at the nozzle, and spans a length of approximately six nozzle diameters. The transition region occurs where turbulent eddies start to form in the shear layer, and the centreline velocity starts to decay. This process starts at approximately a distance of 6 dj until 30 dj after the jet nozzle and facilitates mixing and entrainment of the ambient fluid. Lastly, the fully developed region, which typically commences at about 30 dj along the jet axis, is characterised by high turbulence and self-similar velocity profiles [5,8].
The velocity of the fluid at the centreline of a turbulent jet reduces rapidly as it moves downstream due to mixing with the surrounding fluid, and this decay rate depends on factors such as initial velocity, fluid properties, jet geometry, and distance from the source. Rajaratnam [9] provided an approximation for the centreline jet velocity (uz) in the fully-developed region for a turbulent jet as follows:
u z   = 6   u j d j z  
where uj is the jet velocity at the nozzle, and z is the distance from the nozzle along the jet axis. From Equation (1), it can be seen that at a distance of 100 dj from the nozzle, the centreline velocity decreases to 6% of the jet inlet velocity. It is typically considered that the effectiveness of the turbulent jet for mixing becomes negligible beyond a distance of roughly 400 dj [7]. It is important to note that the jet also loses its characteristic properties upon impact with the tank wall, bottom, or liquid surface [6,7].

1.1. Mixing Time

Steady jets have been used for industrial mixing applications for many years, mainly for mixing low-viscosity, single-phase liquids. Mixing time, tm, is a fundamental performance indicator used to evaluate the efficiency of mixing operations, signifying the duration needed to achieve a satisfactory level of homogeneity [4,10,11]. In the context of jet mixing, various empirical equations have been presented in the literature to estimate mixing time. Wasewar [3] provided an overview of multiple correlations linking diverse jet-mixing parameters with the mixing time, as documented in the existing literature. Amongst these, one of the earliest correlations is that proposed by Fosset [12] given in Equation (2), which only includes tank diameter, jet velocity, and nozzle diameter. The correlation is only for the turbulent flow regime, and it suggests that mixing time is independent of jet Reynolds number.
t m = 4.5   T ² u j d j  
The correlations presented by Fox and Gex [13] in Equation (3) show a strong dependence of mixing time on Reynolds number in the laminar regime but less so in the turbulent regime (Reynolds numbers ≥ 2000). Like the previous correlation, the applicability and accuracy of these correlations is limited due to their empirical nature, and the fact that the physical processes involved in mixing are not considered. Consequently, these correlations may not always provide accurate mixing time predictions, especially in other tank geometries. Okita and Oyama [14] aimed to address this issue, and they reported correlations of mixing time for vertical and inclined side-entry nozzle configurations (Equations (4) and (5)). They concluded that mixing time is independent of Reynolds number for values above 5000 in the turbulent jet regime.
t m = δ T H u j d j ( d j H ) 0.5 δ = 7.8   ×   10 5 Fr 0.17 R e j 1.33   for 250 < Re j < 2000 δ = 120 Fr 0.17 R e j 0.17 ,   for 2000 < Re j < 1.6   ×   10 5
t m = 2.8   ×   10 4 R e j   T 1.5 H 0.5 u j d j , for 1000 < Re j < 5000
t m = T 1.5 H 0.5 u j d j for 5000 < Re j < 80,000
In addition to the numerous empirical correlations that exist for the prediction of mixing time, two more physically based models exist for the design of jet-mixed vessels. These are the circulation and the turbulent jet models.

1.1.1. Circulation Model

The circulation model employed in jet-mixing tanks relies on the concept of fluid circulation, which occurs through the entrainment of bulk fluid by the jet stream. The total volumetric flow rate, QT, is expressed by the sum of the flow rate through the nozzle, Q, and the maximum entrained flow rate, Q E ( z m a x ) , which occurs at the maximum jet path length, z m a x . This is the distance from the nozzle to the point where the jet impinges on the tank wall, base, or liquid surface. The mean circulation time can be expressed in terms of the liquid volume (V) contained within the tank and the total volumetric flow rate of bulk liquid, QT, as given by Equation (6).
t C = V Q T  
Rajaratnam [15] showed through a momentum balance that the ratio of the total flow rate in the jet to the flow rate at this nozzle increases with the distance from the nozzle:
Q T Q = k z d j
where k is an experimental coefficient. The total flow rate at the end of the jet (at a distance zmax from the nozzle) can therefore expressed as follows:
Q T Q = k z m a x d j
Ricou and Spalding [16] reported a value of k equal to 0.32 for a free jet. However, Maruyama et al. [17] presented k values ranging from 0.48 to 1, depending on nozzle clearance, liquid height, and inclination angle. The variation in the value of k is attributed to the distortion of the conical shape of the jet stream [17], which leads to smaller circulation times compared with that of a free jet. This suggests that the jet in a tank is confined to some extent, depending on the jet orientation. In addition, k was found to strongly depend on the Reynolds number of the jet (Rej) within the range of 100 to 2000 [5]. However, as Rej exceeds 2000, the correlation between k and Rej weakens [5].
Maruyama et al. [17] presented the circulation model by expressing Equation (8) in terms of circulation time, tc, and mean residence time, tR:
t c t R / d j z m a x   1 k   = C o n s t a n t
which can be written as Equation (10) when expressing tR in terms of tank geometry and the flow velocity:
t C = T 2 H k u j d j z m a x
Mixing time has been shown to be directly proportional to circulation time [14,17], which can be written as follows:
t m = φ T 2 H u j d j z m a x
Grenville and Tilton [18] reported φ equal to 9.34 for vertical nozzle inclinations, α > 15°, and 13.8 for α < 15° when β = 0° and 0.4 H/T ≤ 1. It is worth noting that irrespective of the specific value of k selected, φ remains constant for a given jet configuration.

1.1.2. Jet Turbulence Model

Using another physical representation, Corrsin [19] demonstrated that the mixing time for a passive scalar in a low-viscosity fluid is a function of the integral scale of concentration fluctuations (L) and the turbulent kinetic energy dissipation rate (ε). Using this, Grenville and Tilton [20] introduced the jet turbulence model (JTM) and showed that mixing time in jet-mixed vessels is determined by the rate of turbulent energy dissipation at the end of the free jet path length:
t m ε z m a x z m a x 2 1 / 3
where the turbulent kinetic energy dissipation rate at the end of free jet path length, ε z m a x , is as given:
ε z m a x   u z m a x 3 / d z m a x  
They conducted experiments using tanks with aspect ratios (H/T) ranging between 0.2 and 3.0 and for jet nozzle positions such that the jet path spanned the diagonal of tank. By substituting Equations (1) and (12) into Equation (11) and using the conservation of momentum ( u j d j = u z m a x d z m a x ), they showed that dimensionless mixing time in all vessels could be expressed as given:
t m u j d j = 2.97 d j z m a x 2
Whilst the constant in Equation (14) is obtained empirically from the large set of experimental data, the correlation is based on a physical model where the local energy dissipation rate at the end of the jet controls mixing in the vessel.
Despite the abundance of literature on jet mixing of Newtonian fluids in vessels and the existing general design guidelines for jet-mixed tanks, there is a lack of clear understanding of the impact of nozzle orientation on mixing. Indeed, most studies have explored mixing for upwards-pointing jets that span the diagonal of the tank and are oriented across the tank diameter. The case of downwards-pointing nozzles has rarely been dealt with, although they are important for mixing stratified systems. Side-entry nozzles that are oriented horizontally towards the wall have also been given little attention, although they have shown potential for effective mixing in wastewater treatment [21]. This study therefore focuses on the impact of nozzle orientation—both vertical and horizontal inclination—on single-phase low-viscosity jet mixing in a tank. The effectiveness of different nozzle positions is evaluated by measuring mixing time using an inert tracer. The results obtained are discussed on the basis of existing correlations and physical models.

2. Materials and Methods

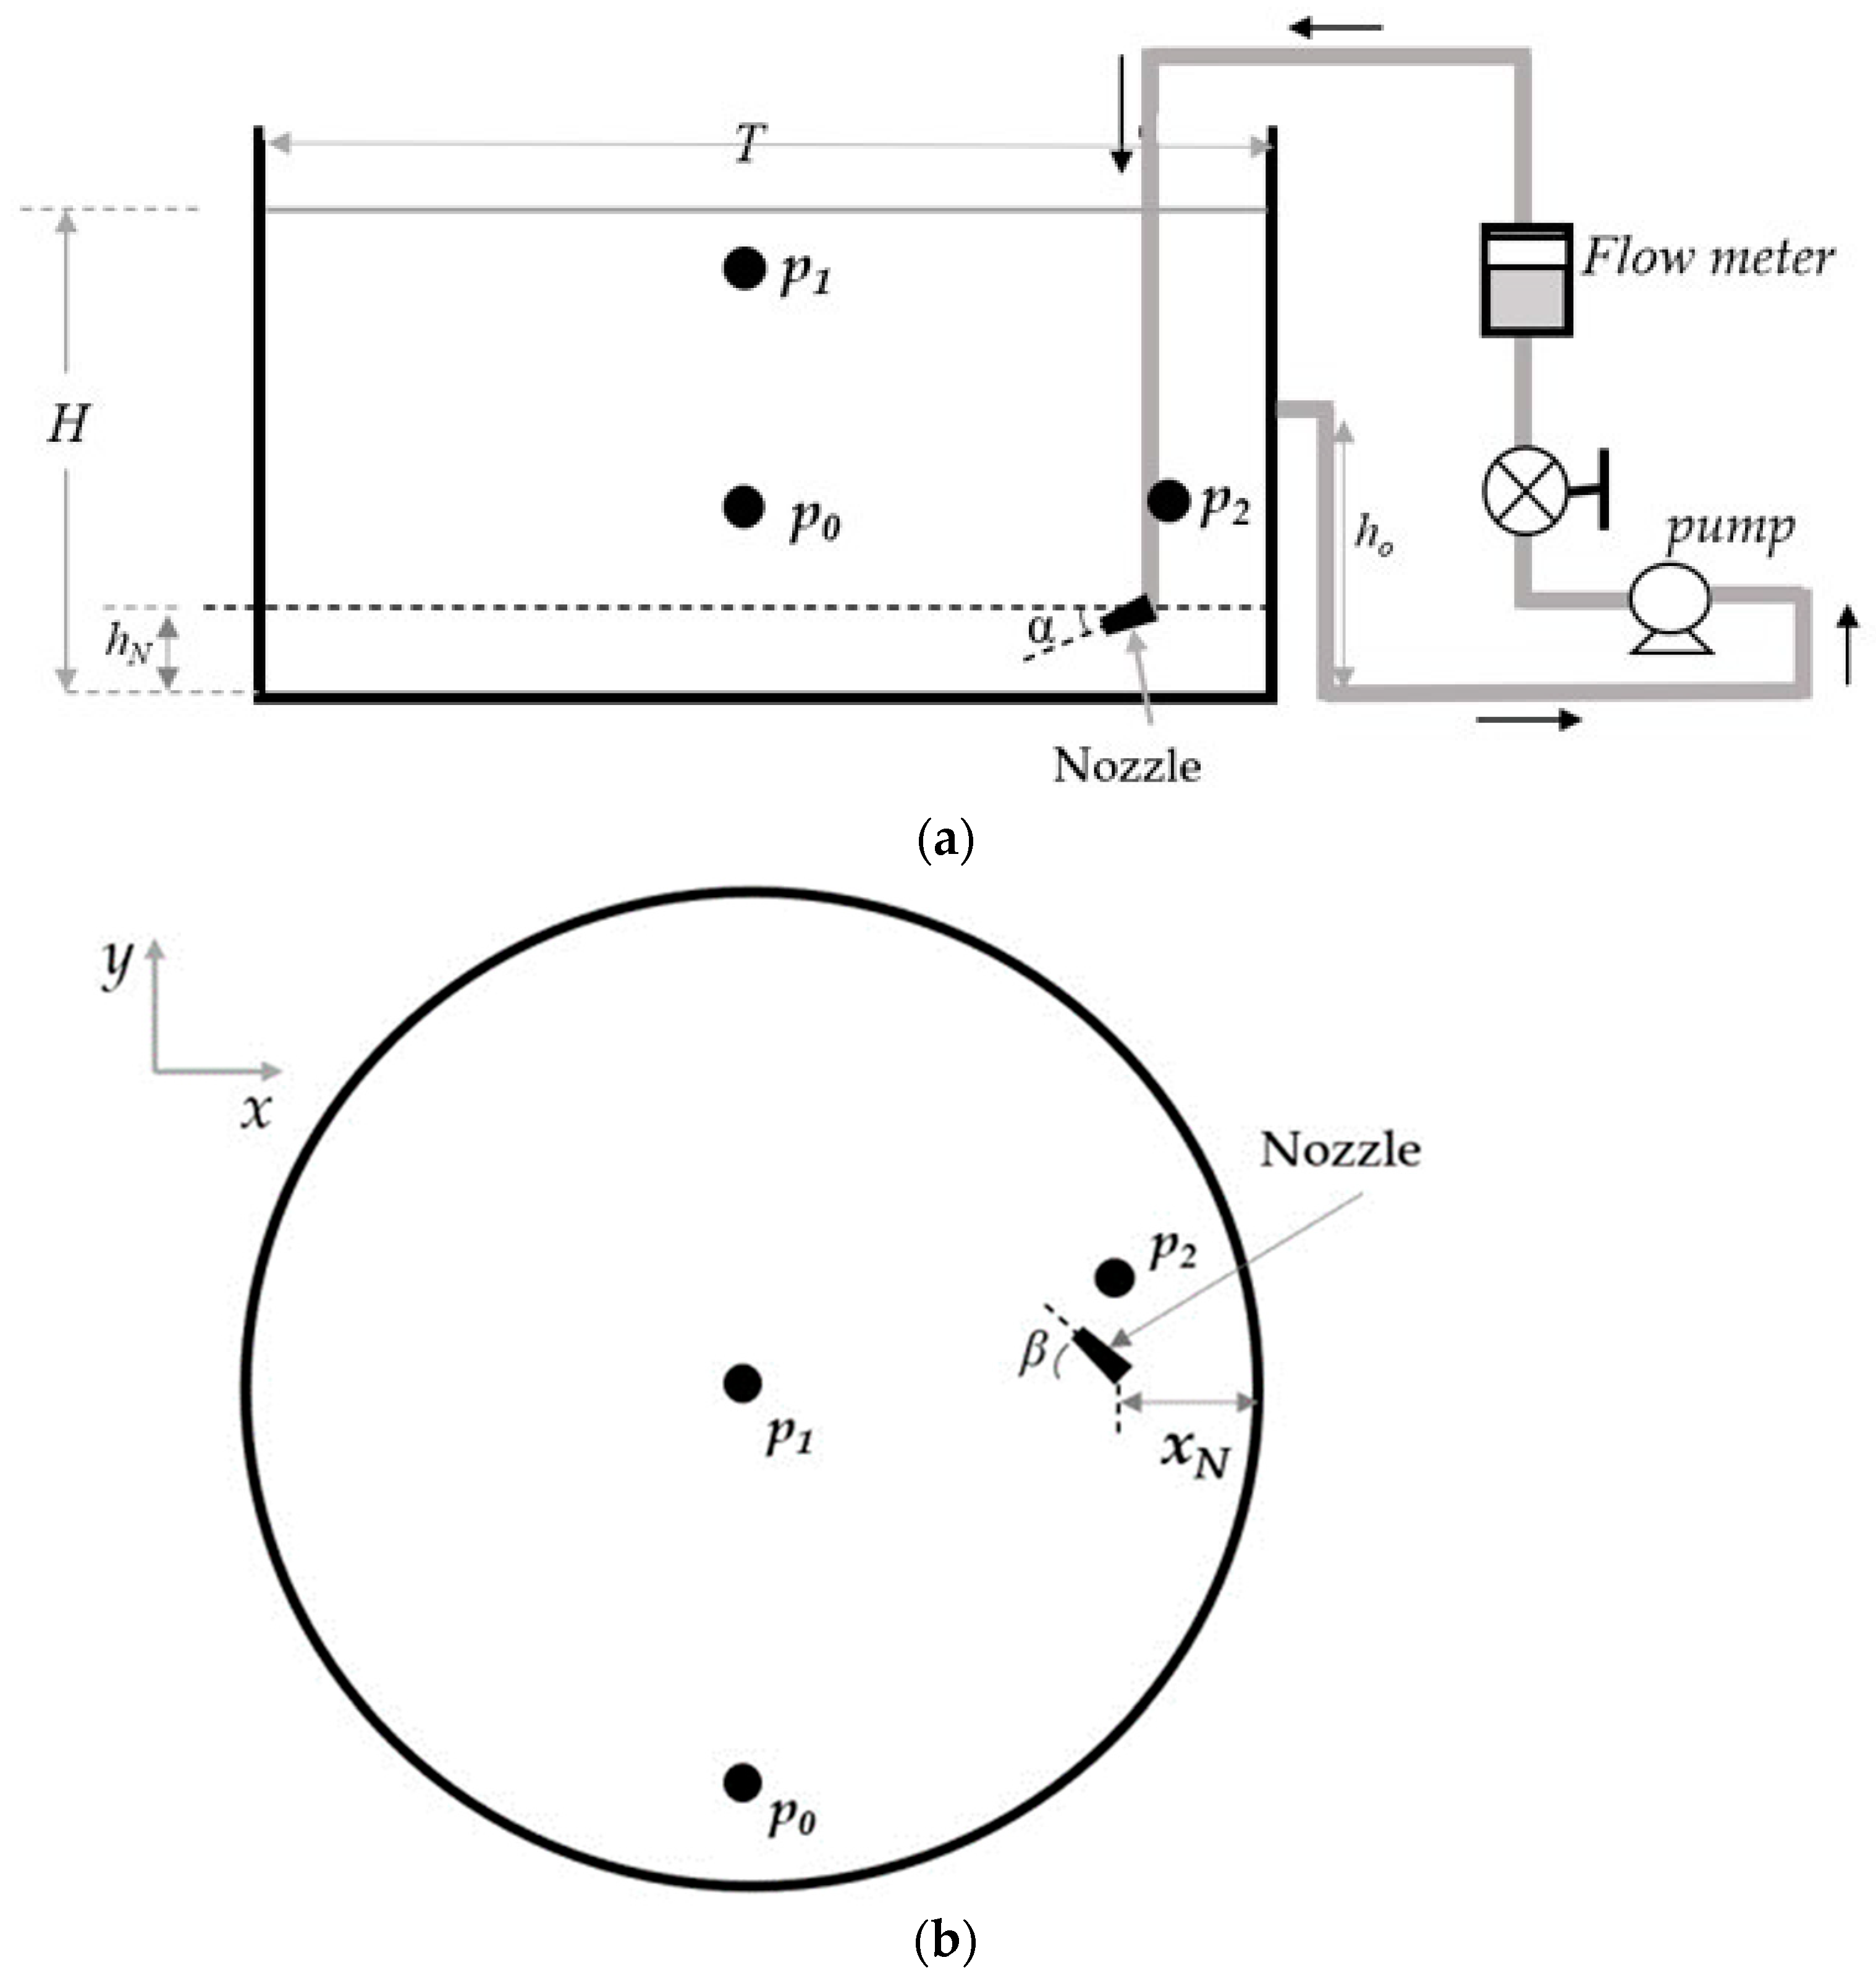
2.1. Experimental Setup and Operating Conditions

Figure 2 presents the schematic diagram of the vessel, which consists of a cylindrical tank made of transparent plexiglass with a flat base and a diameter of 0.78 m. The aspect ratio, i.e., liquid height-to-tank diameter (H/T), is equal to 0.5. The nozzle is situated in the tank at 0.05 m from the tank bottom and 0.085 m from the side wall. Three nozzle diameters were tested: 3 mm, 5 mm, and 7.5 mm. The vertical (α) and the horizontal (β) inclination angles of the nozzle are illustrated in Figure 3. The angles were varied as given in Table 1; positive values of α correspond to an upward-pointing jet, whilst negative values correspond to a downwards-pointing jet. When α and β equal zero, the jet spans across the diameter of the tank. Figure 4 presents a schematic diagram showing various impingement zones resulting from the vertical inclinations of the nozzle. When α exceeds the upper critical angle of α U L , the jet impinges on the liquid surface (zone A). For α L L < α < α U L , the jet impinges on the tank side wall (zone B). Finally, when α is less than the lower critical angle of α L L , the jet impinges on the tank bottom (zone C). The values of αLL and αUL are dependent on β.
Water at ambient conditions is the working fluid. The flow rate at the nozzle (Q) varied between 5.3 L/min and 14 L/min, with the residence times ranging from 843–7157 s. These flow rates correspond to jet velocities at the nozzle ranging from 2 m/s to 16.7 m/s, with jet Reynolds numbers from 15,000 to 62,300 indicating a turbulent jet. Note that the liquid is pumped through the nozzle and tank in a closed circuit in order to maintain the liquid level at constant. However, the mean residence time for all tested conditions was sufficiently long compared with the mixing time, such that liquid recirculation had no impact on the mixing process.

2.2. Mixing Time Measurements

Mixing time is measured by monitoring the decay of the normalised concentration variance of an inert tracer, as given by Equation (15) [22]. First, 80 mL of an aqueous fluorescein solution (0.0166 mol/L) was introduced into the tank on the centre of the free liquid surface. A spectrophotometer with three T300-RT-UV/VIS dip probes (Ocean Insight) was used to take absorbance measurements over time at three different positions in the tank, as shown in Figure 1b; (p0: 0, 0.29, and 0.15 m; p1: 0, 0, and 0.34 m; p2: 0.305, 0.085, and 0.15 m). The response time of the probes was 250 ms. The absorbance values were within the range to maintain the linearity of Beer–Lambert’s law, and therefore, they are directly proportional to the tracer concentration in the tank. Mixing time is defined as the time required to reach 95% of the perfectly mixed state and occurs when log (σ2) < −2.6. The mixing time for each experimental configuration was determined a minimum of two times, and the average value was taken. The percent deviation in mixing time between two repeats was equal to or less than 9%, a magnitude that falls within an admissible range when considering the reproducibility of experimental outcomes.
l o g σ 2 = l o g M = 1 M C i C 2 M C 2
In addition, in order to better understand the impact of the nozzle position on the mixing time, the fluctuations of the concentration response curve of probes were measured after the addition of the tracer at the liquid surface, above the position of p0.

3. Results and Discussion

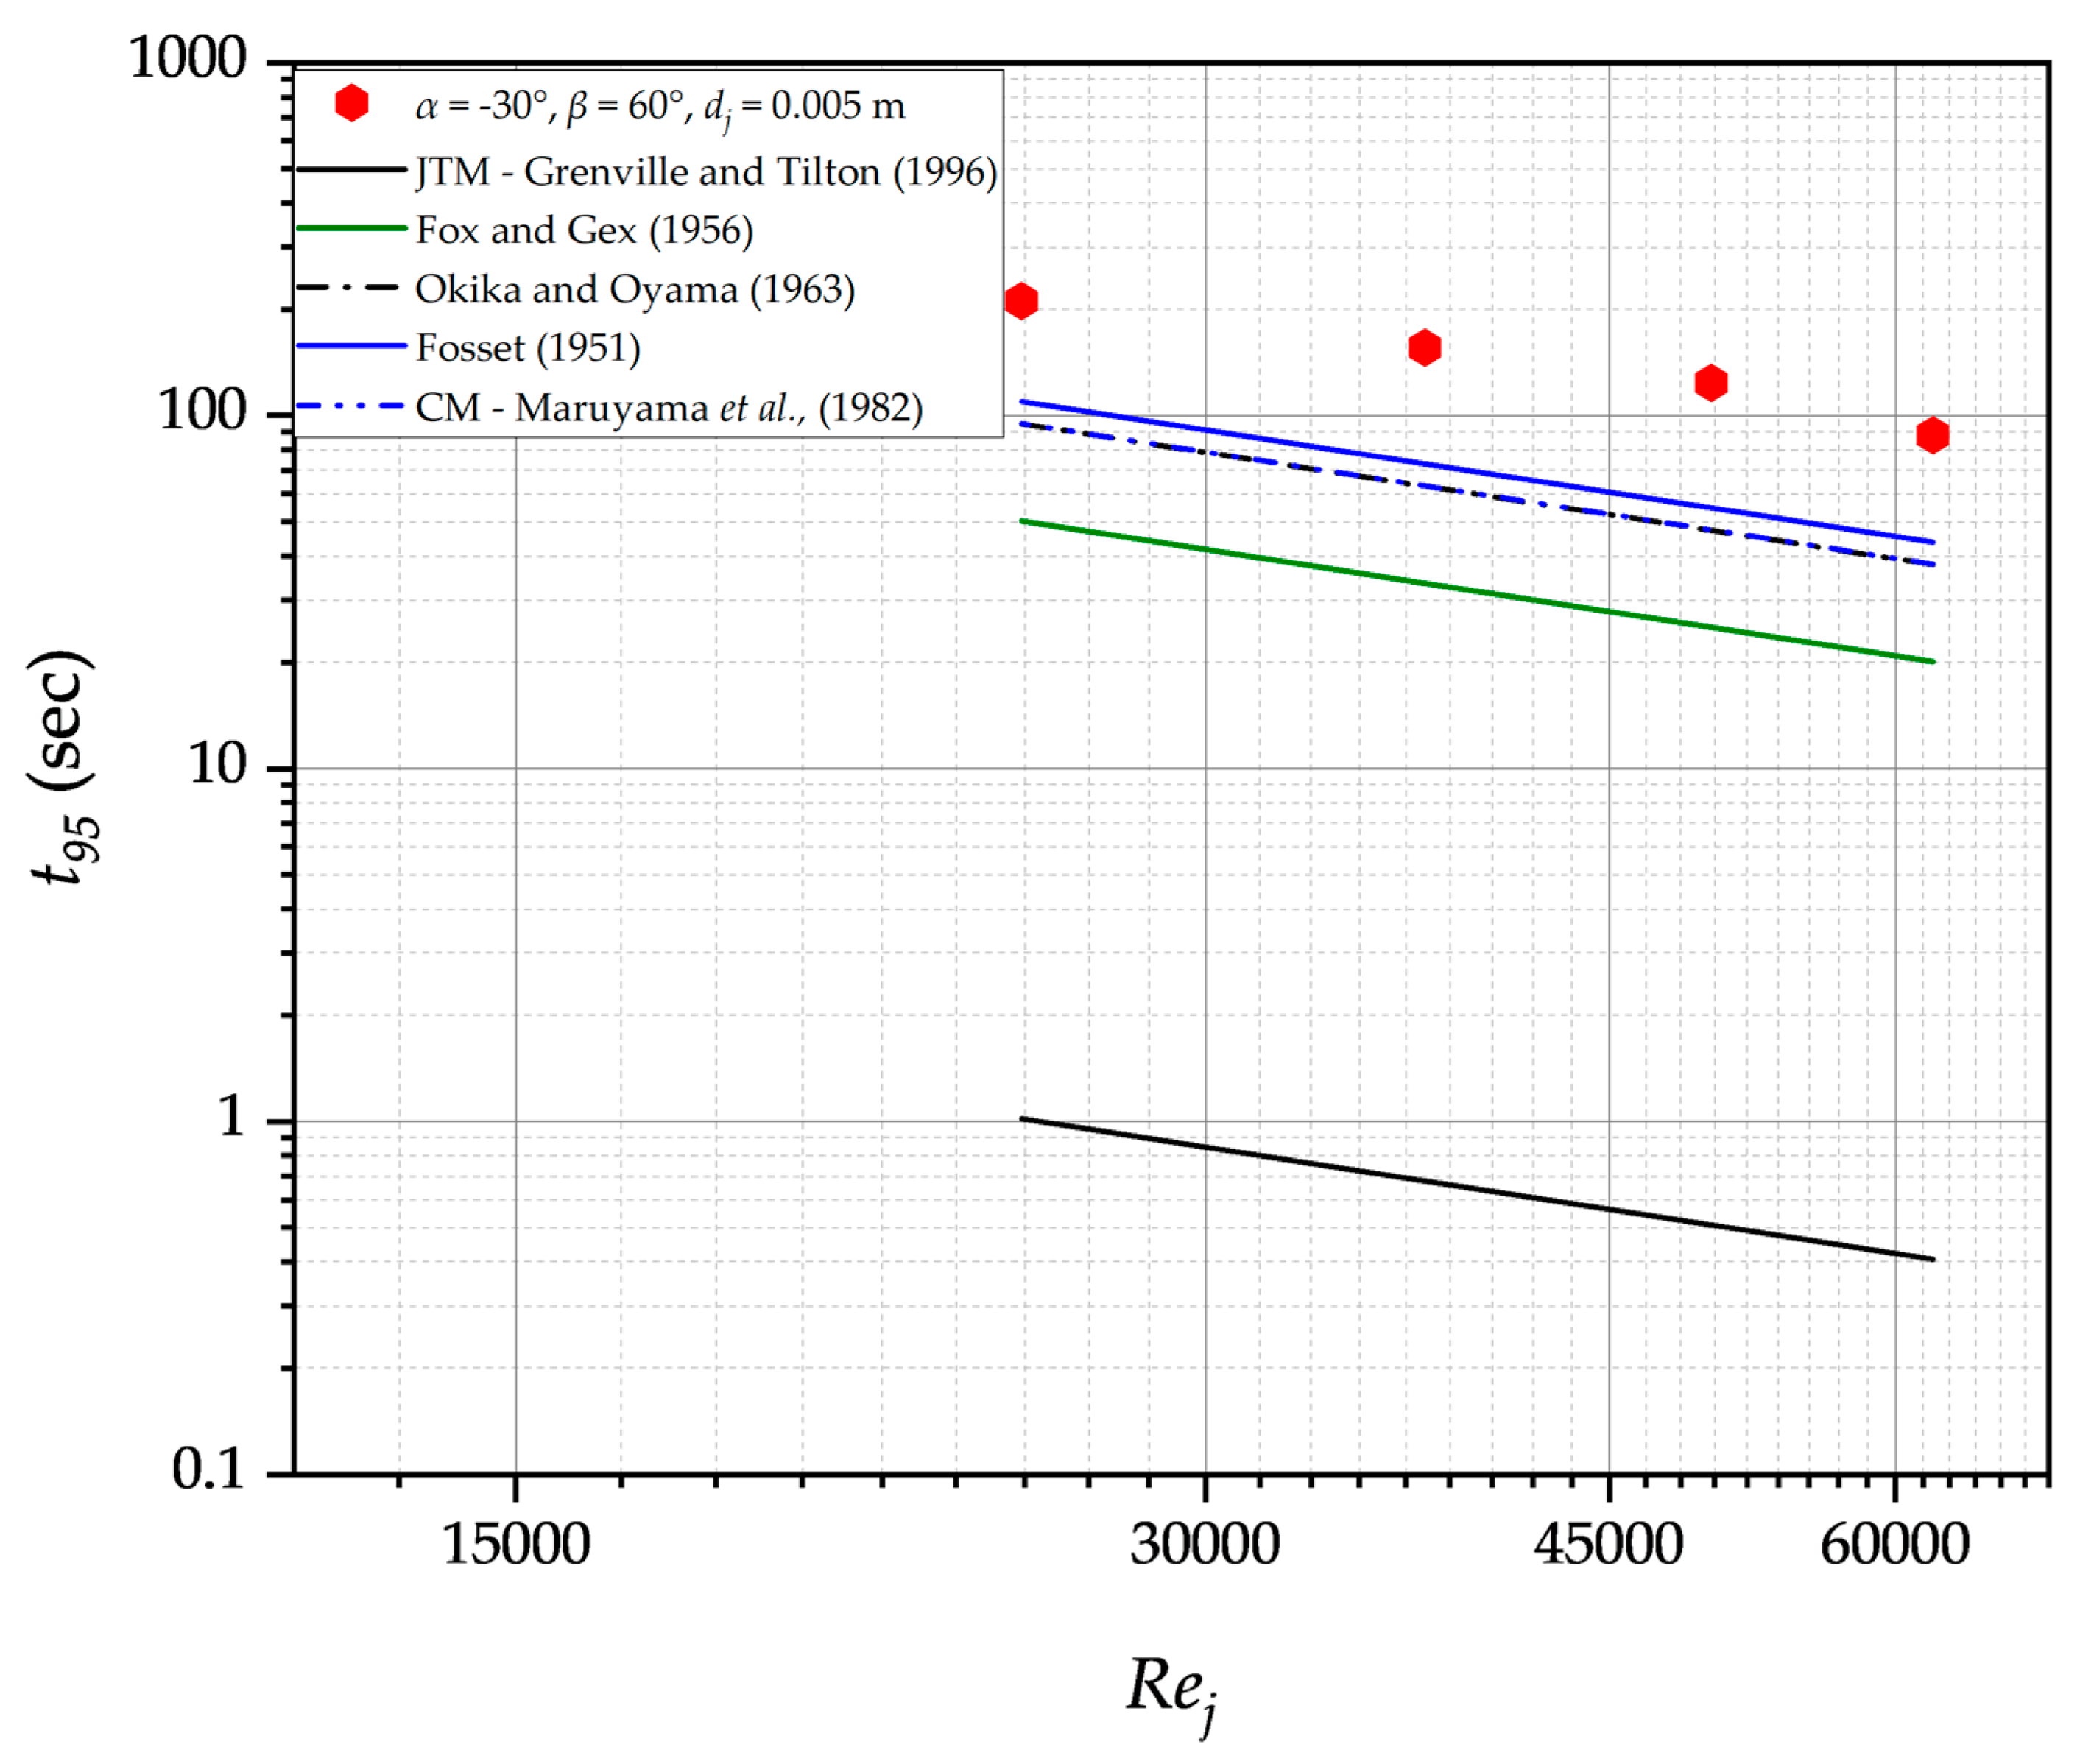
3.1. Comparison of Experimental Mixing Time with Different Models

Figure 5 and Figure 6 present comparisons of the mixing times measured experimentally for different nozzle positions and the mixing times calculated by previous models/correlations as a function of jet Reynolds number. Results indicate that both the Maruyama [17] circulation model (Equation (11)) and the jet turbulence model presented by Grenville and Tilton [20] provide a good fit with the experimental data for upwards-pointing nozzles with 0° ≤ α ≤ 35° and β = 0°. The other correlations examined did not agree well with the current data. The coefficients for the circulation model presented by Grenville and Tilton [18] were found to be completely out of range for the data obtained in this study. Notably, the value of the proportionality constant is contingent upon the specific tank geometry employed making these correlations poorly adapted to other geometries.
Figure 6 shows however that none of the correlations fit the experimental data for the downward-pointing nozzle position of α = 30° and β = 60°. This is due to the fact that the previous literature on jet mixing has focused on centrally aligned, upwards-pointing nozzle positions. These setups certainly exhibit dissimilar mixing mechanisms and flow patterns to those with the nozzle position at α = 30° and β = 60°.

3.2. Correlating Experimental Data Using Jet Turbulent Model

The present study investigates the mixing performance of the different jet nozzle configurations by analysing the mixing time t95 as a function of ε z m a x z m a x 2 at the end of the maximum free jet path length. The results presented in Figure 7 indicate a reduction in mixing time with ε z m a x z m a x 2 for all nozzle positions; however, a clear separation in the data is observed between upward- and downward-pointing nozzles. The downwards-pointing jets require significantly higher turbulence energy dissipation rates per jet length squared to achieve equivalent mixing times compared to the upwards-pointing jets. Indeed, mixing is not affected the turbulence energy dissipation generated at the nozzle; equivalent flow rates do not give equivalent mixing times for all nozzle positions. This affirms the proposition put forth by Grenville and Tilton [20] that the mixing time is influenced by energy dissipation rate, ε, in a region located far from the jet nozzle, where velocities and turbulence intensity are considerably lower rather than energy dissipation rate at the nozzle, εj. It can also be seen that for upwards-pointing nozzles with a horizontal angle β = 0°, where the jet spans across the tank diameter, the vertical inclination angle α has no impact, and all the data collapse. On the other hand, the horizontal angle of the nozzle clearly has an influence, and different mixing times can be obtained for equal ε z m a x z m a x 2 . In such cases, the mixing time increases as the horizontal inclination angle of the nozzle increases, i.e., as the nozzle is directed increasingly towards the side wall of the tank.
A regression analysis was conducted on the data for upwards-pointing jets with 0° < α < 35° and β = 0° and for the downwards-pointing jet with α = 30° and β = 60°, and the results are Equations (16) and (17). The power exponent for both equations is very close to −1/3, as expected by Corrsin’s [19] model. On the other hand, the proportionality constants are very different. A lower value of the proportionality constant corresponds to a more efficient mixing process. The data thus indicate that the mixing process is much more efficient with the upwards-pointing nozzles. For the upwards-pointing nozzles, the proportionality constant is similar to the value of 32.4 reported by Grenville and Tilton [20] for upwards-pointing nozzles that orient the jet centrally and across the diagonal of the tank.
When the horizontal angle of the nozzle is varied, the data appear to correlate with a similar slope close to −1/3; however, the proportionality coefficient increases with increasing horizontal angle even though the data have the same value of ε z m a x z m a x 2 for equal jet velocity at the nozzle. This indicates that the constant of proportionality in Equations (16) and (17) may depend not only on ε z m a x z m a x 2 but also on the flow pattern created by the jet with different the nozzle positions.
t 95 = 38.1 ( ε z m a x z m a x 2 ) 0.304
with a correlation coefficient, R2, of 0.895 for 0° ≤ α ≤ 35°, β = 0°.
t 95 = 4848.5 ( ε z m a x z m a x 2 ) 0.307
with a correlation coefficient, R2, of 0.978 for α = 30°, β = 60°.

3.3. Correlating Experimental Data Using the Circulation Model

The experimental mixing time data were also correlated using the circulation model, which consists of plotting mixing time against circulation time. Circulation time was measured for downwards- and upwards-pointing nozzles with α = 30° or 15° and varied values of β using the method described by Maruyama et al. [17]. This method involves calculating tc as the time interval between successive oscillations in concentration measurements in order to obtain a value of coefficient 1/k appearing in Equation (9). For the other nozzle positions, values provided in Maruyama et al. [17] were used. The values are provided in Table 2.
Figure 8 displays the mixing time for various nozzle positions as a function of fluid circulation time. For all nozzle positions, the mixing time increases with circulation time. A regression analysis was conducted on the t95 mixing time and the t C for nozzle positions at β = 0°, 0°, α  35°, and that of α = 30° and 15°, β = 60°, yielding the following relationships for the upwards- and downwards-pointing nozzles, respectively.
t 95 = 2.5   t C
with a correlation coefficient, R2, of 0.97 for 0° ≤ α ≤ 35°, β = 0°.
t 95 = 13.2   t C
with a correlation coefficient, R2, of 0.99 for α = 30°, β = 60°.
From Equations (18) and (19), it follows that for nozzle positions at β = 0°, 0° α  35°, the mixing is achieved when the fluid has circulated approximately two and a half times in the tank, whilst more than 13 tank turnovers are required to mix the tank when a downwards-pointing jet (α = 30° and 15°, β = 60°) is used. Indeed, in the latter case, the length of the jet is very short (<20 dj), which means that less fluid is entrained, thereby resulting in less fluid circulation. In addition, it is expected that conical shape and characteristic properties of the jet are modified by the proximity of the tank base, and as a result, fluid entrainment may be hindered [17,23]. It can also be seen from Figure 8 that for both downwards- and upwards-pointing jets, the proportionality constant between mixing time and circulation time strongly depends on the horizonal orientation β. In the case of upwards-pointing jets, the jet points more and more towards the side tank wall as β increases, becoming shorter at the same time, and more tank turnovers are required to achieve mixing. For downwards-pointing jets, however, the jet length is not modified with a change in β. Therefore, the increase in mixing time for these cannot only be attributed to a lack of fluid entrainment and consequently fluid circulation in the tank. On the other hand, it is suspected that as β increases for both downwards- and upwards-pointing jets, the tangential component of the flow increases, whilst the radial and axial components decrease, thereby hindering mixing.
Using the mixing time circulation model presented in Equation (11), the value of the proportionality constant φ found for the various jet configurations in this study ranges from 3 to 4.7 for 0° ≤ α ≤ 35°, β = 0° and for the downwards-pointing jet with α = 30°, β = 60°, φ = 2.2. For the centrally aligned nozzle where α = 15° and β = 0°, φ = 4.7, which agrees well with the value of 5 reported by Maruyama et al. [17] (as noted by Perona et al. [23]) in tanks with aspect ratios (H/T ) ranging from 0.5 to 1.0. However, Grenville and Tilton [18] reported a value φ = 9.34 for α > 15°, β = 0° and 13.8 for α < 15°, β = 0° for jets that span the tank diagonal in tanks with H/T from 0.4 to 1, which are similar conditions to those of Maruyama et al. [17]. A plausible explanation for this inconsistency lies in the choice of the k value, which is governed by the nozzle installation positions relative to the tank geometry and the relative confinement. Indeed, Maruyama et al. [17] showed experimentally that k is dependent on the orientation of the nozzle and found values ranging from 0.48 to 1.0, while Grenville and Tilton [18] employed a fixed value of 0.25.

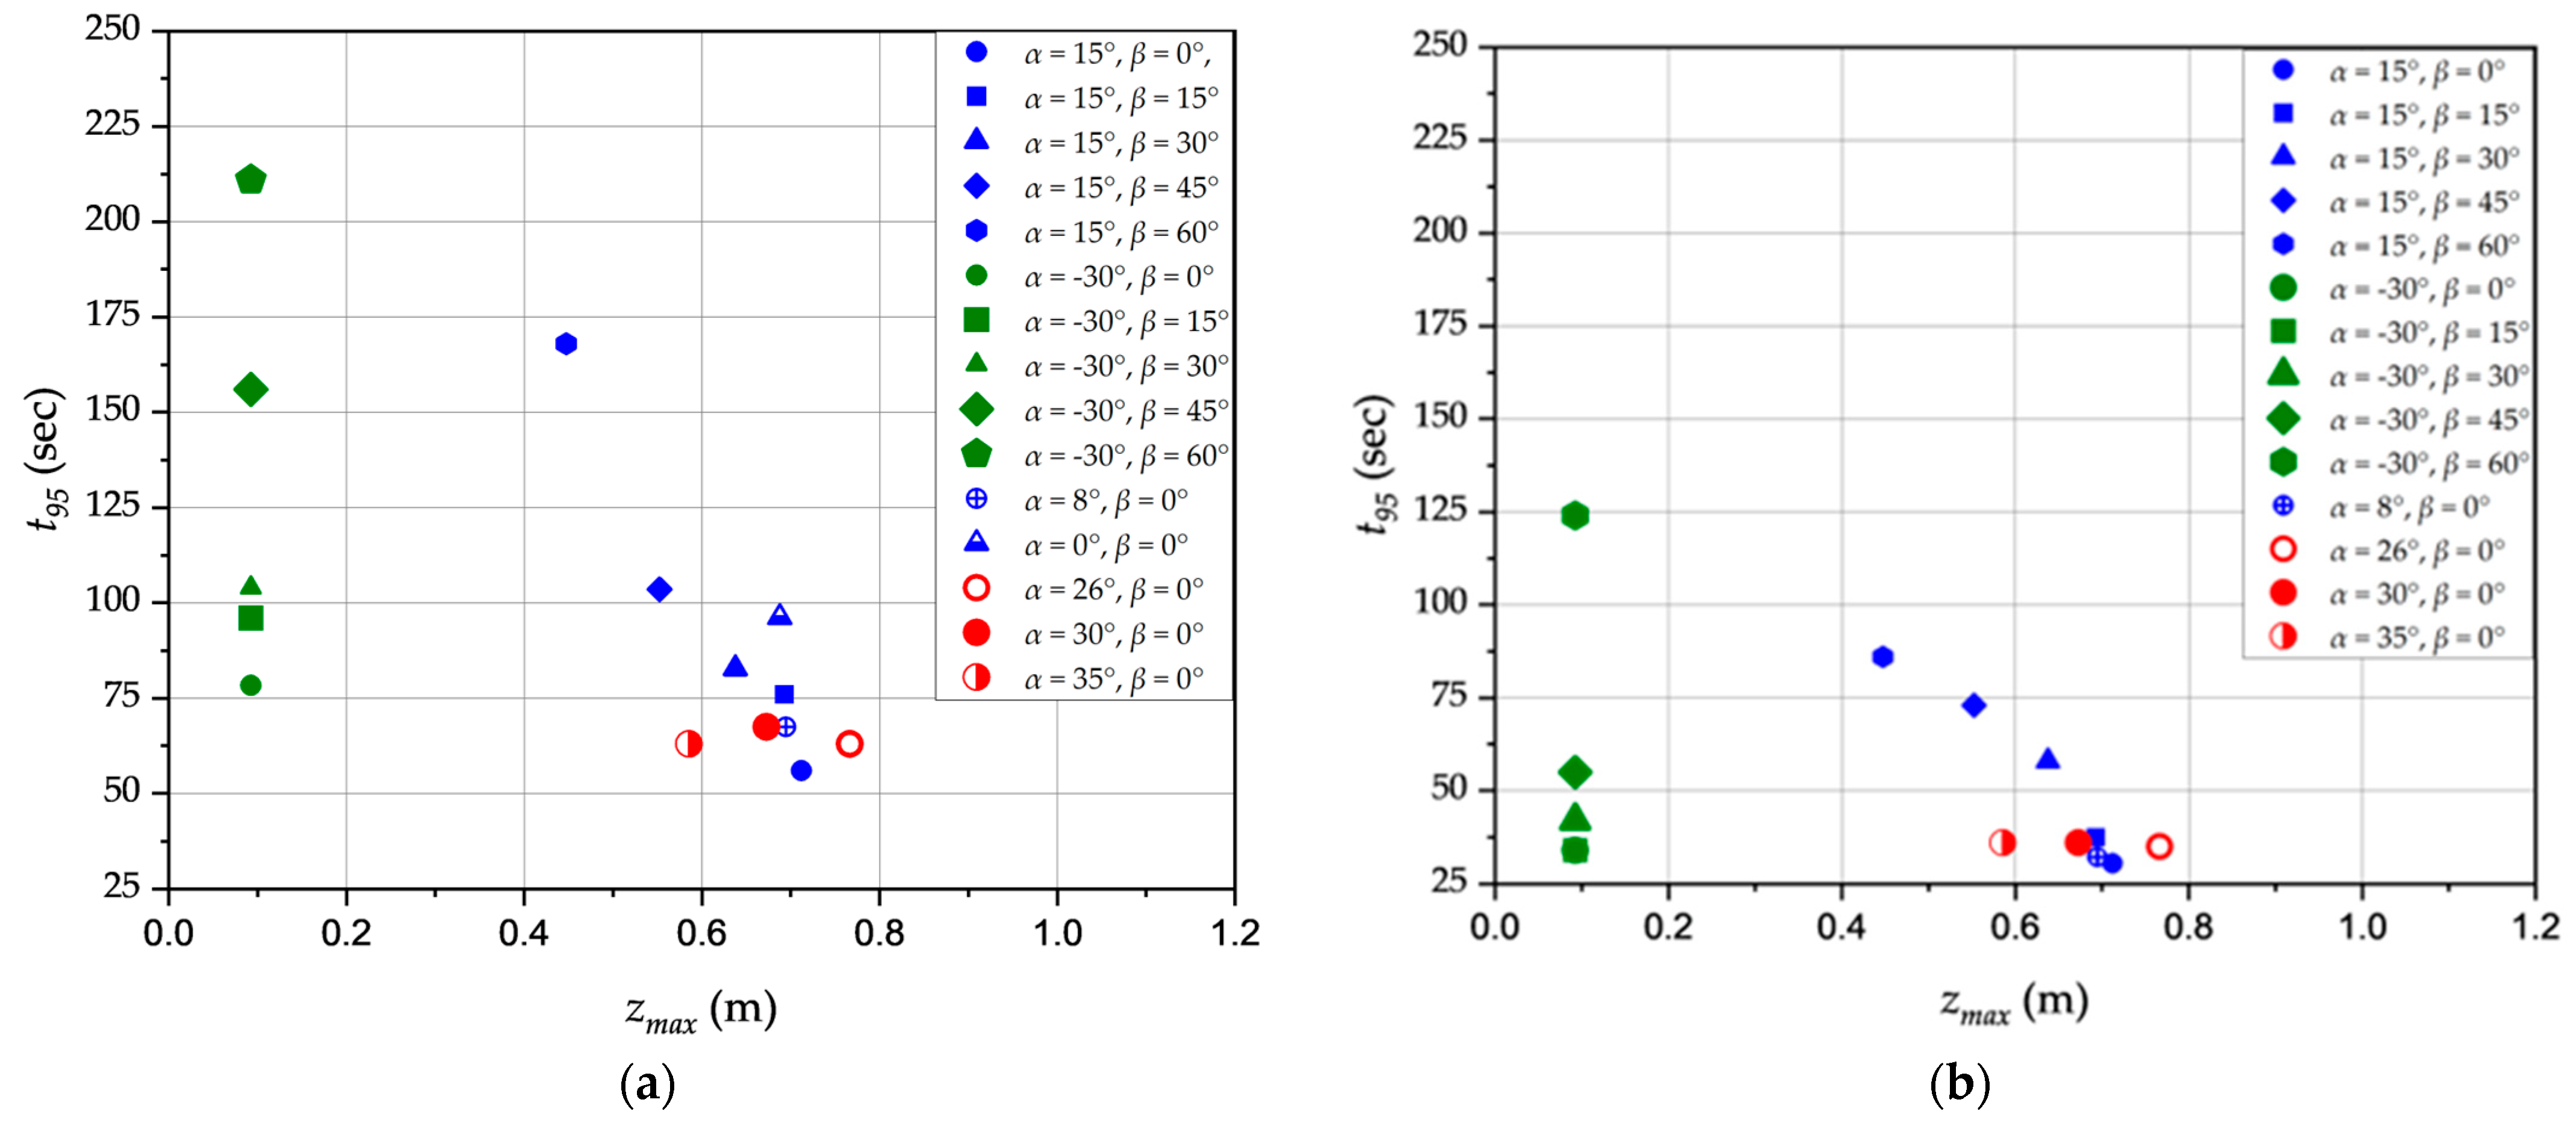
3.4. Impact of the Horizontal Position of the Jet Nozzle

Figure 9a shows the relationship between the coefficient 1/k appearing in Equation (9) and the horizontal inclination of the jet nozzle (β) for two specific values of α: 15° and 30°. 1/k appears to be more sensitive to β for the upwards-pointing nozzle with α = 15° than for the downwards-pointing nozzle with α = 30°. In the case of α = 15°, 1/k decreases from 2.06 to 0.7 (by 66%) as β varies from 15° to 60°. On the other hand, when α = 30°, 1/k decreases from 0.31 to 0.16 (i.e., by 48%) when β increases from 15° to 60°. Since 1/k and circulation time are directly related, these data show that fluid circulation is hindered (being slower) as β increases. As mentioned previously, the increase in circulation time can possibly be attributed to (i) less flow entrainment because the jet length decreases as β increases and/or (ii) an increased tangential velocity component in the flow. For the upwards-pointing jet, it is expected that both (i) and (ii) contribute to the increased circulation time, whilst for the downwards-pointing jet, only (ii) contributes since the jet length does not vary with β. Indeed, 1/k only varies slightly for the downwards-pointing jet, thereby showing that the jet length is the prime factor in flow entrainment and mixing. The indirect impact of 1/k and fluid circulation on mixing time is shown in Figure 9b for α values of 15° and 30° and β values ranging from 0° to 60°. As expected, mixing time increases as β increases since circulation is hindered.

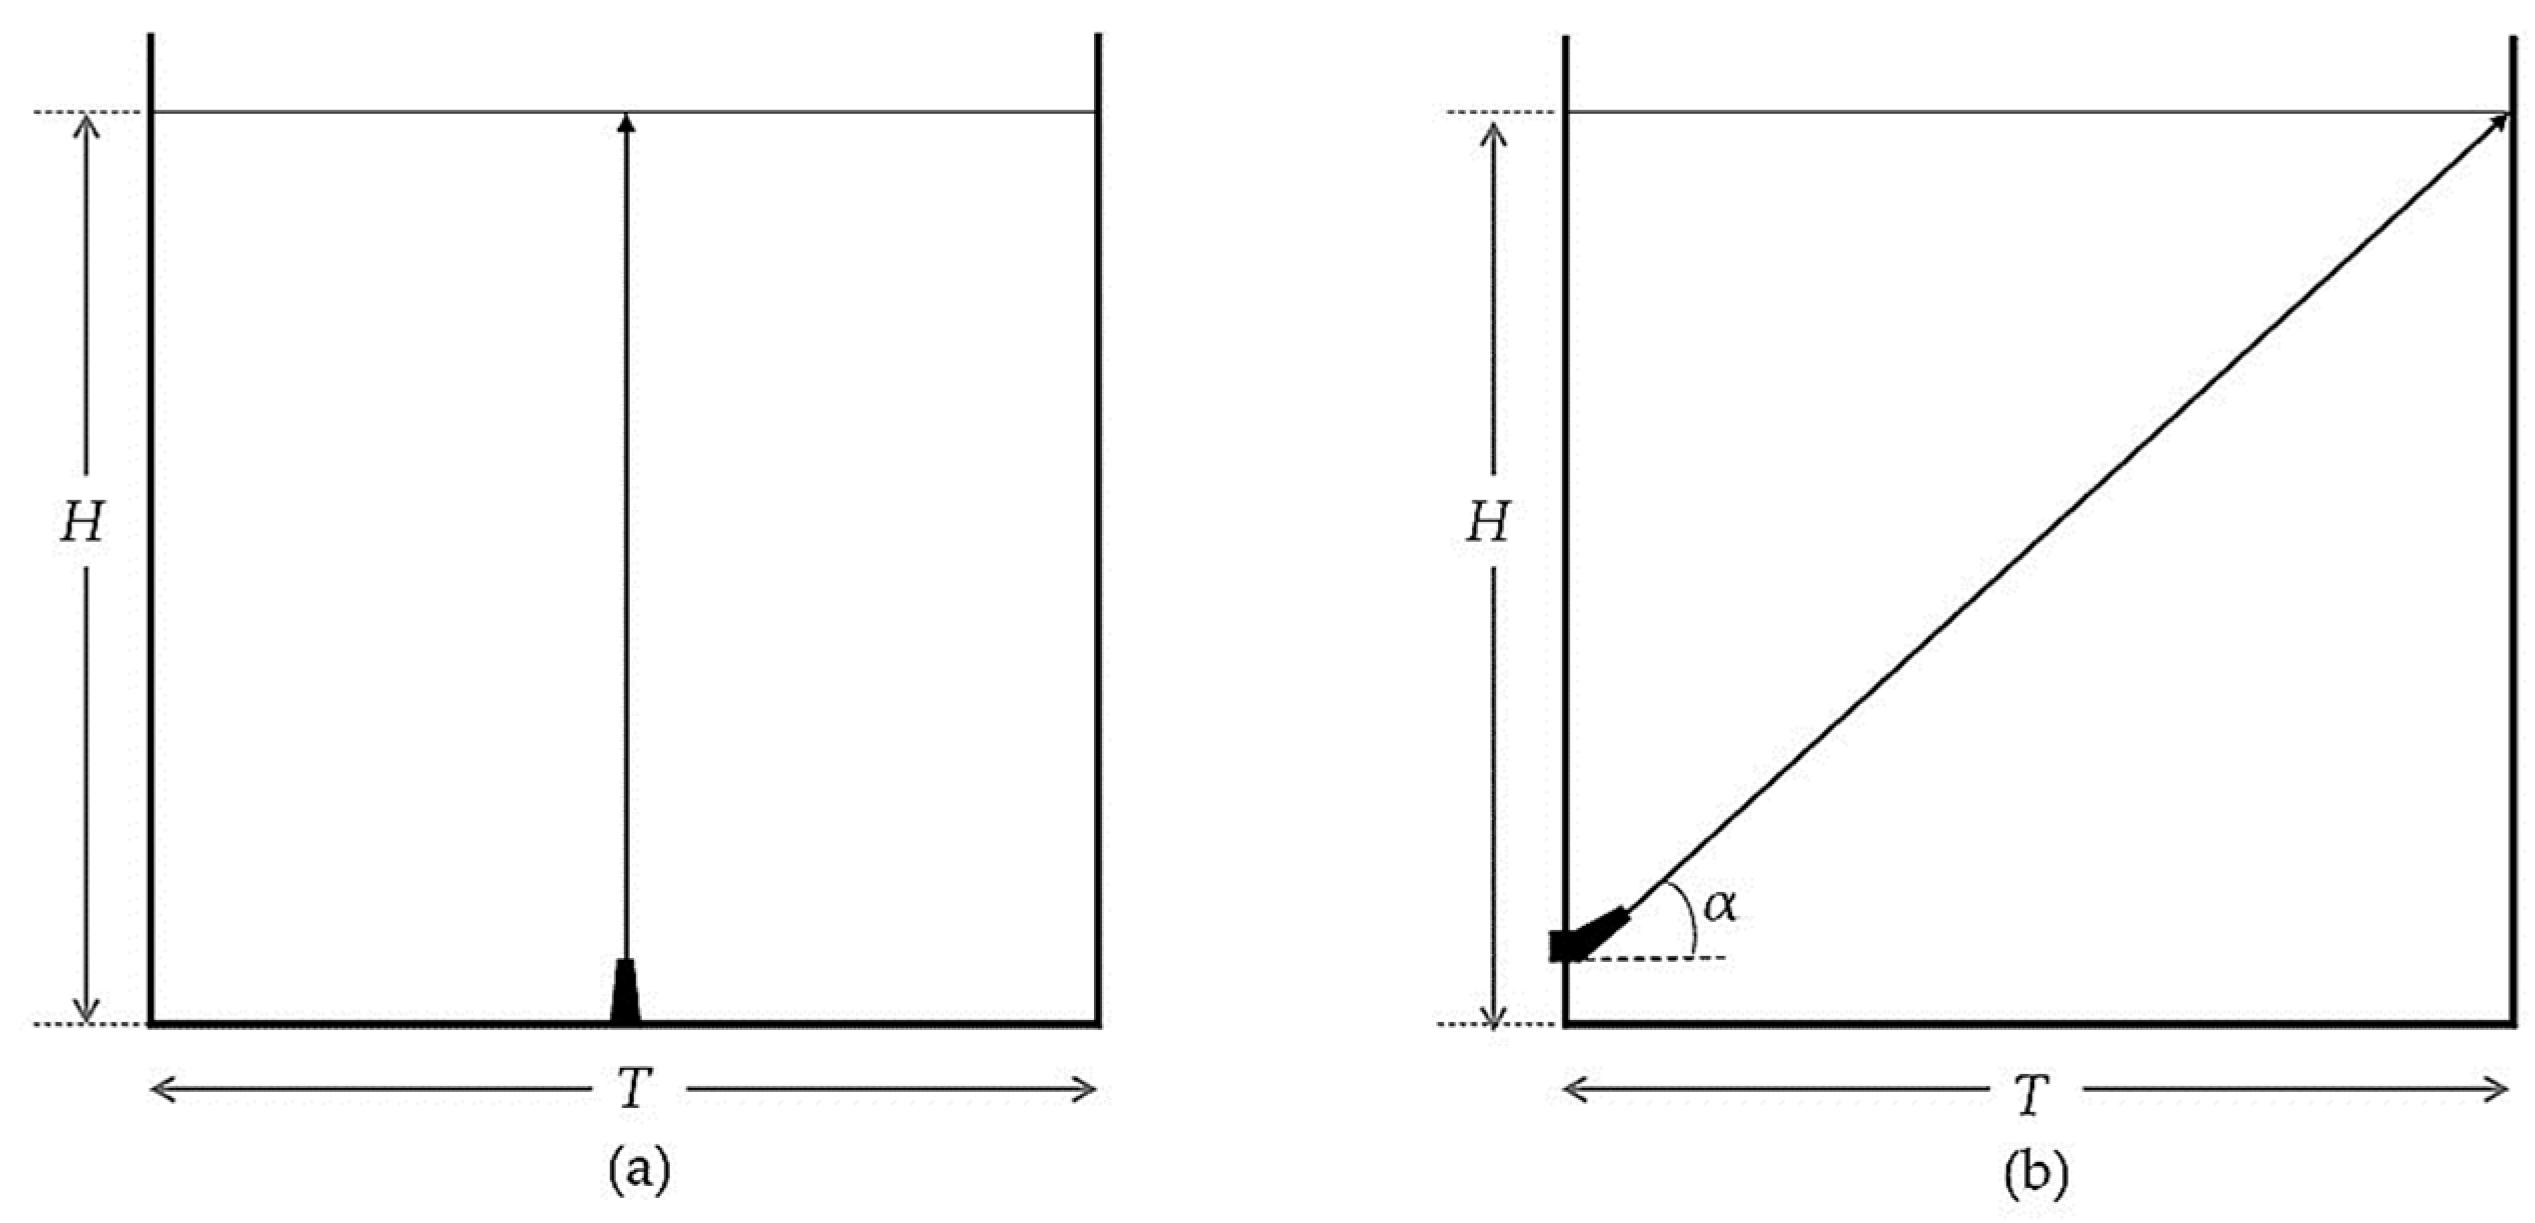
3.5. Impact of the Vertical Inclination of the Nozzle

Figure 10 shows the effect of the vertical inclination of the nozzle α on the mixing time t 95 at two different jet Reynolds numbers (24,900 and 49,900), with a nozzle diameter of 0.005 m and horizontal orientation β = 0. As expected, mixing is faster at higher Reynolds numbers, which is attributed to the increased entrainment rates of the bulk fluid. At Rej = 49,900, there is little impact of α on mixing time. However, at Rej of 24,900, mixing time is significantly affected by α. Indeed, mixing is slower when the jet is oriented towards the tank bottom or across the tank diameter compared with when it is upwards-pointing.
The results at Rej =24,900 indicate that when the jet impacts the free liquid surface (zone A), the mixing time is similar regardless of the inclination angle α. In contrast, when the jet impacts the side wall of the tank (zone B), mixing time decreases with increasing α. When the jet impacts the tank bottom (zone C), the mixing time is relatively high compared with upwards-pointing nozzle configurations. Previous research [18,20,24] has proposed that the most effective vertical inclination of the jet is when the free jet path length spans the diagonal of the tank volume. In the current setup, this corresponds to α = 26°. However, this study found that similar mixing times can be achieved for all vertical inclination angles of the nozzle except for horizontal- and downwards-pointing nozzles at the lower Reynolds number (Rej = 24,900).

3.6. Impact of the Free Jet Path Length on Mixing Time

The mixing time as a function of the free jet path length, which ranges from 0.0925 m to 0.72 m, is presented in Figure 11 for jet Reynolds numbers of 24,900 and 49,900. For both Reynolds numbers, an increase in the free jet path length leads to a decrease in mixing time for jet configurations where the jet impacts the side wall of the tank (blue symbols; zone B). This shows that the mixing process is mainly influenced by the entrained flow of the bulk fluid, which is proportional to the jet length. For jet installation positions with α = 30°, where the jet impacts the tank bottom (green symbols; zone C), the free jet path length is the same for all horizontal orientations (β values equal to 0°, 15°, 30°, 45°, and 60°). Like shown previously, as β increases, and the nozzle points further towards the side tank wall, mixing time increases. This shows that the free jet path length—and consequently circulation flow rate—is not the only factor controlling mixing time in jet-mixed vessels. It is believed that the flow patterns in the tank are significantly modified by the horizontal orientation of the jet nozzle, inducing a dominant tangential component of the flow as β increases and reducing the three-dimensional nature of the flow that is required for effective mixing. When the jet impinges on the liquid surface (red symbols; zone A) at angles α = 26°, 30°, and 35° and β = 0°, the free jet path length decreases, but there is no significant impact on mixing time.
Returning back to Grenville and Tilton’s [20] jet turbulence model, it can be shown that for α = 30°, the jet free path length remains constant (z = 0.0925 m) regardless of β value, and for the given flow conditions, ε z m a x z m a x 2 at the end of the jet path length is the same for all the values of β. However, Figure 7 shows that the mixing time varies significantly even with identical ε z m a x z m a x 2 . This again demonstrates that the constant of proportionality in Equations (16) and (17) may depend not only on the ratio ε z m a x z m a x 2 but also on the flow pattern induced by the nozzle orientation. This observation may also hold for circulation models that are based on the fluid entrainment rate into the jet spread along the jet path length, considering the differences in mixing time across jet nozzle positions with equal free jet path length (α = 30° and β = 0°, 15°, 30°, 45°, and 60°). The flow pattern induced by the nozzle orientation may affect the proportionality constant in Equations (18) and (19); the proportionality constant increases principally as β increases, while the vertical inclination of the nozzle has a relatively minor impact on this constant.

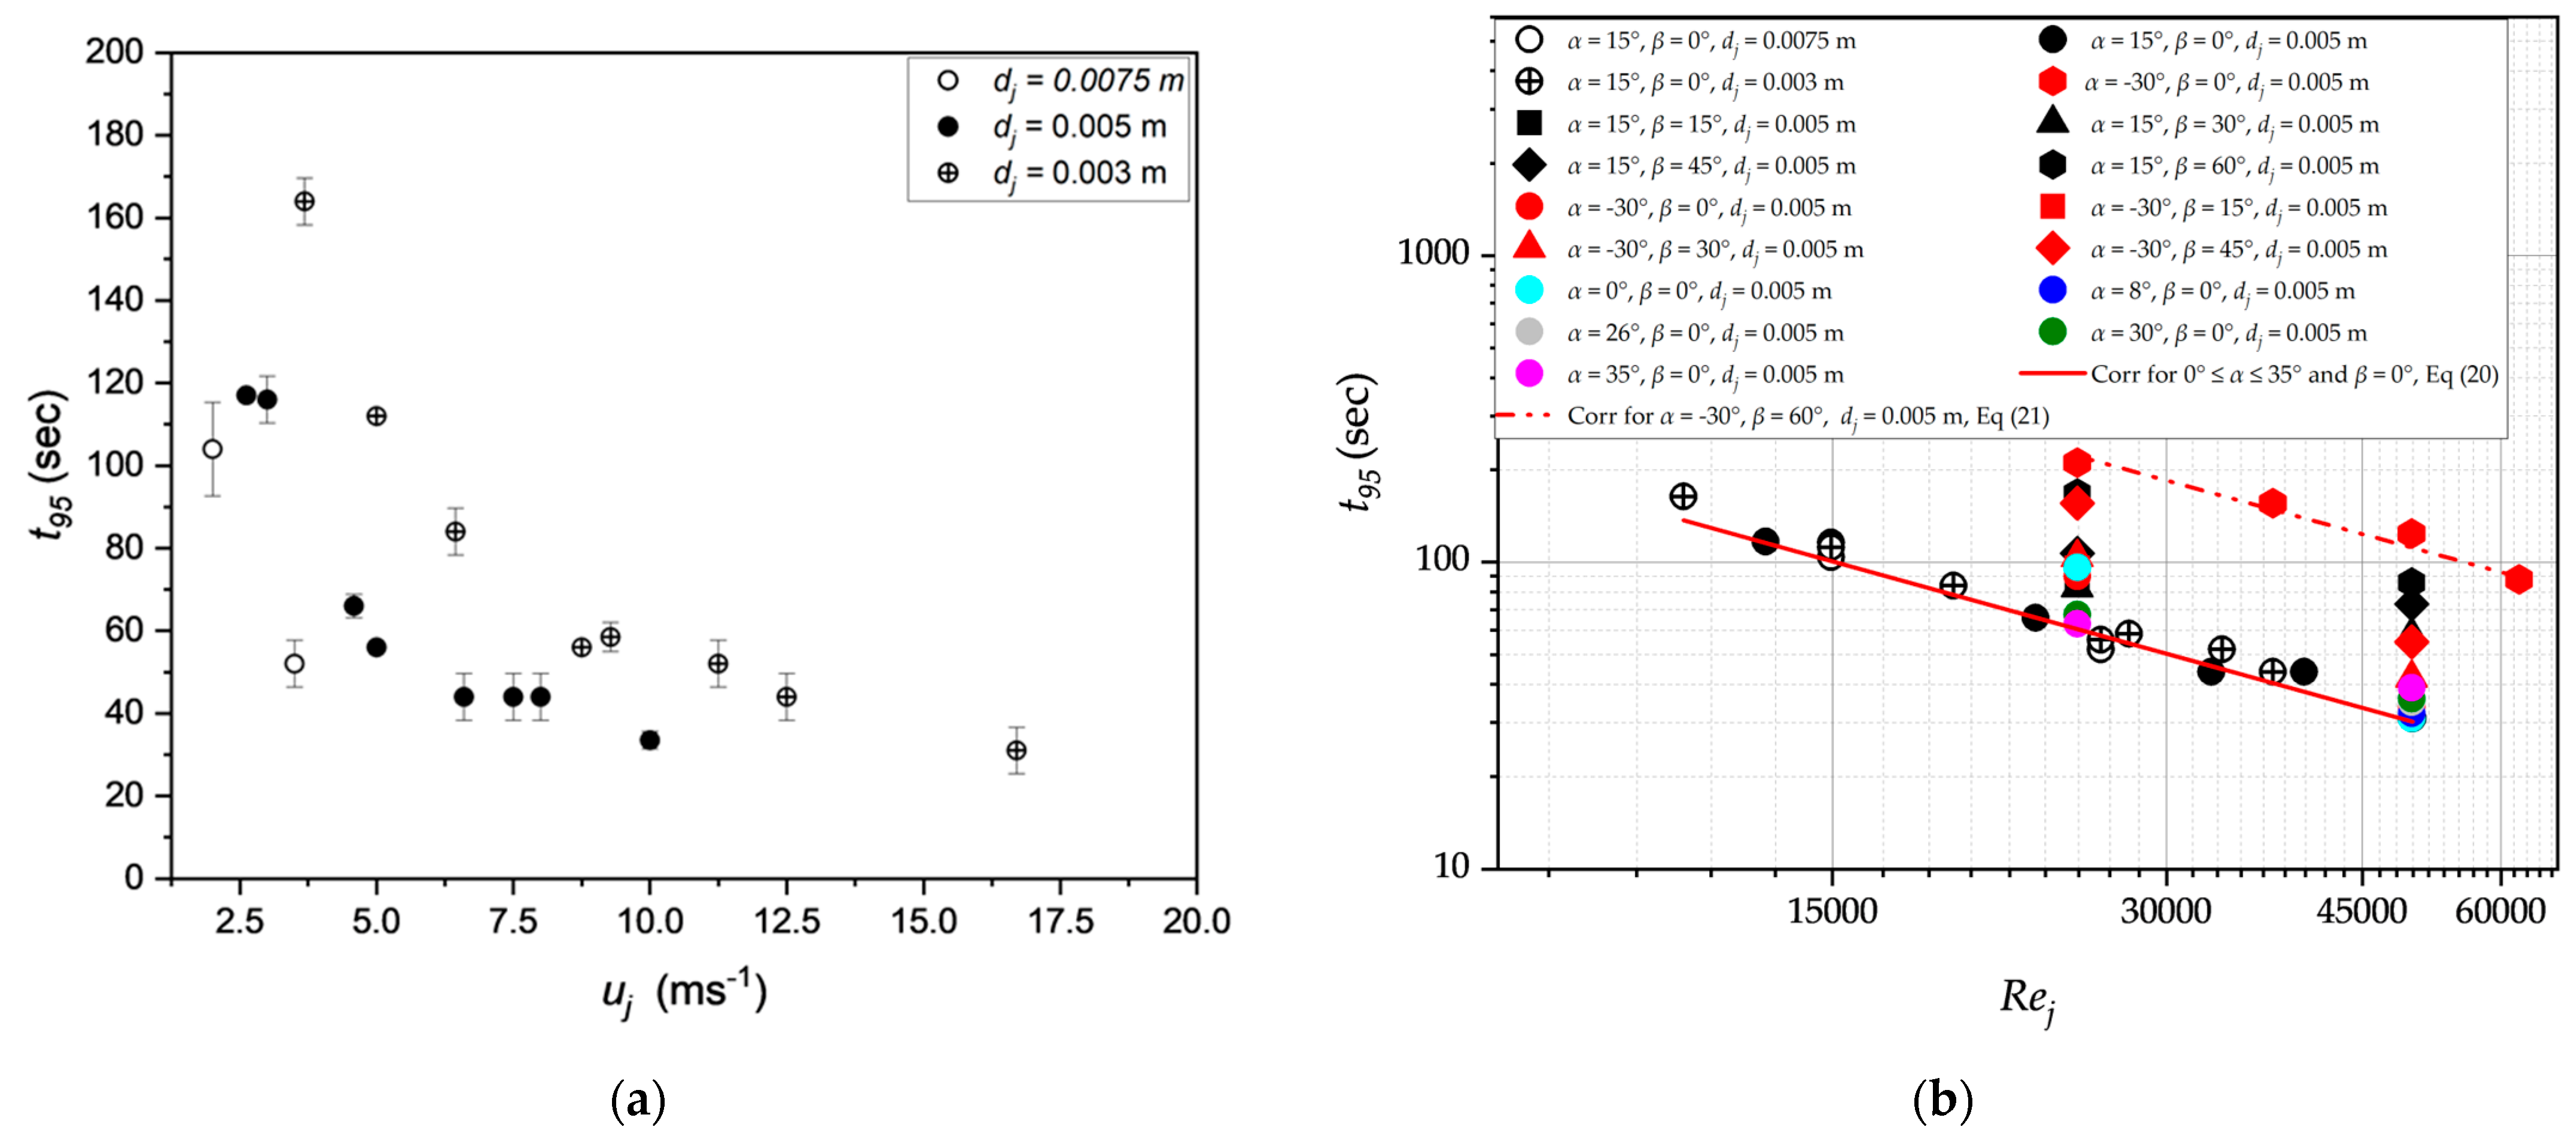
3.7. Impact of the jet Nozzle Diameter and Jet Inlet Velocity on Mixing Time

Figure 12a shows how the nozzle diameter and the inlet velocity affect mixing time, t 95 . It is not surprising that an increase in the velocity reduces mixing time for all nozzle diameters since Reynolds number is increased. Additionally, at a fixed velocity, mixing time is shown to decrease as nozzle diameter increases. The data show a three-fold increase in mixing time for a 0.003 m nozzle compared with a 0.0075 m nozzle at identical fluid velocities. Increased fluid circulation and mixing as well as turbulence at higher velocities likely explain the trend of decreasing mixing time. Improvements in mixing performance at constant velocity for different nozzle diameters are mostly due to increased flow rate as the nozzle diameter increases [10]. Figure 12b shows the mixing time obtained from various nozzle orientations as a function of the jet fluid Reynolds number, and it can be seen that mixing time is inversely proportional to the jet Reynolds number. Like observed in previous analyses, the mixing time data collapse for all upwards-pointing orientations when the jet spans the tank diameter, i.e., β = 0°. However, there is a shift in the data to longer mixing times at the equivalent Reynolds number as the jet is oriented towards the side tank wall or the tank bottom. This is clearly seen by the values of the proportionality constants in Equations (20) and (21) that indicate that a larger Reynolds number is required for the downwards-pointing nozzle with α = 30°, β = 60° to achieve an equivalent mixing time to that obtained with upwards-pointing nozzles with 0° ≤ α ≤ 35°, β = 0°.
t 95 = 1.51   ×   10 6 R e j
t 95 = 5.10   ×   10 6 R e j

3.8. Correlation of Mixing Time with Power Input and Flow Momentum

Figure 13a presents mixing time obtained with different nozzle diameters and orientations as a function of power per unit mass (Pj), as given by Equation (22). A power–law relationship is observed between t95 and Pj, resulting in Equations (23) and (24) for the nozzle configurations 0° ≤ α ≤ 35°, β = 0° and α = 30°, β = 60°.
P j = π 4 d j 2   u j 1 2 ρ u j 2 ρ V = π 8 d j 2   u j 3 V
t 95 = 1.50   P j 0.32
t 95 = 4.84   P j 0.32
The proportionality coefficients in Equations (23) and (24) reveal that a higher power per unit mass is required to mix in a tank with a downwards-pointing nozzle oriented at α = 30°, β = 60° compared with centrally aligned upwards-pointing nozzles (0° ≤ α ≤ 35°, β = 0°). Indeed, from the ensemble of data in Figure 13a, an increased power-per-unit mass is required when the nozzle points downwards or further towards the side-tank wall. This may stem from factors such as free jet path length, limited bulk fluid entrainment, and the flow pattern associated with the nozzle orientation, which have been discussed in previous sections of this article.
Of particular interest is the observation that the exponent on Pj in Equations (23) and (24) is approximately equal to −1/3, which is the same as that in Equations (16) and (17). This similarity arises because an increase in power per unit mass of the jet results in increased rates of turbulent energy dissipation.
Figure 13b shows mixing time as a function of jet flow momentum (G) as given by Equation (25) for all nozzle orientations. From Equation (26) (for nozzles with 0° ≤ α ≤ 35°, β = 0°) and (27) (for nozzles with α = 30°, β = 60°), it can be seen that mixing time is proportional to the inverse square root of jet flow momentum.
G = ρ u j 2 π d j 2 4
t 95 = 46.75 G 0.5
t 95 = 157.67 G 0.5
Like seen previously, the data for the centrally aligned upwards-pointing nozzles collapse, but higher momentum is required for downwards-pointing nozzles and for nozzles oriented towards the side wall of the tank.

4. Conclusions

This experimental study focuses on the impact of nozzle orientation—both vertical and horizontal inclination—on single-phase low-viscosity jet mixing in a tank. The effectiveness of different nozzle positions is evaluated by measuring mixing time using an inert tracer.
For upwards-pointing jets positioned across the tank diameter, mixing time was found to follow the jet turbulence model by Grenville and Tilton [20] and scales with ε z m a x z m a x 2 . The proportionality constant is in agreement with that found by Grenville and Tilton [20] for a range of vessel sizes and jets spanning the diagonal of the tank. If the horizontal inclination of the nozzle β was increased, or the nozzle was downwards-pointing, mixing time was still found to correlate with ε z m a x z m a x 2 , but the proportionality constant was modified. Mixing is typically worse with a downwards-pointing nozzle or as the nozzle is oriented further towards the side wall of the tank.
Based on analyses using the circulation model by Marayuma et al. [17], mixing time was also found to scale with circulation time for upwards-pointing jets positioned across the tank diameter, and the proportionality constant is in agreement with that found by Marayuma et al. [17]. Like for the jet turbulence model, if the horizontal inclination of the nozzle β is increased or the nozzle is downwards-pointing, mixing time still correlates with circulation time, but the proportionality constant is modified. A larger number of turnovers of the fluid in the tank are required to mix the contents when the nozzle points further towards the side wall of the tank.
Shorter mixing times can be attributed principally to longer jet path lengths and therefore higher fluid entrainment and circulation as well as higher dissipation rates per jet length squared. Generally, centrally aligned upwards-pointing nozzles provide faster and more efficient mixing. Mixing performance is less effective and efficient with downwards-pointing nozzles and when nozzles are oriented towards the side wall of the tank.
There appear to be several ways to correlate mixing time data, ε z m a x z m a x 2 ; circulation time; jet Reynolds number; power per unit mass; and momentum. Mixing times for all centrally aligned upwards-pointing nozzles were found to collapse with all of the above variables but did not for other nozzle configurations (downwards-pointing and wall-oriented jets). It is suspected that the three-dimensional nature of the flow pattern is significantly modified in the latter cases, thereby impacting the dominance of tangential flow and the mixing mechanism.

Author Contributions

Conceptualization, C.X., M.P., J.A. and T.A.O.; methodology, T.A.O.; validation T.A.O., J.A. and M.P.; formal analysis, T.A.O.; investigation, T.A.O.; data curation, T.A.O.; writing—original draft preparation, T.A.O.; writing—review and editing, T.A.O., J.A. and M.P.; supervision, C.X., J.A. and M.P.; project administration, M.P.; funding acquisition, C.X. and T.A.O. All authors have read and agreed to the published version of the manuscript.

Funding

This research was funded by PETROLEUM TECHNOLOGY DEVELOPMENT FUND, Nigeria (PTDF/ED/OSS/PHD/TAO/1460/19), and Laboratoire de Génie Chimique, Toulouse.

Data Availability Statement

The data presented in this study are available on request from the corresponding author. The data are not publicly available due to privacy.

Acknowledgments

This project has received funding from Petroleum Technology Development Fund, Nigeria.

Conflicts of Interest

The authors declare no conflict of interest.

Nomenclature

CiInitial concentration (Moldm−3)
C Final concentration (Moldm−3)
djJet nozzle diameter (m)
dzJet spread diameter at z (m)
fFrequency (s−1)
FrFroude number Fr = u j 2 d j g
GJet flow momentum (N)
gGravitational force (m/s2)
HLiquid height (m)
hNNozzle clearance from tank bottom (m)
hoOutlet clearance from tank bottom (m)
kEntrainment rate model constant
Lintegral scale of concentration fluctuations (m)
PjJet power per unit volume (Watts/kg)
QJet nozzle discharge flow rate (m3/s)
QE(zmax)Jet entrainment rate within the jet spread across the free jet path length (m3/s)
QTTotal volumetric flow rate of the bulk volume (m3/s)
RejJet fluid Reynolds number Rej = ρ u j d j μ
tmMixing time (s)
tcMean circulation time due to entrainment within the jet spread around zmax (s)
tRBulk fluid residence time (s)
t9595% mixing time (s)
TTank diameter (m)
ujJet inlet velocity (m/s)
uzJet velocity at z (m/s)
VBulk fluid volume (m3)
XNJet nozzle clearance from the side wall (m)
zDistance from the nozzle in the axis of the jet (m)
zmaxFree jet path length as the jet impinges on the liquid surface, side tank wall, or tank bottom (m)
Greek Symbols
εjTurbulent energy dissipation rate at the jet inlet (m2/s3)
ε z m a x Turbulent energy dissipation rate at z m a x (m2/s3)
ρ Density (kg/m3)
µViscosity (Pa·s)
αJet nozzle vertical inclination (°)
αuLJet nozzle vertical inclination upper limit (°)
αLLJet nozzle vertical inclination lower limit (°)
βJet nozzle horizontal position (°)
δFox and Gex correlation constant
φCirculation model constant

References

  1. Wasewar, K.L.; Sarathi, J.V. CFD Modelling and Simulation of Jet Mixed Tanks. Eng. Appl. Comput. Fluid Mech. 2008, 2, 155–171. [Google Scholar] [CrossRef] [Green Version]
  2. Randive, P.S.; Singh, D.D.P.; Varghese, D.V.; Badar, D.A.M. Study of Jet Mixing in Flocculation Process. Int. J. Multidiscip. Res. 2018, 6, 10. [Google Scholar]
  3. Wasewar, K.L. A Design of Jet Mixed Tank. Chem. Biochem. Eng. Q. 2006, 20, 31–45. [Google Scholar]
  4. Patwardhan, A.W.; Thatte, A.R. Process Design Aspects of Jet Mixers. Can. J. Chem. Eng. 2008, 82, 198–205. [Google Scholar] [CrossRef]
  5. Revill, B.K. Chapter 9—Jet mixing. In Mixing in the Process Industries; Harnby, N., Edwards, M.F., Nienow, A.W., Eds.; Butterworth-Heinemann: Oxford, UK, 1992; pp. 159–183. [Google Scholar]
  6. Abdel-Rahman, A. A Review of Effects of Initial and Boundary Conditions on Turbulent Jets. WSEAS Trans. Fluid Mech. 2010, 4, 257–275. [Google Scholar]
  7. Tilton, J.N. Perry’s Chemical Engineers’ Handbook: Fluid and Particle Dynamics; McGraw-Hill: New York, NY, USA, 2008. [Google Scholar]
  8. Fielder, H.E. Control of free turbulent shear flows. In Flow Control: Fundamentals and Practices; El-Hak, M.G., Pollard, A., Bonnet, J.P., Eds.; Springer: Berlin/Heidelberg, Germany, 1998; pp. 335–429. [Google Scholar]
  9. Rajaratnam, N. Turbulent mixing and diffusion of Jets. In Encyclopedia Fluid of Mechanics; Cheremisinoff, Ed.; Gulf Publishing: Houston, TX, USA, 1986; Volume 2, Chapter 15; pp. 391–404. [Google Scholar]
  10. Patwardhan, A.W.; Gaikwad, S.G. Mixing in Tanks Agitated by Jets. Chem. Eng. Res. Des. 2003, 81, 211–220. [Google Scholar] [CrossRef]
  11. Cabaret, F.; Rivera, C.; Fradette, L.; Heniche, M.; Tanguy, P.A. Hydrodynamics performance of a dual shaft mixer with viscous Newtonian liquids. Chem. Eng. Res. Des. 2007, 85, 583–590. [Google Scholar] [CrossRef]
  12. Fosset, H.; Mech, E.M.I. The action of free jets in mixing of fluids. Trans. Inst. Chem Eng. 1951, 29, 322. [Google Scholar]
  13. Fox, E.A.; Gex, V.E. Single-phase blending of liquids. AIChE J. 1956, 2, 539–544. [Google Scholar] [CrossRef]
  14. Okita, N.; Oyama, Y. Mixing Characteristics in Jet Mixing. Chem. Eng. 1963, 27, 252–260. [Google Scholar] [CrossRef] [Green Version]
  15. Rajaratnam, N. Turbulent Jets; Elsevier Scientific Publishing, Co.: Amsterdam, The Netherlands, 1976. [Google Scholar]
  16. Ricou, F.P.; Spalding, D.B. Measurements of entrainment by axisymmetrical turbulent jets. J. Fluid Mech. 1961, 11, 21–32. [Google Scholar] [CrossRef]
  17. Maruyama, T.; Ban, Y.; Mizushina, T. Jet mixing of fluids in tanks. J. Chem. Eng. Jpn. 1982, 15, 342–348. [Google Scholar] [CrossRef] [Green Version]
  18. Grenville, R.; Tilton, J.N. Turbulence for flow as a predictor of blend time in turbulent jet mixed vessels. In Proceedings of the Nineth European Conference on Mixing, Paris, France, 18–21 March 1997; pp. 67–74. [Google Scholar]
  19. Corrsin, S. The isotopic turbulent mixer: Part II Arbitrary Schmidt number. AIChE J. 1964, 10, 870–877. [Google Scholar] [CrossRef]
  20. Grenville, R.K.; Tilton, J.N. A new theory improves the correlation of blend time data from turbulent jet mixed vessels. Chem. Eng. Res. Des. 1996, 74, 390–396. [Google Scholar]
  21. Sotiriadis, T.; Firmansyah, T. Dawson Mixing of Sludges with Liquid Jets. J. Chart. Inst. Water Environ. Manag. 2006. preprint. [Google Scholar]
  22. Handbook of Industrial Mixing: Science and Practice; Paul, E.L.; Atiemo-Obeng, V.A.; Kresta, S.M. (Eds.) Wiley-Interscience: Hoboken, NJ, USA, 2004. [Google Scholar]
  23. Perona, J.J.; Hylton, T.D.; Youngblood, E.L.; Cummins, R.L. Jet Mixing of Liquids in Long Horizontal Cylindrical Tanks. Ind. Eng. Chem. Res. 1998, 37, 1478–1482. [Google Scholar] [CrossRef]
  24. Grenville, R.K.; Tilton, J.N. Jet mixing in tall tanks: Comparison of methods for predicting blend times. Chem. Eng. Res. Des. 2011, 89, 2501–2506. [Google Scholar] [CrossRef]
Figure 1. Jet paths for (a) an axial jet and (b) a side-entry jet with vertical inclination angle α.
Processes 11 02200 g001
Figure 2. Schematic diagram of the cylindrical tank, the nozzle position, and the position of the spectrophotometry probes (p0, p1, and p2). (a) Side view. (b) Top view.
Processes 11 02200 g002
Figure 3. Jet nozzle orientations: (a) vertical inclination (α) (positive α corresponds to an upwards-pointing nozzle, and negative α corresponds to a downwards-pointing nozzle) and (b) horizontal orientation angle (β) (the nozzle points across the tank diameter when β = 0° and points towards the side wall when β > 0°).
Processes 11 02200 g003
Figure 4. Schematic diagram of the jet path length for different vertical jet nozzle inclinations.
Processes 11 02200 g004
Figure 5. Comparison of experimental mixing time data for upwards-pointing nozzles (0° ≤ α ≤ 35° and β = 0°) with mixing time calculated by the previous correlations [12,13,14] and models [17,18,20].
Processes 11 02200 g005
Figure 6. Comparison of experimental mixing time data for a downwards-pointing nozzle (α = −30° and β = 60°) with mixing time calculated by the previous correlations [12,13,14] and models [17,20].
Processes 11 02200 g006
Figure 7. Mixing time (t95) versus ε z m a x z m a x 2 for Rej = 15,000 to 62,000.
Processes 11 02200 g007
Figure 8. Mixing time (t95) as a function of circulation time ( t C ) at Rej = 15,000–62,300.
Processes 11 02200 g008
Figure 9. (a) Value of coefficient 1/k as a function of the horizontal orientation β of the nozzle; (b) impact of the horizontal orientation β of the nozzle on mixing time t95.
Processes 11 02200 g009
Figure 10. Impact of the vertical inclination of the jet nozzle (α) on mixing time (t95) at fixed horizontal orientation (β = 0) for dj = 0.005 m.
Processes 11 02200 g010
Figure 11. Mixing time (t95) as a function of maximum jet length for dj = 0.005 m and for various nozzle positions at (a) Rej = 24,900 and (b) Rej = 49,900.
Processes 11 02200 g011
Figure 12. Mixing time t95 (a) as a function of jet velocities for dj = 0.003 m, 0.005 m, and 0.0075 m with nozzle orientations of α = 15° and β = 0° (b) as a function of Rej: (15,000 Rej  62,000).
Processes 11 02200 g012
Figure 13. Mixing time t95 as a function of (a) specific power input and (b) jet flow momentum.
Processes 11 02200 g013
Table 1. Dimensions of the tank and nozzle for the experimental setup.
ParameterSymbolValue (m)
Tank diameterT0.780
Liquid heightH0.390
Nozzle diameterdj0.003, 0.005, 0.0075
Nozzle clearance from side wallXN0.085
Nozzle clearance from tank bottomhN0.050
Outlet clearancehO0.192
Vertical inclination of nozzleα 35 ° ,   30 ° ,   26 ° ,   15 ° ,   8 ° ,   0 ° , 30 °
Horizontal inclination of nozzleβ0°, 15°, 30°, 45°, 60°
Table 2. Values of 1/k used in the circulation model for various nozzle positions.
α (°)β (°)dj (m)zmax (m) t c t R d j z m a x = 1 / k
−3000.0050.0930.32
150.0050.0930.31
300.0050.0930.264
450.0050.0930.193
600.0050.0930.164
1500.00750.7202.06
00.0050.7122.06
00.0030.7072.06
150.0050.69302.06
300.0050.6381.46
450.0050.5521.10
600.0050.4470.70
000.0050.6881.88
800.0050.6941.61
2600.0050.7661.22 *
3000.0050.6731.22 *
3500.0050.5851.22 *
* Averaged k value from similar tank geometries and nozzle positions from Maruyama et al. [17].
Disclaimer/Publisher’s Note: The statements, opinions and data contained in all publications are solely those of the individual author(s) and contributor(s) and not of MDPI and/or the editor(s). MDPI and/or the editor(s) disclaim responsibility for any injury to people or property resulting from any ideas, methods, instructions or products referred to in the content.

