Abstract
Saturated hydrocarbons are widely used in the valuation of source rocks and oils, but the applicability of related parameters has received less attention. Based on the thermal simulation experiments on Mesozoic source rocks in the Yingen-Ejinaqi Basin, and the GC-MS analysis of the saturated hydrocarbon fractions of the expelled oils and extracts from solid residues, the applicability of the parameters related to lacustrine source rocks and oil were discussed. The results indicated that: Controlled by thermal degradation, both the relative abundance of the tricyclic terpenoids in terpenoids and the pregnane (including L pregnane) in steroids increased with the increase in maturity. Maturity had little effect on some environmental parameters of lacustrine source rocks and oils, such as Pr/Ph and gammacerane index, they were still effective even at the high-over maturity stage. But maturity had a significant influence on the method of using saturated hydrocarbons to identify the source of organic matter, because only at the thermal stage of Ro < 1.45%, might it effectively identify the source of organic matter by using the dominant peak of n-alkanes method and the relative abundance of C27–C29 steranes method. Most saturated hydrocarbon maturity parameters had their valid scope of application, such as C29 20S/(20S + 20R) steranes, C29αββ/(ααα + αββ) steranes and C31αβ22S/(22S + 22R) homohopanes were only effective when the Ro value was below 2.06%, for the parameter’s value would be “inverted” in the stage of over-maturity (Ro > 2.06%). However, the parameter Ts/(Ts + Tm) was effective in the whole thermal evolution process, reflecting good applicability. This study clarifies the validity of the application of commonly used saturated hydrocarbon parameters, and it can provide some reference for relevant studies.
1. Introduction
Molecular markers refer to a kind of compound that exists in sediments and petroleum and carries information related to the biological, chemical, physical and geological processes it has experienced, by virtue of its molecular stereochemical structure, series combination patterns, isotopic composition characteristics, etc. [1]. Molecular markers are widely used in the study of organic geochemistry because they contain abundant information [2,3,4,5]. Saturated hydrocarbon biomarkers are the most widely used molecular markers, and its research degree is higher than others. Based on the exploration of the distribution law of the saturated hydrocarbons, many parameters have been established, and the parameters are widely used to indicate the characteristics of organic matter source, sedimentary paleoenvironment, maturity, etc. [6,7,8,9]. For example, the parameters commonly used in the study of organic matter sources are nC21−/nC22+, C27/C29 steranes, etc. [6,7,10]. The parameters commonly used to indicate the paleoenvironment of organic matter deposition are Pr/Ph, gammacerane index (gammacerane/C30 hopane), etc. [6,7,11]. The maturity parameters mainly include C2920S/(20S + 20R) steranes, C29αββ/(ααα + αββ) steranes, Ts/(Ts + Tm) trisnorhopanes, C31αβ22S/(22S + 22R) homohopane, etc. [7,12,13,14,15]. These parameters were widely used in the evaluation of source rocks and oils, but the applicability had not received enough attention. A few scholars have discussed the application effectiveness of some saturated hydrocarbon parameters, but their understanding of the scope of application varied greatly [1,16,17]. Taking the maturity parameter C2920S/(20S + 20R) steranes for example, Sun et al. [16] based on thermal simulation experiments and believed that the parameter was still effective in the high maturity stage. Zhao et al. [15] believed that this parameter would reach an equilibrium value when the vitrinite reflectance (Ro) is approximately equal to 0.8%, and it could not indicate the maturity of higher mature source rocks and oils.
Lacustrine source rocks are widely distributed, especially in the Mesozoic of northern China. Lacustrine deposits are a field of interest for petroleum exploration and exploitation in China, with several large oil fields having been discovered in these lacustrine basins such as the Ordos, Songliao, Bohaiwan, etc. [18,19,20,21,22]. Compared with the marine source rocks, the heterogeneity of lacustrine source rocks is stronger, the influencing factors on saturated hydrocarbon parameters are more complex, and the same is true for the oils generated by lacustrine source rocks [23,24,25]. The extensive application of saturated hydrocarbon parameters to lacustrine source rocks/oils makes it highly necessary to study their applicability, but the strong heterogeneity of lacustrine organic matter also brings great difficulties to the related study.
Thermal simulation experiments not only make it possible to study the characteristics of hydrocarbon generation and expulsion of source rocks but also provide an effective way to study the applicability of biomarker parameters [26,27,28,29]. We can establish an immature to over-mature thermal evolution sequence by analyzing the experimental residues and hydrocarbon generation products at different temperature points. Then, we can conduct research on the evolution characteristics of biomarkers and the applicability of some parameters to source rocks/oils [30,31,32,33,34]. What is more important, compared with the study using many source rock/oil samples in a certain area, thermal simulation experiments provide an effective way to study the pure same type source rocks and extreme homologous oils.
In this study, saturated hydrocarbon biomarker parameters were evaluated by closed-system pyrolysis experiments using a Mesozoic lacustrine source rock from the Yingen-Ejinaqi Basin, thereby assuring a uniform source. Pulverized rock aliquots (200 mg) were reacted with water at temperatures ranging from 250 to 550 °C at 5 °C/min and the saturated hydrocarbon fractions of expelled oils and extracts of the solid residue were analyzed by GC-MS. The research results will have a good guiding significance for the application of biomarker parameters to lacustrine source rocks/crude oil.
2. Samples and Methods
2.1. Samples
The Yingen-Ejinaqi Basin is located in the Inner Mongolia Autonomous Region of northwest China (Figure 1a), which is a Mesozoic rift basin developed on the Precambrian crystalline block and Paleozoic fold basement [35,36,37,38,39]. Suhongtu depression (longitude 102°05′–106°10′, latitude 40°50′–41°50′) is a secondary tectonic unit of Yingen-Ejinaqi Basin, which is located in the north part of the basin (Figure 1b) [40,41]. The sedimentary strata of the Suhongtu depression include the Lower Cretaceous Bayingobi formation (K1b), Suhongtu formation (K1s) and Yingen formation (K1y), the Upper Cretaceous Wulansuhai formation (K2w) and the Quaternary from bottom to top. The main exploration target Bayingobi formation can be divided into three sections, namely the first member of the Bayingobi formation (K1b1), the second member of the Bayingobi formation (K1b2) and the third member of the Bayingobi formation (K1b3) from bottom to top, respectively (Figure 1c) [36,40,41]. Among them, K1b2 was mainly formed in a deep-semi deep lake environment, dominated by fine sediment, and formed the main source rock within the basin [42,43,44,45]. The lithology of the source rocks in this formation was mainly dark gray-black limestone, which had a good hydrocarbon generation potential. The samples in this study were collected from well H2 in the Suhongtu depression, the lithology of the samples was dark grey limestone and developed in K1b2 (Figure 1c).
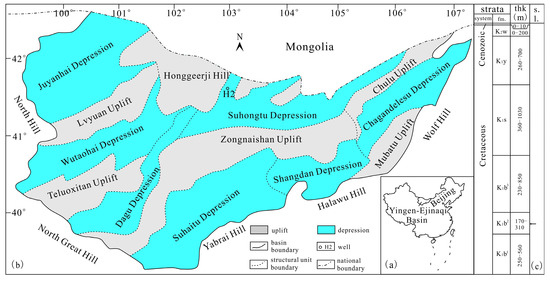
Figure 1.
Generalized map showing location (a), structural unit division (b), and stratigraphic column (c) of Yingen-Ejinaqi Basin, Sample locations are also plotted in the map, fm. = formation, thk = thickness, s.l. = sampling locations(the sampling locations was pointed by ‘←’).
Based on the previous test and analysis data, the geochemical characteristics of the sample were known, as the data listed in Table 1. Total organic carbon content (TOC) of the sample was 6.05%, the Rock-Eval parameters S1 + S2 value (hydrocarbon generation potential) and Tmax value were 14.34 mg/g and 436 °C, respectively, the chloroform bitumen “A” contents were 0.3355%, the δ13CPDB of chloroform bitumen “A” content was −28.4‰, the hydrogen index (HI) was 222 mgCO2/gTOC, and the measured Ro value was 0.56%. According to the “Geochemical evaluation standard of terrestrial hydrocarbon source rock” [46], the sample was a type II2 kerogen (Figure 2a,b) and low-mature source rock with extremely high organic matter abundance.

Table 1.
Organic geochemical characteristics of the source rock sample in this study.
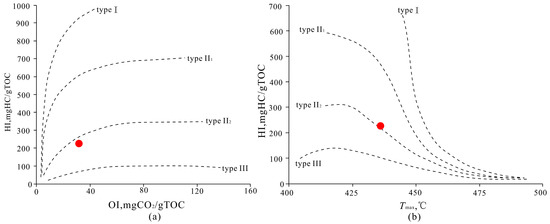
Figure 2.
HI versus OI cross plot (a) and HI versus Tmax cross plot (b), showing the type of organic matter of the sample, red dot represents the data projection point of the sample.
2.2. Closed System Thermal Simulation Experiments
In order to obtain source rock and oil samples with different maturities, thermal simulation experiments (also called hydrocarbon generation and expulsion simulation experiments) were carried out on the collected samples in a closed system, and the device was the SPY-4 HTHP (high-temperature and high-pressure) simulator. Samples were crushed into particles with a size of fewer than 80 meshes, and the particles were mixed evenly, all these to ensure a complete hydrocarbon generation reaction of samples. The material selected for the reactors was KA4145 high-temperature and high-strength alloy steel, with an inner diameter of 25 mm, and a height of 90 mm. Each target temperature point used a high-temperature and high-pressure reactor filled with the crushed samples, and the weight of each sample was 200 mg. Each reactor was filled with a certain amount of distilled water, and the mass ratio of sample to water was 5:1. Then the reactor was sealed and put into a heating furnace for a thermal simulation experiment of hydrocarbon generation and expulsion. The 10 target temperature points were set, they were 250 °C, 300 °C, 350 °C, 375 °C, 400 °C, 425 °C, 450 °C, 475 °C, 500 °C and 550 °C, respectively. The reactors were heated from the room temperature to the target temperature and maintained for 24 h, the heating rate was 5 °C/min. At the end of the experiments, the valves were opened, the liquid hydrocarbon products expelled from the experiment were collected, and cooled in distilled water, and extracted the liquid hydrocarbons in distilled water with dichloromethane, these liquid hydrocarbons were recorded as expelled oil 1. After the reactor cooled down, we opened the reactor and collected the residual samples, the solid residues at different temperatures represent source rock samples with different maturities. At the same time, the pipeline, the inner wall of the reactor, and hydrocarbon discharge valves were cleaned using dichloromethane, the liquid hydrocarbon was collected in the same way, which was recorded as expelled oil 2. The total amount of the expelled oil was a sum amount of expelled oil 1 plus expelled oil 2.
2.3. Soxhlet Extraction and Hydrocarbon Separation
Ten collected solid residues were conducted Soxhlet extraction to obtain soluble organic matter (EOM, also named extract). The experiment was carried out in a Soxhlet extractor (CN61M/STSXT model, and made in China), the weight of each sample used was approximately 30–40 mg, the solvent used was a mixture of chloroform and methanol (93:7 v:v), and the extraction time was 72 h. The experimental process was based on a published method [7].
Hydrocarbon separation was carried out on 10 expelled oils and 10 extracts to obtain saturated hydrocarbon fractions. Specifically, the chromatographic column was filled with the adsorbent (silicagel and aluminum oxide), and the samples (oils and extracts) were injected into it. Then, we rinsed the chromatographic column with n-hexane, dichloromethane + n-hexane (2:1, v/v), and methanol in turn, to obtain saturated hydrocarbon, aromatic hydrocarbon, and non-hydrocarbon fractions, respectively.
2.4. Vitrinite Reflectance Measurement
First, kerogen was separated from 10 extracted solid residues using physical and chemical methods, and the kerogen samples were prepared. Secondly, took a small amount of kerogen to make optical films, the method was to mix the kerogen with the consolidation agent for curing and molding, grind it with sandpaper, and polish it with polishing liquid to complete the optical film production. After drying, the optical films were placed under the ZEISS Axio microscope to analyze the reflectance of vitrinite macerals of kerogen. The ZEISS Axio microscope was made in Germany, whit the manufacturer was Zeiss Axio. The measurement system adopted the TIDAS PMT IV photometer (TIDAS MSP 200 model, and made in Germany) and MSP200 test software. In order to ensure the accuracy of data, at least 30 measuring points should be carried out for each sample, and the average value was taken as the vitrinite reflectance of the samples.
2.5. Gas Chromatography-Mass Spectrometry (GC–MS) Analysis
The saturated hydrocarbon fractions of 10 oils and 10 extracts were analyzed by gas chromatography-mass spectrometry (GC-MS), for specific experimental methods, refer to [44]. The GC–MS analyses were performed on an Agilent 7890A gas chromatograph and an Agilent 5977A mass spectrometer, the chromatographic columns were Agilent HP-5, with the size was 30 m × 0.25 mm × 0.5 μm (All these equipments were produced in the United States by Agilen). The heating procedure was as follows: the initial temperature was 50 °C, kept this temperature for 2 min, then raised the temperature to 310 °C at a 3 °C/min heating rate, and maintained this temperature for about 18 min. The carrier gas was He, the constant flow mode was adopted, and the flow rate was 1 mL/min. The scanning mode of the mass spectrometer was set to full scan (Full Scan) and multi-ion detection (MID).
3. Results
3.1. Maturity
The results of the Ro measurement of 10 kerogen samples were shown in Table 2; the temperature increased from 250 °C to 550 °C, the Ro values increased from 0.62% to 2.39%. Therefore, a low mature-mature-high mature-over-mature thermal evolution sequence of source rocks was established. As for oils, it is still impossible to quantify the maturity, but under the same thermal simulation experiment, oil should have a similar thermal evolution degree with its source rock. In this study, Ro values of experimental solid residues were used to quantitatively characterize the maturity of the corresponding expelled oils.
Table 2.
Ro data of residual samples.
3.2. Content of EOMs
As shown in Figure 3, with the Ro values increased from 0.62% to 2.39%, the chloroform bitumen “A” content of solid residues decreased from 0.2382% to 0.0290%. A gradual decrease in the content of EMOs was shown in source rocks with the increase om maturity, and the relationship between them presented a power function relationship. The decreases in the content of EMOs might be due to hydrocarbon expulsion from the source rocks. This speculation could be reflected in the hydrocarbon generation rate curve because the hydrocarbon generation rate of the source rocks continued to increase with the increase in maturities (Figure 3). The Ro values increased from 0.62% to 2.39%, the hydrocarbon generation rate increased from 0.07% to 1.59%. The increasing trend of the hydrocarbon generation rate and the decreasing trend of chloroform bitumen “A” content presented a “mirror image” relationship, indicating that there might be a certain internal relationship between them, the decrease in chloroform bitumen “A” content most likely due to the conversion of some soluble organic matter into hydrocarbons and expelled from the source rocks. At the same time, it was obvious that the increase in hydrocarbon generation rate was significantly greater than the decrease in chloroform bitumen “A” content, it was because that not only the soluble organic matter generated hydrocarbons but also the kerogen had a great contribution to hydrocarbon generation in the thermal evolution process of source rocks.
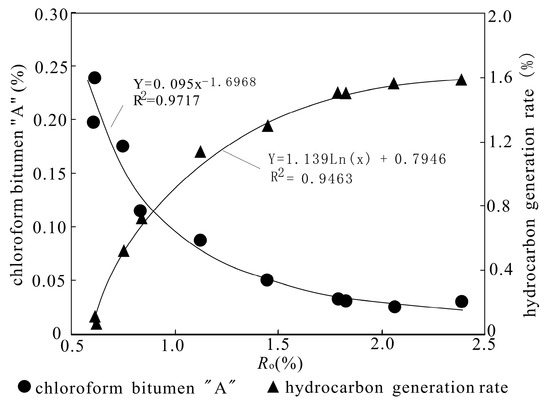
Figure 3.
Chloroform bitumen “A” content and hydrocarbon generation rate versus Ro plot showing the variation of the content of EOMs and hydrocarbon-generation amount during the thermal evolution.
3.3. Relative Abundance of Saturated Hydrocarbons
As shown in Figure 4, with the increase in the maturities, the relative abundance of saturated hydrocarbons in group components of EMO in source rocks and the expelled oils showed different evolution characteristics. The relative abundance of saturated hydrocarbons in EOMs showed characteristics of “increased firstly, tended to be stable secondly”, namely increased rapidly with the increase in maturity at the early stage (Ro < 0.8%), changed little at the late stage (Ro > 0.8%, Figure 4a). However, the change in the relative abundance of saturated hydrocarbons in group components of expelled oil was relatively simple (Figure 4b); the relative abundance continuously decreased with the increase in maturities, while the relative abundance of non-hydrocarbon + asphaltene and the aromatic hydrocarbons continuously increased with the increase in maturities.
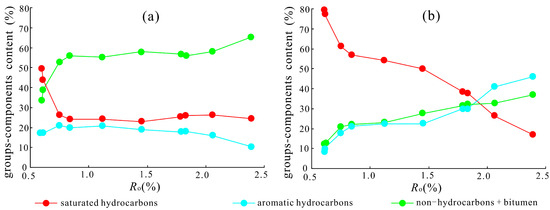
Figure 4.
Group-components content versus Ro plot showing the changes in content of the group-components of the extracts and expelled oils. (a) extracts. (b) oils.
3.4. Bulk Composition of the Saturated Fraction
3.4.1. n-Alkanes
As shown in Figure 5 and Figure 6, the bulk composition of the n-alkanes in extracts and oils showed different variation characteristics in the first half stage of the thermal simulation experiments (Ro < 1.79%, Figure 7a). The bulk composition of the n-alkanes in extracts showed the characteristics of “main peak moved forward, the relative abundance of the light-molecular-weight n-alkanes gradually increased” with the increase in maturity, as the Ro increased from 0.60% to 1.79%, the relative abundance of light to heavy ratios (ΣnC21−/ΣnC22+) increased from 0.094 to 1.047 (Table 3), which might be due to thermal cracking of long-chain n-alkanes [47,48]. At this stage, the bulk composition of the n-alkanes in oils showed characteristics of “change slightly” with the increase in maturities, as the Ro increased from 0.60% to 1.79%, ΣnC21−/ΣnC22+ only floated between 1.089 and 1.182 (Table 3). However, the bulk composition of the n-alkanes in extracts and oils showed the same variation characteristics in the latter half stage of the thermal simulation experiments (Ro > 1.79%, Figure 7a). That was the relative abundance of light-molecular-weight n-alkanes decreased significantly with the increase in maturity. This phenomenon was also reported in the study of Li and Huang [31], who believed that the loss of light-molecular-weigh n-alkanes in the later stage of the thermal simulation was caused by high-temperature volatilization; the light-molecular-weight n-alkanes were easier to volatilize.
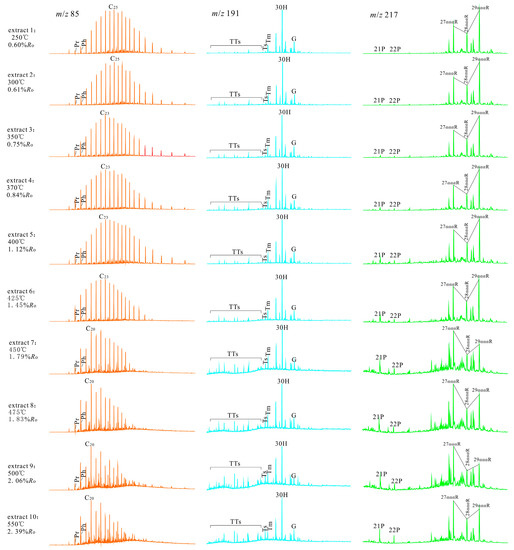
Figure 5.
The m/z 85, m/z 191 and m/z 217 mass chromatograms showing the distribution of the saturated hydrocarbons (n-alkanes, terpanes and steranes, respectively) from the extracts of solid residues. Note: Pr = Pristane, Ph = Phytane, TTs = tricyclic terpanes; Ts = C2718α (H)-22,29,30-trisnorneohopane, Tm = C2717α (H)-22,29,30-trisnorhopane, 30H = C3017α (H), 21β (H) hopane, G = Gammacerane, 21P = C21ααα pregnane, 22P = C22ααα methylpregnane, 27αααR = C27ααα 20R stigmastane, 28αααR = C28ααα 20R stigmastane, 29αααR = C29ααα 20R stigmastane.
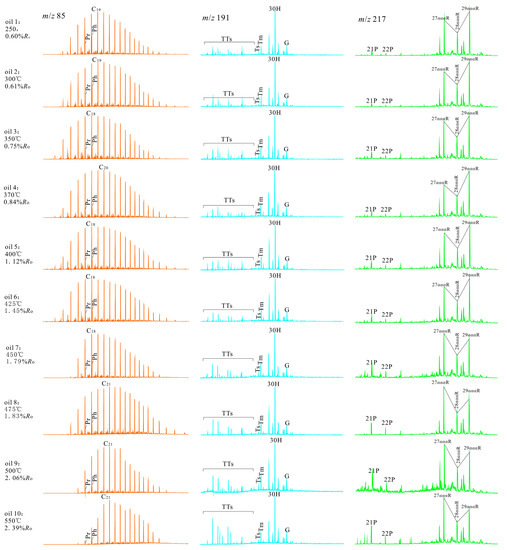
Figure 6.
The m/z 85, m/z 191 and m/z 217 mass chromatograms showing the distribution of the saturated hydrocarbons (n-alkanes, terpanes and steranes, respectively) from the oils. Note: Meaning of the codes are as same as Figure 5.
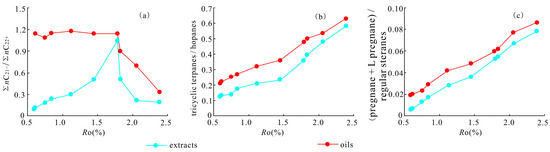
Figure 7.
ΣnC21−/ΣnC22+, tricyclic terpanes/hopanes and (pregnane + L pregnane)/regular steranes ratios versus Ro plots showing the variation of bulk compositions of the saturated fraction of the extracts and oils during the thermal evolution. Note: 21P = C21ααα pregnane, 22P = C22ααα methylpregnane. (a) ΣnC21−/ΣnC22+ ratios versus Ro plots. (b) tricyclic terpanes/hopanes ratios versus Ro plots. (c) (pregnane + L pregnane)/regular steranes ratios versus Ro plots.
Table 3.
Saturated hydrocarbon parameters of the extracts and expelled oils during the thermal evolution.
3.4.2. Terpenes
In the whole process of the thermal simulation experiments, with the Ro values increased from 0.60% to 2.39%, the tricyclic terpanes/hopanes ratios of extracts continuously increased from 0.13 to 0.58, and the tricyclic terpanes/hopanes ratios of oils continuously increased from 0.21 to 0.63 (Table 3). This indicated the bulk composition of terpenoids both in extracts and oils showed similar variation characteristics, it was the relative abundance of the more-carbon-cyclic terpanes decreased with the increase in maturity, while the relative abundance of tricyclic terpanes gradually increased with the increase in maturity (Figure 5, Figure 6 and Figure 7b). The higher relative abundance of tricyclic terpanes has been also found in high-mature or over-mature source rocks in other regions, such as Paleozoic marine source rocks in southern China [49]. It indicated that maturity had a strong influence on the distribution of terpenes, and it might be attributed to the thermal degradation that transforms the more-carbon-cyclic compounds into less-carbon-cyclic compounds of the terpanes.
3.4.3. Steroids
The most obvious variation in the bulk composition of steroids was that the relative abundance of pregnane (C21ααα pregnane) + L-pregnane (C22ααα methylpregnane) increased gradually with the increase in maturity, and both the extracts and the oils showed the same regularity. The only difference was that the relative abundance in extracts was lower than that in the oils of the same maturity (Figure 5, Figure 6 and Figure 7c). As with an increase in Ro from 0.60% to 2.39%, the values of the parameter (pregnane + L-pregnane)/regular steranes ratio ranged from 0.006 to 0.078 in extracts, and from 0.019 to 0.086 in oils (Table 3). Huang et al. [50] regarded that pregnanes (including pregnane and L-pregnane) were mainly derived from the biological hormones progesterol and progesterone; the side chain cleavage of regular steranes during thermal evolution, etc. They also believed that the pregnanes related to original sedimentary input accounted for only 10% to 20% of the total pregnanes, while pregnanes originating from thermal degradation accounted for 80% to 90%. Therefore, with the increase in the maturity, a large amount of pregnanes were formed by the cleavage of the side chain of regular steranes, and as a result, the relative abundance of pregnanes was higher and higher.
4. Discussion
4.1. Effects of Maturation on Paleosedimentary Environmental Parameters
On the study of the sedimentary paleoenvironment of oils/source rocks, the commonly used saturated hydrocarbon parameters are Pr/Ph (pristane/phytane), gammacerane index (gammacerane/C3017α(H), 21β(H) hopane) and so on. Pr/Ph ratio can be used to indicate redox conditions during deposition; Pr/Ph ratios lower than 0.5 imply strongly reducing and saline environments; Pr/Ph ratios ranging from 0.5 to 1.0 suggest anoxic or suboxic reducing conditions, and Pr/Ph ratios are greater than 1.0 represent suboxic to oxidizing environments [51,52,53,54]. Gammacerane mainly originates from tetrahymena and is formed under a reduction environment. A higher abundance of gammacerane is often an indicator of a strong reducing and hypersaline environment, and it is always related to the stratification of water [55,56,57,58]. As commonly used sedimentary environmental parameters, Pr/Ph and Gammacerane index were widely used, but the influence degree of the maturity on it was rarely concerned.
It could be seen from Table 3 and Figure 8, that with the increase in Ro values from 0.60% to 2.39%, the range of Pr/Ph ratios of the extracts was from 0.25 to 0.36, and the maximal changing amplitude was only ±0.06. Meanwhile, the Pr/Ph ratios of the oils were 0.42–0.54, and the maximal changing amplitude was also only ±0.06. It showed that the maturity had little effect on this parameter during the thermal evolution process for oils/source rocks. At the same time, in the whole process of thermal simulation experiments, the range of the gammacerane index of the extracts was from 0.27 to 0.33, the maximal changing amplitude was only ±0.03. And the gammacerane index of the oils was 0.21–0.27, the maximal changing amplitude was also only ±0.03. It also showed that the maturity had little influence on this parameter during the thermal evolution process. Conclusively, Pr/Ph and gammacerane index are little affected by the maturity, and they can be used as effective indicators not only for low maturity but also for over-mature source rocks/oils.
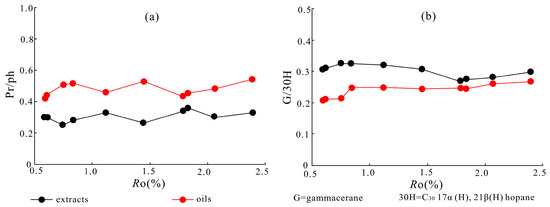
Figure 8.
Pr/Ph and G/30H ratios versus Ro plots showing the effects of maturation on paleosedimentary environmental parameters related to saturated hydrocarbons. (a) Pr/Ph ratios versus Ro plots. (b) G/30H ratios versus Ro plots.
4.2. Effects of Maturity on Identification Methods of Organic Matter Source
4.2.1. n-Alkanes Distribution Pattern Method
The basic principle of using n-alkanes distribution pattern to indicate the biological source inputs of source rocks/oils is as follow: a higher relative abundance of low-molecular-weight n-alkanes (>nC23) with odd-even dominance reflects a higher contribution of land plants to biological source inputs, and an obvious advantage of medium-molecular-weight n-alkanes (nC15–nC21) with nC15 or nC17 as the main peaks carbon, and having no obvious odd-even dominance indicates the contribution of lower aquatic organisms and algae to biological source inputs [7,59,60,61,62,63]. However, maturity may have a great influence on the distribution of n-alkanes, which makes it not always effective to use this method to determine the parent source of organic materials. Qin et al. [47] believed that a high degree of thermal evolution would cause some n-alkanes to crack, consequently, long-chain n-alkanes become low-medium-chain n-alkanes due to the fracture of C-C bonds. Tang et al. [48] analyzed the distribution characteristics of n-alkanes in the process of petroleum cracking through pyrolysis simulation experiments; the results showed that before the cracking of the oils (the oil started producing a large amount of gaseous hydrocarbons), the high-molecular-weight n-alkanes in oils had already begun to pyrolyze; n-C15+ was cracked into nC6–nC14, and then nC6–nC14 was further cracked into nC1–nC5. Liu et al. [64] established a method to verify the validity of using n-alkanes to evaluate the biological source composition based on the kerogen micro-component data and made it clear that using the n-alkane distribution pattern to indicate the biological source inputs was only effective within a certain range of the maturity.
This study also confirmed that the method of using the n-alkane distribution pattern to indicate the biological source inputs was only effective for source rocks within a certain maturity range, but this method might not be applicable for oils. As the geochemistry data showed, the organic matter type of the original sample was typeⅡ2, and its biological source of organic matter should have the characteristics of “overall land plants and aquatic organisms mixed, land plants were slightly dominant”. Only in extract 1- extract 6 (Ro < 1.45%), did the distribution of n-alkanes have a “middle peak type” characteristic, and the main peak carbon was nC23–nC25, the conclusion of biological source inputs was consistent with the original rock. As for extract 7–10, due to the serious loss of the low-molecular-weight n-alkanes and incomplete peak type, it was difficult to use the n-alkane distribution pattern to identify the biological source inputs. The distribution of n-alkanes in 10 oils has a characteristic of “front peak type”, and the main peak was nC18–nC21, it was also difficult to identify the biological source inputs using the n-alkanes distribution pattern method (Figure 6).
4.2.2. Relative Abundances of C27–C29 Steranes Method
The relative abundances of C27–C29 steranes are an effective method to discriminate between different biological source inputs in specific cases [65]. For C27 steranes and C28 steranes mainly originate from lower aquatic algae, C29 steranes are probably associated with terrigenous plants or algae, so the distribution pattern of C27, C28 and C29ααα20R regular steranes is usually used to identify the biological source inputs [10,45,65,66,67]. However, the extent to which the maturity affects the relative abundances of C27, C28 and C29 steranes, is still unclear. As shown in this study, with the increase in maturity, the relative abundances of C27 steranes continued to increase both for extracts and oils (Table 3, Figure 9a,b), while the relative abundances of C29 steranes continued to decrease (Table 3 and Figure 9c). Only in extract 1–6 (Ro < 1.45%) and discharge oil 1–6, the distribution of C27, C28 and C29ααα20R regular steranes was characterized by an asymmetric “V” type in mass chromatograms, suggested that the relative abundances of C29 ααα20R regular steranes were higher than C27 ααα20R regular steranes, indicated that the biological source inputs of organic matter should have the characteristics of “overall mixed with land plants and aquatic organisms, but land plants were slightly dominant”, the conclusion was consistent with the original rock. However, if according to the data of extract 7–10 and discharge oil 7–10 (Ro > 1.45%), it indicated that the organic matter was mainly from aquatic organisms, the conclusion was an incorrect biogenesis conclusion because it was contradictory with the original rock. That was to say, only at a low-mature to high-mature thermal evolution stage (Ro < 1.45%), did the relative abundances of C27, C28 and C29 steranes effectively identify the biological source inputs of organic matter.
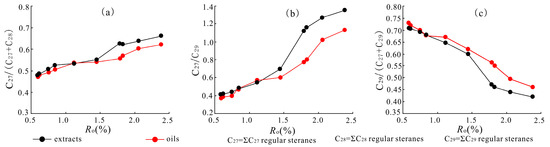
Figure 9.
C27/(C27 + C28) regular steranes, C27/C29 regular steranes and C29/(C27 + C29) regular steranes versus Ro plots showing the effects of maturity on the distribution of the regular steranes. (a) C27/(C27 + C28) regular steranes ratios versus Ro plots. (b) C27/C29 regular steranes ratios versus Ro plots. (c) C29/(C27 + C29) regular steranes ratios versus Ro plots.
4.3. Validity of Maturity Parameters Related to Molecular Markers
C29 steranes maturity parameters are established according to the differences of the thermal stability caused by isomerization, the related parameters include C2920S/(20S + 20R) steranes, C29αββ/(ααα + αββ) steranes, etc. These parameters are considered to increase continuously with the increase in maturity, and their terminational values are 0.52–0.55 and 0.67–0.71, respectively [7,68,69]. The Ts/(Ts + Tm) ratio is a commonly used maturity parameter in terpenoid compounds, because Ts is a relatively stable compound, while Tm is more easily affected by thermal evolution, so the value of Ts/(Ts + Tm) increases gradually with the increase in the maturity, and the value will reach 0.51 at the late oil generation stage [7,69,70,71]. C31αβ 22S/(22S + 22R) homohopanes is also a commonly used maturity parameter; its indication principle to maturity is similar to C29 steranes-related parameters, and the value of this parameter increases with the increase in maturity due to isomerization [7].
According to the basic theory of these parameters, the values of the parameters should show a continuously increasing tendency with the increasing of maturity. However, it showed that these parameters may only be effective within a certain maturity range based on thermal simulation experiments. For example, the parameters C2920S/(20S + 20R) steranes, C29αββ/(ααα + αββ) steranes and C31αβ 22S/(22S + 22R) homohopanes were valid to evaluate the maturity at the stage of Ro < 2.06%, because these parameters had a negative correlation with Ro at the over-mature stage (Ro > 2.06%), making it invalid to evaluate the maturity (Figure 10). The possible causes of this phenomenon were the decomposition of the S-steranes and S-hopanes due to their poor thermal stability [1], making these parameters inapplicable to over-mature source rocks/oils. However, the parameter Ts/(Ts + Tm) had a continuous positive correlation with Ro during the whole thermal evolution process, indicating that this parameter had strong applicability to lacustrine source rocks/oils at any maturity (Figure 10d).
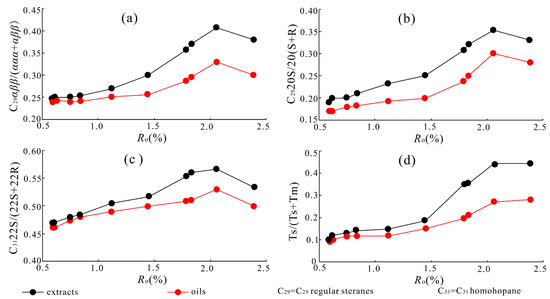
Figure 10.
C29αββ/(ααα + αββ), C2920S/20(S + R), C31αβ 22S/(22S + 22R) and Ts/(Ts + Tm) versus Ro plots showing the validity of the saturated hydrocarbons maturity parameters. (a) C29αββ/(ααα + αββ) ratios versus Ro plots. (b) C2920S/20(S + R) ratios versus Ro plots. (c) C31αβ 22S/(22S + 22R) ratios versus Ro plots. (d) Ts/(Ts + Tm) ratios versus Ro plots.
5. Conclusions
- (1)
- The evolution characteristic of saturated hydrocarbons according to the thermal simulation experiments was as follows: Due to the thermal cracking, long-chain n-alkanes changed to medium-chain (or short-chain) n-alkanes with the breaking of the C-C bond, and it made the main peak of n-alkanes generally move forward in the thermal evolution stage of Ro < 1.80%. But at the stage of Ro > 1.80%, the loss of short-chain n-alkanes by thermal volatilization dominated the change of n-alkanes, making the relative abundance of long-chain n-alkanes continue to increase. Meanwhile, controlled by thermal degradation, the relative abundance of both the tricyclic terpenoids in terpenoids and the pregnane (including L pregnane) in steroids increased with the increase in maturity.
- (2)
- Maturity had little effect on the environmental parameters of lacustrine source rocks and oils, such as Pr/Ph and gammacerane index, these parameters were still applicable even at the high over-maturity stage. However, the maturity had a significant influence on the method using saturated hydrocarbons to identify the source of organic matter, which made it only effective at the thermal stage of Ro < 1.45% to identify the source of organic matter by using the dominant peak of n-alkanes method and the relative abundance of C27–C29 steranes method.
- (3)
- Most saturated hydrocarbon maturity parameters had their valid scope of application, such as C2920S/(20S + 20R) steranes, C29αββ/(ααα + αββ) steranes and C31αβ22S/(22S + 22R) homohopanes were only effective in the thermal stage of Ro < 2.06%, and the parameter values would be “inverted” in the stage of over-maturity (Ro > 2.06%). However, the parameter Ts/(Ts + Tm) was effective in the whole thermal evolution process, reflecting good applicability.
Author Contributions
Z.C.: Writing—Original Draft, Conceptualization, Methodology; Y.Z.: Methodology, Data curation; Z.W.: Writing—review and editing, Project administration; Y.H.: Validation, Resources; C.Z.: Investigation, Supervision; G.Z.: Software, Formal analysis; C.H.: Software, Visualization; Z.L.: Formal analysis, Data curation. All authors have read and agreed to the published version of the manuscript.
Funding
This research was funded by the National Natural Science Foundation of China, Beijing, 100085 (No. 42272160, 41872144), Yanchang Petroleum Group Key Project of Science and Technology (No. ycsy2020jcxjB-03).
Data Availability Statement
Data will be made available on request.
Conflicts of Interest
The authors declare that they have no known competing financial interests or personal relationships that could have appeared to influence the work reported in this paper.
References
- Wang, C.J.; Zhang, H.; Li, S.Y.; Wen, L. Maturity parameters selection and applicable range analysis of organic matter based on molecular markers. Geol. Sci. Techno. Inf. 2018, 37, 202–211. [Google Scholar] [CrossRef]
- Albrecht, P.; Ourisson, G. Biogenic substances in sediments and fossils. Angew. Chem. Int. Edit. 1971, 10, 209–225. [Google Scholar] [CrossRef] [PubMed]
- Peters, K.E.; Moldowan, J.M. The Biomarker Guide: Interpreting Molecular Fossils in Petroleum and Ancient Sediments; Prentice Hall Englewood Cliffs: Hoboken, NJ, USA, 1993; pp. 607–640. [Google Scholar]
- Hu, j.F.; Peng, P.A.; Chivas, A.R. Molecular biomarker evidence of origins and transport of organic matter in sediments of the Pearl River estuary and adjacent South China Sea. Appl. Geochem. 2009, 24, 1666–1676. [Google Scholar] [CrossRef]
- Tissot, B.P.; Welte, D.H. Petroleum Formation and Distribution; Springer: Berlin/Heidelberg, Germany, 1982; pp. 74–93. [Google Scholar]
- Mackenzie, A.S. Advances in Petroleum Geochemistry//Applications of biological markers in petroleum geochemistry. Adv. Pet. Geochem. 1984, 1, 115–214. [Google Scholar] [CrossRef]
- Lu, S.F.; Zhang, M. Oil and Gas Geochemical; Petroleum Industry Press: Beijing, China, 2018; pp. 174–199. [Google Scholar]
- Farrimond, P. Biomarkers for Geologists: A Practical Guide to the Application of Steranes and Triterpanes in Petroleum Geology. Geol. Mag. 1992, 129, 793. [Google Scholar] [CrossRef]
- Peters, K.E.; Walters, C.C.; Moldowan, J.M. The Biomarker Guide, Volumes 2: Biomarkers and Isotopes in Petroleum Exploration and Earth History; Cambridge University Press: Cambridge, UK, 2005. [Google Scholar]
- Si, W.; Hou, D.J.; Wu, P.; Zhao, Z.; Ma, X.X.; Zhou, H.F.; Cao, L.Z. Geochemical characteristics of lower cretaceous lacustrine organic matter in the southern sag of the Wuliyasitai depression, Erlian Basin, China. Mar. Pet. Geol. 2020, 118, 104404. [Google Scholar] [CrossRef]
- Yang, F.L.; Wang, T.G.; Li, M.J. Geochemical study of Cambrian source rocks in the cratonic area of Tarim Basin, NW China. Nat. Gas Geosci. 2016, 27, 861–872. [Google Scholar] [CrossRef]
- Alexander, R.; Larcher, A.V.; Kagi, R.I.; Price, P.L. The use of plant-derived biomarkers for correlation of oils with source rocks in the Cooper/Eromanga Basin system, Australia. APEA J. 1988, 28, 310–324. [Google Scholar] [CrossRef]
- Tong, X.N.; Hu, J.F.; Xi, D.P.; Zhu, M.B.; Song, J.Z.; Peng, P.A. Depositional environment of the Late Santonian lacustrine source rocks in the Songliao Basin (NE China): Implications from organic geochemical analyses. Org. Geochem. 2018, 124, 215–227. [Google Scholar] [CrossRef]
- Chen, X.Y.; Hao, F.; Guo, L.X.; Wang, D.J.; Yin, J.; Yang, F.; Zou, H.Y. Origin of petroleum accumulation in the Chaheji-gaojiapu structural belt of the Baxian Sag, Bohai Bay Basin, China: Insights from biomarker and geological analyses. Mar. Pet. Geol. 2018, 93, 1–13. [Google Scholar] [CrossRef]
- Zhao, W.; Guo, X.W.; He, S. Analysis on validity of maturity parameters of biomarkers: A case study from source rocks in Yitong Basin. J. XSYU 2016, 31, 23–31. [Google Scholar] [CrossRef]
- Sun, L.N.; Zhang, Z.N.; Wu, Y.D.; Su, L.; Xia, Y.Q.; Wang, Z.X.; Zheng, Y.W. Evolution patterns and their significances of biomarker maturity parameters-a case study on liquid hydrocarbons from type II source rock under HTHP hydrous pyrolysis. Oil Gas Geol. 2015, 36, 573–580. [Google Scholar] [CrossRef]
- Fu, J.M.; Sheng, G.Y.; Xu, Y.Y.; Jia, R.F.; Fan, S.F.; Peng, P.A.; Eglinton, G.; Gowar, A.P. Application of biomarker compounds in assessment of paleoenvironments of chinese terrestrial sediments. Geochimca 1991, 1, 1–12. [Google Scholar] [CrossRef]
- Yang, R.F.; Wang, Y.C.; Cao, J. Cretaceous source rocks and associated oil and gas resources in the world and China: A review. Pet. Sci. 2014, 11, 331–345. [Google Scholar] [CrossRef]
- Wang, Y.; Chang, X.C.; Sun, Y.Z.; Shi, B.B.; Qin, S.J. Investigation of fluid inclusion and oil geochemistry to delineate the charging history of Upper Triassic Chang 6, Chang 8, and Chang 9 tight oil reservoirs, Southeastern Ordos Basin, China. Mar. Pet. Geol. 2020, 113, 104–115. [Google Scholar] [CrossRef]
- Xu, J.J.; Liu, Z.J.; Bechtel, A.; Sachsenhofer, R.F.; Jia, J.L.; Meng, Q.T.; Sun, P.C. Organic matter accumulation in the upper cretaceous qingshankou and nenjiang formations, Songliao basin (NE China): Implications from high-resolution geochemical analysis. Mar. Pet. Geol. 2018, 102, 187–201. [Google Scholar] [CrossRef]
- Li, Y.; Zhang, J.L.; Liu, Y.; Shen, W.L.; Chang, X.C.; Sun, Z.Q.; Xu, G.C. Organic geochemistry, distribution and hydrocarbon potential of source rocks in the paleocene, lishui sag, east China sea shelf basin. Mar. Pet. Geol. 2019, 107, 382–396. [Google Scholar] [CrossRef]
- Qi, K.; Ren, Z.L.; Chen, Z.P.; Cui, J.P. Characteristics and controlling factors of lacustrine source rocks in the Lower Cretaceous, Suhongtu depression, Yin-E basin, Northern China. Mar. Pet. Geol. 2021, 127, 104943. [Google Scholar] [CrossRef]
- Harris, N.B.; Freeman, K.H.; Pancost, R.D.; White, T.S.; Mitchell, G.D. The character and origin of lacustrine source rocks in the Lower Cretaceous synrift section, Congo basin, west Africa. AAPG Bull. 2004, 88, 1163–1184. [Google Scholar] [CrossRef]
- Justwan, H.; Dahl, B.; Isaksen, G.H. Geochemical characterization and geneticorigin of oils and condensates in the South Viking Graben, Norway. Mar. Pet. Geol. 2006, 23, 213–239. [Google Scholar] [CrossRef]
- Keym, M.; Dieckmann, V.; Horsfield, B.; Erdmann, M.; Galimberti, R.; Kua, L.C.; Leith, L.; Podlaha, O. Source rock heterogeneity of the upper Jurassic Draupne formation, north Viking Graben, and its relevance to petroleum generation studies. Org. Geochem. 2006, 37, 220–243. [Google Scholar] [CrossRef]
- Shao, X.H.; Pang, X.Q.; Li, M.W.; Li, Z.M.; Zhao, Y. Hydrocarbon generation from lacustrine shales with retained oil during thermal maturation. Pet. Sci. 2020, 17, 1478–1490. [Google Scholar] [CrossRef]
- Xu, J.J.; Jin, Q. Hydrocarbon generation from Carboniferous-Permian coaly source rocks in the Huanghua depression under different geological processes. Pet. Sci. 2020, 17, 1540–1555. [Google Scholar] [CrossRef]
- Sun, J.; Xiao, X.M.; Cheng, P.; Wang, M.L.; Tian, H. The relationship between oil generation, expulsion and retention of lacustrine shales: Based on pyrolysis simulation experiments. J. Petrol. Sci. Eng. 2021, 196, 107625. [Google Scholar] [CrossRef]
- He, M.; Wang, Z.Y.; Moldowan, M.J.; Peters, K. Insights into catalytic effects of clay minerals on hydrocarbon composition of generated liquid products during oil cracking from laboratory pyrolysis experiments. Org. Geochem. 2022, 163, 104331. [Google Scholar] [CrossRef]
- Zhang, Y.H.; Wang, Y.F.; Ma, W.; Lu, J.C.; Liao, Y.H.; Li, Z.S.; Shi, Q. Compositional Characterization of Expelled and Residual Oils in the Source Rocks from Oil Generation-Expulsion Thermal Simulation Experiments. ACS Omega 2019, 4, 8239–8248. [Google Scholar] [CrossRef]
- Li, Z.X.; Huang, H.P. Bulk and molecular composition variations of gold-tube pyrolysates from severely biodegraded Athabasca bitumen. Pet. Sci. 2020, 17, 1527–1539. [Google Scholar] [CrossRef]
- Liu, W.M.; Liao, Y.H.; Shi, Q.; Hsu, C.S.; Jiang, B.; Peng, P.A. Origin of polar organic sulfur compounds in immature crude oils revealed by ESI FT-ICR MS. Org. Geochem. 2018, 121, 36–47. [Google Scholar] [CrossRef]
- Peters, K.E.; Hackley, P.C.; Thomas, J.J.; Pomerantz, A.E. Suppression of vitrinite reflectance by bitumen generated from liptinite during hydrous pyrolysis of artificial source rock. Org. Geochem. 2018, 125, 220–228. [Google Scholar] [CrossRef]
- Duan, Y.; Wu, Y.A.; Zhao, Y.; Cao, X.X.; Ma, L.H. Hydrogen isotopic characteristic of hydrocarbon gas pyrolyzed by herbaceous swamp peat in hydrous and anhydrous thermal simulation experiments. J. Nat. Gas Geosci. 2018, 3, 67–72. [Google Scholar] [CrossRef]
- Liu, R.; Liu, Z.J.; Guo, W.; Chen, H.J. Characteristics and comprehensive utilization potential of oil shale of the Yin’e basin, Inner Mongolia, China. Oil Shale 2015, 32, 293–312. [Google Scholar] [CrossRef]
- Niu, Z.C.; Liu, G.D.; Cao, Z.; Guo, D.B.; Wang, P.; Tang, G. Geochemical characteristics, depositional environment, and controlling factors of Lower Cretaceous shales in Chagan Sag, Yingen-Ejinaqi Basin. Geol. J. 2018, 53, 1308–1321. [Google Scholar] [CrossRef]
- Zhang, K.; Liu, R.; Liu, Z.J.; Li, L.; Wu, X.P.; Zhao, K.G. Influence of palaeoclimate and hydrothermal activity on organic matter accumulation in lacustrine black shales from the Lower Cretaceous Bayingebi Formation of the Yin’e Basin, China. Palaeogeogr. Palaeoclimatol. Palaeoecol. 2020, 560, 110007. [Google Scholar] [CrossRef]
- Hou, Y.C.; Wang, H.Y.; Fan, T.L.; Zhang, H.G.; Yang, R.Z.; Li, Y.F.; Long, S.F. Rift-related sedimentary evolution and its response to tectonics and climate changes: A case study of the Guaizihu sag, Yingen-Ejinaqi Basin, China. J. Asian Earth Sci. 2020, 195, 104370. [Google Scholar] [CrossRef]
- Zhang, M.Z.; Dai, S.; Pan, B.T.; Wang, L.B.; Peng, D.X.; Wang, H.W.; Zhang, X. The palynoflora of the Lower Cretaceous strata of the Yingen-Ejinaqi Basin in North China and their implications for the evolution of early angiosperms. Cretaceous Res. 2014, 48, 23–38. [Google Scholar] [CrossRef]
- Yang, M.H.; Zuo, Y.H.; Zhang, J.Z.; Wang, C.C.; Zhou, Y.S.; Wang, X.J.; Zhang, C.F. Hydrocarbon Kitchen Evolution in the Early Cretaceous Bayingebi 2 Formation in the Chagan Depression, Yingen-Ejinaqi Basin, North Central China. ACS Omega 2021, 6, 12194–12204. [Google Scholar] [CrossRef]
- Yang, P.; Ren, Z.L.; Xia, B.; Zhao, X.Y.; Tian, T.; Huang, Q.T.; Yu, S.R. The Lower Cretaceous source rocks geochemical characteristics and thermal evolution history in the HaRi Sag, Yin-E Basin. Pet. Sci. Technol. 2017, 35, 1304–1313. [Google Scholar] [CrossRef]
- Ye, J.R.; Yang, X.H.; Wang, L.J. Petroleum Systems of Chagan Depression, Yingen-Ejinaqi Basin, Northwest China. J. China Univ. Geosci. 2005, 17, 55–64. [Google Scholar] [CrossRef]
- Li, T.J.; Huang, Z.L.; Yin, Y.; Gou, H.G.; Zhang, P. Sedimentology and geochemistry of Cretaceous source rocks from the Tiancao Sag, Yin’e Basin, North China: Implications for the enrichment mechanism of organic matters in small lacustrine rift basins. J. Asian Earth Sci. 2020, 204, 104575. [Google Scholar] [CrossRef]
- Chen, Z.J.; Gao, Y.W.; Liu, H.C.; He, Y.H.; Ma, F.X.; Meng, J.H.; Zhao, C.C.; Han, C.C. Geochemical characteristics of Lower Cretaceous source rocks and oilsource correlation in Hari sag, Yingen-Ejinaqi Basin. Acta Petrolei Sinica 2018, 39, 69–81. [Google Scholar] [CrossRef]
- Chen, Z.J.; Ma, F.X.; Xiao, G.; Zhang, Y.; Gao, Y.W.; Wang, X.D.; Han, C.C. Oil-sources rock correlation of Bayingebi Formation in Hari sag, Yingen-Ejinaqi Basin. Oil Gas Geol. 2019, 40, 900–916. [Google Scholar] [CrossRef]
- SY/T 5735-1995; Geochemical Evaluation Standard of Terrestrial Hydrocarbon Source Rock. Petroleum Industry Press: Beijing, China, 1995.
- Qin, X.M.; Chi, H.; Fang, W.J.; Li, X. Thermal stability characterization of n-alkanes from determination of produced aromatics. J. Anal. Appl. Pyrolysis 2013, 104, 593–602. [Google Scholar] [CrossRef]
- Tang, X.Q.; Huang, G.H.; Zhang, M.; Han, J.P. Compositional characteristics and geochemical significance of N-alkanes in process of crude oil cracking. Earth Sci. Front. 2009, 16, 372–378. [Google Scholar] [CrossRef]
- Liang, D.G.; Chen, J.P. Oil-source correlations for high and over matured marine source rocks in South China. Pet. Explor. Dev. 2005, 32, 8–14. [Google Scholar]
- Huang, D.F.; Zhang, D.J.; Li, J.C. On origin of 4-methyl steranes and pregnanes. Pet. Explor. Dev. 1989, 3, 8–15. [Google Scholar]
- Ten Haven, H.L.; De Leeuw, J.W.; Rullkotter, J. Restricted utility of the pristane/phytane radio as a palaeoenvironmental indicator. Nature 1987, 330, 641–643. [Google Scholar] [CrossRef]
- Yin, J.; Xu, C.G.; Hao, F.; Wang, Q.; Miao, Q.Y.; Wang, Z.Q.; Zou, H.Y. Controls on organic matter enrichment in source rocks of the Shahejie Formation in the southwestern Bozhong Sag, Bohai Bay Basin, China. Palaeogeogr. Palaeoclimatol. Palaeoecol. 2020, 560, 110026. [Google Scholar] [CrossRef]
- Didyk, B.M.; Simoneit, B.R.T.; Brassell, S.C.; Eglinton, G. Organic geochemical indicators of palaeoenvironmental conditions of sedimentation. Nature 1978, 272, 216–222. [Google Scholar] [CrossRef]
- Hao, F.; Zhou, X.; Zhu, Y.; Yang, Y.Y. Lacustrine source rock deposition in response to co-evolution of environments and organisms controlled by tectonic subsidence and climate, Bohai Bay Basin, China. Org. Geochem. 2011, 42, 323–339. [Google Scholar] [CrossRef]
- Holba, A.G.; Dzou, L.I.; Wood, G.D.; Ellis, L.; Adam, P.; Schaeffer, P.; Albrecht, P.; Greene, T.; Hughes, W.B. Application of tetracyclic polyprenoids as indicators of input from fresh-brackish water environments. Org. Geochem. 2003, 34, 441–469. [Google Scholar] [CrossRef]
- Sinninghe Damste, J.S.; Kenig, F.; Koopmans, M.P.; Schouten, S.; Hayes, J.M.; Leeuw, J.W. Evidence for gammacerane as an indicator of water column stratification. Geochim. Cosmochim. Acta 1995, 59, 1895–1900. [Google Scholar] [CrossRef] [PubMed]
- Summons, R.E.; Hope, J.M.; Swart, R.; Walter, M.R. Origin of Nama basin bitumen seeps: Petroleum derived from a Permian lacustrine source rock traversing southwestern Gondwana. Org. Geochem. 2008, 39, 589–607. [Google Scholar] [CrossRef]
- Venkatesan, M.I. Tetrahymanol: Its widespread occurrence and geochemical significance. Geochim. Cosmochim. Acta 1989, 53, 3095–3101. [Google Scholar] [CrossRef]
- Apostolopoulou, M.V.; Monteyne, E.; Krikonis, K.; Krikonis, K.; Pavlopoulos, K.; Patrick Roose, P.; Dehairs, F. N-alkanes and stable C, N isotopic compositions as identifiers of organicmatter sources in Posidonia oceanica meadows of Alexandroupolis Gulf, NE Greece. Mar. Pollut. Bull. 2015, 99, 346–355. [Google Scholar] [CrossRef]
- Souza, D.B.D.; Machado, K.S.; Froehner, S.; Scapulatempo, C.F.; Bleninger, T. Distribution of n-alkanes in lacustrine sediments from subtropical lake in Brazil. Chem. Erde 2011, 71, 171–176. [Google Scholar] [CrossRef]
- Ficken, K.J.; Li, B.; Swain, D.L.; Eglinton, G. An n-alkane proxy for the sedimentary inputs of submerged/floating freshwater aquatic macrophytes. Org. Geochem. 2000, 31, 745–749. [Google Scholar] [CrossRef]
- Bush, R.T.; McInerney, F.A. Leaf wax n-alkane distributions in and across modern plants: Implications for paleoecology and chemotaxonomy. Geochim. Cosmochim. Acta 2013, 117, 161–179. [Google Scholar] [CrossRef]
- Cranwell, P.A.; Eglinton, G.; Robinson, N. Lipids of aquatic organisms as potential contributors to lacustrine sediments-II. Org. Geochem. 1987, 11, 513–527. [Google Scholar] [CrossRef]
- Liu, D.; Xie, C.Q.; Chen, Z.J.; Liu, H.C.; Han, C.C.; Gao, Y.W. Effctiveness of n-alkanes distribution on determining parent material composition of hydrocarbon source rock. Faul-Block Oil Gas Field 2019, 26, 42–47. [Google Scholar] [CrossRef]
- Huang, W.; Meinschein, W.G. Sterols as ecological indicators. Geochim. Cosmochim. Acta 1979, 43, 739–745. [Google Scholar] [CrossRef]
- Seifert, W.K.; Moldowan, J.M. The effect of thermal stress on source-rock quality as measured by hopane stereochemistry. Phys. Chem. Earth 1980, 12, 229–237. [Google Scholar] [CrossRef]
- Volkman, J.K. A review of sterol biomarkers for marine and terrigenous organic matter. Org. Geochem. 1986, 9, 83–89. [Google Scholar] [CrossRef]
- Mackenzie, A.S.; Patience, R.L.; Maxwell, J.R.; Vandenbroucke, M.; Durand, B. Molecular parameters of maturation in the Toarcian shales, Paris Basin, France-I. Changes in the configurations of acyclic isoprenoid alkanes, steranes and triterpanes. Geochim. Cosmochim. Acta 1980, 44, 1709–1721. [Google Scholar] [CrossRef]
- Seifert, W.K.; Moldowan, J.M. Paleoreconstruction by biological markers. Geochim. Cosmochim. Acta 1981, 45, 783–794. [Google Scholar] [CrossRef]
- Kolaczkowska, E.; Slougui, N.E.; Watt, D.S.; Maruca, R.; Dowan, M.M. Thermodynamic stability of various alkylated, dealkylated and rearranged 17α- and 17β-hopane isomers using molecular mechanics calculations. Org. Geochem. 1990, 16, 1033–1038. [Google Scholar] [CrossRef]
- Li, M.W.; Yao, H.X.; Fowler, M.G.; Stasiuk, L.D. Geochemical constraints on models for secondary petroleum migration along the upper Devonian rimbey-meadow brook reef trend in central Al berta, Canada. Org. Geochem. 1998, 29, 163–182. [Google Scholar] [CrossRef]
Disclaimer/Publisher’s Note: The statements, opinions and data contained in all publications are solely those of the individual author(s) and contributor(s) and not of MDPI and/or the editor(s). MDPI and/or the editor(s) disclaim responsibility for any injury to people or property resulting from any ideas, methods, instructions or products referred to in the content. |
© 2023 by the authors. Licensee MDPI, Basel, Switzerland. This article is an open access article distributed under the terms and conditions of the Creative Commons Attribution (CC BY) license (https://creativecommons.org/licenses/by/4.0/).