
Dynamic Analysis of High-Water-Cut Tight Sandstone Gas Reservoirs and Study of Water Production Splitting of Gas Wells: A Case Study on the Western Sulige Gas Field, Ordos Basin, NW China


Abstract
:1. Introduction
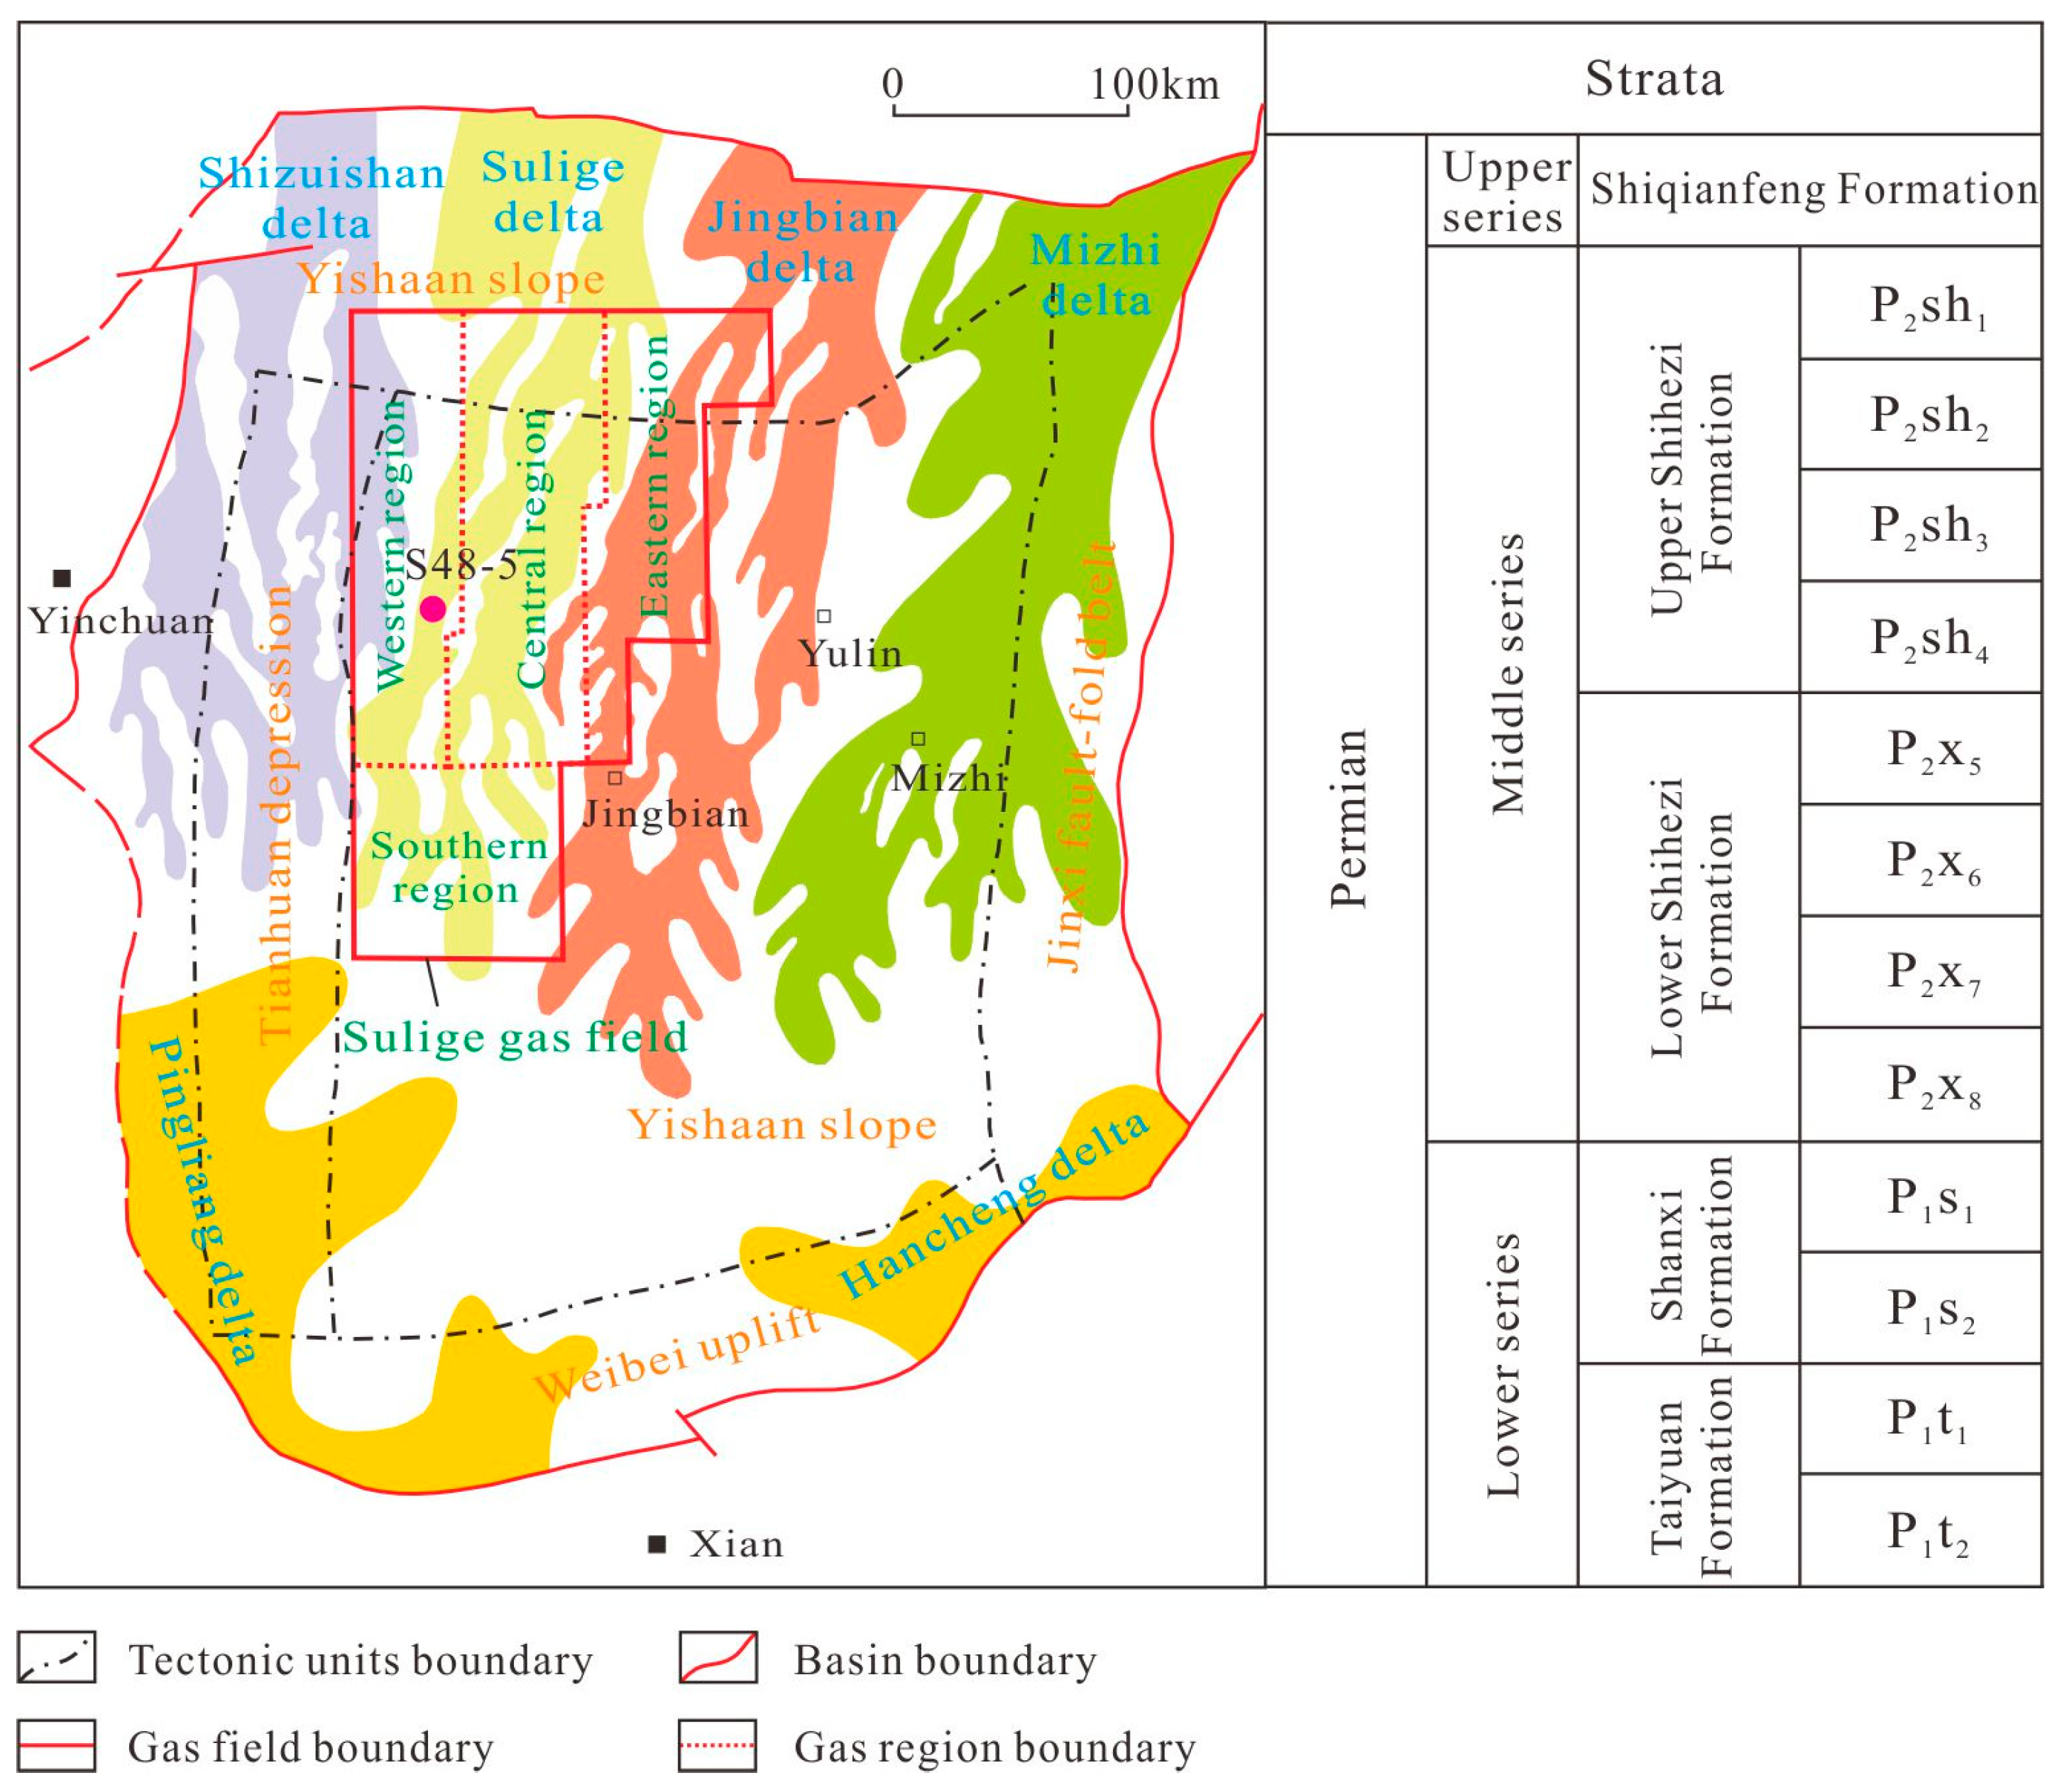
2. Study Area
3. Characteristics and Methods
3.1. Water Production Characteristics
3.1.1. Water Production Mechanism
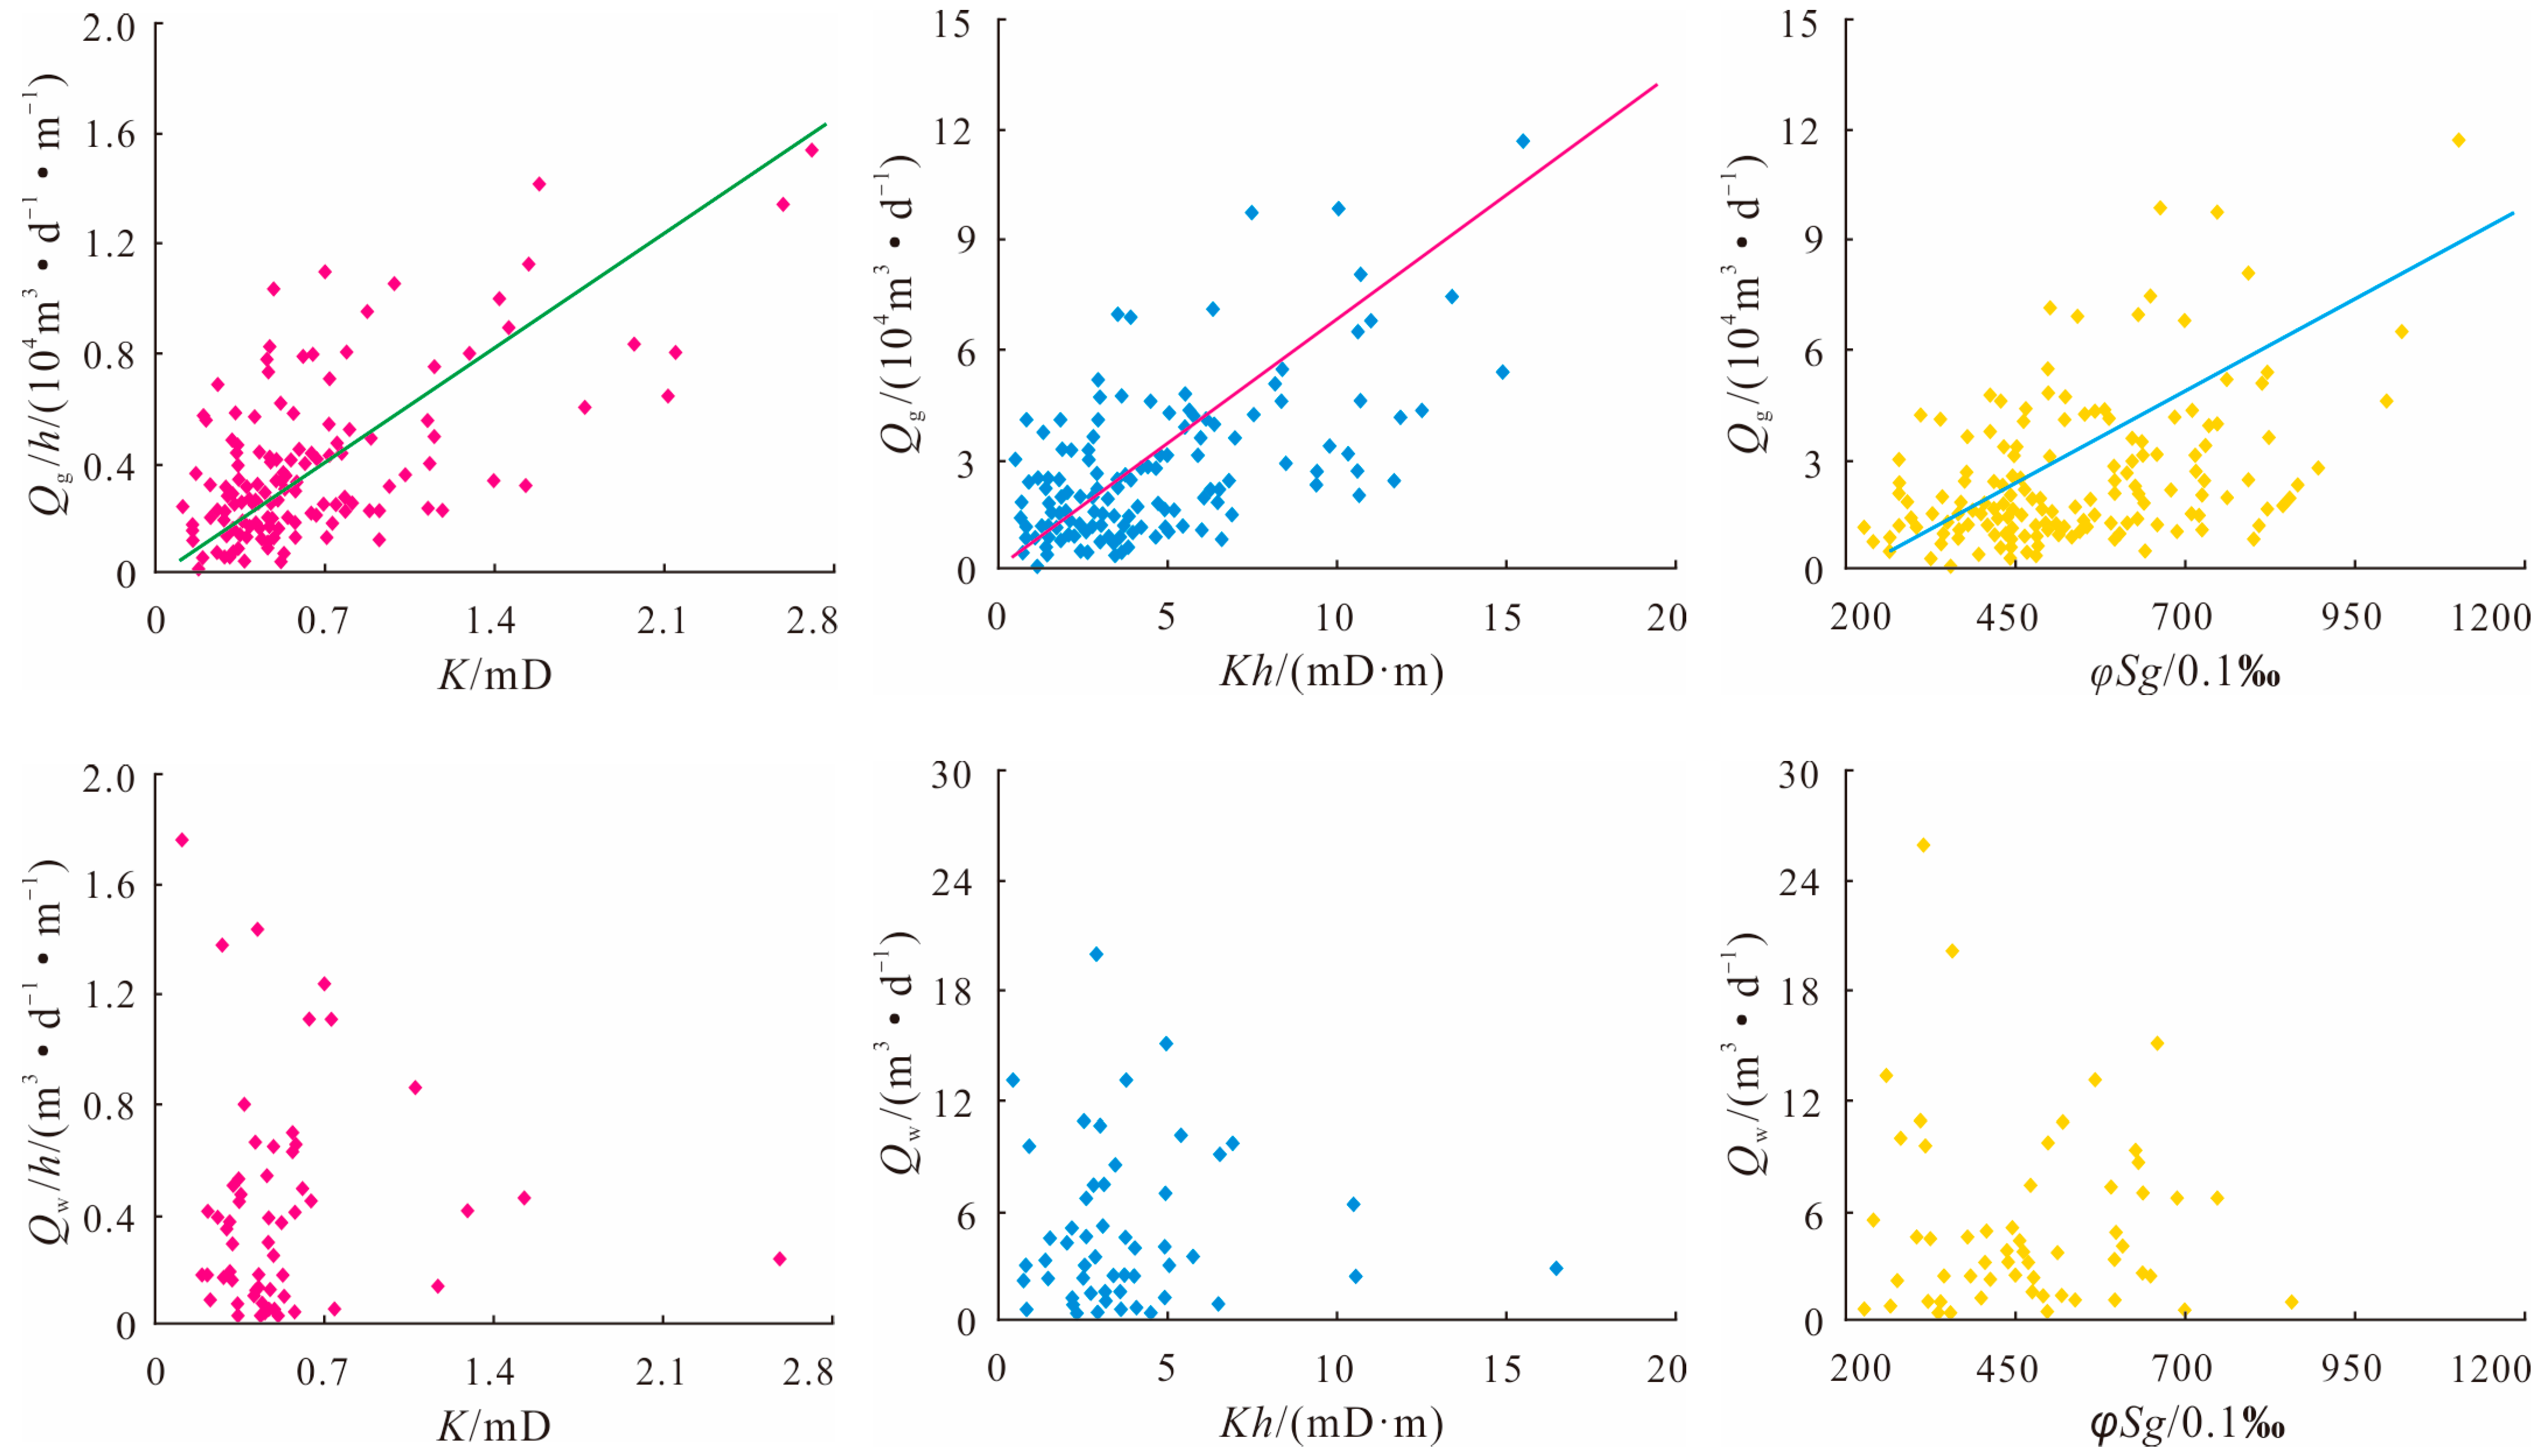
3.1.2. Dynamic and Static Intersection Characterization
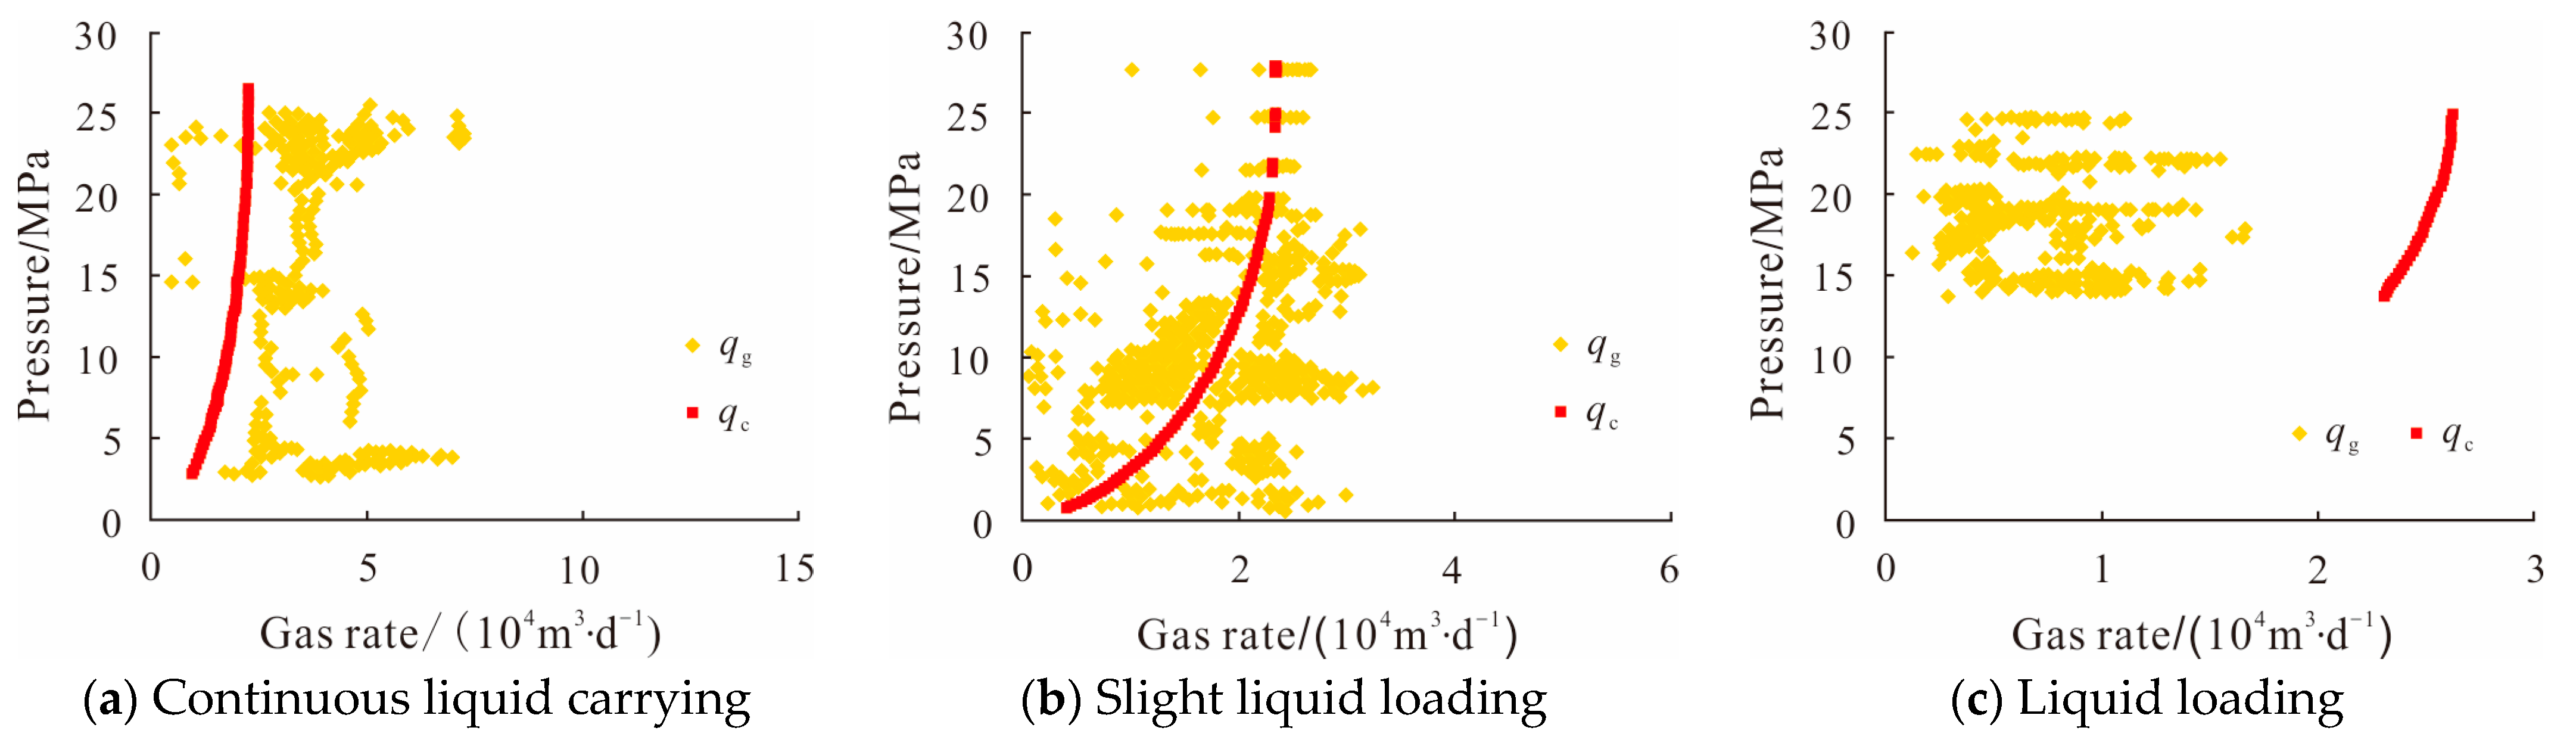
3.1.3. Wellbore Liquid-Loading Law
3.1.4. Water-Producing Well Diagnosis
3.2. Water Production Splitting
3.2.1. Splitting Method
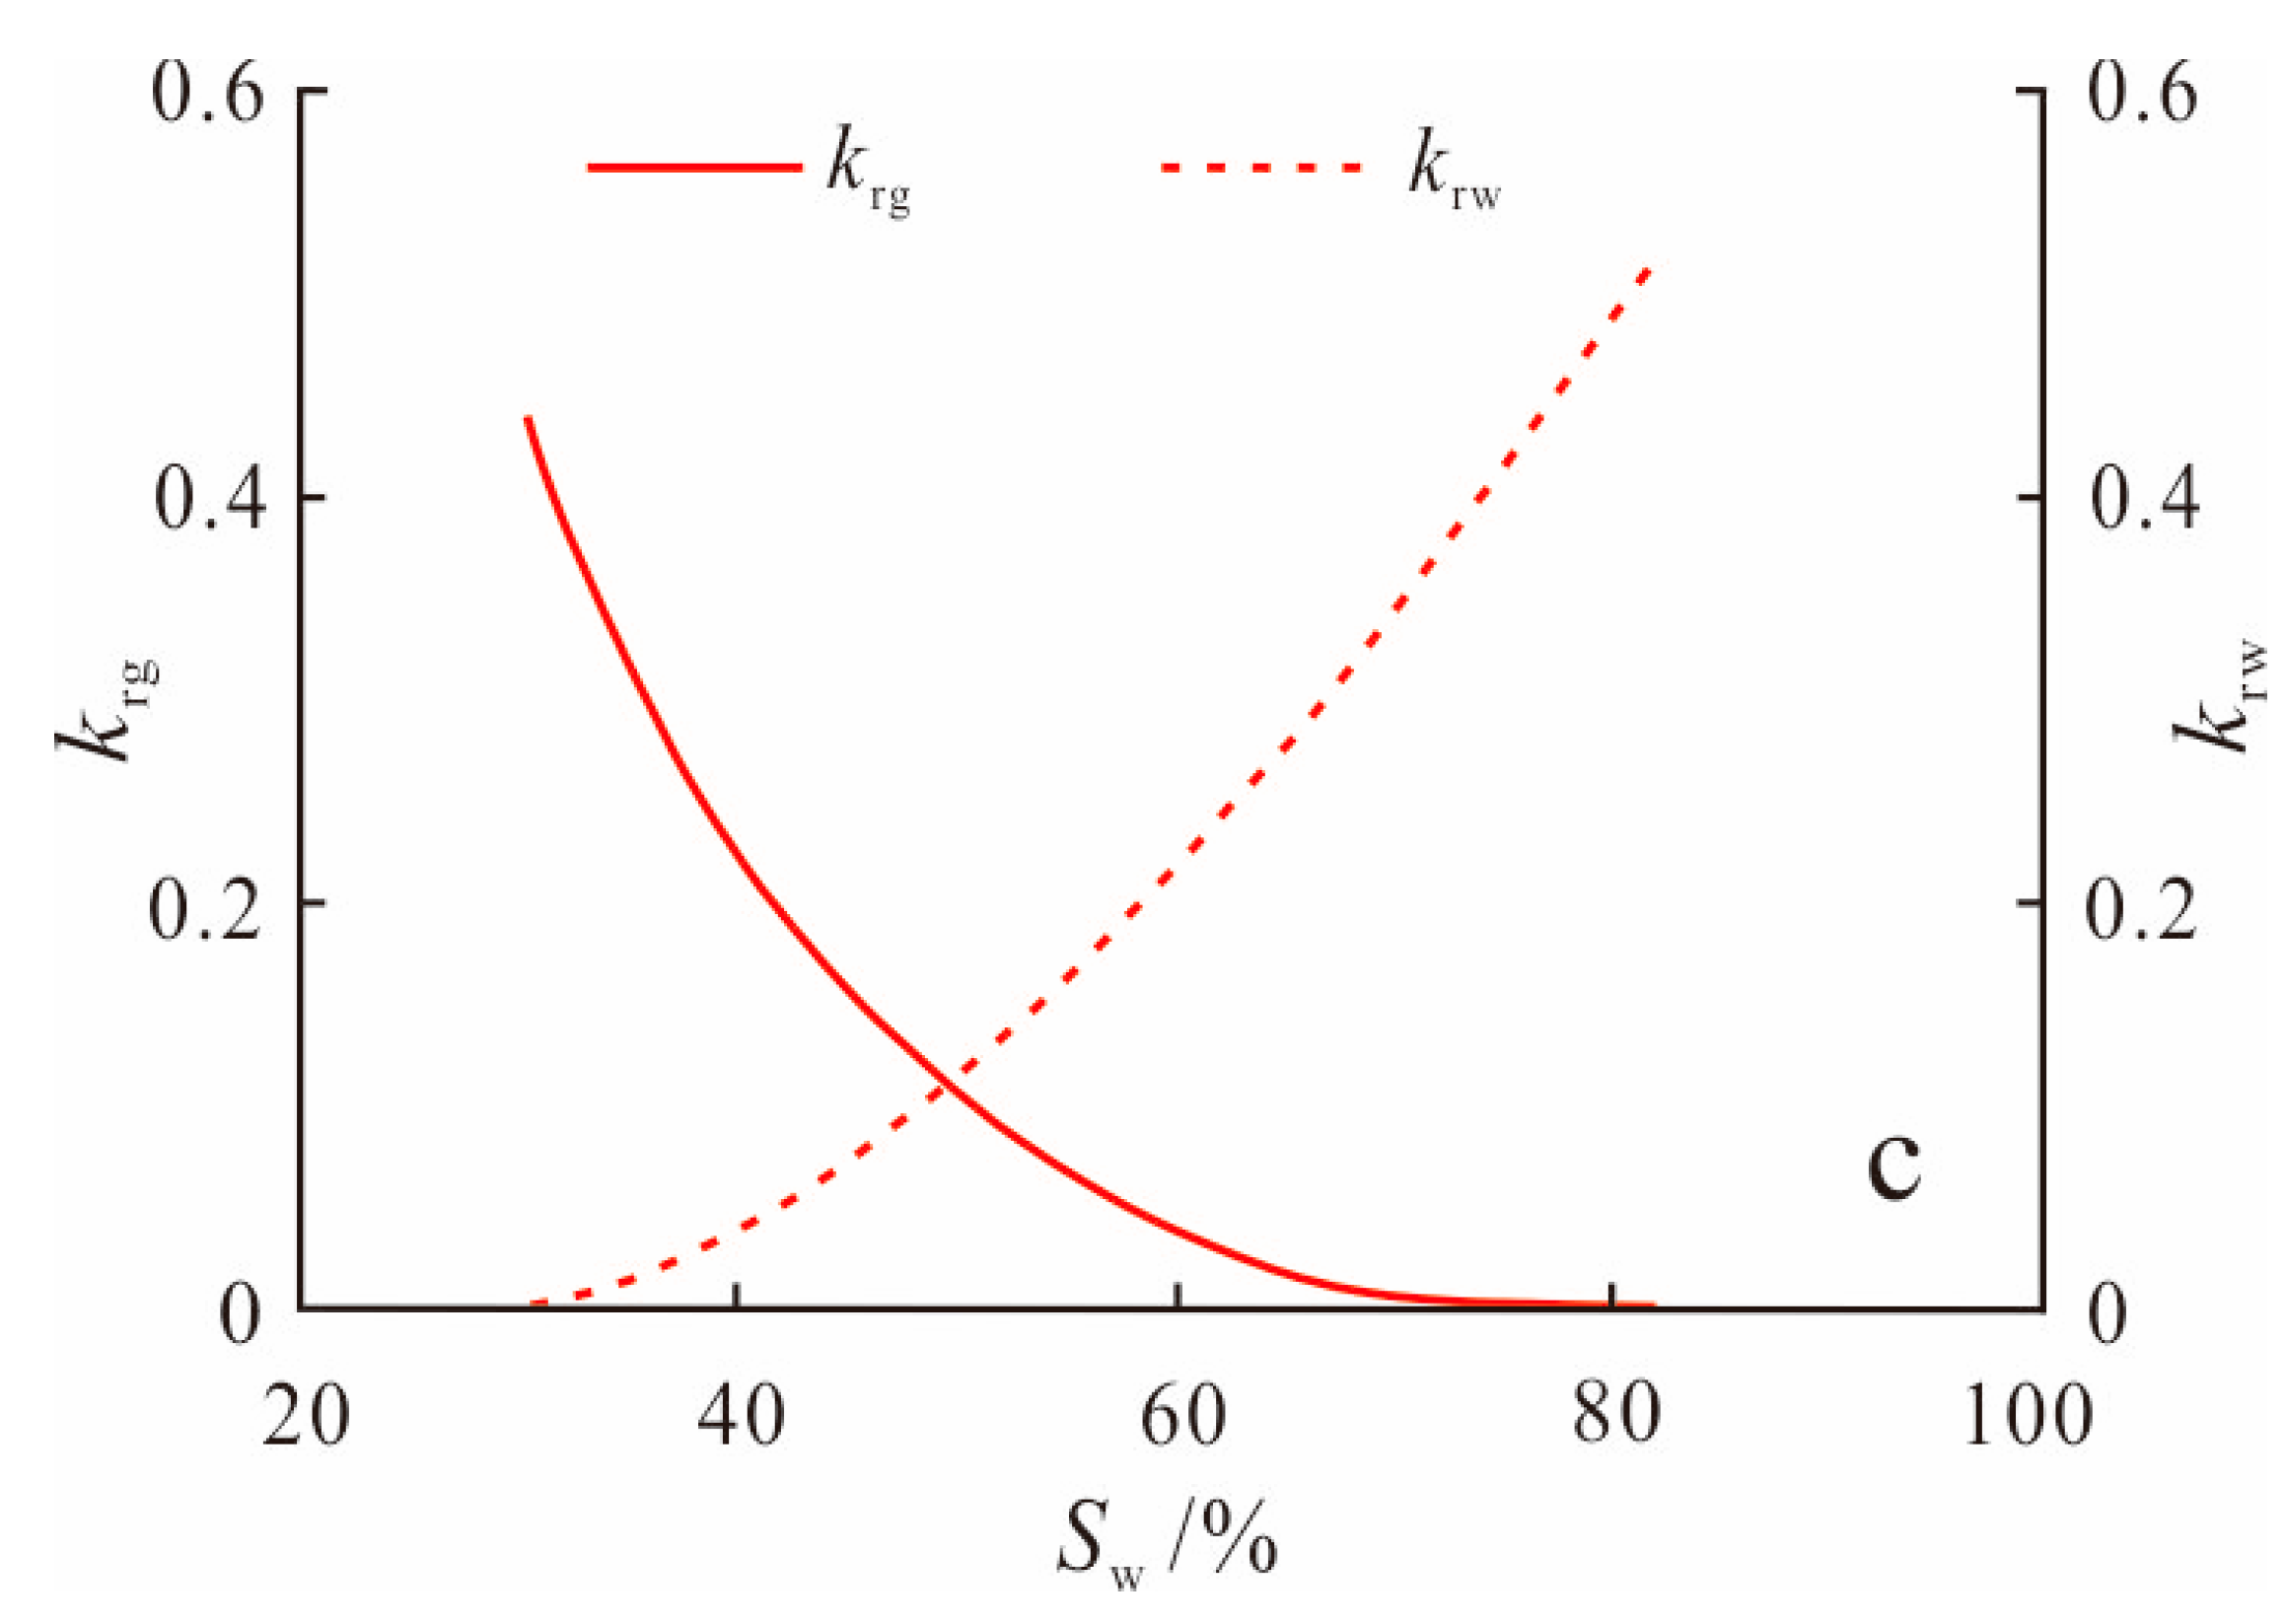
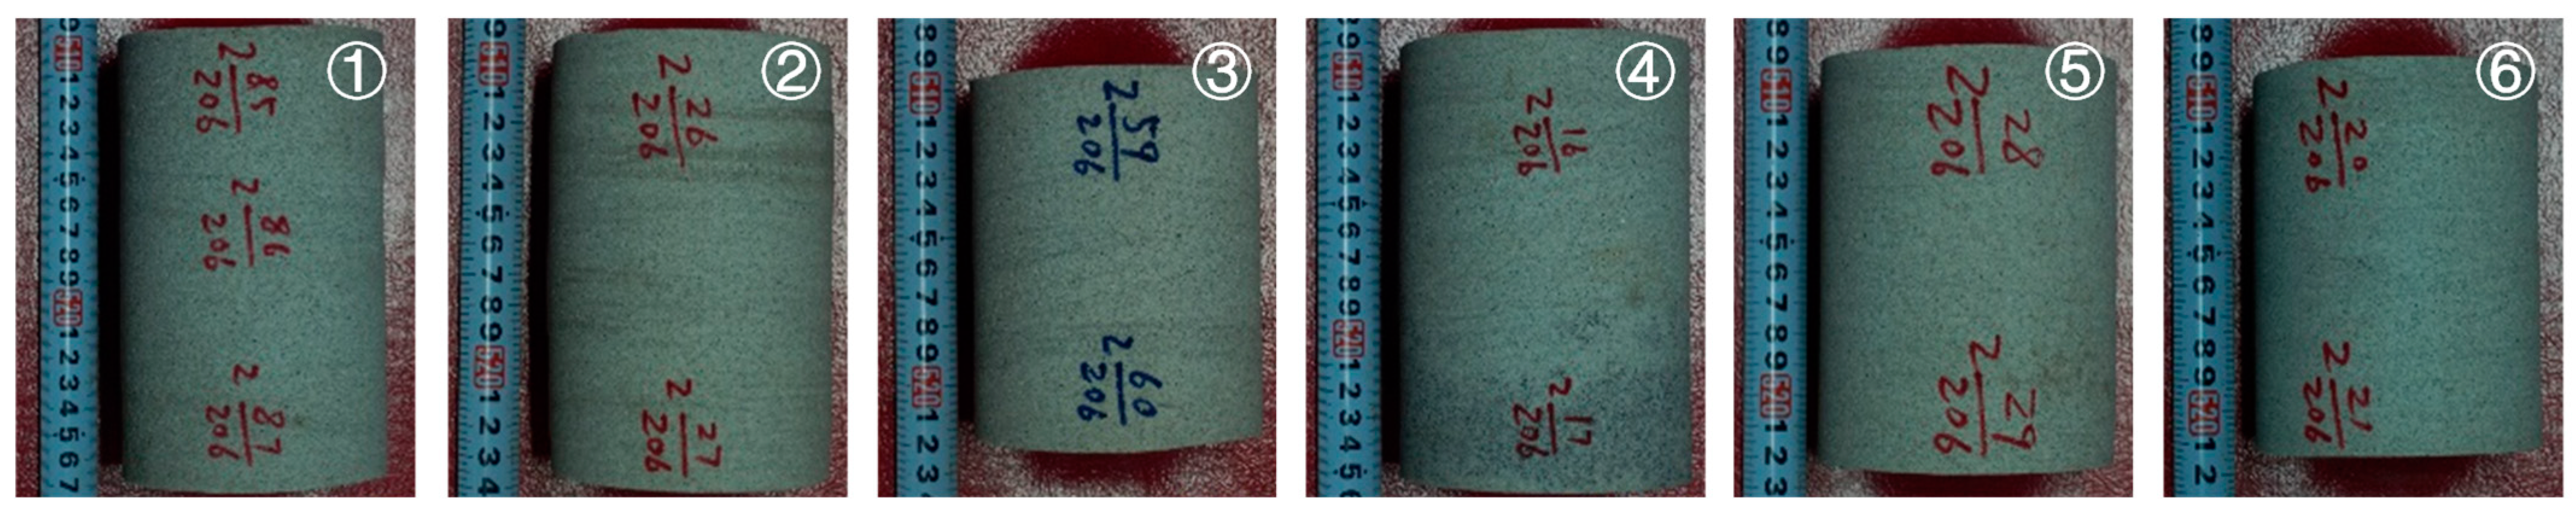
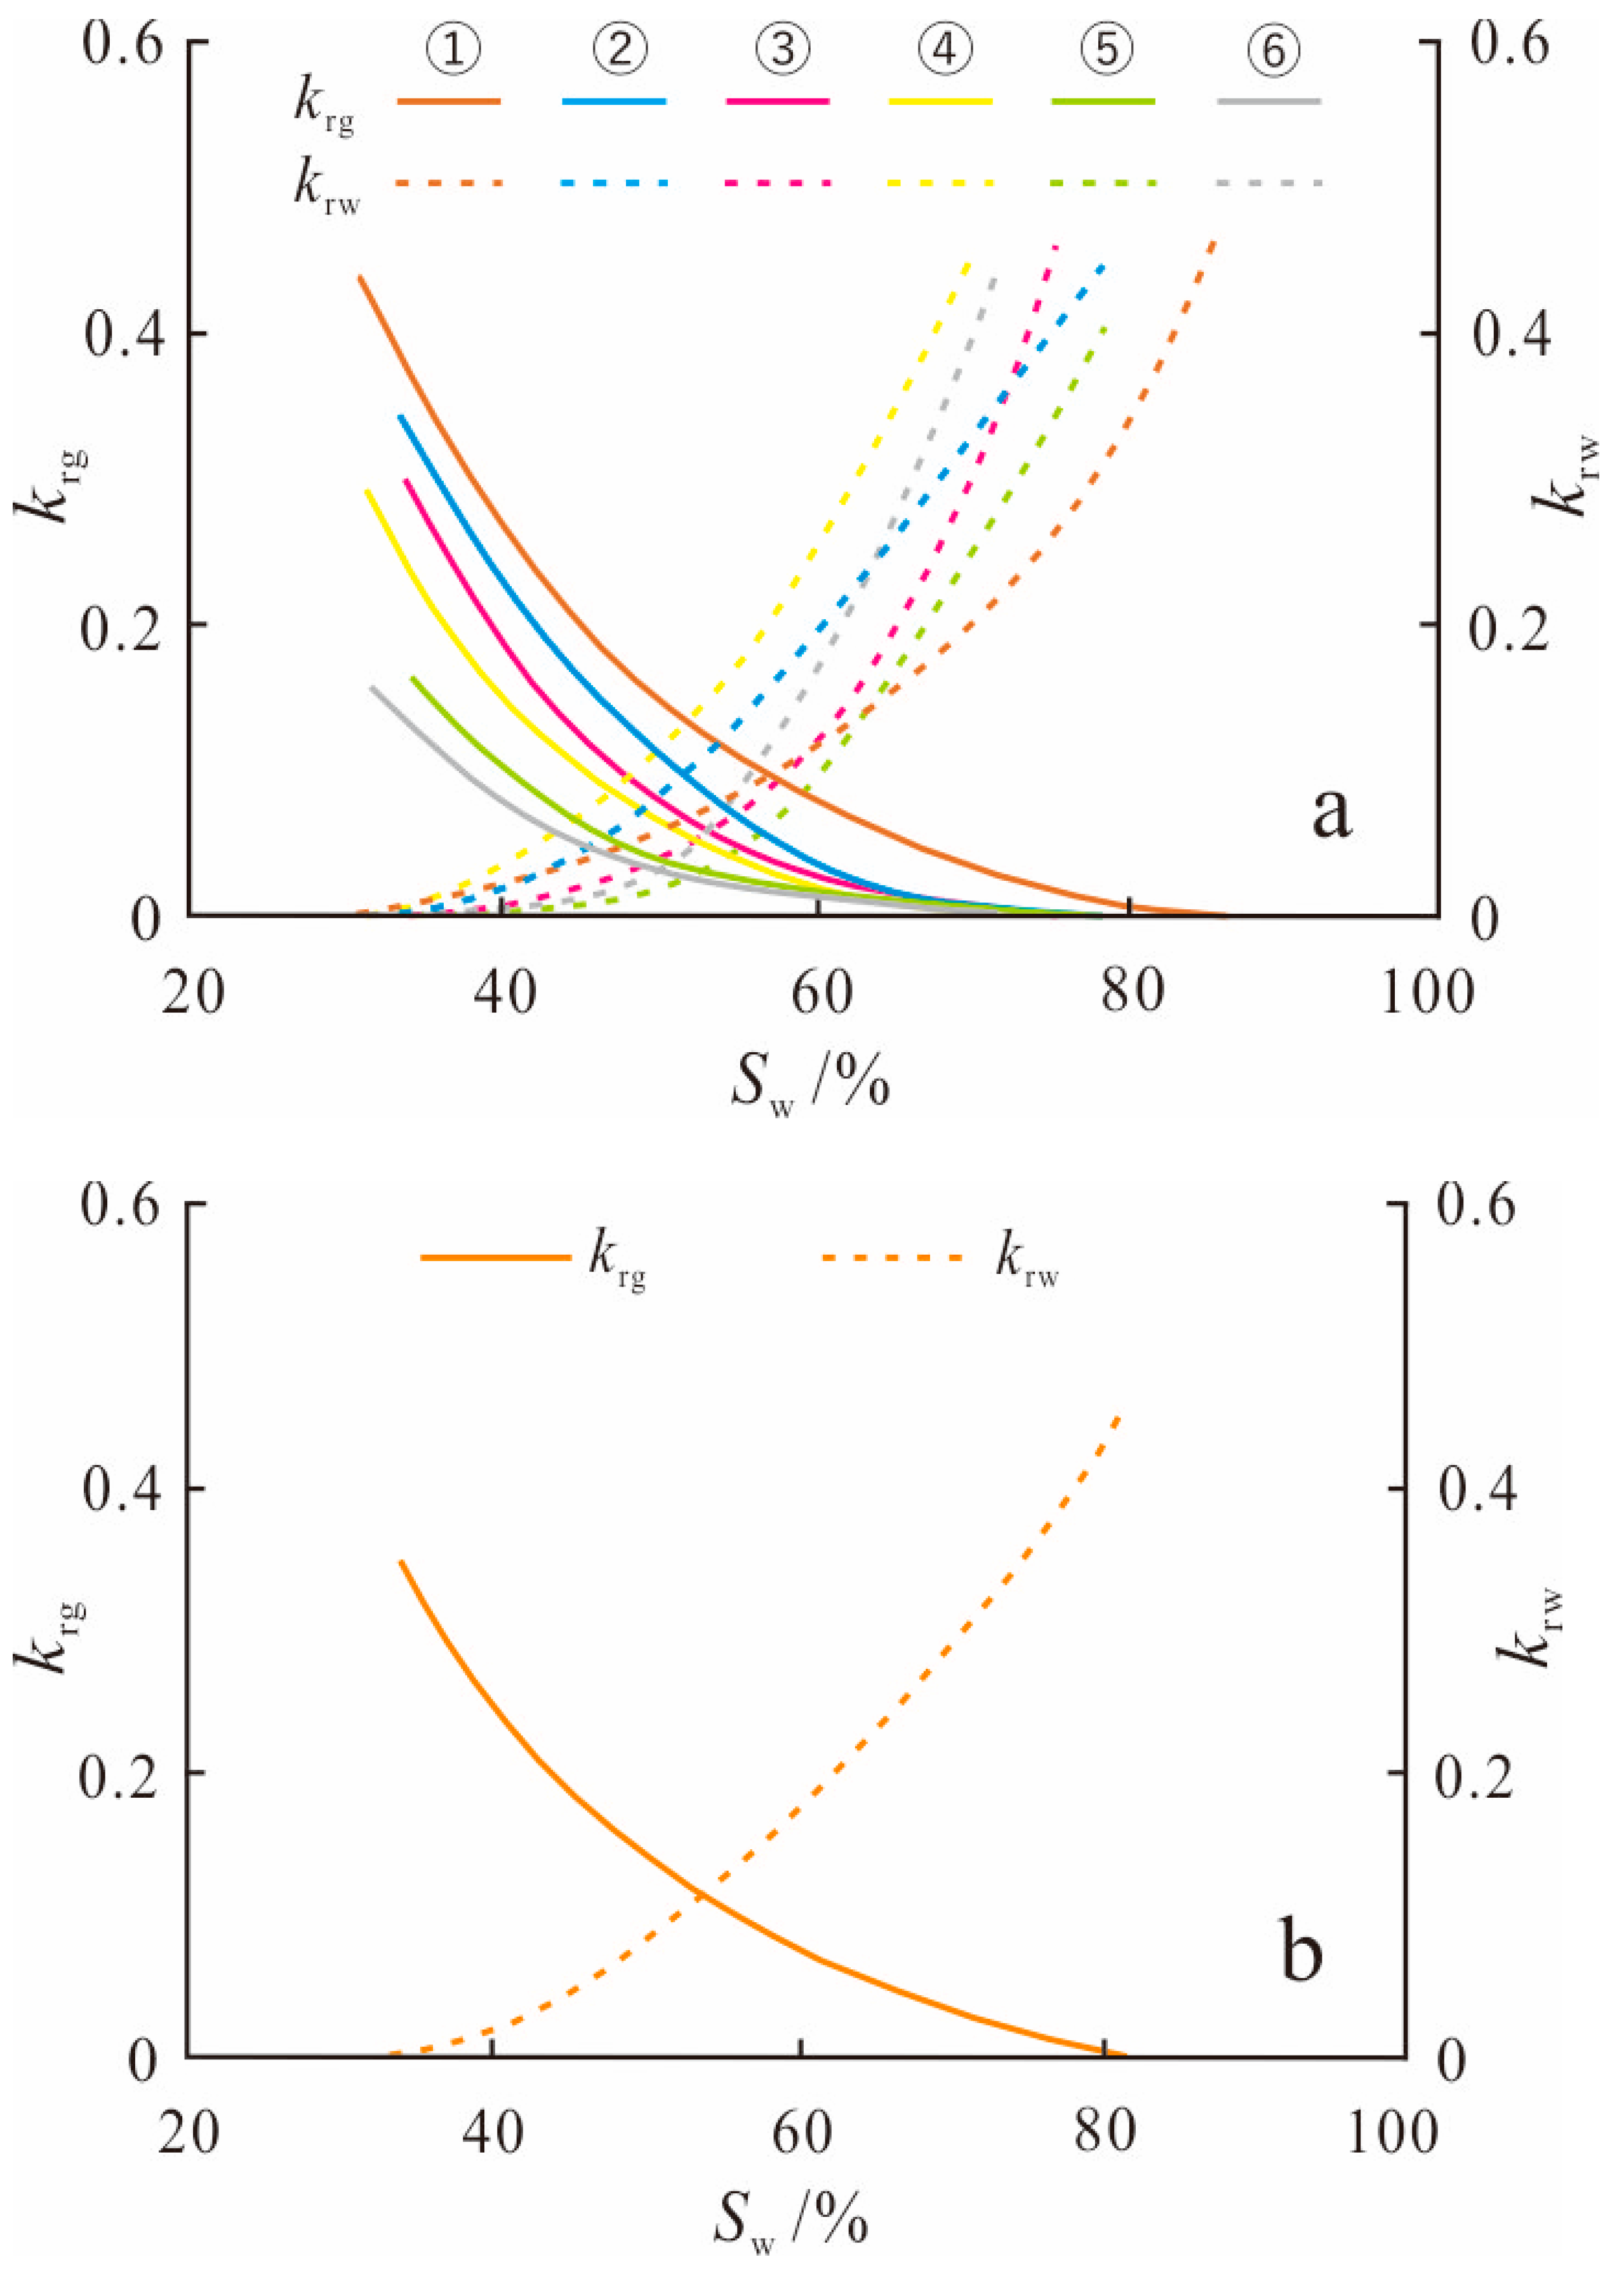
3.2.2. Calibration of Relative Permeability Curves
3.2.3. Simulation of Water Production Splitting
4. Results and Application
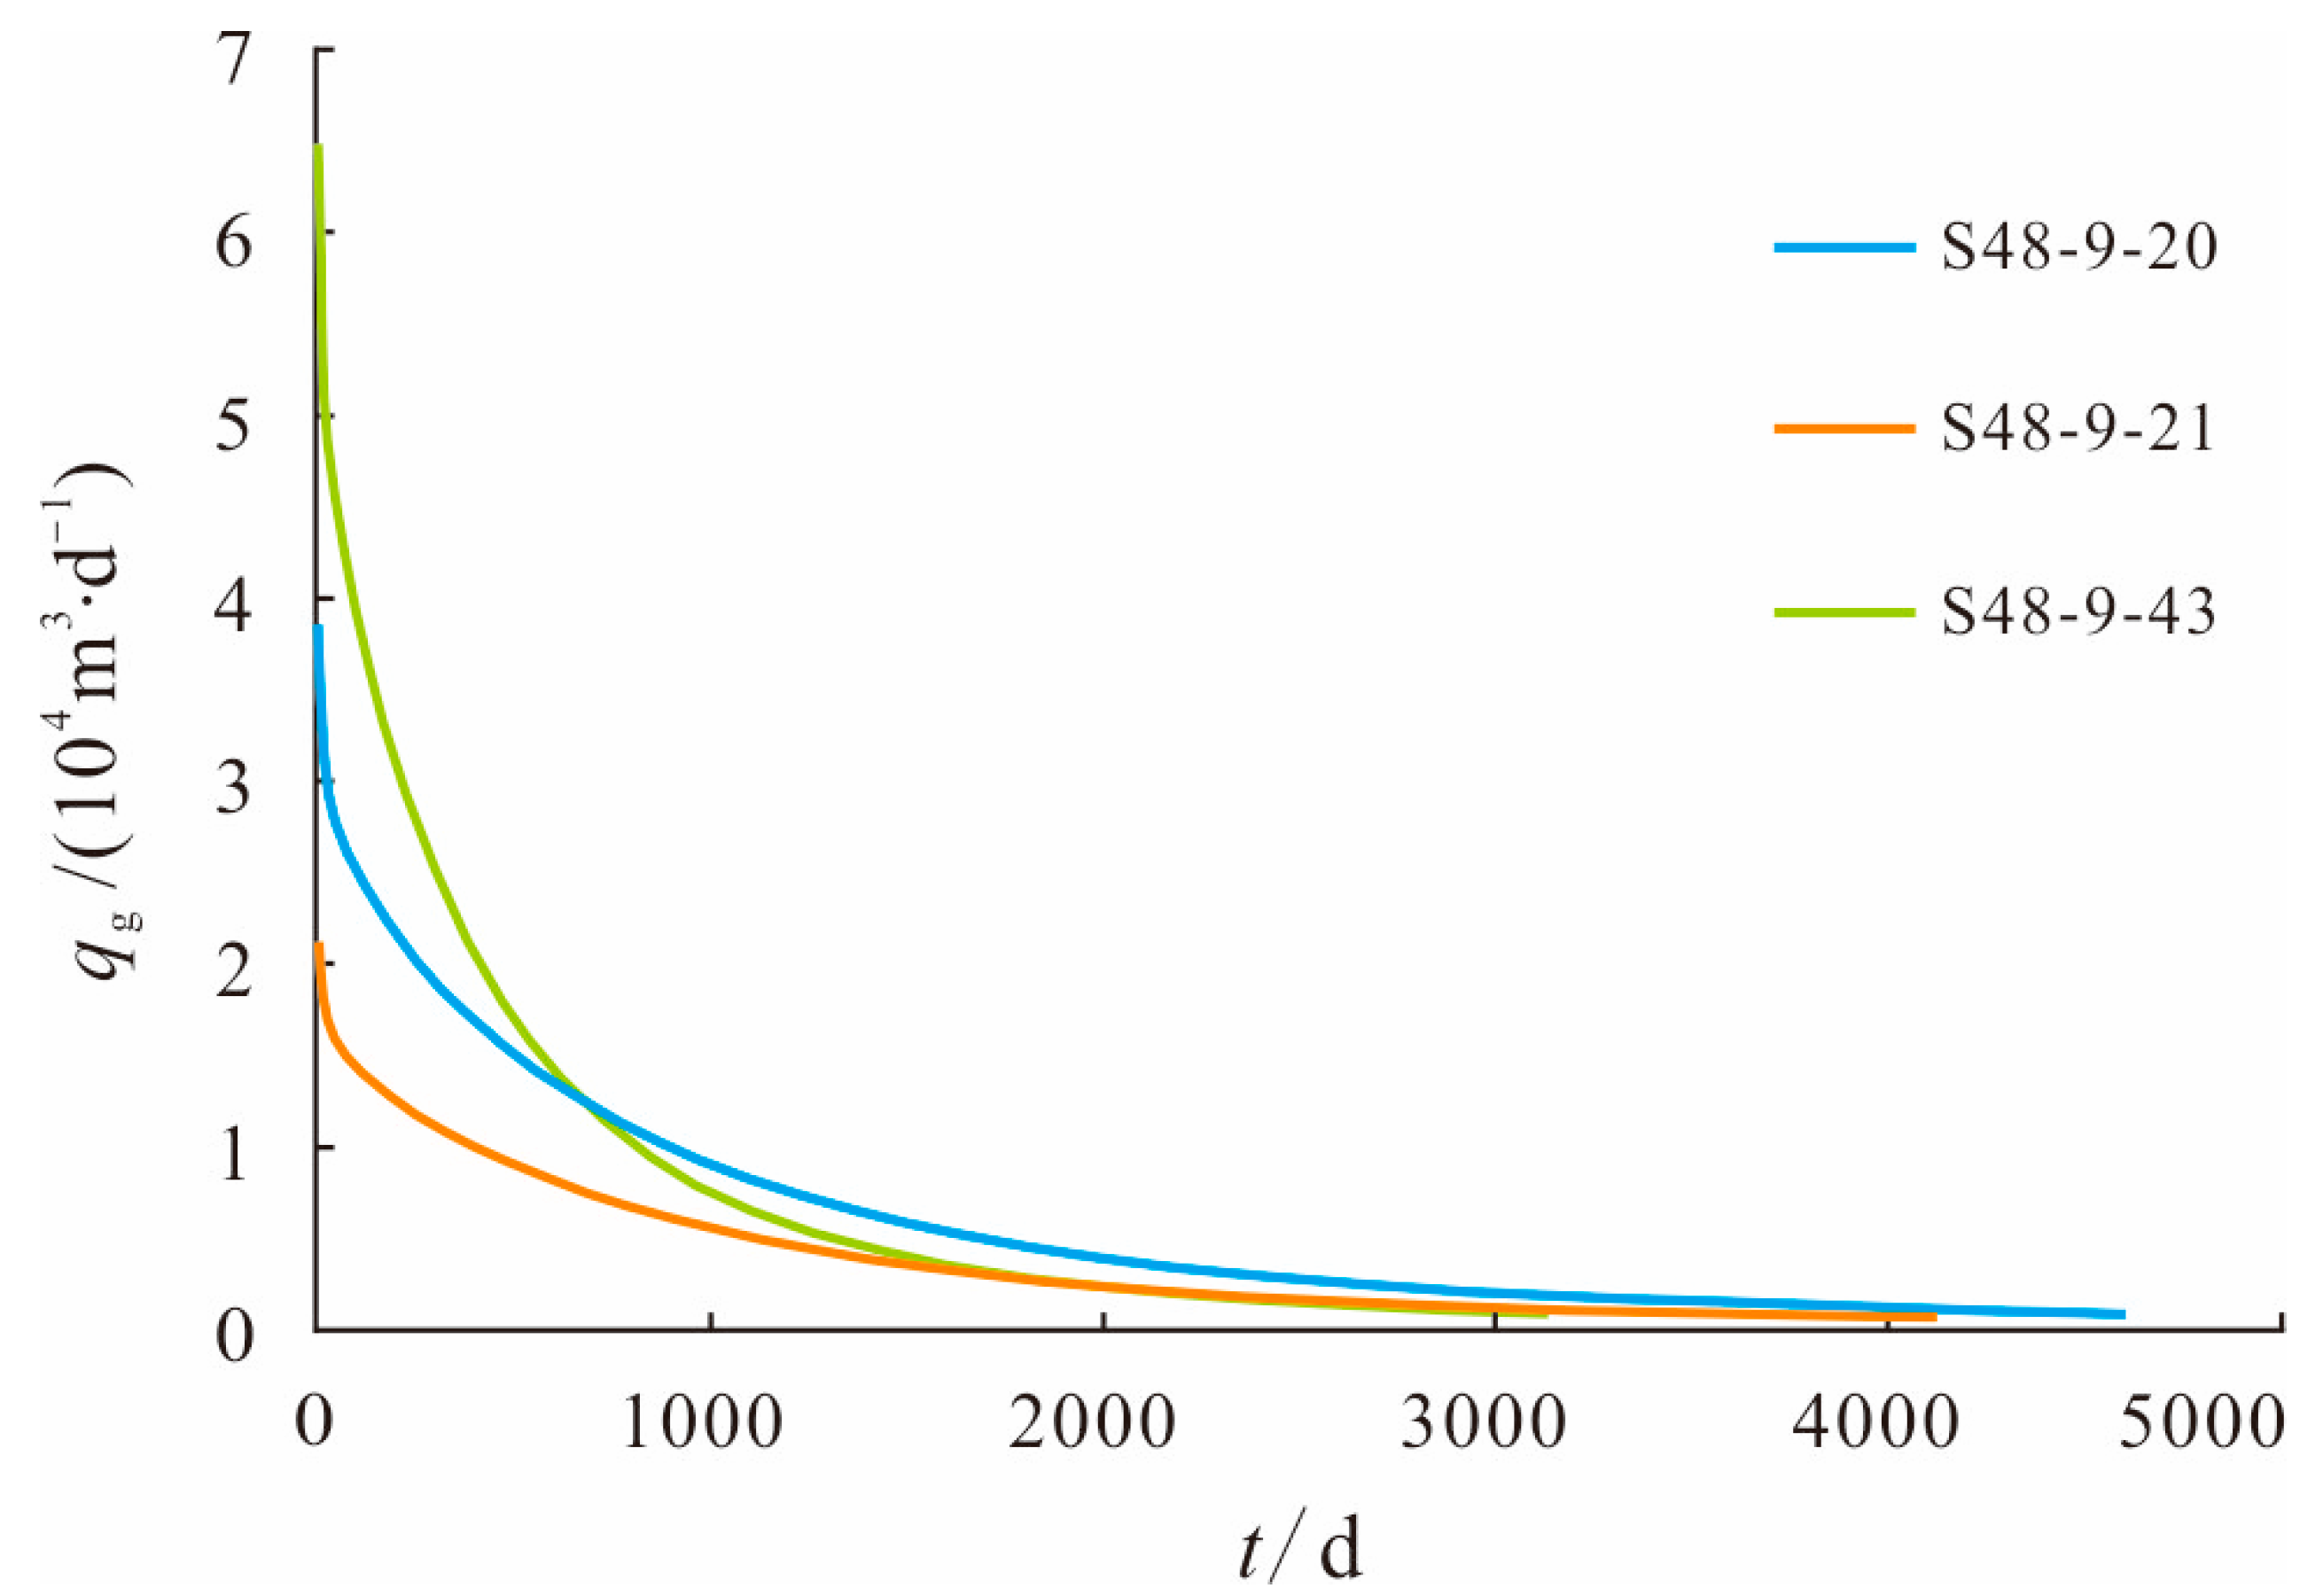
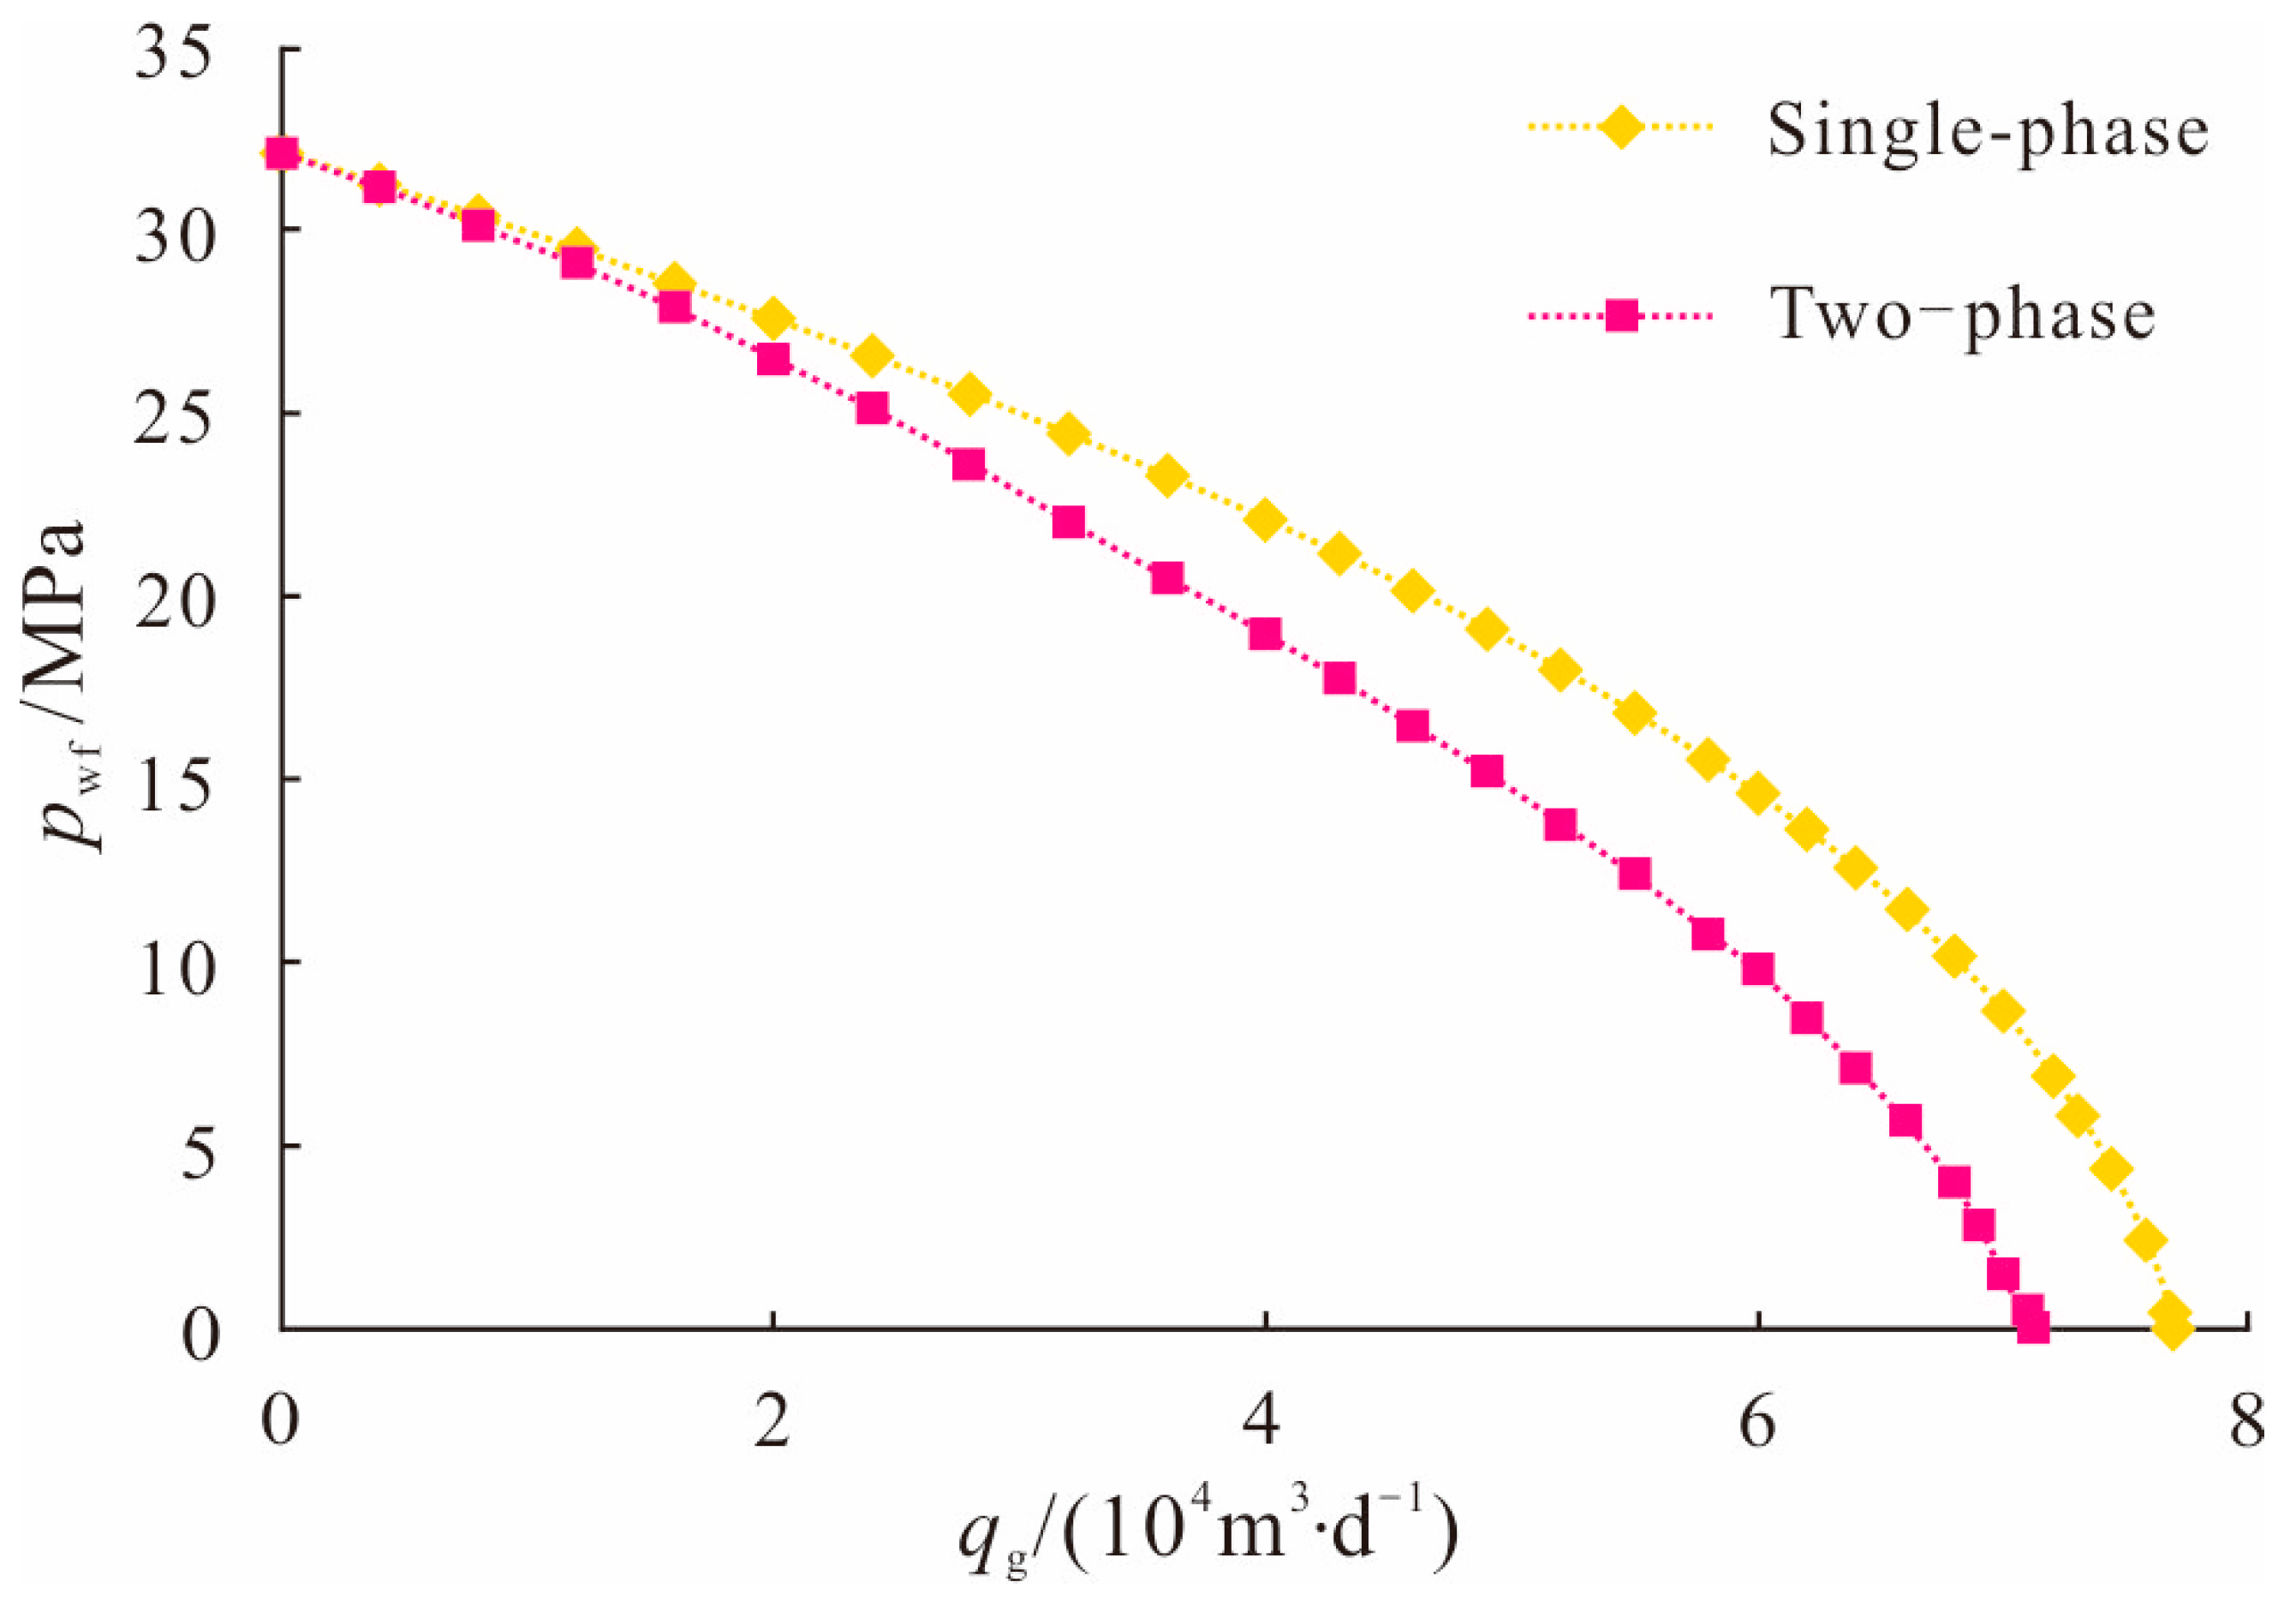
4.1. Calculation of Gas and Water Productivity
4.2. Determination of Deliquification Period
5. Conclusions
Author Contributions
Funding
Institutional Review Board Statement
Informed Consent Statement
Data Availability Statement
Conflicts of Interest
Nomenclature
| K | Permeability, μm2 |
| h | Reservoir thickness, m |
| Kh | Formation coefficient, μm2·m |
| φ | Porosity, % |
| Sg | Gas saturation, % |
| φSg | Storage capacity coefficient, 0.1‰ |
| Qg | Daily gas production during well testing, 104 m3·d−1 |
| Qw | Daily water production during well testing, m3·d−1 |
| vt | Critical flow rate, m·s−1 |
| ρL | Liquid density, kg/m3 |
| ρg | Gas density, kg/m3 |
| σ | Gas–liquid surface tension, N·m−1 |
| A | Tubing sectional area, m2 |
| p | Tubing pressure, MPa |
| T | Temperature, K |
| z | Gas compressibility factor, dimensionless |
| γg | Relative density of natural gas, dimensionless |
| qc | Critical liquid-carrying flow rate of gas wells, 104 m3·d−1 |
| qw | Daily water production, m3·d−1 |
| Wp | Daily water production at gas gathering stations, m3·d−1 |
| RWGi (i = 1, 2, …n) | WGR obtained in gas–water two-phase test, m3·(104 m3)−1 |
| GR | Gamma ray, API |
| t | Time, day |
| qg | Daily gas production, 104 m3·d−1 |
| pwf | Bottom-hole pressure, MPa |
| φ | Pseudo-pressure, MPa |
| pe | Formation pressure, MPa |
| r | Distance from wellbore, m |
| re | Drainage radius, m |
| rw | Borehole caliper, m |
| s | Skin factor, dimensionless |
| α | Liquid gas quality ratio, dimensionless |
| ρgsc | Standard gas density, kg/m3 |
| β | Integral coefficient, dimensionless |
| krg, krw | Gas and water relative permeability, dimensionless |
| Sw | Water saturation, % |
| μg | Gas viscosity, mPa·s |
| λ | Laminar flow coefficient, MPa2·(104 m3·d−1)−1 |
| ξ | Turbulence coefficient, MPa2·(104 m3·d−1)−2 |
| TP | Deliquification time, day |
| V2000 | Wellbore liquid volume when loaded liquid level is 2000 m, m3 |
| QPW | Split water production, m3·d−1 |
References
- Wang, J.P.; Zhang, C.W.; Li, J.Y.; Li, Y.; Li, X.F.; Liu, P.; Lu, J.C. Tight sandstone gas reservoirs in the Sulige Gas Field: Development understandings and stable-production proposals, Ordos Basin. Nat. Gas Ind. 2021, 41, 100–110. [Google Scholar] [CrossRef]
- He, D.B.; Ji, G.; Jiang, Q.F.; Cheng, L.H.; Meng, D.W.; Wang, G.T.; Guo, Z.; Cheng, M.H.; Han, J.C. Differential development technological measures for high-water-cut tight sandstone gas reservoirs in western area of Sulige Gas Field. Nat. Gas Ind. 2022, 42, 73–82. [Google Scholar] [CrossRef]
- Guang, Y.H.; Zhang, Z.W.; Peng, S.X.; Zheng, L.J. Multidisciplinary integrated gas-water interpretation and evaluation technology for low resistance tight gas reservoirs. Fault-Block Oil Gas Field 2022, 29, 508–513. [Google Scholar] [CrossRef]
- Wang, R.; Wei, M.J.; Hu, G.X.; Jiang, D.X.; Ju, Y.J.; Zhang, N.S. The distribution law of critical liquid—Carrying parameters along the depth of the gas wells with restrictor in Sulige gas field. Spec. Oil Gas Reserv. 2020, 27, 162–166. [Google Scholar] [CrossRef]
- Zhang, J.; Li, X.Z.; Gao, S.S.; Ye, L.Y.; Liu, H.X.; Zhu, W.Q.; Fang, F.F. Water production mechanism of tight sandstone gas reservoirs and its influence on percolation capacity. Nat. Gas Geosci. 2019, 30, 1519–1530. [Google Scholar] [CrossRef]
- Li, J.S.; Liu, Z.X.; Kou, S.Y.; Zhang, X.M.; Liu, R.M.; Wang, J.W. Study on Main Controlling Factors of Water Production in Tight Gas Wells. Xin-Jiang Oil Gas 2022, 18, 20–25. [Google Scholar] [CrossRef]
- Dai, J.Y.; He, S.L. Discovery and significance of faults in the Mid Gas field, Ordos Basin. Pet. Explor. Dev. 2010, 37, 188–195. [Google Scholar]
- Xu, H.; Zhang, J.F.; Tang, D.Z.; Li, M.; Zhang, W.Z.; Lin, W.J. Controlling factors of underpressure reservoir in the Sulige gas field, Ordos Basin. Pet. Explor. Dev. 2012, 39, 64–68. [Google Scholar] [CrossRef]
- Dai, J.Y.; Li, J.T.; Wang, B.G.; Pan, R. Distribution regularity and formation mechanism of gas and water in the western area of Sulige gas field, NW China. Pet. Explor. Dev. 2012, 39, 524–529. [Google Scholar] [CrossRef]
- Yang, R.C.; Dong, L.; Zhang, J.; Wang, Y.; Fan, A.P. Origin, distribution and controlling factors of stratigraphic water in the western Sulige gas field. Acta Sedimentol. Sin. 2022, 40, 267–280. [Google Scholar] [CrossRef]
- Meng, D.W.; Jia, A.L.; Ji, G.; He, D.B. Water and gas distribution and its controlling factors for large scale tight sand gas fields: A case study of western Sulige gas field, Ordos Basin, NW China. Pet. Explor. Dev. 2016, 43, 607–614. [Google Scholar] [CrossRef]
- Dou, W.T.; Liu, X.S.; Wang, T. The origin of formation water and the regularity of gas and water distribution for the Sulige gas field, Ordos Basin. Acta Pet. Sin. 2010, 31, 767–773. [Google Scholar]
- Fang, J.L.; Meng, D.W.; He, D.B.; Ji, G.; Wei, Y.S. Gas and water formation recognition and water producing well investigation in the western Sulige Gas Field, Ordos Basin. Nat. Gas Geosci. 2015, 26, 2343–2351. [Google Scholar] [CrossRef]
- Fu, J.H.; Dong, G.D.; Zhou, X.P.; Hui, X.; Dan, W.D.; Fan, L.Y.; Wang, Y.G.; Zhang, H.T.; Gu, Y.H.; Zhou, G.X. Research progress of petroleum geology and exploration technology in Ordos Basin. China Pet. Explor. 2021, 26, 19–40. [Google Scholar] [CrossRef]
- Wei, Q.S.; Wei, K.Y.; Li, Z.L.; Yang, S.G.; Hao, J.H.; Pang, Q.; Dong, X.X.; Zhu, Y.S. Diagenesis and porosity evolution of tight sandstone gas reservoirs in the western Sulige area, Ordos Basin. Geol. Explor. 2021, 57, 439–449. [Google Scholar] [CrossRef]
- Turner, R.G.; Hubbard, M.G.; Dukler, A.E. Analysis and Prediction of Mini-mum Flow Rate for the Continuous Removal of Liquids from Gas well. J. Pet. Technol. 1969, 21, 1475–1482. [Google Scholar] [CrossRef]
- Li, M.; Sun, L.; Li, S.L. New view on continuous-removal liquids from gas wells. SPE Prod. Fac. 2002, 17, 42–46. [Google Scholar] [CrossRef]
- Bilgesu, H.I.; Ternyik, J. A New Multi-Phase Flow Model for Horizontal, Inclined, and Vertical Pipes. In Proceedings of the SPE Eastern Regional Meeting, Charleston, WV, USA, 8–10 November 1994. [Google Scholar] [CrossRef]
- Li, M.; Guo, P.; Zhang, M.L.; Mei, H.Y.; Liu, W.; Li, S.L. Comparative study of two models for continuous removal of liquids from gas wells. J. Southwest Pet. Inst. 2002, 24, 30–32. [Google Scholar]
- Yu, S.M.; Tian, J.F. Research and application of drainage-based gas recovery technology in the Sulige Gas Field, Ordos Basin. Drill. Prod. Technol. 2012, 35, 40–43. [Google Scholar] [CrossRef]
- Zhang, M.L.; Fan, Y.H.; He, G.H.; Zhang, Z.L.; Tian, J.F. Latest progress in development technologies for low-permeability gas reservoirs in the Changqing gas zone. Nat. Gas Ind. 2013, 33, 1–7. [Google Scholar] [CrossRef]
- Li, S.C.; Lai, F.P.; Zhao, L.B.; Xu, D.D.; Lu, G.T. Experiment on fluid occurrence and gas-water flow in tight gas reservoir. Nat. Gas Geosci. 2021, 32, 1410–1419. [Google Scholar] [CrossRef]
- Ji, W. Gas water relative flow of tight sandstone gas reservoirs and its influencing factors: Case study of member 8 of Permian Xiashihezi formation and member 1 of Permian Shanxi formation in Shaan well 234-235 area of Sulige gas field in Ordos basin. J. Jilin Univ. Earth Sci. Ed. 2019, 49, 1540–1551. [Google Scholar] [CrossRef]
- Zhang, G.D.; Wu, Z.; Li, Y.C.; Chen, Y.J.; Yang, Q.S.; Pan, Y. Testing device and method for unsteady gas—water relative permeability under high temperature and high pressure. Spec. Oil Gas Reserv. 2021, 28, 78–82. [Google Scholar] [CrossRef]
- Jia, A.L.; Guo, Z.; Guo, J.L.; Yan, H.J. Research achievements on reservoir geological modeling of China in the past three decades. Acta Pet. Sin. 2021, 42, 1506–1515. [Google Scholar] [CrossRef]
- Pan, T.T.; Zhang, F.; Xing, K.M.; Wang, Y.Z.; Zhang, M.; Lai, L.B. Evaluation of the relative-permeability-curve normalizing method for the different reservoirs. Pet. Geol. Oilfield Dev. Daqing 2016, 35, 78–82. [Google Scholar] [CrossRef]
- Ma, X.H.; Jia, A.L.; Tan, J.; He, D.B. Tight sand gas development technologies and practices in China. Pet. Explor. Dev. 2012, 39, 572–579. [Google Scholar] [CrossRef]
- He, D.B.; Jia, A.L.; Ji, G.; Wei, Y.S.; Tang, H.F. Well type and pattern optimization technology for large scale tight sand gas, Sulige gas field. Pet. Explor. Dev. 2013, 40, 79–89. [Google Scholar] [CrossRef]
- Wu, S.H.; Li, Y.P. Reservoir modeling: Current situation and development prospect. Mar. Orig. Pet. Geol. 2007, 12, 53–60. [Google Scholar]
- Wu, J.; Li, F.H. Prediction of oil-bearing single sand body by 3D geological modeling combined with seismic inversion. Pet. Explor. Dev. 2009, 36, 623–627. [Google Scholar]
- Jia, A.L.; Cheng, L.H. The technique of digital detailed reservoir characterization. Pet. Explor. Dev. 2010, 37, 709–715. [Google Scholar] [CrossRef]
- Sun, L.D.; Sa, L.M.; Dong, S.T. New challenges for the future hydrocarbon in China and geophysical technology strategy. Oil Geophys. Prospect. 2013, 48, 317–324. [Google Scholar] [CrossRef]
- Guo, Z.; Sun, L.D.; Jia, A.L.; Lu, T. 3D geological modeling for tight sand gas reservoir of braided river facies. Pet. Explor. Dev. 2015, 42, 76–83. [Google Scholar] [CrossRef]
- Sun, E.H.; Li, X.P.; Wang, W.D. Production analysis method and gas two-phase flow well in low permeability gas reservoirs. Lithol. Reserv. 2012, 24, 121–124. [Google Scholar]
- Wang, F.P.; Huang, Q.H. A single point deliverability forecasting formula for water-producing gas well. Xinjiang Pet. Geol. 2009, 30, 85–86. [Google Scholar]
- Huang, Q.H.; Wang, F.P.; Chen, Y. Productivity evaluation of water-producing gas wells in low-permeability gas reservoirs. Pet. Geol. Oilfield Dev. Daqing 2010, 29, 73–76. [Google Scholar] [CrossRef]
- Wang, B.; Yang, H.Y.; Wang, H.; Zhong, X.Y. A new method for analyzing modified isochronal test data in tight gas wells. J. Yangtze Univ. Nat. Sci. Ed. 2016, 13, 54–59. [Google Scholar] [CrossRef]


| Method | Applicable Gas Well | Diagnosis Standard | Proposed Treatments |
|---|---|---|---|
| Gas production testing | Gas production testing well | WGR > 1 × m3·(104 m3)−1 | 1. Short-term shut-in for pressure buildup and foam drainage; 2. Pressure buildup in tubing and foam drainage |
| Pilot production | Pilot production well | ||
| Two-phase gas–liquid metering test | Production well | ||
| Liquid level detection | Production well | Tubing liquid level < 2000 m | 1. Repeated foam drainage; 2. Foam drainage after retrieving the flow regulator |
| Production performance analysis | Production well | Casing pressure drop rate > 0.02 MPa per day and gas production per unit of casing pressure drop < 30 × 104 m3·MPa−1 | 1. Periodic running of compressor and foam drainage; 2. Continuous tubing and foam drainage |
| Modeling Area | Area (km2) | Average Porosity (%) | Average Permeability (10−3 μm2) | Average Water Saturation (%) | Reserves (108 m3) |
|---|---|---|---|---|---|
| S48-5 | 283.3 | 10.6 | 0.065 | 58 | 294.6 |
| Modeling Area | Meshing Method | Planar Mesh Step (m) | Vertical Mesh Step (m) | Total Cells |
|---|---|---|---|---|
| S48-5 | Corner-point grid | 50 × 50 | 0.5 | 37,155,840 |
| Well | Water Production (m3·d−1) | WGR (m3·10−4 m−3) | Well | Water Production (m3·d−1) | WGR (m3·10−4 m−3) |
|---|---|---|---|---|---|
| S48-9-20 | 0.62 | 1.50 | S48-7-29 | 0.40 | 1.04 |
| S48-9-21 | 1.54 | 4.54 | S48-9-36 | 0.18 | 3.60 |
| S48-9-22 | 1.22 | 4.06 | S48-9-39 | 0.19 | 0.35 |
| S48-5-26 | 0.11 | 0.35 | S48-9-43 | 1.38 | 2.82 |
| S48-7-21 | 1.19 | 2.63 | S48-7-46 | 0.17 | 0.53 |
| S120-43-96 | 3.24 | 23.13 | S48-7-39 | 0.16 | 0.60 |
| S120-43-98 | 0.21 | 1.31 | S48-6-33 | 0.24 | 1.58 |
| S48-3-24 | 0.25 | 1.05 | S48-8-41 | 0.20 | 0.85 |
| S48-5-25 | 0.24 | 1.06 | S48-9-40 | 0.26 | 1.06 |
| S48-9-27 | 0.14 | 0.72 | S48-9-48 | 0.44 | 1.53 |
| Well | Water Production (m3·d−1) | Relative Error (%) | |
|---|---|---|---|
| Two-Phase Gas–Water Metering Test | Calculation | ||
| S48-7-21 | 1.15 | 1.19 | 3.5 |
| S48-9-48 | 0.48 | 0.44 | 8.3 |
| Well | Open-Flow Capacity (104 m3·d−1) | ||||
|---|---|---|---|---|---|
| Single-Phase Equation (Without Water Production) | Two-Phase Equation | Numerical Simulation | Average of Two-Phase Equation and Numerical Simulation (With Water Production) | Error (%) | |
| S48-9-20 | 4.22 | 3.83 | 3.82 | 3.83 | 9.2 |
| S48-9-43 | 7.73 | 6.97 | 6.45 | 6.71 | 13.2 |
| S48-9-21 | 2.45 | 2.14 | 2.08 | 2.11 | 13.9 |
| Type of Water-Producing Well | WGR (m3·10−4 m−3) | Characteristics | Retained Water in Wellbore (m3·d−1) | Deliquification Period (d) |
|---|---|---|---|---|
| Small water production | <1 | Production is basically steady and continuous. | 0.162 | 125 |
| Medium-loaded well | 1–3 | Production is continuous within a period of time, but liquids are loaded in the bottom hole. | 0.999 | 20 |
| Severely-loaded well | >3 | Production is impossible. Liquids are loaded in the bottom hole for a short period of time and production is suspended. | 7.725 | 3 |
| Well | Daily Gas Production before Deliquification (104 m3·d−1) | Daily Gas Production after Deliquification (104 m3·d−1) | Increase in Production (%) |
|---|---|---|---|
| S48-13-45 | 0.23 | 0.35 | 52.2 |
| S48-20-72 | 0.22 | 0.84 | 281.8 |
| S48-15-63 | 0.28 | 0.74 | 164.3 |
| S48-5-71 | 0.5 | 1.01 | 102 |
| S20-16-16 | 0.39 | 1.25 | 220.5 |
| S20-12-12 | 0.6 | 1.4 | 133.3 |
| S20-13-6 | 0.87 | 2.14 | 146 |
| S20-11-11 | 0.4 | 1.1 | 175 |
| S6-21-12 | 0.63 | 0.65 | 3.2 |
| S14-8-41 | 0.21 | 0.51 | 142.8 |
Disclaimer/Publisher’s Note: The statements, opinions and data contained in all publications are solely those of the individual author(s) and contributor(s) and not of MDPI and/or the editor(s). MDPI and/or the editor(s) disclaim responsibility for any injury to people or property resulting from any ideas, methods, instructions or products referred to in the content. |
© 2023 by the authors. Licensee MDPI, Basel, Switzerland. This article is an open access article distributed under the terms and conditions of the Creative Commons Attribution (CC BY) license (https://creativecommons.org/licenses/by/4.0/).
Share and Cite
Meng, D.; He, D.; Guo, Z.; Wang, G.; Ji, G.; Tang, H.; Zeng, Q. Dynamic Analysis of High-Water-Cut Tight Sandstone Gas Reservoirs and Study of Water Production Splitting of Gas Wells: A Case Study on the Western Sulige Gas Field, Ordos Basin, NW China. Processes 2023, 11, 2093. https://doi.org/10.3390/pr11072093
Meng D, He D, Guo Z, Wang G, Ji G, Tang H, Zeng Q. Dynamic Analysis of High-Water-Cut Tight Sandstone Gas Reservoirs and Study of Water Production Splitting of Gas Wells: A Case Study on the Western Sulige Gas Field, Ordos Basin, NW China. Processes. 2023; 11(7):2093. https://doi.org/10.3390/pr11072093
Chicago/Turabian StyleMeng, Dewei, Dongbo He, Zhi Guo, Guoting Wang, Guang Ji, Haifa Tang, and Qian Zeng. 2023. "Dynamic Analysis of High-Water-Cut Tight Sandstone Gas Reservoirs and Study of Water Production Splitting of Gas Wells: A Case Study on the Western Sulige Gas Field, Ordos Basin, NW China" Processes 11, no. 7: 2093. https://doi.org/10.3390/pr11072093
APA StyleMeng, D., He, D., Guo, Z., Wang, G., Ji, G., Tang, H., & Zeng, Q. (2023). Dynamic Analysis of High-Water-Cut Tight Sandstone Gas Reservoirs and Study of Water Production Splitting of Gas Wells: A Case Study on the Western Sulige Gas Field, Ordos Basin, NW China. Processes, 11(7), 2093. https://doi.org/10.3390/pr11072093