Abstract
In the process of electroslag remelting (ESR) for large-sized slab ingots, controlling the surface quality of the slab ingot is challenging due to its relatively high width-to-thickness ratio. In this study, a three-dimensional dynamic mathematical model for single-electrode ESR slab ingots was developed using dynamic mesh technology, with the aid of the commercial software FLUENT. The model is based on the electromagnetic field equation, flow field equation, and energy equation. A detailed analysis of various physical fields and the distribution law of the metal pool shape was conducted. According to the calculation results, the maximum flow velocity of the molten slag was found below the consumable electrode, with the range of maximum velocity at different time points varying between 4.35 × 10⁻² and 4.88 × 10⁻² m/s. The range of the maximum temperature for the slag bath at different time points was between 2118 and 2122 K. As the remelting continued, the impact of the forced cooling of the bottom plate on the temperature of the metal pool weakened. Consequently, the temperature gradient of the electroslag ingot gradually decreased, the depth of the metal pool increased, and the height of the metal liquid head in the metal pool rose. The effects of different voltages, filling ratios, and mold chamfers on the shape of the metal pool were investigated using the established mathematical model. Based on the research findings from the mathematical model, the technical processes for ESR J80 large-sized slab ingots were improved, providing solutions to improve the surface quality of the ESR large-sized slab ingots.
1. Introduction
In recent years, with the rapid development of nuclear power, petrochemicals, and other industries, the demand for high-end ultrathick sheets in major national projects, equipment, military industry, and national defense has become increasingly urgent. Electroslag remelting (ESR) for large-sized slab ingots is a preferred method for smelting high-quality ultrathick sheets due to its excellent metallurgical reaction conditions and unique crystallization mode, which outperforms other steelmaking methods [1]. However, the quality control in the ESR process for large-sized slab ingots presents distinct challenges compared with conventional ESR, primarily due to the nonuniformity of the temperature field and cooling conditions. The comparatively large width-to-thickness ratio of ESR slab ingots and the wide distance between the ingot corners and the central area of the heat source make it difficult to control the surface quality [2].
In earlier research, numerous scholars have investigated the effects of technical parameters in the process of typical ESR round ingots on the transfer phenomenon and solidification behavior through numerical simulation, yielding favorable results [3,4,5,6,7]. Studies exploring the relationship between technical parameters and the quality of ESR slab ingots have been reported by scholars such as Zang [8], Chang [9], and Li [10]. However, these researchers have primarily focused on observing and establishing mathematical models for the slag bath, the electroslag ingot, or the entire electroslag system under quasi-stationary conditions. Due to limitations in computing power and the models themselves, the distribution of the temperature field and the flow field can only be solved by proposing various assumptions.
In this study, with the assistance of FLUENT software and based on the electromagnetic field equation, flow field equation, and energy equation, a three-dimensional dynamic mathematical model for single-electrode ESR slab ingots was developed using dynamic mesh technology. Additionally, a detailed analysis of the distribution law of the metal pool shape in single-electrode ESR slab ingots was conducted. The effects of different voltages, filling ratios, and mold chamfers on all physical fields and the shape of the metal pool were investigated using the established mathematical model. According to the research findings, production techniques for ESR large-sized slab ingots were improved, providing solutions to improve the surface quality of electroslag slab ingots.
2. Mathematical Model
2.1. Governing Equation
2.1.1. Governing Equation of the Electromagnetic Field
In this paper, the electromagnetic field of ESR slab ingots was calculated using the electric potential–magnetic potential method. The electric potential was obtained by solving the current conservation equation:
In the meantime, the magnetic flux density was related to the magnetic vector potential , which is expressed as [11]:
The time-averaged Joule heating and Lorentz force can be expressed as [12]
where is the density of the current, A·m−2, and σ is the electric conductivity, S·m−1.
2.1.2. Governing Equation of the Fluid Flow
In this model, the viscosity is assumed to be constant, and the material density, calculated under the Boussinesq assumption, is applied only for the calculation of buoyancy. To address the flow resistance in the liquid–solid two-phase area due to the solidification of the liquid metal, the enthalpy–porosity method is employed. The flow of ESR slab ingots is described using the momentum equation and the turbulence equation, with the forms of the vectors expressed as follows:
where:
—density of the melt, kg/m3;
—velocity, m/s;
—kinetic viscosity, Pa·s;
—coefficient of thermal expansion, 1/K;
—electromagnetic force, N/m3;
—gravitational acceleration, m/s2.
The turbulence behavior of the slag bath and the metal pool was selected and processed using the RNG κ-ε turbulence model. The enhanced wall function method was employed for the treatment of areas near the wall [13]. This method does not rely on the empirical wall function and is, therefore, more suitable for problems involving complex flows and flows in low Re areas [14].
2.1.3. Heat Transfer Equation
The temperature field of the ESR slab ingot system was calculated by solving the enthalpy conservation equation [15].
where: —coefficient of effective thermal conductivity, W/(m·K);
Q—Joule heat; W/m3;
—sensible enthalpy, J/kg;
—latent heat, J/kg; href—a reference value for enthalpy at the reference temperature, J/kg;
L—latent heat released during the solidification of the liquid steel, J/kg;
—specific heat of liquid steel, J/(kg·K);
Tsolidus—solidus temperature of liquid steel, K;
Tliquidus—liquidus temperature of liquid steel, K.
The solidification of the liquid steel was handled using the enthalpy–porous media model, wherein the two-phase area of the metal pool was treated as a porous medium. During the solidification of the liquid steel, the liquid fraction decreased from 1 to 0.
2.1.4. Dynamic Mesh Model
In this paper, the dynamic mesh technology was adopted to account for the continuous growth of the slab ingot. In the dynamic mesh model, the integral form for the conservation equation of the random variable ξ is expressed as follows [16,17]:
where:
—density of liquid;
—velocity vector of liquid;
—mesh deformation velocity of moving mesh;
—coefficient of diffusion;
—source term of flux;
—boundary of control body V.
In this paper, the moving boundaries include the electrode–slag interface, the free slag surface, and the slag–metal interface. After the remelting process stabilizes, the moving velocity of the boundary and the slag bath area is equal to the casting rate (vc) of the slab ingot. This can be expressed as follows:
where m stands for the melting rate of the electrode, kg/s;
ρ denotes the density of the slab ingot, kg/m3; and
rm represents the radius of the mold, m.
2.2. Boundary Condition
Figure 1 presents the schematic diagram of boundary conditions, with the specific boundary conditions listed in Table 1.
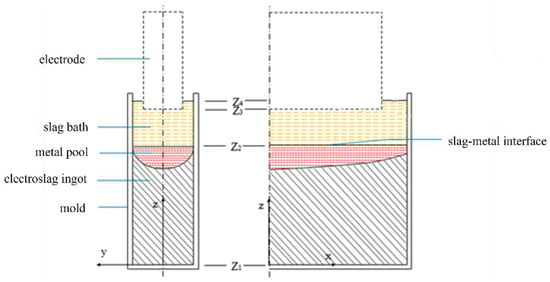
Figure 1.
Schematic diagram of boundary conditions (Z1—electroslag ingot bottom; Z2—slag–metal interface; Z3—electrode bottom; and Z4—free slag surface).

Table 1.
Boundary conditions.
2.3. Material Properties
J80 steel and ANF-6 (70% CaF2 + 30% Al2O3) slag were selected for simulation calculation in this paper. Table 2 presents the chemical composition of the J80 steel used for simulation. As shown in Table 3, the physical parameters of the J80 steel were calculated with Thermal-calc software. Table 3 presents the specific parameters of ANF-6 slag [18,19,20]. The specific technical parameters are shown in Table 4.

Table 2.
Chemical component of J80 steel (mass%).

Table 3.
Physical properties of J80 steel and ANF-6 slag.

Table 4.
Technical parameters of ESR process.
2.4. Numerical Implementation
Considering the symmetry of the model, a 1/4 section of the three-dimensional model was used for calculation to simplify the process. To better observe changes in various physical fields during the entire remelting process, the initial height of the electroslag ingot was set to 20 mm. The geometric model was divided into 42,925 meshes in total, with a mesh size of 2 mm. Figure 2 shows the mesh model.
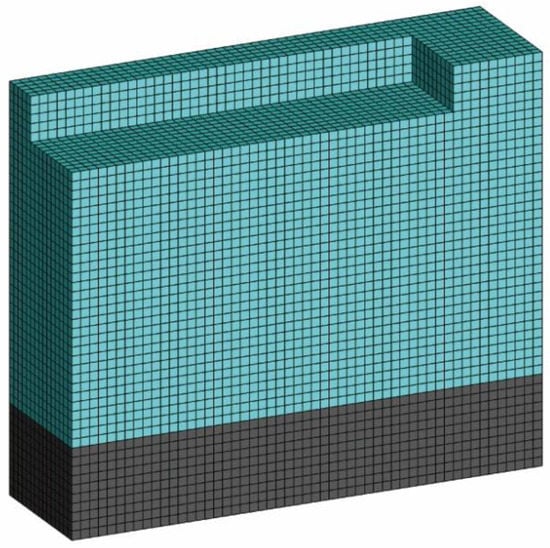
Figure 2.
Computational domain of ESR slab ingot process.
3. Results and Discussion
3.1. Calculation Results of the Velocity Field and the Temperature Field
Figure 3a shows the velocity field distribution of the slag bath in the ESR slab ingot at 70 s. The maximum flowing velocity of the molten slag was detected below the electrode and on both sides of the wide surface of the slab ingot, with a maximum value of 4.88 × 10⁻² m/s. The flowing velocity of the molten slag within the slag bath of the ESR slab ingot system ranged between 0 and 4.88 × 10⁻² m/s, according to the calculation results. This range was consistent with the range of velocity distribution in conventional ESR of slags (0 to 8.0 × 10⁻² m/s), as reported in the papers by Liu [21] and Szekely [22], providing supporting evidence for the validity of the mathematical model for ESR slab ingots constructed in this study. Figure 3b presents the velocity field at the y = 0 m section, while Figure 3c shows the velocity field at the x = 0 m section in ESR slab ingots. As shown in the figures, multiple flow field vortices appeared in the slag bath below the consumable electrode. After the electroslag ingot grows from 70 s to 400 s, the whole electroslag system reaches a quasi-steady state, and the distribution law of each field basically does not change.
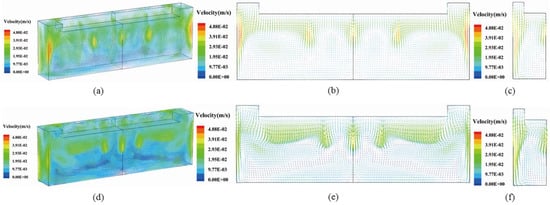
Figure 3.
Velocity field distribution of slag bath in ESR of slab ingots at different time points: (a–c) t = 70 s; (d–f) t = 400 s; (b,e) y = 0 m section; and (c,f) x = 0 m section.
Figure 3d shows the velocity field distribution of the slag bath in the ESR slab ingot at 400 s. As shown in the figure, the flow field vortices in the stable remelting period moved in a direction basically consistent with that in the initial stage of the remelting period but were larger in size. Three areas of maximum velocity appeared below the electrode, with a maximum velocity of 4.35 × 10⁻² m/s, which was slightly lower than that at t = 70 s due to a slight drop in the electromagnetic force as the remelting continued. At t = 400 s, the molten slag at the side wall of the wide surface of the slag bath flowed at a lower velocity than at t = 70 s. This was because the temperature of the slag bath became more uniform as the remelting continued, leading to a larger thermal buoyancy and weaker influence of gravity on the slag, which resulted in a drop in velocity.
Figure 4 presents the temperature field distribution in the ESR slab ingot at different time points. As shown in the figure, the high-temperature areas of the ESR slab ingot system were mainly distributed in the slag bath area, resulting in a much higher temperature of the slag bath than that of the electroslag ingot. Figure 4a–c depicts the temperature field distribution in the ESR slab ingot at t = 70 s, while Figure 4d–f presents the temperature field distribution at t = 400 s. The maximum temperature of the slag bath was 2123 K at t = 70 s and 2118 K at t = 400 s, the latter being higher than the maximum temperature of the slag bath (2053 K) obtained by Choudhary [22] in conventional ESR. At t = 70 s, shortly after the remelting began, the temperature gradient of the electroslag ingot was comparatively large due to the forced cooling effect of the bottom plate. However, as the remelting continued, the impact of the forced cooling on the temperature field of the electroslag ingot decreased, resulting in a smaller temperature gradient at t = 400 s.
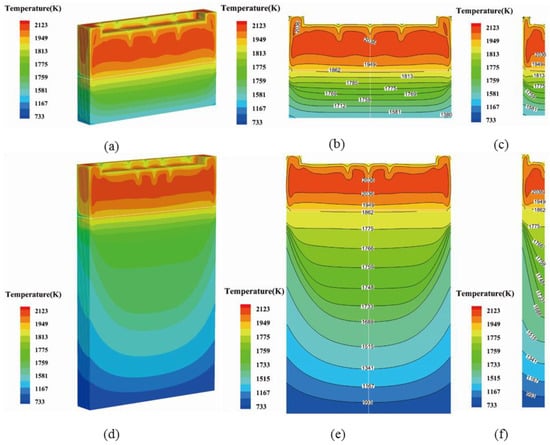
Figure 4.
Temperature field distribution in ESR of slab ingots at different time points: (a–c) t = 70 s; (d–f) t = 400 s; (b,e) y = 0 m section; and (c,f) x = 0 m section.
3.2. Calculation Results of Metal Liquid Head Height and the Shape of the Metal Pool
Figure 5 depicts the shape of the metal pool in the ESR slab ingot at different time points, while Figure 6 shows the shape of the metal pool at t = 70 s and t = 400 s. According to the research results by Hoyle [23], when the height of the metal liquid head of the metal pool is greater than 10 mm, the electroslag ingot can be produced with favorable surface and solidification quality. As shown in Figure 5a, due to the short length of the electroslag ingot, the metal molten pool became shallower and flatter at t = 70 s under the forced cooling effect of the bottom plate in ESR slab ingots. As the remelting continued and the impact of the forced cooling on the metal pool weakened, the depth of the metal molten pool gradually deepened, as shown in Figure 6a–d. Because the middle part of the wide and narrow surfaces was closer to the high-temperature area of the slag bath in ESR slab ingots, the metal liquid head of the metal pool took shape, indicating the favorable surface quality of the electroslag ingot. However, due to the wide distance between the corner area of the slab ingot and the high-temperature area of the slag bath, as well as the comparatively strong cooling effect at the corner, the metal liquid head of the metal molten pool at the corner was quite small, and there was even no metal liquid head there. This would cause poor quality at the corner of the electroslag ingot.
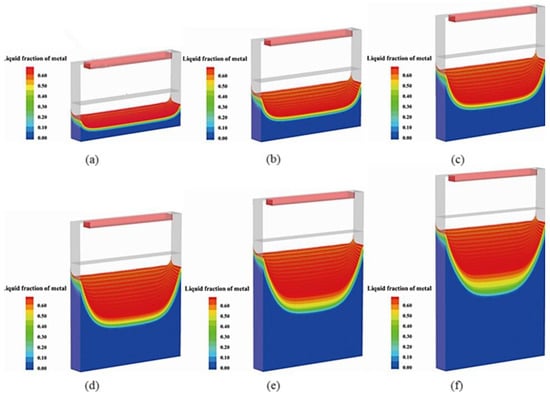
Figure 5.
Shape of metal pool in ESR of slab ingots at different time points: (a) t = 70 s; (b) t = 136 s; (c) t = 202 s; (d) t = 268 s; (e) t = 334 s; and (f) t = 400 s.
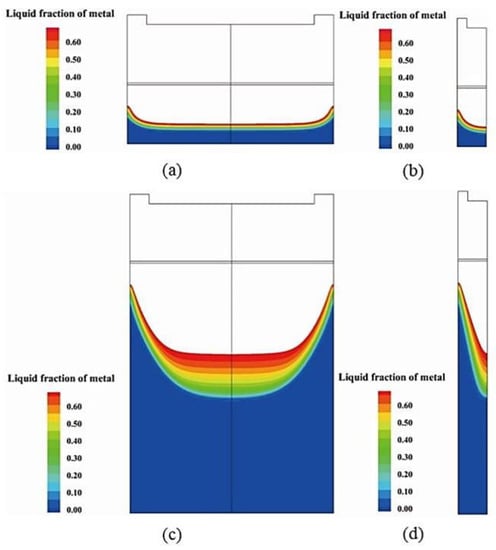
Figure 6.
Shape of metal pool at various sections in ESR of slab ingots at different time points: (a,b) t = 70 s; (c,d) t = 400 s; (a,c) y = 0 m section; and (b,d) x = 0 m section.
According to the Figure 7, the height of the metal liquid head of the metal pool was about 0.04 m at the y = 0 m section and about 0.009 m at the corner, indicating a small metal liquid head at the corner of the electroslag ingot. The metal pool was the deepest at the x = 0 m section but became shallower as its distance to the mold wall narrowed. This was due to the closer distance between the central area and the high-temperature area of the slag bath. Meanwhile, the ingot temperature around the mold wall dropped due to the strong cooling effect of the side wall of the mold, which made the metal pool shallower in depth.
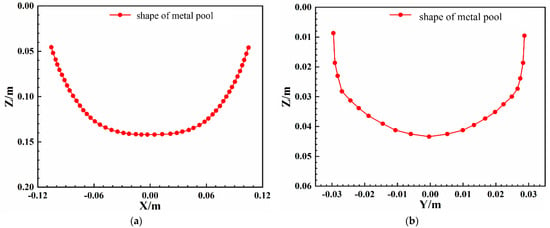
Figure 7.
Shape of the metal pool at the y = 0 m section (a) and the x = 0.106 m section (b) when t = 400 s.
3.3. Effect of Voltage on Solidification Quality
Figure 8 shows the shape of the metal pool under different voltages at t = 70 s and t = 400 s in ESR slab ingots. As shown in the figure, when the voltage was set at 30 V, no metal liquid head appeared at the corners during the remelting, indicating a relatively low temperature of the metal pool. This also led to the appearance of wrinkles and other quality defects at the corner of the electroslag ingot. However, when the voltage was raised to 32 V, the appearance of the metal liquid head at the corner was clearly observed, and the metal pool deepened in depth due to the increase in the temperature of the slag bath. Furthermore, when the voltage was further increased to 35 V, the metal liquid head at the corner continued to grow in height, accompanied by further deepening of the metal pool in depth.
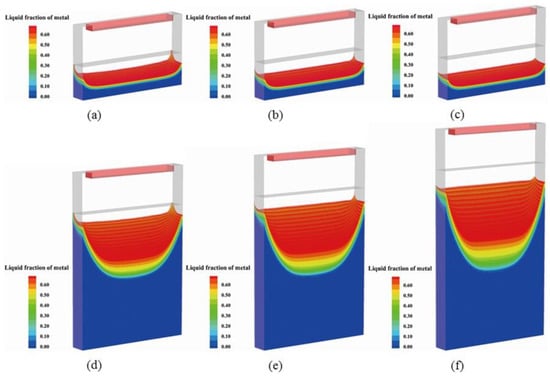
Figure 8.
Shape of metal pool when t = 70 s and t = 400 s: (a,d) 30 V; (b,e) 32 V; and (c,f) 35 V.
Figure 9 shows the depth of the metal pool at the y = 0 m section and the x = 0.106 m section under different voltages when t = 400 s. According to the figure, as the voltage increased, the depth of the metal pool at the y = 0 m section continued to deepen, while the height of the metal liquid head of the metal pool at the corner at the x = 0.106 m section also increased. Specifically, under a voltage of 30 V, the height of the metal liquid head of the metal pool at the corner was 0 m, while under a voltage of 32 V and 35 V, the height increased to 0.009 m and 0.027 m, respectively.
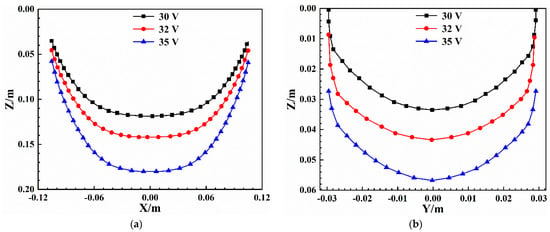
Figure 9.
Depth of metal pool at the y = 0 m section (a) and the y = 0.106 m section (b) under different voltages when t = 400 s.
3.4. Effect of Filling Ratio on Solidification Quality
Widening the consumable electrode, or increasing the filling ratio, in ESR slab ingots can help reduce the distance between the heat source of the slag bath and the corner of the electroslag ingot, leading to higher heat input into the corner. In this study, the filling ratio was defined as the area ratio between the electrode and the mold. Table 5 presents the cross-sectional sizes of different consumable electrodes and their corresponding filling ratios, as observed in this section.

Table 5.
Different electrode cross-section sizes and corresponding filling ratios.
Figure 10 shows the shape of the metal pool with different filling ratios at t = 70 s and t = 400 s in ESR slab ingots. According to the figure, the height of the metal liquid head of the metal pool at the corner increased gradually with the increase in the filling ratio. Increasing the filling ratio can enlarge the contact area between the consumable electrode and the slag bath, resulting in a more uniform distribution of temperature in the slag bath. Additionally, the loss of heat through thermal radiation from the free slag surface is reduced as the filling ratio increases, leading to a higher height of the metal liquid head of the metal pool.
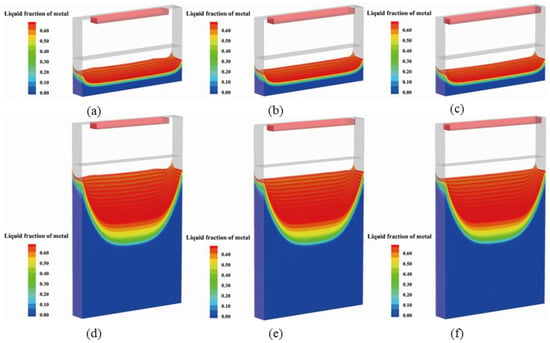
Figure 10.
Shape of metal pool when t = 70 s and t = 400 s: (a,d) S = 0.48; (b,e) S = 0.54; and (c,f) S = 0.60.
Figure 11 shows the depth of the metal pool at the y = 0 m section (a) and the y = 0.106 m section (b) with different filling ratios at t = 400 s in ESR slab ingots. According to Figure 11a, increasing the filling ratio from 0.48 to 0.54 resulted in a shallower metal pool. When the filling ratio was raised to 0.60, the maximum depth of the metal pool was similar to that when the filling ratio was lowered to 0.54. This is because the effect of the increased filling ratio on the temperature of the slag bath weakened, leading to insignificant changes in the depth of the metal pool. As shown in Figure 11b, the increase in filling ratio had a greater impact on the height of the metal liquid head at the corner. Increasing the filling ratio substantially raised the height of the metal liquid head, thereby improving the surface quality at the corner of the electroslag ingot. The heights of the metal liquid head at the corner were 0.006 m, 0.009 m, and 0.014 m when the filling ratios were 0.48, 0.54, and 0.60, respectively.
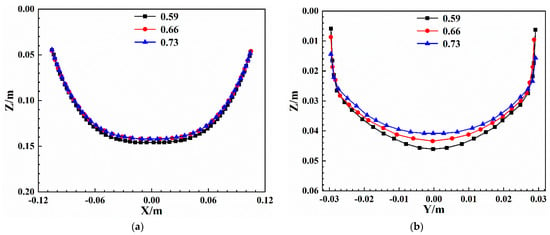
Figure 11.
Depth of metal pool at the y = 0 m section (a) and the y = 0.106 m section (b) under the condition of different filling ratios when t = 400 s.
3.5. Effect of Geometry on Solidification Quality
Poor quality at the corners of ESR slab ingots was mainly due to the wide distance from the heat source. Additionally, forced cooling at the wide and narrow surfaces of the mold caused a rapid drop in temperature of the liquid steel, which prevented the formation of the metal liquid head in the metal pool, further contributing to the poor quality. To address this issue, a chamfer with a radius of 10 mm was added at the corner of the mold, and its impact on the metal liquid head of the metal pool was observed. Figure 12 illustrates the schematic diagram for the addition of the chamfer to the mold.
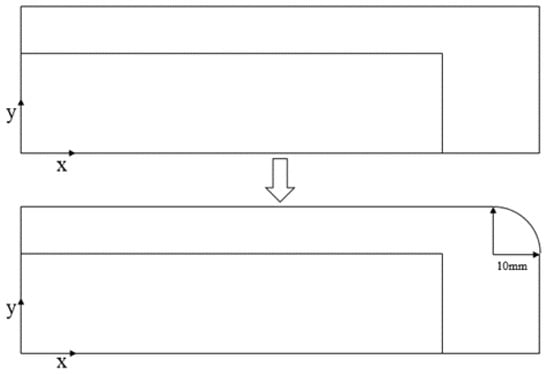
Figure 12.
Schematic diagram for the addition of the chamfer to the mold.
Figure 13 shows the temperature field distribution in ESR slab ingots with and without the chamfer when t = 70 s and t = 400 s. As depicted in the figure, high-temperature areas were mainly concentrated in the slag bath. After adding the chamfer to the mold, the high-temperature areas of the slag bath expanded, resulting in an increase in temperature for both the metal pool and the corner of the mold. At t = 400 s, the maximum temperature of the slag bath was 2118 K without the chamfer in the mold. However, with the presence of the chamfer, the maximum temperature of the slag bath rose to 2161 K, an increase of 43 K in temperature.
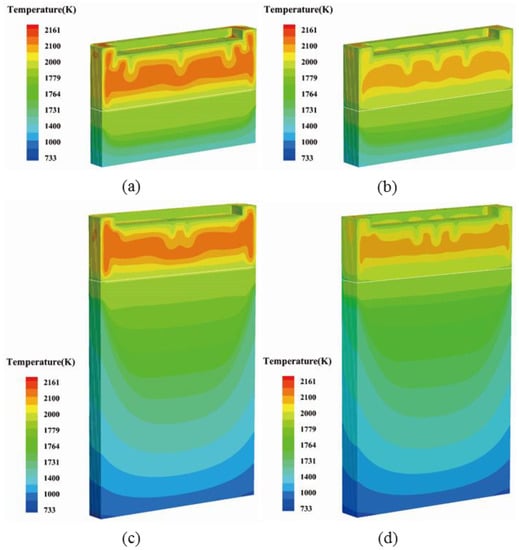
Figure 13.
Temperature field distribution when t = 70 s and t = 400 s: (a,c) with the chamfer and (b,d) without the chamfer.
Figure 14 illustrates the depth of the metal pool with and without the chamfer at the y = 0 m section when t = 400 s. As depicted in the figure, the maximum depth of the metal pool increased by 10 mm after the chamfer was added to the mold compared with the situation without the chamfer. This increase in depth was due to the rise in temperature of the slag bath.
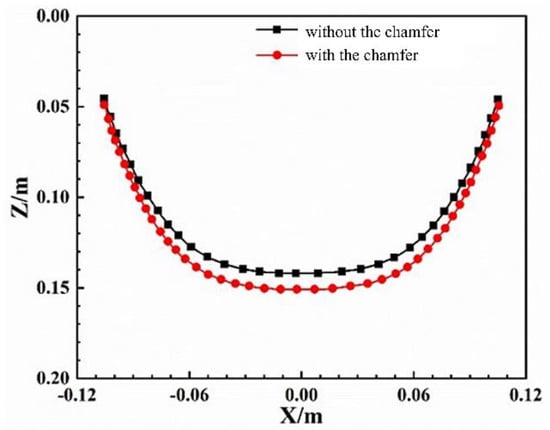
Figure 14.
Depth of metal pool with and without the chamfer at the y = 0 m section when t = 400 s.
4. Application of Models
To tackle the issues of poor surface quality of the electroslag ingot and slag leakage in the narrow surface, technical processes were improved based on simulation results. The surface quality at the corner of the electroslag ingot was improved by adjusting the mold size, increasing the filling ratio, and enlarging the input power. The technology parameters before and after the process improvement are shown in Table 6.

Table 6.
Technology parameters before and after process improvement.
Table 7 illustrates the standard composition of J80 steel and the composition of typical ingots analyzed by the direct-reading testing method. As shown in the table, the content of all major elements fell within the composition range required for the steel grade, indicating that the electroslag ingot fully met the steel grade composition requirements.

Table 7.
Chemical composition of J80 steel after remelting (mass%).
Figure 15 shows the electroslag ingot produced with large-sized slab ingot ESR equipment before improving the process parameters. From Figure 15, it can be seen that due to low power and the lack of a chamfer, the slag skin is thicker, and there are surface defects such as wrinkles at the corners of the electroslag ingot. Figure 16 depicts the large-sized slab ingot with dimensions of 620 mm × 2060 mm × 3630 mm, which was obtained after technical improvement. This improvement helped stabilize the smelting process at a more reasonable velocity and curbed the leakage of steel and slag. The slag skin thickness, measured at 1–2 mm, was thin and even, ensuring the favorable surface quality of the electroslag ingot without any surface defects. Figure 17 shows the macrograph of the narrow side at a distance of 450 mm from the bottom of the ingot. From the picture, it can be seen that there are no internal defects in the low magnification inspection of the ingot.
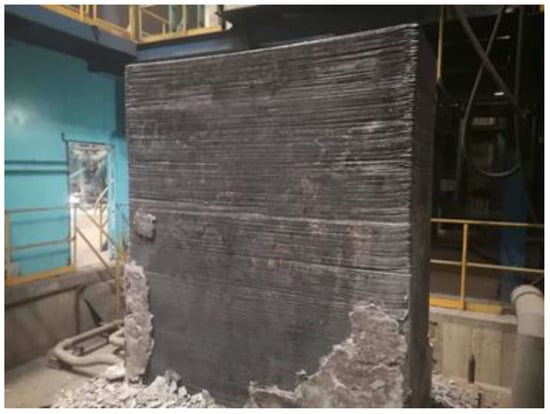
Figure 15.
Electroslag ingots with a dimension of 620 mm × 2060 mm × 3630 mm produced before the improved process.
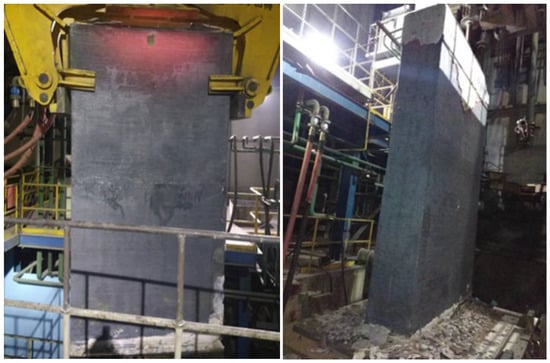
Figure 16.
Electroslag ingots with a dimension of 620 mm × 2060 mm × 3630 mm produced after the improved process.

Figure 17.
Macrograph of the narrow side at a distance of 450 mm from the bottom of the ingot.
5. Conclusions
(1) A mathematical model for ESR slab ingots was developed based on a multifield method. The model’s calculations revealed that the maximum flowing velocity of the molten slag was located below the consumable electrode, with the maximum velocity ranging from 4.35 × 10⁻² to 4.88 × 10⁻² m/s at different time points. As the remelting process progressed, the depth of the metal pool increased, reaching a maximum depth of 0.14 m.
(2) With an increase in voltage, the temperature of both the slag bath and the metal pool in ESR slab ingots increased. This resulted in an increase in the height of the metal liquid head at the corner of the metal pool and a deepening of the depth of the metal pool.
(3) The temperature of both the slag bath and the metal pool in ESR slab ingots can be increased by raising the filling ratio. This leads to an increase in the height of the metal liquid head at the corner of the metal pool and a decrease in the depth of the metal pool. However, as the filling ratio increases, the degree to which the temperature of the slag bath increases becomes smaller.
(4) After the chamfer was added to the mold, the temperature of the slag bath increased by 43 K compared with the situation without the chamfer. Additionally, the height of the metal liquid head at the corner of the metal pool increased by 11 mm, and the maximum depth of the metal pool increased by 10 mm.
(5) In industrial production, the surface quality at the corner of the electroslag ingot was enhanced by adjusting the mold size and increasing the filling ratio. Moreover, the input power was increased to raise the melting velocity, which helped in achieving a thin and even slag crust.
Author Contributions
Conceptualization, X.G. and Z.-H.J.; methodology, X.G.; software, X.G.; validation, X.G. and F.-B.L.; resources, X.G. and Z.-H.J.; data curation, X.G.; writing—original draft preparation, X.G.; writing—review and editing, X.G.; All authors have read and agreed to the published version of the manuscript.
Funding
This research was funded by the National Natural Science Foundations of China (grants No. 52174304) and Basic Scientific Research Projects in Chinese Universities (grants No. N2225040).
Data Availability Statement
The raw/processed data required to reproduce these findings cannot be shared at this time due to technical limitations.
Acknowledgments
This study was supported by the National Natural Science Foundations of China (grants No. 52174304) and Basic Scientific Research Projects in Chinese Universities (grants No. N2225040).
Conflicts of Interest
The authors declare no conflict of interest.
References
- Jiang, Z.H.; Dong, Y.W.; Zang, X.M.; Geng, X.; Li, H.B.; Yu, Q. Development of a new generation of electroslag metallurgy technology. J. Mater. Metall. 2011, S1, 14–20. [Google Scholar]
- Jiang, Z.H.; Geng, X. Internal quality control of electroslag remelting large slab. J. Adv. Superalloys 2011, 146–147, 670–673. [Google Scholar]
- Karimi-sibaki, E. A dynamic mesh-based approach to model melting and shape of an ESR electrode. Metall. Mater. Trans. B 2015, 46, 2049–2061. [Google Scholar] [CrossRef]
- Wang, Q.; Rong, W.J.; Wang, F. Numerical investigation of electromagnetism and heat transfer in electroslag remelting process with triple-electrode. In Proceedings of the 2015 International Symposium on Liquid Metal Processing & Casting, Leoben, Austria, 20–24 September 2015; pp. 27–36. [Google Scholar]
- Liu, F.B.; Suo, H.Y.; Li, H.B. Numerical Investigation on Solidification Shrinkage Behavior of P900 Hollow Ingot during Electroslag Remelting Process. Steel Res. Int. 2022, 93, 1–12. [Google Scholar] [CrossRef]
- Zhang, J.; Li, J.; Shi, C.B. Numerical analysis of role of melting rate on electroslag remelting continuous directional solidification of a die steel. J. Iron Steel Res. Int. 2021, 28, 1617–1624. [Google Scholar] [CrossRef]
- Wang, Q.; Li, B.K. Numerical Investigation on the Effect of Slag Thickness on Metal Pool Profile in Electroslag Remelting Process. ISIJ Int. 2016, 56, 282–287. [Google Scholar] [CrossRef]
- Zang, X.M.; Qiu, T.Y.; Li, W.M.; Deng, X.; Jiang, Z.H.; Song, H. Electroslag remelting withdrawing technology for offshore jack-up platform rack steel manufacturing process. J. Iron Steel Res. Int. 2016, 23, 297–304. [Google Scholar] [CrossRef]
- Chang, L.Z.; Shi, X.F. Effect of ultrasonic treatment on refining solidification structure of carbon steel. Adv. Mater. Res. 2011, 228–229, 147–152. [Google Scholar] [CrossRef]
- Li, W.M.; Jiang, Z.H.; Zang, X.M.; Deng, X. Modeling of flow and temperature distribution in electroslag remelting withdrawal process for fabricating large-scale slab ingots. J. Iron Steel Res. Int. 2017, 24, 569–578. [Google Scholar] [CrossRef]
- Biro, O.; Preis, K. On the use of the magnetic vector potential in the finite-element analysis of three-dimensional eddy currents. IEEE Trans. Magn. 1989, 25, 3145–3159. [Google Scholar] [CrossRef]
- Kharicha, A.; Wu, M.H.; Ludwig, A.; Sibaki, E.K. Influence of the Earth Magnetic Field on Electrically Induced Flows. J. Iron Steel Res. Int. 2012, S1, 63–66. [Google Scholar]
- Yu, J.; Liu, F.B.; Jiang, Z.H.; Kang, C.; Li, H.; Geng, X. Numerical simulation of the dynamic formation of slag skin and heat flow distribution during the electroslag remelting process. Steel Res. Int. 2018, 89, 1–11. [Google Scholar] [CrossRef]
- Yu, J.; Liu, F.B.; Jiang, Z.H.; Chen, K.; Qian, R.Q. Numerical simulation of dynamic formation of slag shell during electroslag remelting. In Proceedings of the 11th China Iron and Steel Annual Conference, Beijing, China, November 2017; pp. 394–400. [Google Scholar]
- Wang, Q.; Li, B.K. Numerical investigation on the effect of fill ratio on macrosegregation in electroslag remelting ingot. Appl. Therm. Eng. 2015, 91, 116–125. [Google Scholar] [CrossRef]
- Chen, H.Y. Simulation of Clean Water System for Large Aircraft; Nanjing University of Aeronautics and Astronautics: Nanjing, China, 2010. [Google Scholar]
- Jiang, F.; Xu, Y.C.; Huang, P. Fluent Advanced Application and Case Analysis; Tsinghua University Press: Beijing, China, 2018; pp. 18–19. [Google Scholar]
- Dong, Y.W. Mathematical Simulation of Solidification in Electroslag Remelting Process and Study on New Slag System; Northeastern University: Shenyang, China, 2008. [Google Scholar]
- Rao, L.; Zhao, J.H.; Zhao, Z.X.; Ding, G.; Geng, M.P. Macro- and Microstructure Evolution of 5CrNiMo Steel Ingots during Electroslag Remelting Process. J. Iron Steel Res. Int. 2014, 21, 644–652. [Google Scholar] [CrossRef]
- Liang, L.K.; Guo, Z.W.; Wang, Y.Z.; Liu, C.Y.; Jiang, X.W. The thermal conductivity of solid electroslag was determined by water cooled tube heat flow method. J. Northeast. Inst. Technol. 1985, 31, 46–50. [Google Scholar]
- Liu, F.B. Mathematical Simulation of Electroslag Continuous Casting Process and Billet Quality Control; Northeastern University: Shenyang, China, 2009. [Google Scholar]
- Choundhary, M.; Szekely, J. The effect of temperature dependent electrical conductivity on flow and temperature fields in slags in ESR systems. J. Ironmak. Steelmak. 1981, 55, 225–231. [Google Scholar]
- Hoyle, G. Electroslag Processes Principles and Practice; Applied Science Publisher: London, UK, 1983; pp. 138–141. [Google Scholar]
Disclaimer/Publisher’s Note: The statements, opinions and data contained in all publications are solely those of the individual author(s) and contributor(s) and not of MDPI and/or the editor(s). MDPI and/or the editor(s) disclaim responsibility for any injury to people or property resulting from any ideas, methods, instructions or products referred to in the content. |
© 2023 by the authors. Licensee MDPI, Basel, Switzerland. This article is an open access article distributed under the terms and conditions of the Creative Commons Attribution (CC BY) license (https://creativecommons.org/licenses/by/4.0/).