Abstract
Marine natural gas hydrate (NGH) can mainly be found in argillaceous fine-silt reservoirs, and is characterized by weak consolidation and low permeability. Sand production is likely to occur during the NGH production process, and fine-silt particles can easily plug the sand-control media. In view of this, experiments were conducted to assess the influence of the formation sand on the sand retention media in gravel-packed layers under gas–water mixed flow, and the plugging process was analyzed. The results show that following conclusions. (1) The quartz-sand- and ceramic-particle-packed layers show the same plugging trend, and an identical plugging law. The process can be divided into three stages: the beginning, intensified, and balanced stages of plugging. (2) The liquid discharge is a key factor influencing the plugging of gravel-packed layers during NGH exploitation by depressurization. As the discharge increases, plugging occurs in all quartz-sand packing schemes, while the ceramic-particle packing scheme still yields a high gas-flow rate. Therefore, quartz sand is not recommended as the packing medium during NGH exploitation, and the grain-size range of ceramic particles should be further optimized. (3) Due to the high mud content of NGH reservoirs, a mud cake is likely to form on the surface of the packing media, which intensifies the bridge plugging of the packed layer. These experiment results provide an important reference for the formulation and selection of sand-control schemes.
1. Introduction
Natural gas hydrate (NGH) is an icelike cage crystalline compound, formed by water and natural gas molecules under the conditions of low temperature and high pressure. The global reserves of natural gas hydrates are very large. The estimated natural gas resources in the hydrate are 2 × 10¹⁶ m3, equivalent to 2 × 10⁵ billion tons of oil, which is twice the total carbon content of conventional fuels in the world [1]. Gas hydrates are widely distributed in permafrost, and the seabeds of marine continental shelves, approximately 90% of which lie in deep sea areas. China’s natural gas hydrate resources are mainly distributed in the East China Sea, the South China Sea, the Northeast tundra and the Qinghai–Tibet Plateau tundra, among which the total amount of natural gas hydrate resources in the sea reaches 700 × 108 t of the oil equivalent. Due to their enormous energy potential, natural gas hydrates have attracted worldwide attention, and have become a trending topic in current global technological innovation [2,3,4].
The main exploitation methods for NGH reservoirs include thermal recovery, depressurization, chemical injection, and CO2 replacement [5,6,7,8,9]. The essence of these methods is to facilitate the in situ decomposition of NGH, and each method has its own advantages and disadvantages. The thermal recovery method can heat NGH reservoirs by directly injecting hot fluids, fire flooding, underground electromagnetic heating, and microwave heating. It has the advantages of allowing circulating heat injection and a fast effect, but the low heat-utilization rate has not been well resolved, and efficient gas collection has not been achieved. Once a large quantity of gas has leaked, it may trigger global warming. Therefore, it is difficult to widely promote this method [10]. Depressurization breaks the original phase equilibrium of formations, and does not need continuous excitation. The method also uses simple devices, has a low cost, and is suitable for large-area exploitation, so it is a promising method among existing exploitation methods. However, depressurization requires that the NGH-reservoir-forming environments be located near temperature–pressure equilibrium boundaries. Only at these locations is depressurization commercially viable [11,12]. Chemical injection is an exploitation method that injects chemical reagents, such as saline, methyl alcohol, ethyl alcohol, glycol, and glycerol, into NGH reservoirs, to break the reservoir-forming phase equilibrium conditions, and promote the decomposition of NGH. However, it also has disadvantages, including high expense for the chemical reagents required, slow effects on NGH, and possible environmental pollution [13]. The CO2 replacement method replaces methane molecules in methane hydrates with CO2, because CO2 is more likely to form hydrates than methane, and the stable occurrence pressure of CO2 hydrates is lower than that of methane hydrates [14,15]. How to improve the replacement rate and efficiency, and realize economic, effective, and safe production, is a key problem that has not yet been solved [16]. To date, only China and Japan have carried out trial exploitations of marine NGH by depressurization. The depressurization of NGH reservoirs differs from that of conventional reservoirs [17]. This is mainly reflected in three aspects:
- (1)
- NGH, as cement or skeleton, occurs in sedimentary formations [18]. When solid NGH is decomposed into a flowable gas–water mixture, the bonding force between sedimentary particles decreases, and load-bearing solids turn to quicksand [19]. In comparison, conventional petroleum exists as fluid in pores, and does not undergo a phase change.
- (2)
- A large amount of gas is released during the decomposition of NGH, which causes an abrupt increase in the pore pressure [20]. However, this phenomenon generally does not occur with conventional petroleum. As the pore pressure rises abruptly, the effective stress on the rock skeleton plummets, which leads to sand liquefaction, thus reducing the contact force and frictional force between the sedimentary particles, and intensifying shear failure [21,22].
- (3)
- Sand production during NGH exploitation involves the production of three phases (gas, water, and sand). However, sand production during conventional petroleum exploitation generally involves two phases: oil and sand, or gas and sand. Because the gas has a lower viscosity, is sensitive to pressure change, and shows weak sand-carrying capacity, the two phases show different sand-production characteristics [23].
In addition, the influence of hydrates on the mechanical properties of the host sediments largely depends on the nucleation and growth position of hydrates in the pore space. The pore-scale habit of hydrates is mainly determined by the effective stress state, and the particle-size distribution, of the host sediment. Unlike the effective thermal diffusivity and thermal conductivity, the heat capacity of hydrate-bearing sediment only depends on the mass fraction of the sediments, hydrates, and pore fluids, not on their pore-size distribution and interface effects. Therefore, the formation of hydrates can significantly reduce the specific heat of the sediment [24].
Sand production in NGH reservoirs is a complex mechanical problem. It mainly includes four motion processes: sand falls from rocks for NGH exploitation under shear stress; the formation sand settles, resuspends, and migrates; the formation sand infiltrates the sand retention media, and fluids carry the sand into wellbores. Cohen et al. [25] used the discrete element method (DEM) to simulate the detachment of sand particles in hydrate-bearing sediment samples, and their results showed that the influence of sand transport on isotropic and deviatoric stresses is different. The presence of hydrates can also regulate the amplitude of stress relaxation. Uchida et al. [26] used a thermo-hydro-chemo-mechanical sand-migration model to find that solid migration and settlement around sand-control devices can prevent a pressure drop near the wellbore, thereby reducing gas production. Vasheghani et al. [27] proposed a pore-scale model for the numerical simulation of fine-particle transport in porous media. This model was used to simulate the migration of fine particles in a synthetic two-dimensional porous medium, revealing the impact of fine-particle migration on the porosity and permeability of the medium. The numerical method they developed was able to successfully capture the main retention mechanisms that cause formation damage related to fine-particle migration, including external cake structures formed by large particles, internal cake structures formed by fine particles, pore blockage, and surface sedimentation. Therefore, sand production changes the stress state of reservoirs, and lead to changes in the bonding strength, porosity, and effective stress of formations. The bonding strength deteriorates, which causes poorer stability in well walls, and induces the collapse of formations and sand production in producing wells.
NGH reservoirs in the South China Sea are characterized by shallow burial depths, weak consolidation, undiagenetic sediments, and difficulty in seepage. According to an analysis of sediments cored in the Shenhu Sea area, the NGH saturation can reach 64%, and the horizontal permeability of sediments is (0.96~3.70) × 10−9 m/s. The median grain size of sediments is 10~20 μm, in which more than 80% of grains are smaller than 40 μm. The muddy, silty, and sandy components separately account for 36%, 63%, and lower than 1%, respectively. The sorting coefficient and uniformity coefficient of the sediments are 2.24 and 7.86, respectively, indicating that the sediments have extremely poor sortability [28,29,30,31,32,33,34].
Reasonable and efficient sand control during depressurization is a key support technology for normal NGH exploitation. Research on sand control in NGH reservoirs is still in its infancy, and the existing research mainly preliminarily discusses, and quantitatively analyzes, sand production and sand control in NGH reservoirs. However, the sand-retention mechanism for fine silt with a high mud content under gas–water mixed flow in NGH reservoirs, and particularly the mechanism of different sand-retention media in the packed layer, remains unclear. In recent years, to solve the issue of sand production in NGH reservoirs, scholars in China and abroad have preliminarily analyzed sand production, and explored ideas and methods for sand control. Jung et al. [35] experimentally simulated the influence of the output pattern and migration of sand in NGH reservoirs on the gas-flow rate (output). By using filter-screen sections with precisions of 60 and 100 μm, Lee et al. [36] carried out sand-retention experiments on sand-control media during the generation and decomposition process of experimentally simulated hydrates. They also optimized the precision of the filter screens, and analyzed the dynamics of sand control. Dong et al. [29,37,38] performed experimental research on sieve tubes and sieve tube sections, and analyzed the internal-bridge-plugging and external-sorted-bridge-plugging mechanisms of sand-retention media in argillaceous fine-silt reservoirs under gas–water mixed-flow conditions. Ding et al. [33] simulated sand production and sand retention in argillaceous fine-silt NGH reservoirs in the Liwan Sea area in the South China Sea, and recommended a gravel size, and the optimal ratio of the mesh diameter of screens to the median size of the formation sand. Li et al. [31,39] studied the sand-control methods and optimized sand-control parameters for argillaceous fine-silt NGH reservoirs, and proposed a preliminary design method for gravel size and the sand-control system. In general, these studies covered macroscopic sand-retention dynamics and the basic design of sand-retention media, and involved the plugging of packed layers by argillaceous fine silt. Researchers have conducted sand-retention experiments on packed layers under the conditions of the sand being carried by gas and liquid, which have revealed the microscopic plugging mechanism of packed layers by argillaceous fine silt. However, problems pertaining to the matching of formation sand with the types of packing media and packing precision have not been studied.
According to experience from three trial exploitations of marine NGH (AT1-P2 in Japan, SHSC4 in China, and SHSC2-6 in China) [40,41], the most economic and reliable method, depressurization, has been adopted to develop NGH. Sand production in reservoirs is one of the greatest engineering geological challenges in NGH exploitation by depressurization. NGH reservoirs are generally buried shallowly, and the sediments show poor bonding strength. Under these conditions, the decomposition of NGH during the depressurization of walls is extremely likely to induce the failure of reservoirs and well walls, causing serious sand production [42,43,44,45,46,47]. During NGH exploitation by depressurization, solid particles carried by formation fluids may plug sand-retention media, causing reduced permeability. The impact and erosion of sand-retention media by sand-carrying fluids are likely to cause sand-retention media to fail at sand control [48]. Considering this, the plugging of sand-retention media, and the failure of sieve tubes in sand-control wellbores have become important problems plaguing the normal production of NGH reservoirs.
According to existing natural gas hydrate reservoir depressurization trial production, Japan’s hydrate production project mainly adopts the GeoFORM sand-control system that uses shape-memory polymers to expand and seal the annular space between the wellbore and the formation [49]. The second hydrate production project in the South China Sea mainly adopts the sand-control process of prefilling the bypass screen pipe, and light sand circulation, filling dual sand control. The three-level composite sand-control technology of “coarse + fine” gravel filling, and high-precision prefilling of the screen tube formed in the wellbore, has complex sand-control processes [41], a high level of construction difficulty, and high costs, which do not meet the economic goal of the low-cost extraction of natural gas hydrates in the South China Sea. In addition, due to limited trial production time, low water production, and a rapid decline in gas production, the contradiction between sand control and mud control, and production improvement, is prominent. Whether these sand-control technologies can be applied and promoted to the industrial exploitation of natural gas hydrates in the South China Sea still requires further verification. To solve the above difficulties in sand control during marine NGH exploitation by depressurization, the influence of factors including the type and grain size of the gravel types, as well as flow rates, on the plugging degree of sand-retention media, were analyzed. This was realized using an experimental apparatus for evaluating the sand-retention and plugging mechanism of a packed layer under gas–water mixed-flow conditions. Through the experimental method studied in this article, filling-medium-plugging experiments were carried out, to provide experimental support for the subsequent development of new hydrate reservoir sand-control screen tubes, the optimization of filling media, and the optimization of sand-control plans.
2. Experiments
2.1. Experimental Objective
Our plugging experiments on sand-retention media in the gravel-packed layer aimed to explore the influence of the type and grain size of gravels, the differential pressure of production, and the flow rate on the plugging of sand-retention media, via the laboratory simulation of plugging. Moreover, the relationship between the plugging of the packing media, and influencing factors, was analyzed, and the cause of the failure of the packing media, and the internal mechanism for the plugging of underground sand-retention media were further explored. By doing so, this research provides a basis for the selection of sand-control methods, suggested production systems, packing media, and structural improvements for sieve tubes.
2.2. Experimental Apparatus
To analyze the plugging characteristics of packing media by sand-carrying fluids under different conditions, an experimental apparatus for evaluating the sand-retention and plugging mechanism under underground gas–water mixed flow was established. The apparatus principally included a one-way flow device (composed of multiple transparent glass tubes connected with clamps to observe one-way flow), a sand-loading device, a screw pump, an air compressor, a liquid-storage tank, a liquid flowmeter, a gas flowmeter, pressure transducers, differential pressure sensors, a pressure test and acquisition system, and a pressure regulator, as shown in Figure 1, Figure 2 and Figure 3.
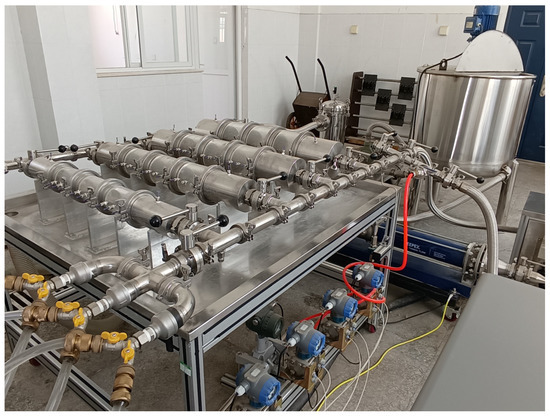
Figure 1.
Photograph of the experimental apparatus.
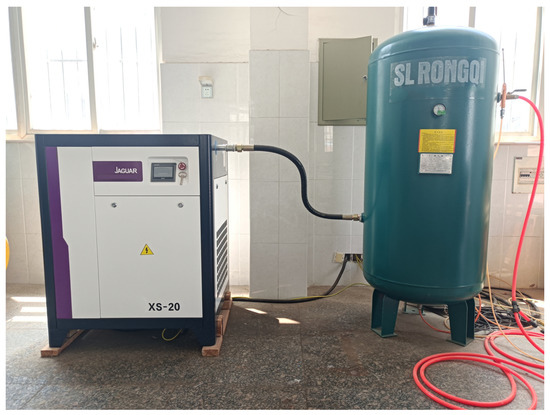
Figure 2.
Photograph of the screw air compressor and air tank.
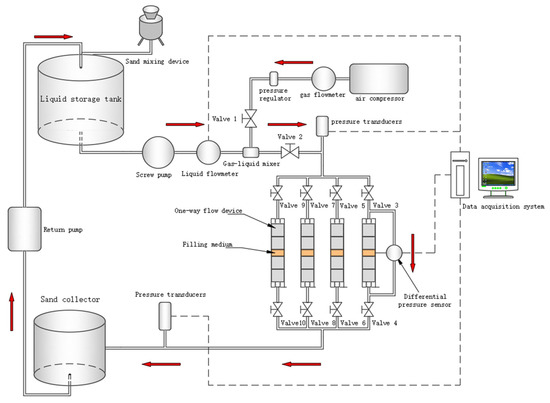
Figure 3.
Schematic diagram of the experimental apparatus.
Main component functions:
- (1)
- One-way flow-displacement component
The unidirectional flow-displacement component is processed into five short segments, with the middle three segments made from transparent organic glass (with a pressure resistance of ≤0.8 MPa), and both ends made from high-quality SUS304 material. The gravel filling layer is filled into the short section of the unidirectional flow organic glass component (the orange area in Figure 3 is the filling area), and holes are arranged at both ends of the short section of the unidirectional flow-displacement device to measure the pressure difference between the two ends of the sand-blocking medium. There are four specifications of unidirectional flow-displacement components, with inner diameters of 50 mm, 75 mm, 100 mm, and 125 mm, and each short joint has a length of 150 mm.
- (2)
- Screw pump
The main function of the screw pump is to transport sand-carrying liquid, with a pump displacement of 5 m3/h, and a maximum working pressure of 1.2 MPa.
- (3)
- Air compressor
This is mainly used for simulating sand-carrying experiments in gas wells and providing gas sources. The rated working pressure of the air compressor is 0.8 MPa, and the flow-rate is 2.4 m3/min.
- (4)
- Liquid-storage tank
This is mainly used for storing liquids (clean water, viscous water) for liquid sand-carrying circulation flow, and is equipped with a stirring motor to evenly stir the thicker liquid used in the experiment. A sanding pipeline is welded on one side of the reservoir, which can add sand at a certain frequency. Under the uniform delivery of the screw pump, the water in the reservoir carries the simulated formation sand to displace the filling medium.
- (5)
- Sand collector
This is used to remove, collect, and measure formation sand through metal gravel filling layers.
2.3. Experimental Principle
The physical properties of fluids, the grain size of fine silt, and the composition of clay minerals are the main factors influencing the sand retention and dynamic plugging of the packed layer. The displacement was conducted under stable experimental conditions, and the flow rate of fluids, and the displacement pressure difference at two ends of the packed layer, were measured. Then, changes in the average permeability of the packed layer in the experimental process were calculated using Darcy’s formula.
During displacement experiments on the one-way flow shown in Figure 1, quartz sand was first packed in a short segment of the displacement module for one-way flow (the orange area in Figure 3 represents the filling layer). Then, formation sand carried by gas–water mixed fluids was utilized to displace the gravel-packed layer at a certain flow rate. Due to the blocking effect of the gravel-packed layer, the formation sand gradually invades and plugs the packed layer, causing a gradual reduction in the permeability of the gravel-packed layer with the experimental time. The stabilization of the displacement-flow rate and the pressure difference indicates that the plugging has reached equilibrium and the experiments can be stopped.
Darcy’s formula is adopted to calculate the medium permeability under gas–liquid–solid three-phase flow [50], as expressed below:
where k is the permeability (um2); Qi is the volume-flow rate passing through the gravel-packed layer at the ith moment (m3/s); P1i and P2i separately represent the inlet and outlet pressures at the ith moment (MPa); u is the viscosity of fluids used in the experiments (mPa·s); A is the cross-sectional area of the gravel-packed layer (m2); and L is the thickness of the gravel-packed layer (m).
2.4. Experimental Methods
- (1)
- The packing media (quartz sand and ceramic particles) were added to the one-way flow device. In the experiments, the packing media were placed between two transparent glass tubes (the filling position and thickness can both be adjusted), and separated by sieve plates. Buckles were used to connect each transparent glass tube, to observe the one-way flow.
- (2)
- Experimental pipelines of one-way flow were connected and checked, to ensure a smooth flow. The liquid-storage tank was filled with clear water, to perform plugging experiments under displacement with sand carried by gas and water in a one-way flow.
- (3)
- The data-processing software of the sand-control experimental apparatus was initiated, in which the basic experimental data were input, and the data acquisition system was launched.
- (4)
- Relevant parameters of data acquisition were set in the experimental data system, and the acquisition system was launched.
- (5)
- The liquid inlet valve was switched on, and the screw pump was turned on, to pump liquid. The required liquid-discharge capacity was manually adjusted. After the flow rate stabilized, the water flowed through the packed layer.
- (6)
- The gas intake value was turned on, and the air compressor was switched on. The required gas discharge capacity was manually adjusted. After the gas and water were mixed stably, they were allowed to pass through the packed layer.
- (7)
- The sand-adding device was started, the sand-adding frequency was set, and the sand-adding operation was carried out through the sand-adding pipeline in the liquid storage tank; the fluid (water) carries the simulated formation sand and relies on the screw pump to transport the sand-carrying liquid to displace the gravel filling layer.
- (8)
- The experimental data were recorded and processed. The sand-retention performance, anti-plugging performance, and fluid-flow performance of the gravel-packed layer were measured and assessed, and the comprehensive performance was analyzed.
2.5. Experimental Conditions
- (1)
- Experimental materials
Previous research [51] studied NGH in the Liwan Sea area in the northern South China Sea, where NGH sediments are mainly composed of clay and silt, along with small amounts of clay minerals and feldspar. The median grain size of the formation sand in NGH sediments is 10 µm, and the grain size is mainly in the range of 0.221~174.55 µm. Therein, 83% of the fine silt in the reservoir has a grain size lower than 40 µm. The distribution of grain sizes of NGH sediment in the area is shown in Table 1.

Table 1.
Distribution of grain sizes (µm).
The research failed to collect actual sand samples in NGH reservoirs in the South China Sea, and the grain sizes of sand in NGH reservoirs differ from site to site on the seafloor. Considering this, the following simulated-formation sand samples, to match those in NGH reservoirs, were prepared by referring to the physical properties of NGH reservoirs in the South China Sea, and the median grain size of D50 = 10 µm in the above distribution of grain sizes, as shown in Figure 4 and Figure 5.
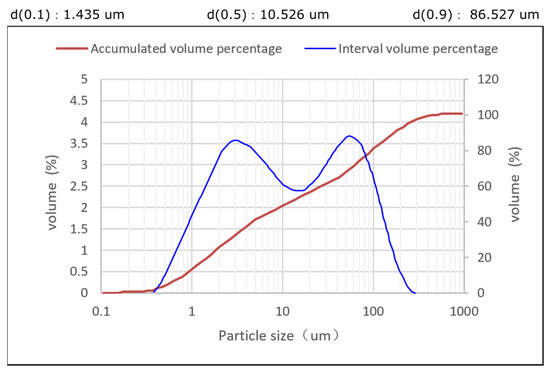
Figure 4.
Distribution of grain sizes.
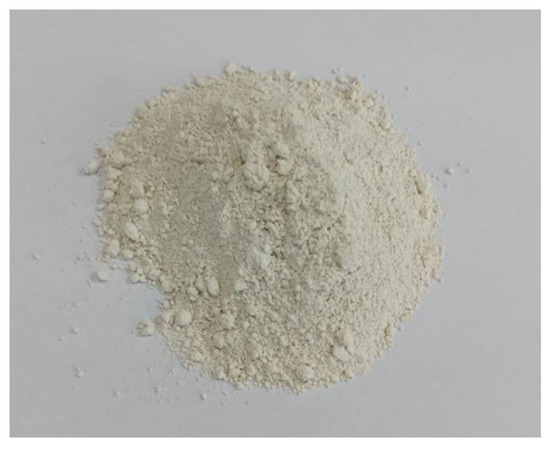
Figure 5.
Sample of the simulated formation sand.
According to reference [51], this article configures South China Sea simulated-formation sand with a median particle size D50 = 10.526, a shale content of 39%, and a nonuniformity coefficient of 12.98. The simulated-formation sand sample is shown in Figure 5.
NGH reservoirs in the South China Sea are unconsolidated or weakly consolidated, showing the characteristics of fine silt with a high mud content. Therefore, the schemes of packing media were designed by referring to the Saucier formula; that is, the selected median grain size of commercial gravels is 5~6 times the median grain size of formation sand in reservoirs [52,53,54]. The experimental conditions were extended by gradually increasing the multiple, thus formulating the corresponding experimental schemes of packing media in Table 2.

Table 2.
Experimental schemes of packing media.
- (2)
- Experimental parameters
The experiments simulated the gas–water mixed flow near wells in NGH reservoirs. The experimental fluid was clear water, and the gas used was air. According to the decomposition of 1 m3 natural gas hydrate to generate 0.8 m3 water and 168 m3 natural gas, the compressibility factor of natural gas under bottom-hole conditions is 0.75, and the gas–liquid ratio is calculated to be approximately 150. During the test, the water-phase displacement of the screw pump is set as 0.2 m3/h, and the gas displacement of the air compressor is 0.5 m3/min, which approximately meets the downhole gas–liquid ratio conditions [37,38].
3. Results and Analysis
3.1. Plugging Experiments on Quartz-Sand-Packed Layers
Five groups of experiments were performed on quartz-sand packing media (experimental curves are shown in Figure 6, Figure 7, Figure 8, Figure 9 and Figure 10). In the one-way flow device, differential pressure sensors were connected to the upper and lower ends of the region of the packing media. The flow-pressure drop of the packed layer was measured under the sand-production conditions of the simulated formation. In the meantime, the pressure difference in the two ends was recorded in the experimental process. Pressure transducers were also set at the inlet and outlet, to display the variation in the pressure in real time during the experimental process. Recording the parameters, including the pressure and flow rate, can reflect seepage in the packed layer. After the five groups of experiments on quartz-sand packing media were completed, two types of experimental results were obtained: one is that the quartz-sand-packed layer is plugged, with no gas produced at the outlet; the other is that the quartz-sand-packed layer is not plugged, with gas and water produced at certain flow rates.
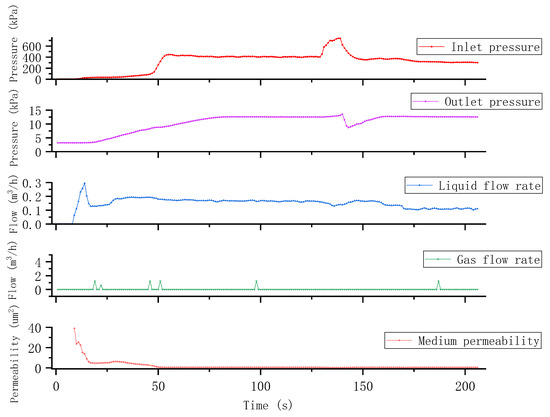
Figure 6.
Plugging experiments on the quartz-sand-packed layer (Scheme S1).
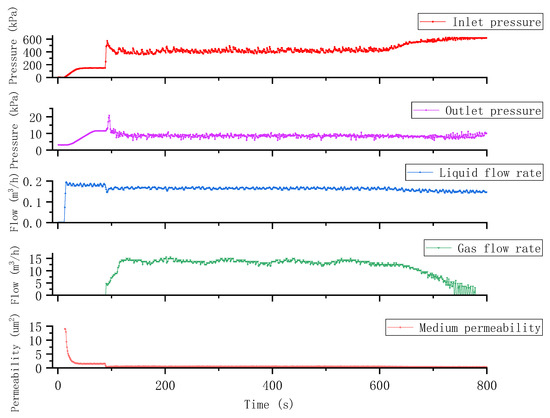
Figure 7.
Plugging experiments on the quartz-sand-packed layer (Scheme S2).
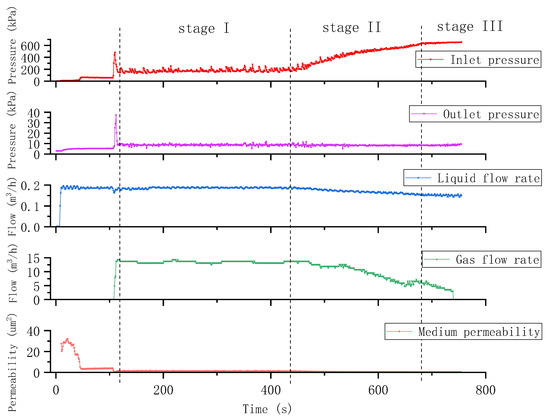
Figure 8.
Plugging experiments on the quartz-sand-packed layer (Scheme S3).
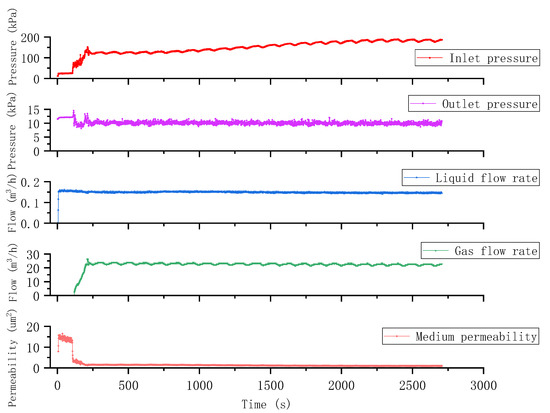
Figure 9.
Plugging experiments on the quartz-sand-packed layer (Scheme S4).
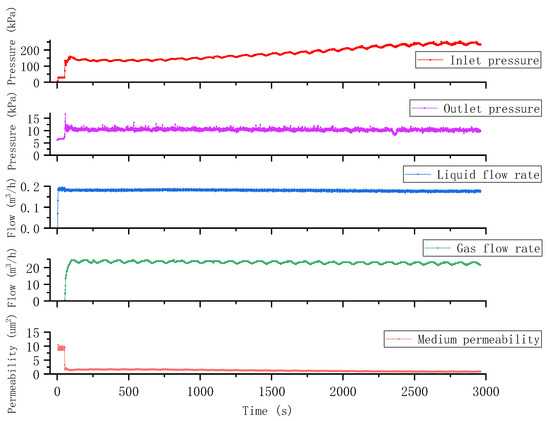
Figure 10.
Plugging experiments on the quartz-sand-packed layer (Scheme S5).
Taking Scheme S3 as an example, in this scheme of a quartz-sand-packed layer, the packed layer is finally plugged. The curves for dynamic changes in the inlet pressure, outlet pressure, liquid-flow rate, and gas-flow rate before adding sand can be clearly seen in Figure 8. The mixed flow of gas and water in the experimental fluid is in an equilibrium state, and the inlet pressure remains basically stable. In the initial stage of displacement, due to the low number of sand particles invading, the permeability decreases slowly, which is called the initial stage of blockage (I). Due to the complex pore-throat structure of the filling layer, fluid continuously carries sand into the filling layer. This makes it difficult to discharge the coarser particles in the formation sand that invade the filling layer, causing blockages, and resulting in a decrease in the permeability of the sand-blocking medium, an increase in the flow resistance, and an increase in the displacement pressure difference. That is to say, when the sand particles invade the formation to a certain extent, the permeability of the medium begins to rapidly decrease, which is called the stage of intensified blockage (II). As the displacement continues, due to the limited pore-throat structure space of the filling medium, when these spaces are filled and piled up with invaded formation sand particles, the permeability basically does not change after the blockage reaches a saturated equilibrium state, which is called the blockage equilibrium stage (III). In the latter half of the dynamic curve shown in Figure 8, the pressure, flow rate, and permeability gradually tend to balance, which is consistent with the research conclusions in other studies [29,55]. In the late stage of the experiments, the gas-flow rate reaches zero, and drops significantly. In the fine-silt environment with a high mud content, a mud cake is formed on the surface of the packed layer (Figure 11), accompanied by sand bridging, which leads to an abrupt reduction in permeability, and accelerates the plugging of the packed layer. Figure 12 clearly shows that because the quartz-sand-packed position is plugged, water cannot flow through rapidly, causing an increasingly serious water accumulation in the left transparent glass tube for observing one-way flow. As a result, pressure builds up at the position, so that the gas pressure gradually becomes lower than the water pressure. Finally, no further gas is produced at the outlet, and only a small quantity of water seeps slowly out of the tube.
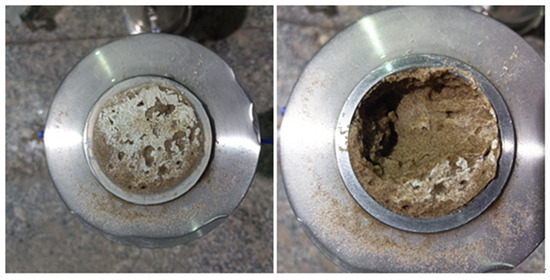
Figure 11.
The plugging of the surface of the quartz-sand-packed layer by a mud cake (Scheme S4).
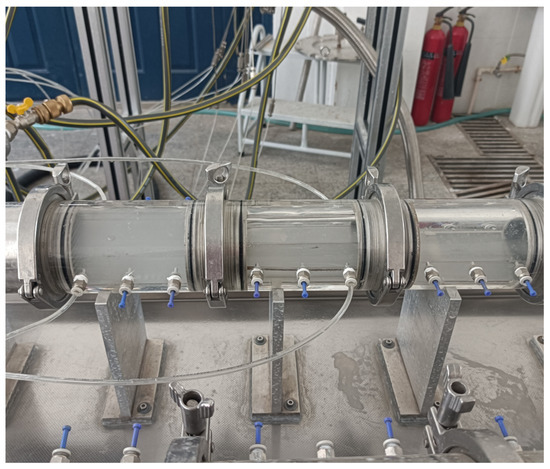
Figure 12.
Gas-water mixed flow through the quartz-sand-packed layer (Scheme S4).
Similar experimental laws are observed in Schemes S2 and S3. It should be noted that under Scheme S1, the inlet pressure of the gas–water mixed flow in the early stage of the experiments approximates the ultimate pressure resistance of the organic glass on the sand-control device. Therefore, the experiment was ceased before loading sand for the sake of safety, while it can be inferred that the change law under S3 would also occur under the scheme.
Under Scheme S4, the quartz-sand-packed layer is not seriously plugged. The experimental curves in Figure 9 show that the inlet pressure, outlet pressure, liquid-flow rate, and gas-flow rate in the late stage of the sand-loading experiments basically remain stable. The packed layer is not apparently plugged, but still shows a certain fluid-flow performance, suggesting a strong anti-plugging performance. Scheme S5, which uses a quartz-sand-packed layer with a larger median grain size, exhibits a better flow performance and lower resistance, showing a law similar to that under Scheme S4.
The experiment shows that under the same conditions of displacement flow rate, formation-sand particle-size characteristics, and mud content, the different particle sizes and internal micropore structures of the filling medium lead to different changes in the displacement pressure difference and the medium blockage permeability. The difference lies in the varying length of time of the initial stage of blockage, the time to reach blockage equilibrium, and the final blockage equilibrium permeability. From the perspective of the anti-clogging performance of the filling layer, the longer the filling layer takes to reach the blocking equilibrium time, and the higher the blocking equilibrium permeability, the better the anti-clogging performance of the filling medium.
3.2. Plugging Experiments on Ceramic-Particle-Packed Layers
Limited by the machining of ceramic particles, ceramic particles of only one specification were used as the packing medium to perform experiments. Ceramic particles of 40~70 mesh, which are the smallest and most commonly applied to the Shengli Oil Field, were adopted.
The median grain size of the ceramic-particle-packed layer (40~70 mesh) is comparable to that of the quartz sand in Scheme S5, so the ceramic-particle-packed layer (40~70 mesh) is equivalent to Scheme S5. The experimental curves (Figure 13) show similar laws to those of Scheme S5 of the quartz-sand-packed layer (Figure 10). However, the difference lies in the better anti-plugging performance and fluid-flow performance of ceramic particles. Figure 14 compares two packed layers of quartz sand and ceramic particles, revealing that the ceramic particles show the highest final permeability, and that their anti-plugging performance is superior to that of quartz sand under the same scheme.
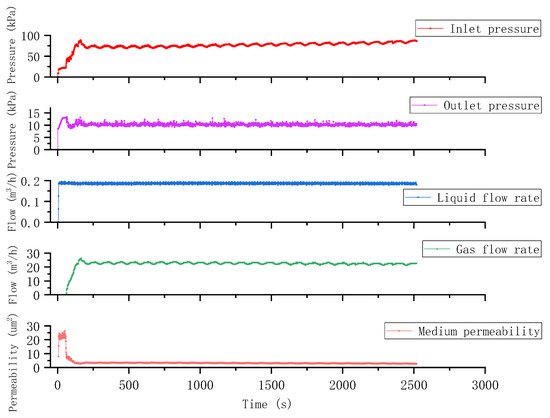
Figure 13.
Plugging experiments on the ceramic-particle-packed layer (Scheme S5).
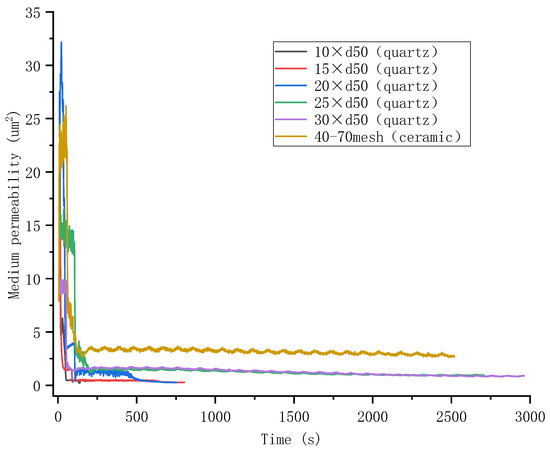
Figure 14.
Permeability comparison curves.
Figure 15 compares the ceramic-particle-packed layer before and after the experiments. Because ceramic particles are highly spherical, the pores formed are relatively regular. Therefore, a mud cake is not observed on the surface of the packed layer. Compared with the quartz-sand-packed layer, the ceramic particles still show favorable anti-plugging performance and fluid-flow performance in the fine-silt environment with a high mud content. As the flow rate rises, the permeability decreases slightly, so the packed layer still exhibits a high permeability and favorable fluid-flow performance, which maintains certain gas production. Different from the muddy fluid and water accumulation under Scheme S4, the transparent glass tube with the ceramic-particle-packed layer contains a clear one-way flow in Figure 16, and the gas and water flow smoothly, without water accumulation. Gas and water both flow through at certain rates.
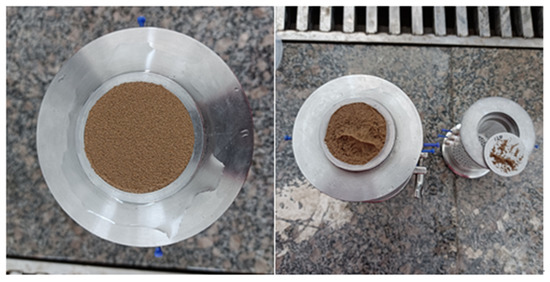
Figure 15.
Surfaces of the ceramic-particle-packed layer before (left) and after (right) experiments (Scheme S5).
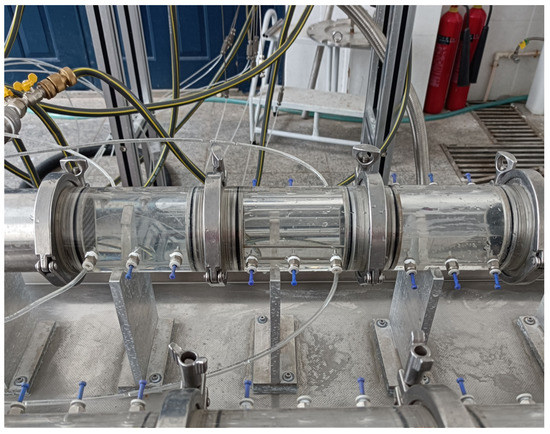
Figure 16.
Gas–water mixed flow through the ceramic-particle-packed layer (Scheme S5).
3.3. Plugging Experiments on Packed Layers under Different Discharges
The sand-production rates in the NGH exploitation process and NGH output are closely related to the sand-control methods and sand-retention precision. In addition, they are also related to factors including the grain size of sand, the mud content, the compositions of clay minerals in mud, the fluid viscosity, the flow rate, the differential pressure of production, and the change degree of the differential pressure. This is a complex process.
To analyze the influence of production systems on sand production; that is, the influence of the flow rate on the plugging law of the sand-retention media, displacement experiments on sand-retention media by sand carried by gas and water were conducted at a flow rate double that in previous experiments combined with Scheme S5. During the test, the water-phase displacement of the screw pump was set as 0.4 m3/h, and the gas displacement of the air compressor was 1.0 m3/min, which approximately meets the downhole gas–liquid ratio conditions. The experimental curves are illustrated in Figure 17 and Figure 18.
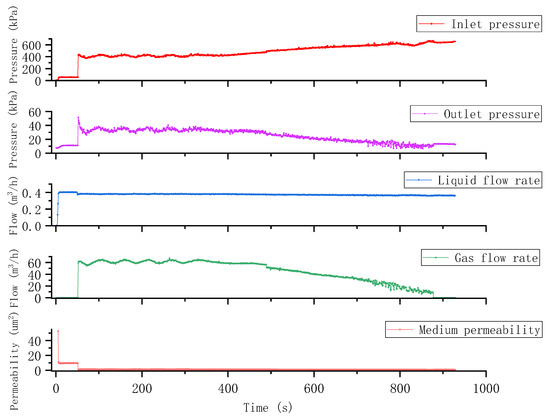
Figure 17.
Plugging experiments on the quartz-sand-packed layer (Scheme S5).
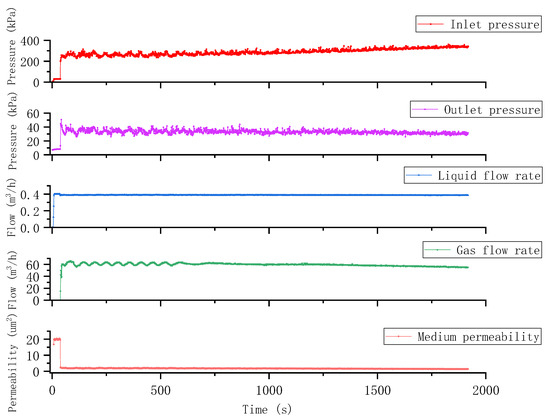
Figure 18.
Plugging experiments on the ceramic-particle-packed layer (Scheme S5).
According to the experimental curves in Figure 17, after improving the flow rate twice over, the quartz-sand-packed layer is plugged in the late stage of the experiments. Meanwhile, a large amount of milky-white muddy sand-carrying liquid also accumulates at the inlet of the incoming flow to the packed layer, which blocks the gas-flow channels, leading to a zero gas-flow rate. This indicates that the larger the flow rate is, the stronger the ability of water to carry the simulated formation sand. When impacting the quartz-sand-packed layer, the carried sand constantly causes bridge plugging on the outer surface of the packed layer. Meanwhile, the high-content clay constantly forms a mud cake on the surface of the packed layer, and is deeply embedded in the packed layer. As a result, the surface permeability gradually declines, causing a reduction in gas production.
In comparison, the ceramic-particle-packed layer in Figure 18 does not suffer from obvious plugging. The slight coverage of white mud on the ceramic particles indicates that, due to the presence of highly uniform pores, ceramic particles exhibit high permeability. Therefore, ceramic particles still show high fluid-flow performance, and enable stable gas production in a fine-silt environment with a high mud content. Water does not accumulate under the scheme, and gas and water flow smoothly through the packed layer at certain rates. Figure 19 compares the permeabilities of the quartz-sand- and ceramic-particle-packed layers at different flow rates. The final average permeabilities at different discharge rates under the scheme of the quartz-sand-packed layer are 0.863 and 0.648 µm2, respectively, showing a decrease amplitude of 24.9%. Those under the scheme of the ceramic-particle-packed layer are 2.728 and 1.410 µm2, with the latter decreasing by 48.3%. This indicates that the fine-silt NGH reservoirs with a high mud content still exhibit a high permeability under the scheme of the ceramic-particle-packed layer, which is not plugged while maintaining certain production. The anti-plugging performance of the ceramic-particle-packed layer is much better than that of the quartz-sand-packed layer.
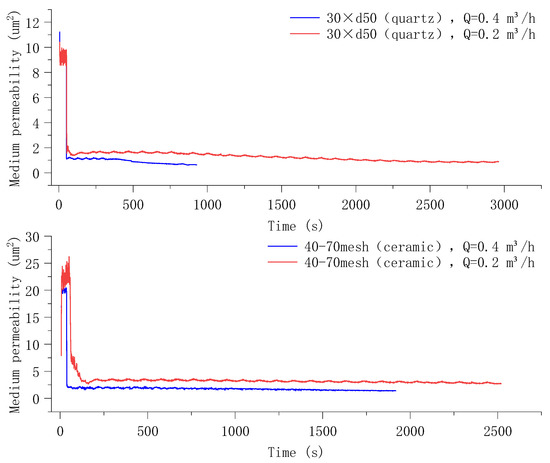
Figure 19.
Permeability comparison curves.
In this experiment, it can be observed that under the same formation conditions of sand-particle-size characteristics and mud content, when the fluid displacement increases once over, due to the different particle sizes and internal micropore structures of the filling medium, the changes in the displacement pressure difference and medium blockage permeability are different. As the fluid displacement increases, the enhanced sand-carrying capacity will reduce the anti-blockage performance of the filling layer. Compared with ceramic particles, quartz sand shows poor sphericity, is very easily fractured, exhibits poor sortability, and has nonuniform grain sizes, so the porosity of quartz-sand-packed layers is nonuniform. Therefore, it is suggested that quartz sand is replaced with ceramic particles (better packing materials will be studied in future research) as the packed layer, according to the experimental results. The experimental results provide experimental support for developing novel prepacking sieve tubes.
4. Conclusions
By carrying out displacement experiments under gas–water mixed flow with different packing media (quartz sand and ceramic particles), the following conclusions are obtained:
- (1)
- The essence of developing sand-retention media to block fine silt with a high mud content in NGH reservoirs is the plugging process of the sand-retention media. Because formation sand invades the sand-retention media, and some cannot be discharged, the permeability of the sand-retention media is impaired. In displacement experiments of different packing media by sand carried by gas–water mixed flow, the plugging law shows consistent change trends. The plugging process can be divided into three stages: the starting, intensified, and balanced stages of plugging. The plugging law is shown as follows: the permeability begins to decrease slowly, and then the reduction gradually slows down, until it does not change any longer.
- (2)
- In the experiments, formation sand carried by the fluid is blocked by the gravel-packed layer when it reaches the layer. The fine components in the formation sand invade the pores and channels of the gravel-packed layer. Because the gravel-packed layer has a certain thickness, the invaded fine sand cannot be discharged. Therefore, the invaded sand is retained on the surface and inside the gravel-packed layer to cause plugging. In addition, due to the high mud content, a mud cake is generally formed on the surface of the packed layer, to finally decrease the permeability of the gravel-packed layer.
- (3)
- Multiple packing schemes with a multiplication of the grain size were designed according to the Saucier empirical formula. Two materials; namely, quartz sand and ceramic particles; were adopted as the packing media. An analysis of the experimental results reveals that quartz sand is not suggested, while finer ceramic particles are advised, which can realize the principle of “preventing coarse expelling fine particles” to ensure a certain gas production, while avoiding the production of a high amount of formation sand to otherwise erode and damage equipment.
- (4)
- At present, the sand-control technology for natural gas hydrate test production is complex, difficult to construct, and costly. There is a great gap between the test production cycle and daily gas production, and the test production cycle and daily production threshold (5.0 × 10⁵ m3/d) required for industrial exploitation. Aiming at a fine-silt NGH reservoir with a high mud content, the comparison of the fluidity and plugging conditions of different filling-layer schemes under different working conditions was analyzed through this experimental research method and experimental results. These provided experimental support for the research and development of new prefilling sand-control screens, the selection of filling materials, and the optimization of sand-control schemes for hydrate mining, to reduce costs.
Funding
This research was funded by the Prospective Research Project of the Petroleum and Gas Development Foundation of the Science and Technology Department of Sinopec (P20040-3) and the Postdoctoral Program of Shengli Oilfield, Sinopec (YKB2107).
Data Availability Statement
The data included in this study cannot be shared at this time as the data also forms part of an ongoing study.
Acknowledgments
The work described in this paper is supported by the Prospective Research Project of Petroleum and Gas Development Foundation of Science and Technology Department of Sinopec (P20040-3), Postdoctoral Program of Shengli Oilfield, Sinopec (YKB2107).
Conflicts of Interest
The authors declare no conflict of interest.
Abbreviations
| NGH | Short for natural gas hydrate |
| D | In this article, D represents the particle size of the fill layer (such as quartz sand or ceramic particles). |
| D16 | D16 represents the corresponding particle sizes when the cumulative particle size distribution percentage in the sand sample of the simulated formation reaches 16%. |
| D25 | D25 represents the corresponding particle sizes when the cumulative particle size distribution percentage in the sand sample of the simulated formation reaches 25%. |
| D50 | D50 represents the corresponding particle sizes when the cumulative particle size distribution percentage in the sand sample of the simulated formation reaches 50%. |
| D75 | D75 represents the corresponding particle sizes when the cumulative particle size distribution percentage in the sand sample of the simulated formation reaches 75%. |
| D84 | D84 represents the corresponding particle sizes when the cumulative particle size distribution percentage in the sand sample of the simulated formation reaches 84%. |
| d | In this article, d represents the particle size of simulated formation sand. |
| d50 | d50 represents the corresponding particle sizes when the cumulative particle size distribution percentage in the sand sample of the simulated formation reaches 50%. |
| S1 | S1 stands for filling Scheme 1 |
| S2 | S2 stands for filling Scheme 2 |
| S3 | S3 stands for filling Scheme 3 |
| S4 | S4 stands for filling Scheme 4 |
| S5 | S5 stands for filling Scheme 5 |
References
- Lu, J.; Li, D.; He, Y.; Liang, D.; Xiong, Y. Research Status of Sand Production during the Gas Hydrate Exploitation Process. Adv. New Renew. Energy 2017, 5, 394–402. [Google Scholar]
- Liu, C.; Li, J.; Li, J.; Zhu, Y.; Wang, H. The resource of natural gas in china. J. Southwest Pet. Inst. 2004, 26, 9–13. [Google Scholar]
- Chen, H.; Zhang, W.; Xie, L.; Guo, M. Reserves and development status of global unconventional natural gas. Fault-Block Oil Gas Field 2010, 17, 439–442. [Google Scholar]
- Zhou, S.; Chen, W.; Li, Q.; Zhou, J.; Shi, H. Research on the solid fluidization well testing and production for shallow non-diagenetic natural gas hydrate in deep water area. China Offshore Oil Gas 2017, 29, 1–8. [Google Scholar]
- Ruan, X.; Song, Y.; Zhao, J.; Liang, H.; Yang, M.; Li, Y. Numerical simulation of methane production from hydrates induced by different depressurizing approaches. Energies 2012, 5, 438–458. [Google Scholar] [CrossRef]
- Wang, Y.; Li, X.; Li, G.; Zhang, Y.; Li, B.; Chen, Z. Experimental investigation into methane hydrate production during three-dimensional thermal stimulation with five-spot well system. Appl. Energy 2013, 110, 90–97. [Google Scholar] [CrossRef]
- Li, G.; Li, X.; Tang, L.; Zhang, Y. Experimental investigation of production behavior of methane hydrate under ethylene glycol injection in unconsolidated sediment. Energy Fuels 2007, 21, 3388–3393. [Google Scholar] [CrossRef]
- Hyodo, M.; Li, Y.; Yoneda, J.; Nakata, Y.; Yoshimoto, N.; Kajiyama, S.; Nishimura, A.; Song, Y. A comparative analysis of the mechanical behavior of carbon dioxide and methane hydrate-bearing sediments. Am. Mineral. 2014, 99, 178–183. [Google Scholar] [CrossRef]
- Yan, C.; Li, Y.; Cheng, Y.; Wei, J.; Tian, W.; Li, S.; Wang, Z. Multifield coupling mechanism in formations around a wellbore during the exploitation of methane hydrate with CO2 replacement. Energy 2022, 245, 123283. [Google Scholar] [CrossRef]
- Kurihara, M.; Sato, A.; Funatsu, K.; Ouchi, H.; Yamamoto, K.; Numasawa, M.; Ebinuma, T.; Narita, H.; Masuda, Y.; Dallimore, S. Analysis of production data for 2007/2008 Mallik gas hydrate production tests in Canada. In Proceedings of the International Oil and Gas Conference and Exhibition in China, F, 2010 C, Beijing, China, 8–10 June 2010; OnePetro: Richardson, TX, USA, 2010. [Google Scholar]
- Konno, Y.; Yoneda, J.; Egawa, K.; Ito, T.; Jin, Y.; Kida, M.; Suzuki, K.; Fujii, T.; Nagao, J. Permeability of sediment cores from methane hydrate deposit in the Eastern Nankai Trough. Mar. Pet. Geol. 2015, 66, 487–495. [Google Scholar] [CrossRef]
- Terao, Y.; Duncan, M.; Hay, B.; Dang, L. Deepwater methane hydrate gravel packing completion results and challenges. In Proceedings of the Offshore Technology Conference, F, 2014 C, Houston, TX, USA, 5–8 May 2014; OnePetro: Richardson, TX, USA, 2014. [Google Scholar]
- Liu, C.; Li, Y.; Sun, J.; Wu, N. Gas hydrate production test: From experimental simulation to field practice. Mar. Geol. Quat. Geol. 2017, 37, 12–26. [Google Scholar] [CrossRef]
- Ota, M.; Morohashi, K.; Abe, Y.; Watanabe, M.; Smith, R.L.; Inomata, H. Replacement of CH4 in the hydrate by use of liquid CO2. Energy Convers. Manag. 2005, 46, 1680–1691. [Google Scholar] [CrossRef]
- Lee, Y.; Choi, W.; Shin, K.; Seo, Y. CH4-CO2 replacement occurring in sII natural gas hydrates for CH4 recovery and CO2 sequestration. Energy Convers. Manag. 2017, 150, 356–364. [Google Scholar] [CrossRef]
- Hunter, R.B.; Collett, T.S.; Boswell, R.; Anderson, B.J.; Digert, S.A.; Pospisil, G.; Baker, R.; Weeks, M. Mount Elbert gas hydrate stratigraphic test well, Alaska North Slope: Overview of scientific and technical program. Mar. Pet. Geol. 2011, 28, 295–310. [Google Scholar] [CrossRef]
- Liang, Y.; Tan, Y.; Luo, Y.; Zhang, Y.; Li, B. Progress and challenges on gas production from natural gas hydrate-bearing sediment. J. Clean. Prod. 2020, JCLP261, 121061. [Google Scholar] [CrossRef]
- Zheng, R.; Li, S.; Li, X. Sensitivity analysis of hydrate dissociation front conditioned to depressurization and wellbore heating. Mar. Pet. Geol. 2018, 91, 631–638. [Google Scholar] [CrossRef]
- Bhade, P.; Phirani, J. Effect of geological layers on hydrate dissociation in natural gas hydrate reservoirs. J. Nat. Gas Sci. Eng. 2015, 26, 1549–1560. [Google Scholar] [CrossRef]
- Chong, Z.R.; Yin, Z.; Tan, J.H.C.; Linga, P. Experimental investigations on energy recovery from water-saturated hydrate bearing sediments via depressurization approach. Appl. Energy 2017, 204, 1513–1525. [Google Scholar] [CrossRef]
- Feng, Y.; Chen, L.; Suzuki, A.; Kogawa, T.; Okajima, J.; Komiya, A.; Maruyama, S. Enhancement of gas production from methane hydrate reservoirs by the combination of hydraulic fracturing and depressurization method. Energy Convers. Manag. 2019, 184, 194–204. [Google Scholar] [CrossRef]
- Lee, Y.; Deusner, C.; Kossel, E.; Choi, W.; Seo, Y.; Haeckel, M. Influence of CH4 hydrate exploitation using depressurization and replacement methods on mechanical strength of hydrate-bearing sediment. Appl. Energy 2020, 277, 115569. [Google Scholar] [CrossRef]
- Yan, C.; Ren, X.; Cheng, Y.; Song, B.; Li, Y.; Tian, W. Geomechanical issues in the exploitation of natural gas hydrate. Gondwana Res. 2020, 81, 403–422. [Google Scholar] [CrossRef]
- Hassanpouryouzband, A.; Joonaki, E.; Farahani, M.V.; Takeya, S.; Ruppel, C.; Yang, J.; Niall, J.; Schicks, J.M.; Edlmann, K.; Mehrabian, H.; et al. Gas hydrates in sustainable chemistry. Chem. Soc. Rev. 2020, 49, 5225–5309. [Google Scholar] [CrossRef] [PubMed]
- Cohen, E.; Klar, A.; Yamamoto, K. Micromechanical investigation of stress relaxation in gas hydrate-bearing sediments due to sand production. Energies 2019, 12, 2131. [Google Scholar] [CrossRef]
- Uchida, S.; Seol, Y.; Yamamoto, K. Sand Migration Simulation during Gas Production from Gas Hydrate Reservoir at Kuparuk 7–11–12 site in the Prodhoe Bay Unit, Alaska. Energy Fuels 2022, 36, 7382–7390. [Google Scholar] [CrossRef]
- Farahani, M.V.; Foroughi, S.; Norouzi, S.; Jamshidi, S. Mechanistic study of fines migration in porous media using lattice Boltzmann method coupled with rigid body physics engine. J. Energy Resour. Technol. 2019, 141, 123001. [Google Scholar] [CrossRef]
- Liu, C.; Meng, Q.; Hu, G.; Li, C.; Sun, J.; He, X.; Wu, N.; Yang, S.; Liang, J. Characterization of hydrate-bearing sediments recovered from the Shenhu area of the South China Sea. Interpretation 2017, 5, 13–23. [Google Scholar] [CrossRef]
- Dong, C.; Zhong, Y.; Wu, Y.; Zhou, Y.; Zeng, S.; Yan, Q. Experimental study on sand retention mechanisms and feasibility evaluation of sand control for gas hydrate reservoirs with highly clayey fine sands. J. China Univ. Pet. 2018, 42, 79–87. [Google Scholar]
- Chen, F.; Zhou, Y.; Su, X.; Liu, G.; Lu, H.; Wang, J. Gas hydrate saturation and its relation with grain size of the hydrate-bearing sediments in the shenhu area of northern south china sea. Mar. Geol. Quat. Geol. 2011, 31, 95–100. [Google Scholar] [CrossRef]
- Li, Y.; Hu, G.; Liu, C.; Wu, N.; Chen, Q.; Liu, L.; Li, C. Gravel sizing method for sand control packing in hydrate production test wells. Pet. Explor. Dev. 2017, 44, 1016–1021. [Google Scholar] [CrossRef]
- Yan, C.; Dong, L.; Ren, X.; Cheng, Y. Stability of submarine slopes during replacement of methane in natural gas hydrates with carbon dioxide. J. Clean. Prod. 2023, 383, 135440. [Google Scholar] [CrossRef]
- Ding, J.; Cheng, Y.; Yan, C.; Song, B.; Sun, H.; Teng, F. Experimental study of sand control in a natural gas hydrate reservoir in the South China sea. Int. J. Hydrog. Energy 2019, 44, 23639–23648. [Google Scholar] [CrossRef]
- Ning, F.; Dou, X.; Sun, J.; Liu, Z.; Li, Y.; Li, X.; Zhao, Y.; Liu, C.; Lu, H.; Yu, Y.; et al. Progress in numerical simulation of sand production from hydrate reservoirs. Pet. Sci. Bull. 2020, 5, 182–203. [Google Scholar]
- Jung, J.W.; Jang, J.; Santamarina, J.C.; Tsouris, C.; Phelps, T.J.; Rawn, C.J. Gas production from hydrate-bearing sediments: The role of fine particles. Energy Fuels 2012, 26, 480–487. [Google Scholar] [CrossRef]
- Lee, J.; Ahn, T.; Lee, J.Y.; Kim, S.J. Laboratory test to evaluate the performance of sand control screens during hydrate dissociation process by depressurization. In Proceedings of the Tenth ISOPE Ocean Mining and Gas Hydrates Symposium, F, 2013 C, Szczecin, Poland, 22–26 September 2013; OnePetro: Richardson, TX, USA, 2013. [Google Scholar]
- Dong, C.; Song, Y.; Zhou, Y.; Xu, H.; Wang, J.; Liu, Y.; Wang, L. Plugging law and microscopic sand retention mechanism of sand retaining medium of argillaceous fine silt sand in gas hydrate reservoirs. Acta Pet. Sin. 2020, 41, 1248–1258. [Google Scholar]
- Dong, C.; Zhou, B.; Song, Y.; Liu, C.; Deng, J. Sand-retaining simulation experiment of screen media for formation sand in natural gas hydrate reservoirs and evaluation method. J. China Univ. Pet. 2020, 44, 79–88. [Google Scholar]
- Li, Y.; Wu, N.; Ning, F.; Hu, G.; Liu, C.; Dong, C.; Lu, J. A sand-production control system for gas production from clayey silt hydrate reservoirs. China Geol. 2019, 2, 121–132. [Google Scholar] [CrossRef]
- Yamamoto, K.; Wang, X.-X.; Tamaki, M.; Suzuki, K. The second offshore production of methane hydrate in the Nankai Trough and gas production behavior from a heterogeneous methane hydrate reservoir. RSC Adv. 2019, 9, 25987–26013. [Google Scholar] [CrossRef] [PubMed]
- Ye, J.; Qin, X.; Xie, W.; Lu, H.; Ma, B.; Qiu, H.; Liang, J.; Lu, J.; Kuang, Z.; Lu, C.; et al. The second natural gas hydrate production test in the South China Sea. Geol. China 2020, 47, 197–209. [Google Scholar] [CrossRef]
- Li, Y.; Liu, L.; Liu, C.; Sun, J.; Ye, Y.; Chen, Q. Sanding prediction and sand-control technology in hydrate exploitation:a review and discussion. Mar. Geol. Front. 2016, 32, 36–43. [Google Scholar]
- Huang, G.; Su, Z.; Xia, M.; Wu, D. Study on sand production in a natural gas hydrate production well. Mar. Geol. Quat. Geol. 2017, 37, 174–183. [Google Scholar]
- Shen, Z.; Wang, D.; Jia, Y. Analysis on gas hydrate exploitation response between the horizontal and vertical wells at SH2 site in the Shenhu area of the South China Sea. Ocean. Eng. 2019, 37, 107–116. [Google Scholar]
- Wu, N.; Li, Y.; Wan, Y.; Sun, J.; Huang, L.; Mao, P. Prospect of marine natural gas hydrate stimulation theoty and technology system. J. Nat. Gas Ind. 2020, 40, 100–115. [Google Scholar]
- Zhang, T.; Ran, H.; Xu, J.; Sha, Z.; Jiang, Y.; Wang, K. Research and Development Progress as well as Technical Orientation of the Natural Gas Hydrate in Japan. Acta Geosci. Sin. 2021, 42, 196–202. [Google Scholar]
- Li, S.; Sun, Y.; Chen, W.; Yu, Z.; Zhou, Z.; Liu, L.; He, J.; Zhang, S.; Li, X. Analyses of gas production methods and offshore production tests of natural gas hydrates. J. Eng. Geol. 2019, 27, 55–68. [Google Scholar]
- Liao, H.; Dong, L.; Niu, J.; Zhou, H.; Zhang, L.; Cao, Y. An experimental study on plugging and erosion failures of sand screen in grave-packing conditions. J. China Univ. Pet. 2019, 43, 90–97. [Google Scholar]
- Shao, M.; Wang, P.; Wu, L.; Zhang, W.; Tian, Q. A comparative analysis of offshore gas hydrates production test in Japan. Mar. Geol. Front. 2022, 38, 8–15. [Google Scholar]
- Dong, C.; Jia, B.; Liu, C.; Wu, J.; Wang, D.; Sun, D.; Han, X. Blocking mechanism and blocking laws experiments of sand retention media in mechanical screens. J. China Univ. Pet. 2011, 35, 82–88. [Google Scholar]
- Teng, F. Experimental Study on Sand Production of Natural Gas Hydrate Reservoir D. Master’s Thesis, China University of Petroleum, Qingdao, China, March 2018. [Google Scholar]
- Zhao, D.; Dong, C.; Zhang, Q. A New Model for Gravel Size Evaluation and the Optimization. Pet. Drill. Tech. 2004, 4, 63–65. [Google Scholar]
- Ma, S.; Xiong, Y.; Yu, D.; Liu, L.; Xiong, J.; Du, J. Research on precision design of sand control on high yield offshore gas field. Oil Drill. Prod. Technol. 2013, 35, 48–51. [Google Scholar]
- Saucier, R.J. Considerations in gravel pack design. J. Pet. Technol. 1974, 26, 205–212. [Google Scholar] [CrossRef]
- Saifulla, D.; Dong, C.; Li, Y.; Chen, Q.; Liu, C.; Wang, H. Influence Law of Hybrid Plugging of Gravel-Packed Media on Productivity in Natural Gas Hydrate Reservoirs. Pet. Drill. Tech. 2022, 50, 94–101. [Google Scholar]
Disclaimer/Publisher’s Note: The statements, opinions and data contained in all publications are solely those of the individual author(s) and contributor(s) and not of MDPI and/or the editor(s). MDPI and/or the editor(s) disclaim responsibility for any injury to people or property resulting from any ideas, methods, instructions or products referred to in the content. |
© 2023 by the author. Licensee MDPI, Basel, Switzerland. This article is an open access article distributed under the terms and conditions of the Creative Commons Attribution (CC BY) license (https://creativecommons.org/licenses/by/4.0/).