Article

A Novel Pattern Recognition based Kick Detection Method for Offshore Drilling Gas Kick and Overflow Diagnosis

1
College of Safety and Ocean Engineering, China University of Petroleum-Beijing, Beijing 102249, China
2
SINOPEC International Petroleum Exploration & Production Corporation, Beijing 100029, China
3
SINOPEC Research Institute of Petroleum Engineering Co., Ltd., Beijing 102206, China
*
Author to whom correspondence should be addressed.
Processes 2023, 11(7), 1997; https://doi.org/10.3390/pr11071997
Submission received: 20 May 2023 / Revised: 20 June 2023 / Accepted: 27 June 2023 / Published: 3 July 2023
(This article belongs to the Special Issue Oil and Gas Well Engineering Measurement and Control)

Abstract

:
In offshore drilling, accidents such as gas invasion, overflow, and kicks are unavoidable, and they can escalate into blowouts and other catastrophic events, resulting in casualties and significant economic losses. Therefore, ensuring drilling safety requires precise monitoring of gas invasion and overflow. Currently, most overflow monitoring methods used at drilling sites are based on threshold criteria. However, the monitoring parameters obtained during actual drilling operations often contain noise signals, which makes it challenging for threshold-based methods to achieve a balance between improving accuracy and minimizing false positives. This paper proposes a novel method called Pattern-Recognition-based Kick Detection (PRKD) for diagnosing overflow in offshore drilling. The PRKD method utilizes the overflow evolution process by integrating multiphase flow calculations, data filtering theory, pattern recognition theory, the Bayesian framework, and other theoretical models. By analyzing the shape and wave characteristics of the curves, PRKD effectively detects and monitors gas intrusion and overflow based on single parameters. Through case analysis, it is demonstrated that the proposed method achieves high precision in monitoring drilling overflow while maintaining a low false positive rate. By combining advanced computational techniques with pattern recognition algorithms, PRKD improves the accuracy and reliability of kick detection, enabling proactive responses to potential risks, protecting the environment and human lives, and optimizing drilling operations. The case analysis shows that by integrating the probabilistic information of pre-drilling kicks and various characteristic parameters, when the noise amplitude is less than 8 L/s, the PRKD model exhibits superior detection performance. Moreover, when the noise amplitude is 16 L/s, the PRKD model detects the continuous overflow approximately 200 s after the actual overflow occurs and predicts a 95.8% probability of overflow occurrence at the specified location, meeting the on-site requirements. The gas invasion monitoring method proposed in this paper provides accurate diagnostic results and a low false positive rate, offering valuable guidance for gas invasion monitoring in drilling operations.

1. Introduction

In the process of offshore drilling, if gas invasion and overflow are not detected in time, a blowout can rapidly occur. Blowouts are often the most dangerous of the numerous drilling accidents. To accomplish safe and efficient drilling, reduce downhole accidents, and lower drilling costs, it is necessary to excel at early monitoring, early detection, and early treatment of overflow [1,2,3,4,5]. In terms of theory, there are currently two types of overflow detection techniques used in deepwater drilling: the threshold method and predictive systems. The threshold method involves establishing a threshold value for the identifying parameters detected during the kick process. When the detection parameter exceeds the specified value, an alarm activates and a kick will be detected. For instance, if the increment of the mud pool is 1 m3, when the judged kick occurs under a certain working condition, if the increment is less than 1 m3, the drilling is considered normal, while, if the increment is greater than 1 m3, overflow is considered to have occurred [6,7,8]. Maus L.D. et al. [9] pointed out that the incremental monitoring of the mud pit can be used as a parameter for gas invasion monitoring. The mud pit increment is the result of integrating the difference between inflow and outflow rates over time. J.M. Speers and G.F. Gehrig [10] proposed a system for monitoring wellbore influx or losses during drilling using flow rate differentials. B.T. Anfinsen et al. [11] reported that although the sensitivity of mud pit increment monitoring to gas invasion is controversial, it can detect the infiltration of fluids even at very low flow rates. D. Fraser et al. [12] proposed two major parameters related to wellbore influx. The first parameter is the Kick Detection Volume (KDV), which represents the volume of invaded formation fluid before the wellbore influx is identified. The second parameter is the Kick Response Time (KRT), which refers to the time required for well control operations once the wellbore influx is detected. Nayeem A.A. et al. [13] introduced a method for monitoring wellbore influx based on changes in downhole parameters such as mass flow rate, pressure, density, and drilling fluid conductivity. The major advantage of this method is its short detection time and quick response to wellbore influx. It allows for rapid identification of influx events, enabling timely well control actions.
The second method is the simulation prediction method, which simulates the “theoretical value” of the overflow characteristic parameters under normal conditions (no overflow) in real time using computer software. If the “measured value” exceeds a predetermined threshold of the “theoretical value” during the drilling process, it is considered an overflow [14,15,16]. Moreover, there are additional overflow diagnosis methods, such as the BP neural network method and the probabilistic analysis method, but their applications are limited. Liao Mingyan et al. [17] developed a drilling process state monitoring and fault diagnosis method based on a BP neural network model. This method focused on six parameters: drilling pressure, pump pressure, pump rate, rotary speed, torque, and drilling speed. The neural network model possesses fault tolerance, self-learning, and adaptive capabilities, allowing it to simulate complex nonlinear mappings and process data in parallel with high real-time performance. However, neural networks often require many training samples to achieve optimal performance. Roar et al. [18] combined theoretical flow models with artificial intelligence techniques to identify hidden patterns in time-series data and address limitations in physical models, thereby reducing false alarm rates. David Hargreaves et al. [19] addressed the limitations of the threshold method and proposed a new approach for wellbore influx diagnosis based on pattern recognition theory and Bayesian discrimination. This method utilized statistical techniques to handle noise issues and simulated gas influx and non-influx events to avoid false alarms or missed detections due to ambiguous data. Pournazari et al. [20] developed a pattern recognition system for rapid analysis and real-time diagnosis of drilling events using the SAX (Symbolic Aggregate Approximation) method. This system enables fast and accurate wellbore influx diagnosis.
Although various kick monitoring methods have been proposed, many are unsuitable for offshore deepwater drilling sites, where wellheads are usually placed on the seabed and kick detection is necessary to prevent gas from entering the riser. Common kick monitoring techniques, such as the flow back velocity method, mud pool increment method, etc., rely on the volume expansion of gas in the invading wellbore. Under high-pressure conditions in the wellbore, natural gas has a high solubility and density in the drilling fluid, as well as a small volume after invasion, making it difficult to locate. Simultaneously, deepwater drilling conditions are complex, the fluctuation range of kick monitoring parameters is large, and the noise level is high. The traditional discriminant technique based on the threshold value method has low kick diagnosis accuracy and a high false positive rate, which poses significant difficulties for the early monitoring of the deep kick [21,22].
Currently, the threshold method is widely used for kick monitoring in the drilling field. However, the monitoring parameters collected during actual drilling processes often contain significant noise signals, making it challenging to achieve a balance between accuracy improvement and reducing false positives based solely on threshold judgment. To address this issue, this study proposes a novel and reliable kick monitoring method called PRKD (Pattern-Recognition-based Kick Detection) for offshore drilling. PRKD is established by integrating multiphase flow calculations, data filtering theory, pattern recognition theory, and the Bayesian framework. It focuses on a single-parameter gas intrusion monitoring approach, utilizing the time series of kick monitoring parameters as the research object. By combining the single-parameter process identification and diagnosis mechanism with pattern recognition techniques, PRKD offers an innovative solution for kick detection and has several advantages: (1) Maintaining accuracy in kick diagnosis while reducing false positives: PRKD ensures the accuracy of kick detection while minimizing the occurrence of false alarms. Real-time data matching enables early identification of kicks, allowing proactive measures to be implemented promptly. (2) Minimizing the impact of data noise on judgment results: The PRKD method incorporates data filtering techniques to mitigate the effects of noise signals present in the monitoring parameters. This helps in achieving more reliable and accurate kick detection. (3) Acquiring basic kick patterns from multiple sources: The PRKD method allows for obtaining basic kick patterns from various channels, reducing the dependence on the accuracy of computational software results. These patterns can be continuously updated in real time and can be customized based on the experience and expertise of technical personnel. (4) Utilizing multiple available data sources: By integrating various data sources, PRKD achieves probabilistic output results, enhancing the overall accuracy of kick detection. This comprehensive approach improves the reliability of the monitoring system. (5) Potential for inferring additional kick information: The PRKD method has the capability to infer other relevant kick information beyond basic detection. This further expands the scope of kick monitoring and provides a more comprehensive understanding of the drilling process. By incorporating sophisticated computational techniques and pattern recognition algorithms, PRKD significantly enhances the reliability and accuracy of kick detection. This empowers drilling operations with the ability to proactively implement measures to mitigate potential risks, safeguard the environment, and protect human lives. The integration of PRKD into drilling practices optimizes operational efficiency while ensuring the safety and well-being of all involved parties.

2. The Basic Overflow Pattern

In the PRKD method, the “ruler” used to assess overflow events is a pattern or trend of change rather than a single threshold. In the past, it was believed that an increase in the outlet flow rate indicated a possible overflow event, but, an increase in the outlet flow rate could also be caused by starting the pump. If a threshold is used to make decisions, it is challenging to differentiate between overflow events and pump start events. In fact, both overflow and pump start events can increase the outlet flow rate, but their “trends” of change are different. During overflow, the outlet flow rate increases linearly, whereas it increases abruptly and then maintains a specific value during pump start. Similarly, traditional methods focus on “increasing to a certain specific value” for the basic event of “the outlet flow rate increase”, whereas the PRKD method is concerned with “what the trend the increase follows, linear increase or sudden change”.
Using change trends as the basic element has the following three advantages:
(1)
Reduces the number of false alarms. The use of a threshold value alone cannot distinguish excess events from similar events.
(2)
Significantly decreases the dependence on the accuracy of calculation software. To achieve high calculation accuracy, it is necessary to precisely describe the physical processes and calculation parameters, and even a minor deviation can result in significant errors, which is frequently challenging in deepwater drilling environments. For instance, when the friction coefficient is 0.001 and 0.0011, the calculated value of the bottom hole pressure will result in significant errors, but the influence of the changing trend of the calculated value of the bottom hole pressure can be neglected.
(3)
Other stratigraphic information can be retrieved. For example, the increment pressure and mud pool increment trend can be utilized to retrieve formation pressure data. The gas invasion process is like the unstable well test process. Therefore, stratigraphic information can be represented based on the change in gas invasion response parameters (standpipe pressure (SPP), outlet flow rate, mud pool increment, etc.), thus realizing stratigraphic information inversion before shut-in, which plays an important role in the density design of kill fluid.
The basic pattern can be obtained through various channels. If the drilling block contains a large amount of geological history data of the stratigraphic profile, the basic overflow pattern can be determined by fitting the statistical data. If historical data are limited, the basic overflow pattern can be simulated for the well. In addition, drilling engineers can establish the basic pattern based on their experience. Furthermore, the basic overflow pattern can be updated in real time based on the well overflow events that have occurred.
Theoretically, most overflow characteristic drilling parameters can be depicted by segmented polynomial functions and sudden change functions. Hargreaves et al. [23] found that after a wellbore surge occurs, the difference between inlet and outlet flow rates increases linearly, and the mud increment changes with an increase to a quadratic polynomial form. Reitsma et al. [24] reported that after a deepwater managed pressure drilling surge occurs, the casing pressure increases linearly and the pore pressure increases linearly before decreasing linearly. Based on the results of multiphase flow simulation and the expertise of experts, the basic patterns of characteristic parameters such as the flow rate differential, mud pit increment, casing pressure, pore pressure change, and mechanical drilling speed during wellbore surges and other accidents can be determined, as shown in Figure 1, Figure 2, Figure 3 and Figure 4 below.
(1)
Flow rate differential
Steady State: the flow rate differential remains within a relatively stable range, indicating a balanced flow of drilling fluid entering the wellbore and returning to the surface.
Kick State: the flow rate differential increases as a larger volume of gas returns to the surface through the wellbore.
Pump on State: the flow rate differential increases as a large volume of mud is injected into the wellbore.
Loss State: the flow rate differential decreases as some drilling fluids are absorbed or leaked into the formation.
(2)
Mud Pit Increment
Steady State: The mud pit increment is maintained within an appropriate range to replenish the drilling fluid consumed during the drilling process. Without mud replenishment, the mud pit increment will decrease as drilling fluid is consumed.
Kick State: the mud pit increment increases to compensate for the decrease in mud volume due to gas invasion
Pump on State: the mud pit increment decreases to accommodate the additional mud volume pumped into the wellbore.
Loss State: the mud pit increment decreases to compensate for the lost drilling fluid.
(3)
Casing Pressure (CP) and Standpipe Pressure (SPP) Changes
Steady State: casing pressure and standpipe pressure changes are minimal, indicating no abnormal influx or pressure variations.
Kick State: CP and SPP changes increase due to the added pressure from gas influx. As well control measures are implemented, the SPP is expected to decrease, while the CP is expected to further increase.
Pump on State: CP and SPP changes may increase instantaneously as the wellbore pressure rises due to the large volume of mud injection.
Loss State: CP and SPP changes decrease due to the pressure loss in the wellbore caused by losses.
(4)
Rate of Penetration (ROP) Changes
Steady State: the ROP remains relatively stable, ensuring good drilling progress.
Kick State: If the density of the drilling fluid is not adjusted promptly when gas kick, it can lead to a decrease in the bottom hole pressure compared to the formation pressure or a reduction in the positive pressure difference between the bottom hole pressure and formation pressure, resulting in an increase in the ROP.
Pump on State: When pump on operations begin, the increased flow rate of drilling fluid circulating through the drill string can enhance the hydraulic horsepower at the bit. This can result in an increased bit penetration rate and, therefore, an accelerated ROP.
Loss State: When drilling fluid is lost to the formation, it reduces the hydrostatic pressure exerted by the drilling fluid column. As a result, the effective weight on the bit decreases, leading to a decrease in the ROP.

3. The Principle of Data Processing and Filtering

The objective of data processing and filtration is to eliminate data noise without distorting the overall trend. The processing of overflow characteristic data begins with data normalization to reflect the data trend to the maximum extent, followed by Kalman filtering to determine the data noise.
Kalman filtering is a recursive estimation algorithm introduced by Kalman, which introduces the state space model into filtering theory and derives a set of recursive estimation algorithms to overcome the drawback that previous filtering theories cannot make unlimited use of past data and are not suitable for real-time processing. Kalman filtering seeks a set of recursive estimation algorithms based on the best criterion of minimum mean square error. Additionally, it has been documented in the field of overflow detection. The two main equations are the discrete state equation and the observation equation [25].
X ( K ) = F ( k , k 1 ) × X ( K 1 ) + T ( K , K 1 ) × U ( K 1 )
Y ( K ) = H ( k ) × X ( K ) + N ( K )
where X(K) and Y(K) are the state vector and observation vector, respectively, at time k, F(k, k − 1) is the state transition matrix, U(K) is the dynamic noise at time k, T(K, K − 1) is the system control matrix, H(k) is the observation matrix at time k, and N(K) is the observation noise at time k.
For each surge characteristic parameter, the data processing and filtering process is as follows [26]:
Step 1: Data normalization Y(k)
Y ( K ) = ( Y ( k ) Y min ) / ( Y max Y min )
Step 2: Calculate the predicted covariance matrix
C ( k ) = F ( k , k 1 ) × C ( k ) × F ( k , k 1 ) + T ( k , k 1 ) × Q ( k ) × T ( k , k 1 )
Q ( k ) = U ( k ) × U ( k )
Step 3: Calculate the Kalman gain matrix
K ( k ) = C ( k ) × H ( k ) × [ H ( k ) × C ( k ) × H ( k ) + R ( k ) ] 1
R ( k ) = N ( k ) × N ( k ) 1
Step 4: Estimate update
X ( k ) ~ = X ( k ) + K ( k ) × [ Y ( k ) H ( k ) × K ( k ) ]
Step 5: Calculate the updated estimated covariance matrix
C ( k ) ~ = [ I K ( k ) × H ( k ) ] × C ( k ) × [ I K ( k ) × H ( k ) ] + K ( k ) × R ( k ) × K ( k )
Step 6: Set parameters and repeat steps 2–6.
X ( k + 1 ) = X ( k ) ~
C ( k + 1 ) = C ( k ) ~
Using flow wave data as an example, the data curve before and after filtering is compared, as shown in Figure 5 and Figure 6.

4. Pattern Recognition Representation Methods

Pattern recognition in the PRKD method consists of comparing the measured characteristic parameter vector to the basic overflow pattern and measuring the degree of similarity. In contrast to common function fitting, the challenge here is to avoid “entanglement” in the change in specific values and to select the changing trend and turning point as the characteristic parameters. Figure 7 depicts the measured flow variation of the drilling inlet and outlet. Despite the large difference between the two curves at different times A and B, the matching degree between the two curves and the overflow mode in the PRKD method should be 100%.

4.1. Pattern Classification

The difficulty in pattern classification lies in the extraction and matching of feature vectors. A feature vector is a group of observed or preliminary calculated characteristic values that serves as the basis for pattern classification. The basic overflow mode in the PRKD method is primarily composed of a piecework polynomial function or mutation function, and the feature vector of any basic mode is as follows:
V e c t o r = ( K a l l , m , x 1 , k 1 , x 2 , k 2 , , x m 1 , k m 1 , k m )
where Kall is the overall change trend of the curve; m is the turning point of the curve; x i ( i = 1 , 2 , , m 1 ) is the position of the segment point in the pattern; and k i ( i = 1 , 2 , , m ) is the trend change of the curve in paragraph i.
In the basic overflow mode, the “kick” event against the increment of the mud pool is taken, as an example, as m = 1, and the feature vector is:
V e c t o r = ( K a l l , 1 , x 1 , k 1 , k 2 )
Kall decreases first and then increases, going from a negative value to a positive value; m represents the number of inflection points in the curve; x1 approximates the time of occurrence of overflow, which is the position of the curve’s inflection points; k1 represents a linear change trend with a negative slope; and k2 represents a quadratic polynomial function with a slope that transitions from negative to positive.
Another crucial advantage of the PRKD method is that feature vectors in pattern recognition can invert the kick information. Similarly, taking the “kick” event of the increment of the mud pool as an example, x1 and k2 can reflect the beginning of the overflow moment and the overflow velocity. The kick process and formation information can be retrieved by combining other characteristic changes.

4.2. Optimal Matching Algorithm

The PRKD method’s pattern recognition bases its success on identifying the optimal solution. The fundamental concept is to arrange all possible combinations into a tree in a specific order and then search along the tree to avoid superfluous calculations, thereby ensuring that the algorithm is efficient, fast, and capable of real-time data processing. The process of building an algorithm involves the following parameters and operations:
(1)
The root node is all features (level 0), one feature is discarded on each node, and each leaf node represents a variety of selection combinations. In the PRKD method, the first-level leaf node is the segment number, the second-level leaf node is the curve information of each segment, and so on, as shown in Figure 8.
(2)
Record the maximum criterion function value of the currently searched leaf nodes and set the initial value to 0 in order to avoid the same combination of branches and leaves in the entire tree. In the PRKD method, the matching degree of each combination must be recorded.
(3)
P is defined as the value of the real-time matching degree. At each level, the feature that is least likely to be discarded is placed on the leftmost side, and the search starts from the right side. In the PRKD method, from left to right, each leaf node is xi, K, the change in K, and function value.
(4)
If the left level of the abandoned feature is not below this node, search for the leaf node, update the value of Pmax, and then go back to the previous branch.
(5)
If P < Pmax on the node, then do not search down, but instead retrace upwards. Each retrace will put back the abandoned feature (put it back on the list to be discarded). If the process has retraced to the top (root) and cannot search further down, then the leaf node of P = Pmax is the solution.
Based on steps A to E, the optimal search algorithm is formulated, and the optimal solution is searched based on various basic modes.

4.3. Measures of Pattern Matching Degree

The PRKD method must also address the problem of quantifying the degree of match between the optimal solution and the basic mode. In the similarity measurement based on time series, Euclidean distance is the most basic measurement method. The advantage of Euclidean distance is that it can represent the matching degree of a curve value based on wave amplitude; however, its ability to recognize sequence shape is poor, and it is easily disturbed by noise information.
Regarding morphological feature matching, several studies based on radian distance, slope distance, morphological features, similarity, and other aspects have been conducted. In this paper, the improved slope distance concept is proposed for measuring the matching degree of the curve shape. The matching degree of the final model should be based on the fluctuation amplitude, change trend, and time span. The matching degree measurement standard is the product of the Euclidean distance and the improved slope distance.
It is assumed that the time series S of wellbore detection characteristic parameters is:
S = { ( y 0 , y 1 , t 1 ) , ( y 1 , y 2 , t 2 ) , , ( y i 1 , y i , t i ) , , ( y n 1 , y n , t n ) }
S = { ( k 1 , t 1 ) , ( k 2 , t 2 ) , , ( k i , t i ) , , ( k n , t n ) }
where ( y i 1 , y i , t i ) is each segment; y i 1 is the starting point of the segment; y i is the segmented endpoint; t i is the initial moment of the segment; and k i is the slope of the segment.
Thus, the Euclidean distance of each parameter value of the time series S and another series S’ is:
D o ( S , S ) = s q r t [ i = 1 n ( y i y i ) 2 ]
Obviously, Euclidean distance can reflect the amplitude of fluctuation between two sequences. Similarly, the slope distance between two sequences is:
D k ( S , S ) = | i = 1 n Δ t i ( k i k i ) / t n |
The slope distance Dk has effective anti-noise properties and can intuitively describe the trend of sequence changes. In fact, in addition to a trend change, the time span should also be considered when determining morphological similarity; therefore, this paper proposes an improved slope distance based on time weighting:
D K M ( S , S ) = | i = 1 n Δ t i W i ( k i k i ) |
W i = ( D i D min ) × a D max D min + ( 1 a )
where W i [ a , 1 ] is the time weighting of paragraph i, W i [ a , 1 ] , a [ 0.1 , 1 ] and D i = max ( | y i 1 y i 1 | , | y i y i | ) is the fluctuation value.
Based on the fluctuation amplitude, change trend, and time span, this paper proposes that the distance between the monitoring data in the PRKD method and the optimal solution is:
C r = D O × D K M
Based on this, the similarity probability between the optimal solution of an event and the basic mode should be inversely proportional to the distance Cr, and the similar probability vector of the basic mode can be written as:
[ P 1 , P 2 , , P M ] = [ 1 c r 1 / i = 1 M ( 1 c r i ) , 1 c r 2 / i = 1 M ( 1 c r i ) , , 1 c r M / i = 1 M ( 1 c r i ) ]
where M represents the type of basic mode. For example, there are four basic events, namely, kick, state, pump on, and loss, aiming at the incremental change of the mud pool, namely, M = 4.
Based on the above pattern matching method, the possible probability of each optimal solution in Figure 9 can be obtained as follows:
[ P k i c k , P p u m p   on , P s t a t e , P l o s s ] = [ 74.886 , 17.456 , 7.657 , 0 ] / 100
There is a 71.886% chance of flooding, a 17.456% chance of pumping, a 7.657% chance of drilling properly, and a zero chance of loss.

5. Bayesian Framework

In this paper, the Bayesian framework is adopted to coordinate the prior information and likelihood information and realize the output form of the probability. The expression for the Bayes formula is:
P ( A i | B ) = P ( B | A i ) P ( A i ) i = 1 n P ( B | A i ) P ( A i ) , i = 1 , 2 , , n
where Ai are different kinds of detection parameters; B is the overflow event; P(Ai) is the prior probability; and P ( B | A i ) is the likelihood function.
(1)
Prior information: Kick prior probability is the kick probability derived from the uncertain profile of formation pressure. Prior probabilities for other events, such as state events and pump on events, can be obtained from statistics. If the prior information of each parameter is missing, its influence is neglected.
(2)
Likelihood function: the similarity measure between kick characteristic data and the basic model of overflow, which is obtained by multiplying the PRKD model results with the weight vector of overflow characteristic parameters.
(3)
Posteriori probability: posteriori probability is proportional to the product of prior probability and the likelihood function, and can be obtained by normalization on this basis.

6. Case Analysis

The monitoring data that were obtained in a well kick event, including the inlet/outlet flow differential, mud pool increment, Stand Pipe Pressure (SPP), casing pressure (CP), and Rate of Penetration (ROP) data, were applied, as shown in Figure 10. The PRKD model was used to diagnose the overflow without taking the prior information of each parameter into account, and the rule of the calculated results was analyzed.
The range of real-time data automatically processed by the PRKD model can be set manually, but too much data will affect the computing speed, and too little data will not accurately reflect the overflow process. In consideration of the duration of the general overflow process, the calculation process time range was set to 10 min; thus, the PRKD model automatically collected data from the previous 10 min for real-time diagnosis.

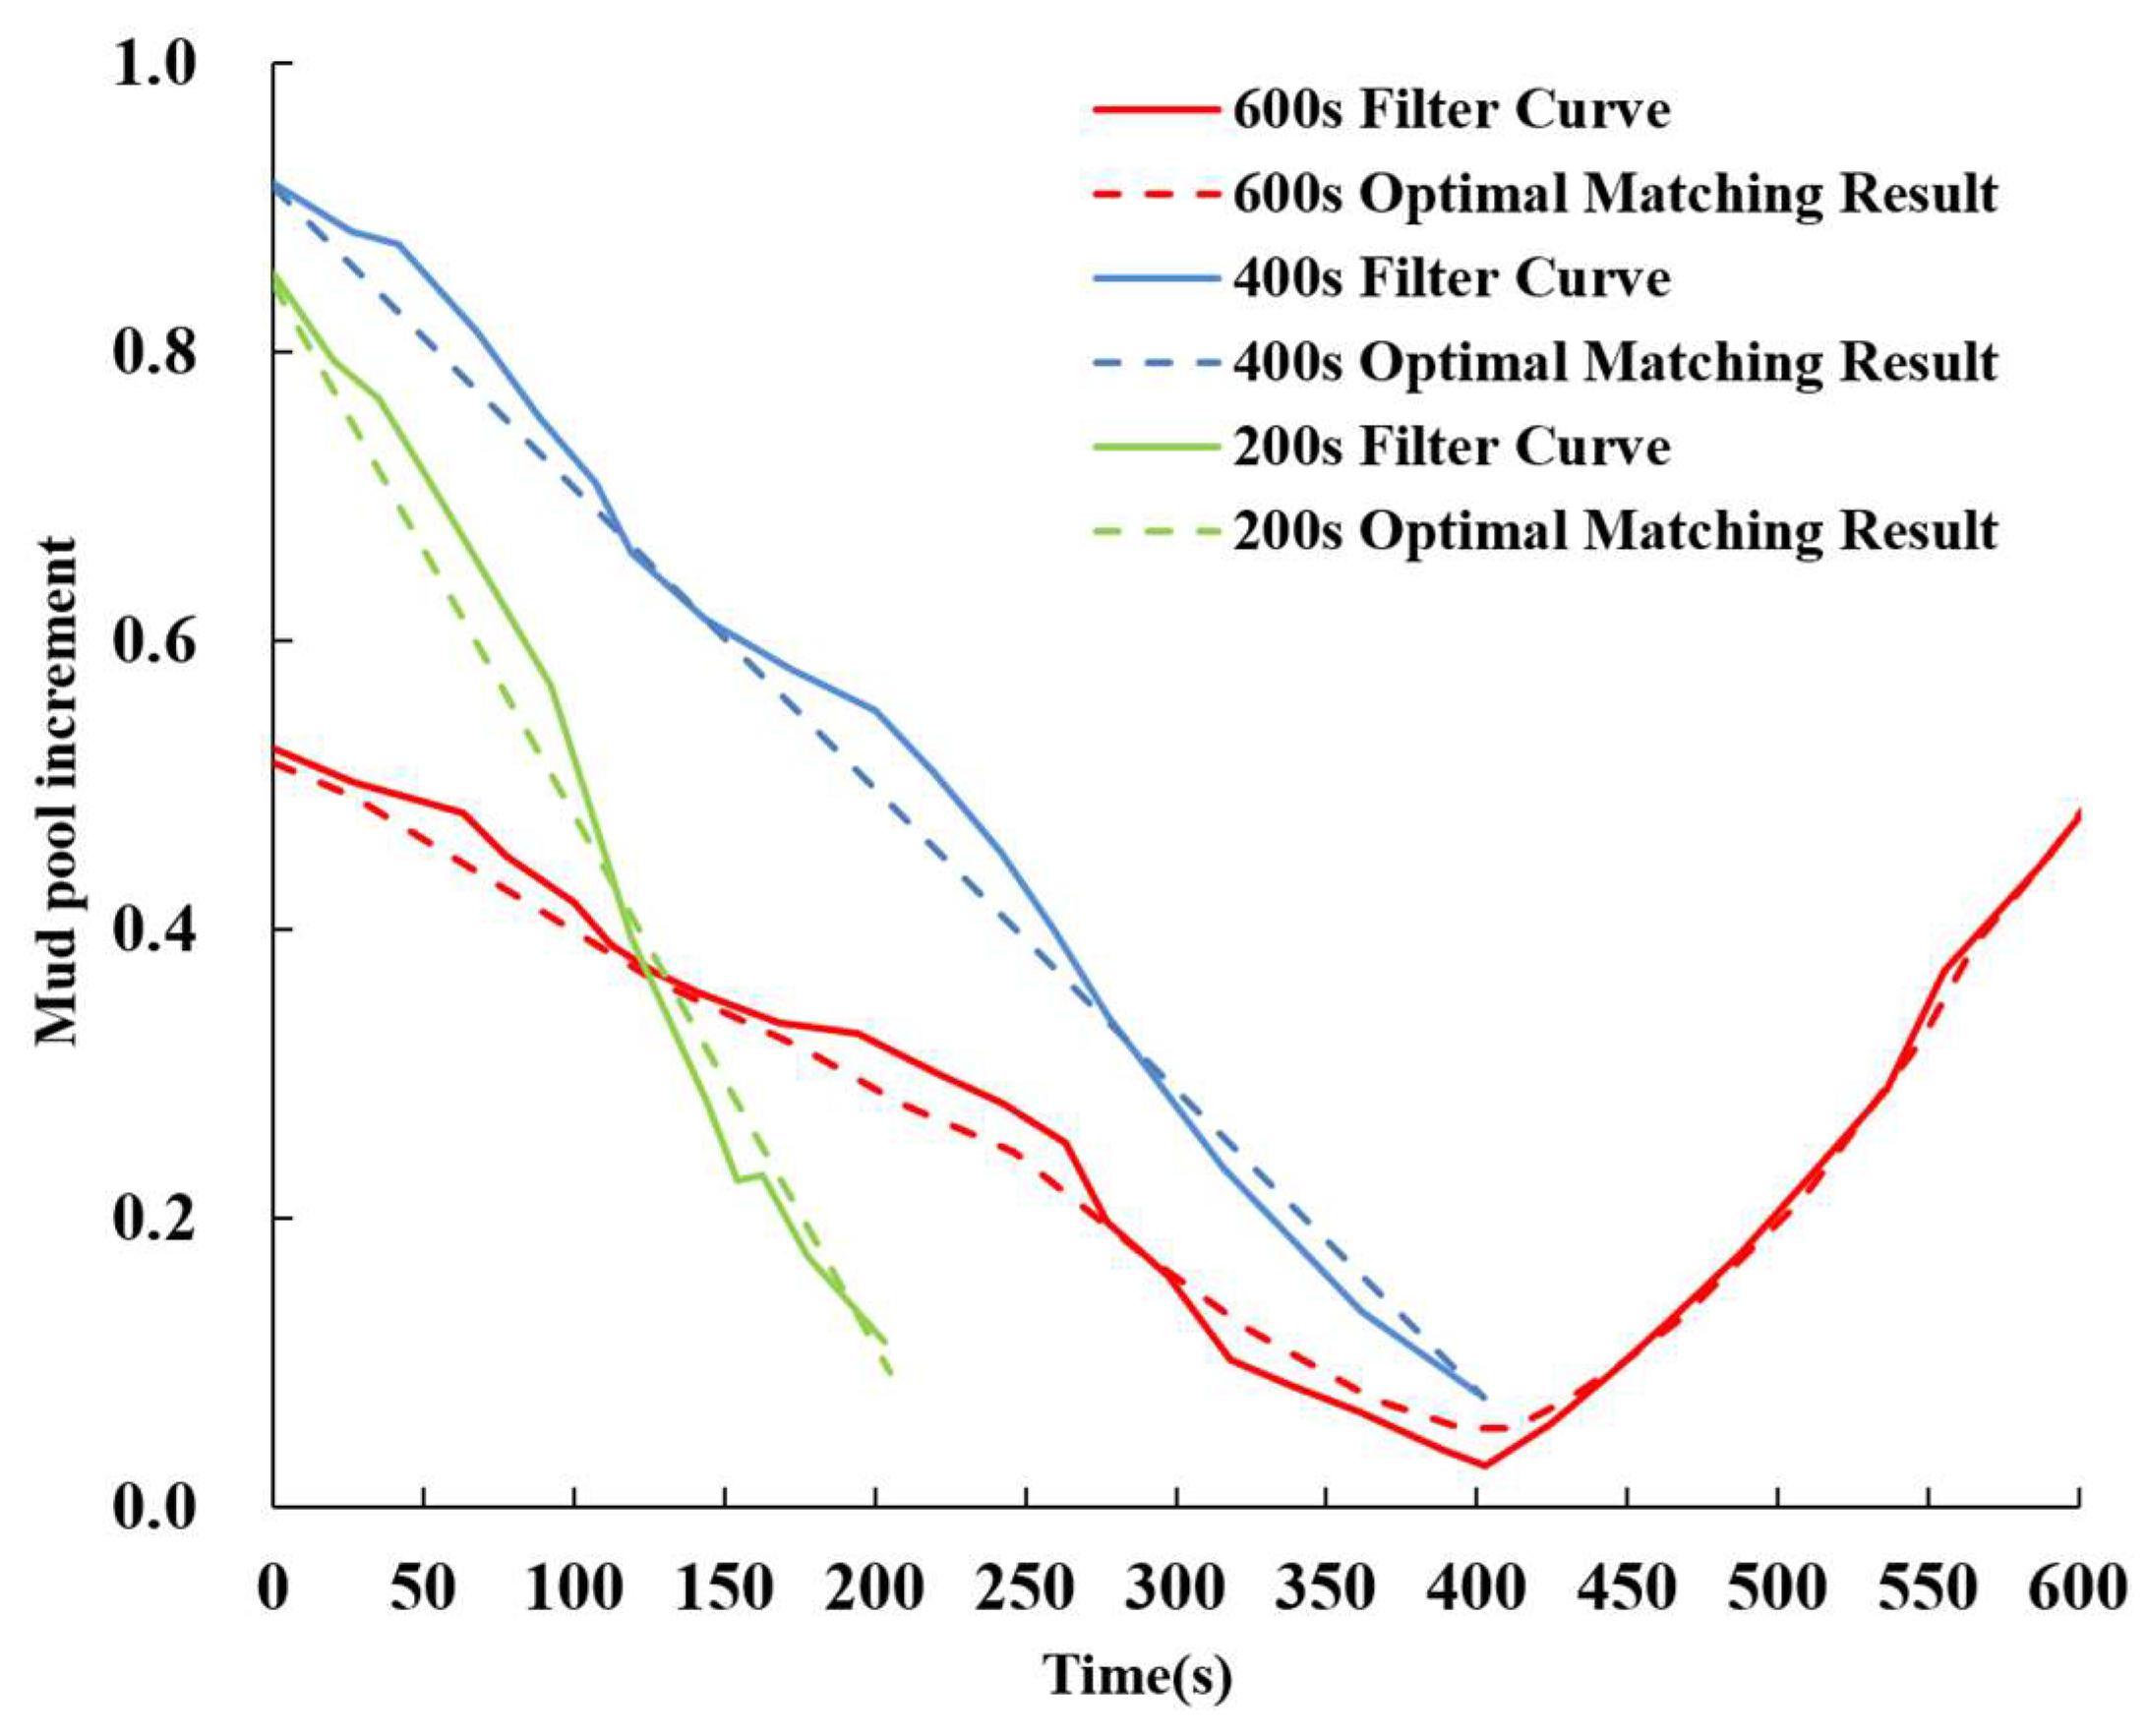
6.1. Basic Pattern Matching Results

Figure 11, Figure 12, Figure 13 and Figure 14 show the results of data mode matching for outlet flow difference, mud pool increment, SPP, and ROP at different times. As depicted in the figures, the PRKD model can automatically match the changing trend of each detection parameter based on the evolution process of overflow, and can automatically identify overflow and other working conditions with a high degree of accuracy. Using the optimal matching result of mud pool increment as an example, the matching result is the normal drilling mode at 200 s and 400 s. At 600 s, the matching result is overflow mode.
Different overflow monitoring parameters have different sensitivities to the overflow evolution process, so the pattern recognition results at different times may vary. Taking the flow difference and mud pool increment data in this example as an example, at 400 s, the matching result of flow difference data is overflow, while the matching result of mud pool increment is no overflow. Obviously, the former diagnosis is timelier, which is consistent with standard drilling practices.

6.2. Overflow Probability Analysis

Figure 15 illustrates the analysis curve for overflow probability based on kick characteristic parameters. As shown in the figure, the probability of overflow diagnosis for each parameter increases progressively with increasing time. In this case, the overflow “trend” is diagnosed by ROP, flow differential, pressure, and mud pool increment, in descending order.
Although the PRKD method can reduce the impact of data noise to the maximum extent possible, the probability result of a single type of detection data will still be disturbed by noise, making it challenging to propose a “threshold probability” applicable to all conditions for a single type of data. In general, the larger the level of data noise, the smaller the probability (lower threshold probability) of successfully judging overflow. The comprehensive probability of various available types of data can reduce the impact of data noise from a single type of detection data. Therefore, “comprehensive diagnosis probability of more than 50%” is adopted as the overflow judgment standard in this paper. This means that by integrating all available data, if the probability of an overflow is greater than the probability of all other modes, it is judged to be an overflow. If only a single type of data is available, 50% is also recommended as the “overflow threshold probability”, but should be appropriately modified according to data noise. In the figure, the time when the combined probability is equal to 50%—the time when overflow is detected—is approximately 465 s.

6.3. Comparison with Traditional Methods

(1)
Comparison of result accuracy
Inlet and outlet flow difference data is the most used type of overflow monitoring data. Figure 16 shows a comparison between the diagnostic results of the traditional threshold method for traffic difference data and the PRKD model. As shown in the figure, the traditional threshold method has low diagnostic accuracy and a high false positive rate when applied to the example data, whereas the PRKD model yields superior diagnostic results. When the threshold value is 10 L/s and 15 L/s, the false positive rate of the diagnosis results of the threshold method is very high in 0–400 s. When the threshold value is 20 L/s, the diagnostic results of the threshold method are discontinuous and have a low degree of accuracy. The figure depicts overflow at 460 s and non-overflow at 470 s. Compared with the threshold method, the PRKD model found overflow at 465 s, and in the form of probabilities, which can provide additional reference information for engineers.
(2)
The influence of data noise
Figure 17 illustrates the results of applying noise with amplitudes of 1, 2, 4, 8, and 16 L/s to the standard overflow mode data in order to investigate the impact of different levels of data noise on the PRKD model. The probability curve of kick diagnosis with the PRKD method under different noise levels is shown in Figure 18. According to the standard overflow mode data, the overflow occurred at a time of 300 s. With the increase in noise intensity, the time of overflow diagnosis was gradually extended. In this case, the PRKD model with a noise amplitude of less than 8 L/s has superior detection performance. When the noise amplitude is 16 L/s, the PRKD model detects the continuous overflow time approximately 200 s after the real overflow, which satisfies engineering practice requirements.

6.4. Bayesian Probability Analysis

The case data are as follows: The calculated pre-drilling kick probability is 84.56% when the drilling depth is 3500 m. The relative prior probabilities of state, pump on, and loss events are assumed to be 91%, 7%, and 2%, respectively, based on field experience. The available data are flow differential data, mud pool increment data, pressure data, and ROP data.
(1)
Prior probability: basic events can be divided into overflow events and non-overflow events, which can be obtained according to pre-drilling kick probability calculation and prior data:
[ P k i c k , P s t a t e , P p u m p   on , P l o s s ] p r i o r = [ 84.560 % , 14.046 % , 1.175 % , 0.219 % ]
(2)
Likelihood function: the PRKD method is used to obtain the likelihood probability of each overflow characteristic parameter:
[ P k i c k , P s t a t e , P p u m p   on , P l o s s ] l i k e h o o d d e l t f l o w = [ 62.506 % , 25.414 % , 12.080 % , 0.000 % ]
[ P k i c k , P s t a t e , P p u m p   on , P l o s s ] l i k e h o o d p i t   gain = [ 97.8 % , 2.200 % , 0.000 % , 0.000 % ]
[ P k i c k , P s t a t e , P p u m p   on , P l o s s ] l i k e h o o d S P P = [ 78.900 % , 17.750 % , 3.350 % , 0.000 % ]
[ P k i c k , P s t a t e , P p u m p   on , P l o s s ] l i k e h o o d A D P = [ 74.300 % , 21.290 % , 4.410 % , 0.000 % ]
[ P k i c k , P s t a t e , P p u m p   on , P l o s s ] l i k e h o o d R O P = [ 82.400 % , 4.900 % , 12.700 % , 0.000 % ]
The normalized weight vector of flow difference data, mud pool increment data, pressure data, and ROP data is obtained by using the method of middle hierarchical analysis:
w = [ 0.5104 , 0.2574 , 0.1276 , 0.0645 , 0.0401 ]
By synthesizing all overflow parameters, the overflow likelihood function vector is:
[ P k i c k , P s t a t e , P p u m p   on , P l o s s ] l i k e h o o d = i = 1 5 w i [ P k i c k , P s t a t e , P p u m p   on , P l o s s ] l i k e h o o d i = [ 0.7538 , 0.1715 , 0.0747 , 0.0000 ]
(3)
Posterior distribution:
[ P k i c k , P s t a t e , P p u m p   on , P l o s s ] p o s t e r i o r = [ P k i c k , P s t a t e , P p u m p   on , P l o s s ] p r i o r × [ P k i c k , P s t a t e , P p u m p   on , P l o s s ] l i k e h o o d = [ 0.9580 , 0.0408 , 0.0012 , 0.0000 ]
Therefore, the overflow probability at this location is 95.8% when the pre-drilling kick probability information and the PRKD prediction results of each characteristic parameter are combined.

7. Conclusions

(1)
A single-parameter gas intrusion monitoring method for offshore drilling called PRKD based on pattern recognition is established by combining multiphase flow calculations, data filtering theory, pattern recognition theory, and the Bayesian framework. By integrating sophisticated computational techniques with pattern recognition algorithms, PRKD enhances the reliability and precision of kick detection. This enables the implementation of proactive measures to mitigate potential risks, protecting the environment and human lives while optimizing drilling operations.
(2)
Although the PRKD method can minimize the impact of data noise to the maximum extent possible, the probability result obtained from a single type of detection data will still be disturbed by noise. Combining the comprehensive probability of various available types of data and adopting “comprehensive diagnosis probability over 50%” as the overflow judgment standard, can meet the requirements of engineering practice.
(3)
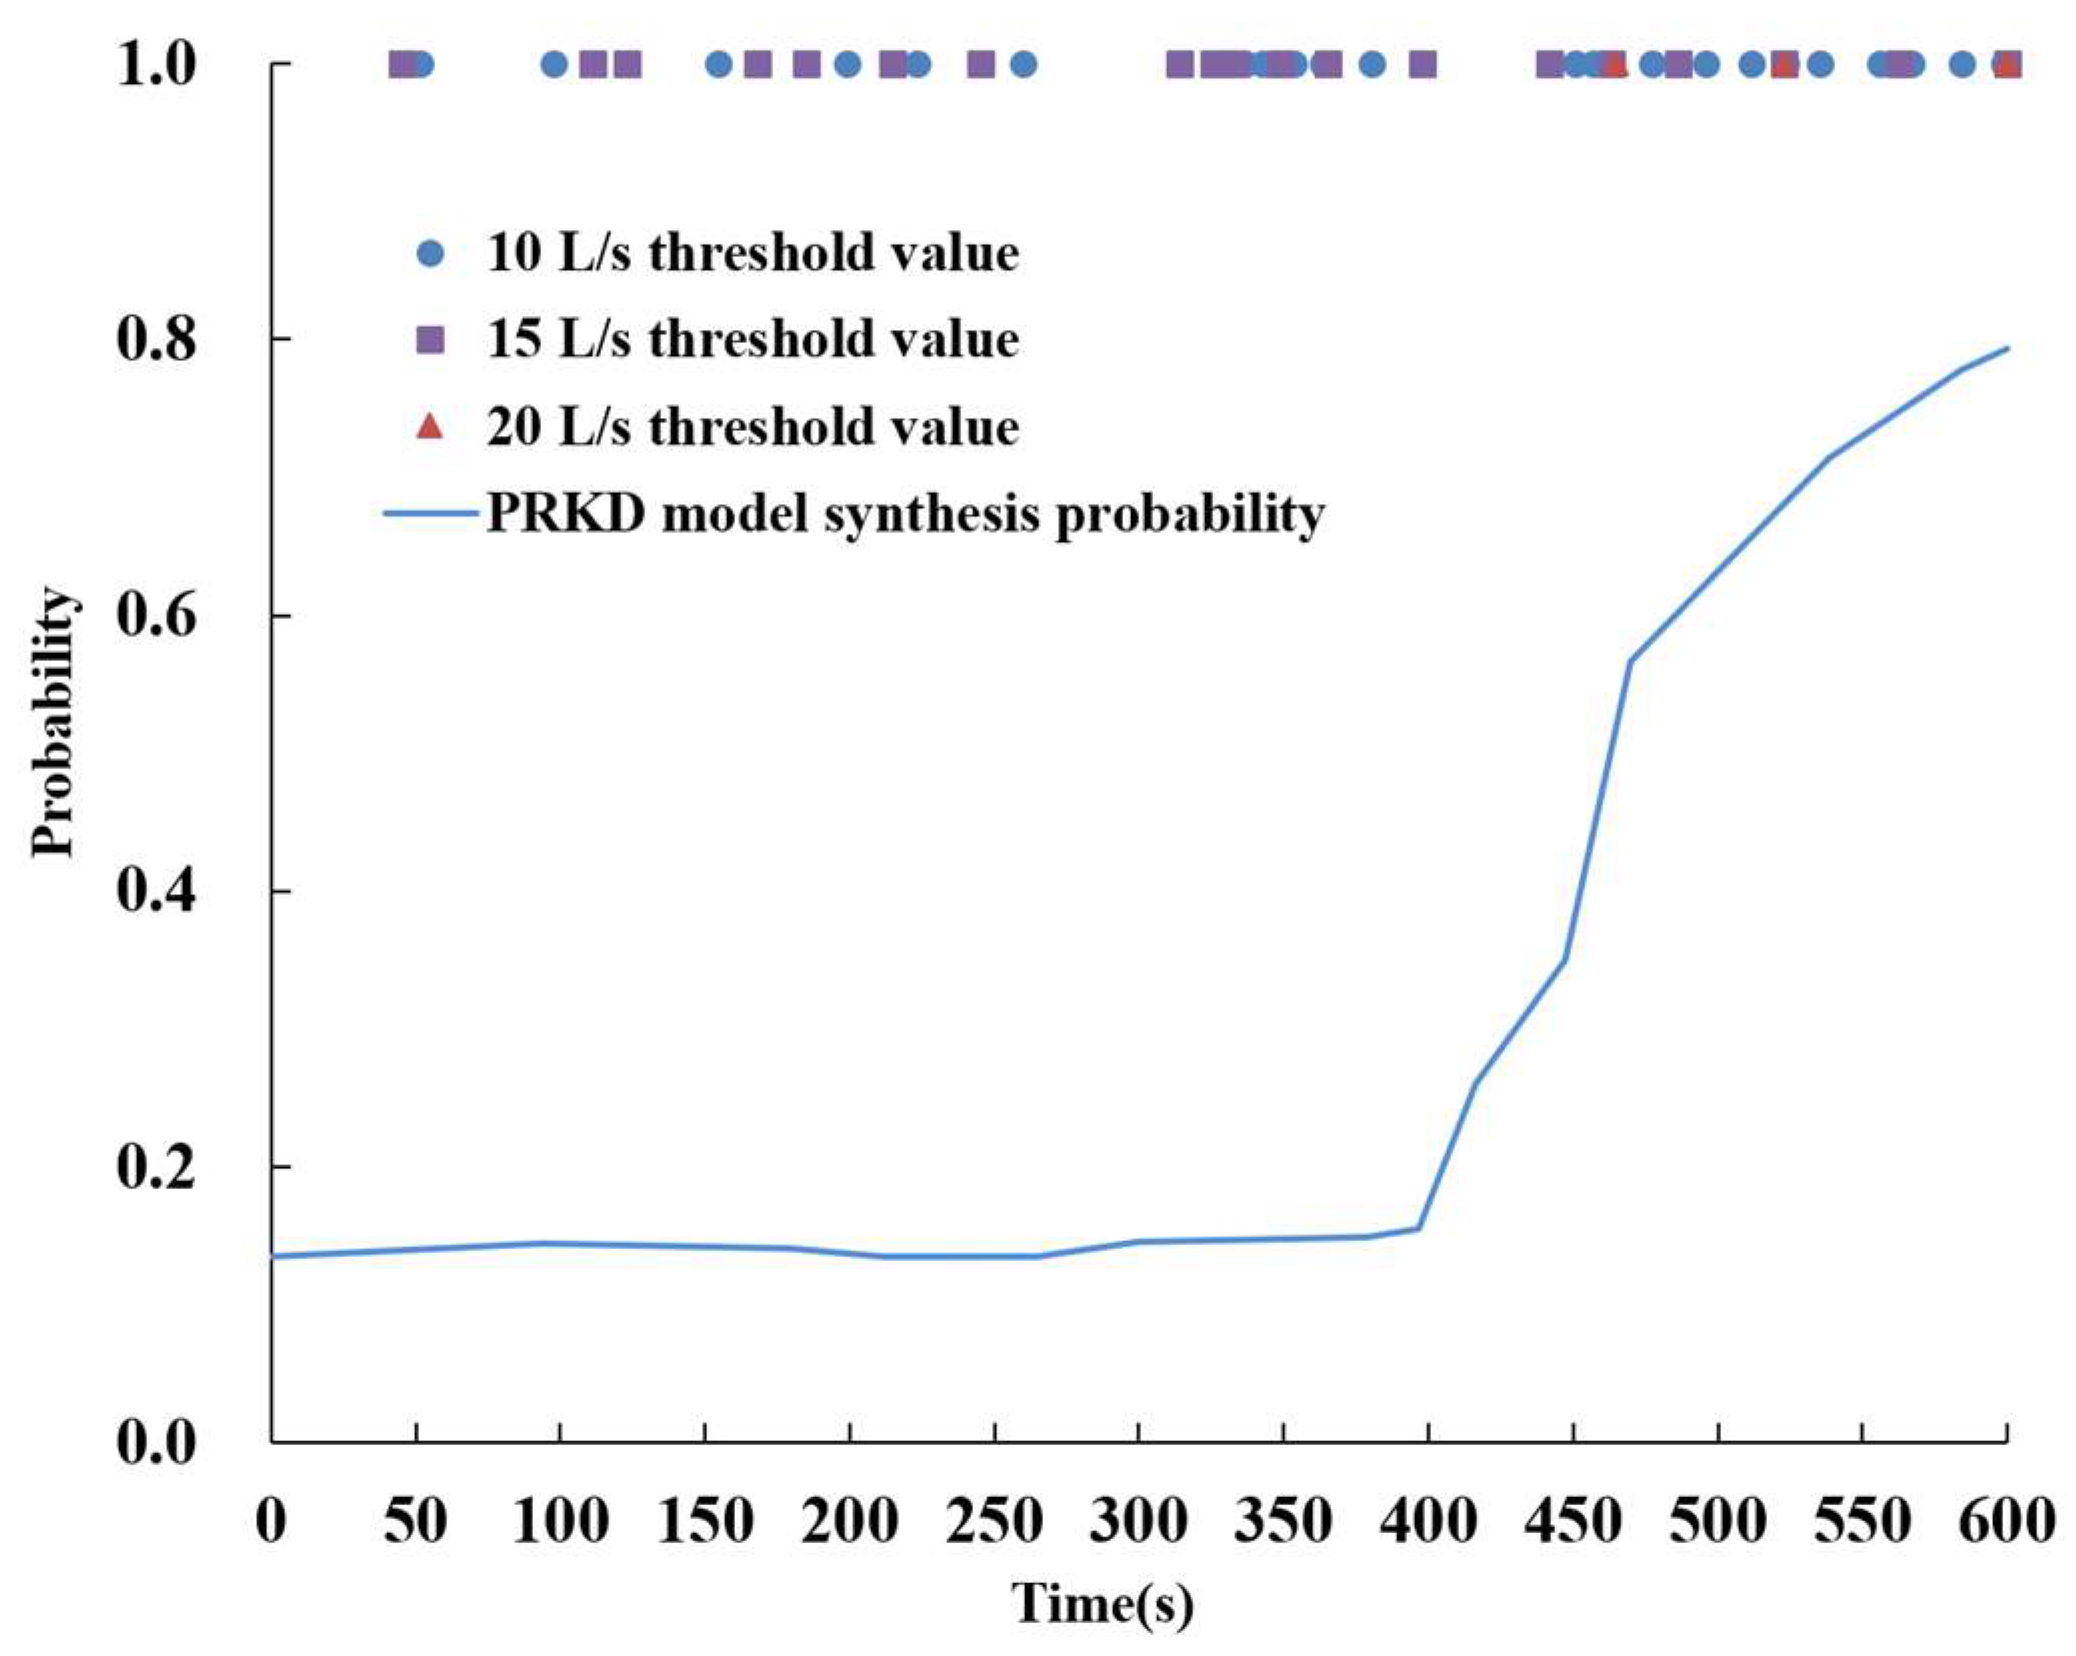
The traditional threshold method has low accuracy and a high false positive rate in diagnosing kicks, while the PRKD model shows better diagnostic results in the chosen case study. When the threshold value is set at 10 and 15 L/s, the threshold method has a high false positive rate in the range of 0 to 400 s. When the threshold value is set at 20 L/s, the threshold method lacks continuity and has low accuracy. For example, at 460 s in the graph, it diagnoses an overflow, while at 470 s it diagnoses a non-overflow. Compared to the threshold method, the PRKD model detects the overflow at 465 s and provides the output in the form of probabilities, which can provide engineers with more reference information.
(4)
In the case analysis of standard overflow pattern data, the occurrence of overflow is at 300 s. As the intensity of noise increases, the time at which overflow is diagnosed gradually extends. In this case, the PRKD model performs well when the noise amplitude is below 8 L/s. Under severe conditions, with a noise amplitude of 16 L/s, the PRKD model detects continuous overflow approximately 200 s after the actual overflow occurs (at around 500 s), which meets the requirements of engineering practice.
(5)
Based on the case analysis, the PRKD method combines the probabilistic information of pre-drilling kicks and various characteristic parameters to predict a 95.8% probability of overflow occurrence at the specified location, which satisfies the requirements in the field. The gas invasion monitoring method proposed in this study delivers accurate diagnostic results with a low false positive rate, thereby providing valuable guidance for gas invasion monitoring in drilling operations.
(6)
Through case studies, it has been observed that the proposed kick monitoring method in this paper can accurately and rapidly detect the occurrence of well kicks. Additionally, this method exhibits good noise resistance and outperforms traditional threshold-based methods in terms of lower false positive rates and higher monitoring accuracy. Furthermore, this method is not limited to kick monitoring alone but can also be applied for real-time monitoring of other drilling conditions such as wellbore leakage. However, due to the difficulty in obtaining a large amount of field data, the PRKD kick monitoring model established in this study is still not perfect. Future work will focus on further improving the PRKD kick monitoring model.

Author Contributions

Writing—original draft preparation, Y.X., J.Y., Z.H. and D.X.; Writing—review and editing, Y.X., J.Y., Z.H., D.X., L.L. and C.F.; Supervision, Y.X., J.Y. and Z.H. All authors have read and agreed to the published version of the manuscript.

Funding

Research and Development Program of China (No. 2022YFC2806401).

Data Availability Statement

The authors confirm that the data supporting the findings of this study are available within the article.

Acknowledgments

The authors would like to acknowledge the support of the National Key Research and Development Program of China (Grant No. 2022YFC2806401).

Conflicts of Interest

The authors declare that they have no conflict of interest.

References

  1. Liang, H.; Zou, J.; Liang, W. An early intelligent diagnosis model for drilling overflow based on GA–BP algorithm. Clust. Comput. 2019, 22, 10649–10668. [Google Scholar] [CrossRef]
  2. Yin, Q.; Yang, J.; Tyagi, M.; Zhou, X.; Hou, X.; Wang, N.; Tong, G.; Cao, B. Machine learning for deepwater drilling: Gas-kick-alarm Classification using pi-lot-scale rig data with combined surface-riser-downhole monitoring. SPE J. 2021, 26, 1773–1799. [Google Scholar] [CrossRef]
  3. Jin, Y.; Chao, F.; Shujie, L.; Weiguo, Z.; Renjun, X.; Yi, W. Key technological innovation and practice of well construction in ultra-deepwater shallow formations. Acta Pet. Sin. 2022, 43, 1500–1508. [Google Scholar]
  4. Zhang, Z.; Sun, B.; Wang, Z.; Pan, S.; Lou, W.; Sun, D. Intelligent well killing control method driven by coupling multiphase flow simulation and real-time data. J. Pet. Sci. Eng. 2022, 213, 110337. [Google Scholar] [CrossRef]
  5. Yang, J.; Wu, S.; Tong, G.; Wang, H.; Guo, Y.; Zhang, W.; Zhao, S.; Song, Y.; Yin, Q. Acoustic prediction and risk evaluation of shallow gas in deep-water areas. J. Ocean. Univ. China 2022, 21, 1147–1153. [Google Scholar] [CrossRef]
  6. Jiang, H.; Liu, G.; Li, J.; Zhang, T.; Wang, C.; Ren, K. Numerical simulation of a new early gas kick detection method using UKF estimation and GLRT. J. Pet. Sci. Eng. 2019, 173, 415–425. [Google Scholar] [CrossRef]
  7. Yin, Q.; Yang, J.; Borujeni, A.T.; Shi, S.; Sun, T.; Yang, Y.; Geng, Y.; Xia, Q.; Wu, X.; Zhao, X. Intelligent Early Kick Detection in Ultra-Deepwater High-Temperature High-Pressure (HPHT) Wells Based on Big Data Technology. In Proceedings of the 29th International Ocean and Polar Engineering Conference, Honolulu, HI, USA, 16–21 June 2019; OnePetro: Richardson, TX, USA, 2019. [Google Scholar]
  8. Hu, Z.; Yang, J.; Li, W.; Li, S.; Feng, P.; Xin, Y. Research and development of compressible foam for pressure management in casing annulus of deepwater wells. J. Pet. Sci. Eng. 2018, 166, 546–560. [Google Scholar] [CrossRef]
  9. Maus, L.D.; Tannich, J.D.; Ilfrey, W.T. Instrumentation requirements for kick detection in deep water. J. Pet. Technol. 1979, 31, 1029–1034. [Google Scholar] [CrossRef]
  10. Speers, J.M.; Gehrig, G.F. Delta flow: An accurate, reliable system for detecting kicks and loss of circulation during drilling. Spe Drill. Eng. 1987, 2, 359–363. [Google Scholar] [CrossRef]
  11. Anfinsen, B.T.; Rolv, R.; Rogaland, R. Sensitivity of earlykick detection parameters in fullscale gas kick experiments with oil- and water-based drilling muds. In Proceedings of the IADC/SPE Drilling Conference, New Orleans, LA, USA, 18–21 February 1992. SPE23934. [Google Scholar]
  12. Fraser, D.; Lindley, R.; Moore, D.; Vander Staak, M. Early kick detection methods and technologies. In Proceedings of the SPE Annual Technical Conference and Exhibition, Amsterdam, The Netherlands, 27–29 October 2014. SPE170756. [Google Scholar]
  13. Nayeem, A.A.; Venkatesan, R.; Khan, F. Monitoring of down-hole parameters for early kick detection. J. Loss Prev. Process Ind. 2016, 40, 43–54. [Google Scholar] [CrossRef]
  14. Yin, Q.; Yang, J.; Tyagi, M.; Zhou, X.; Wang, N.; Tong, G.; Xie, R.; Liu, H.; Cao, B. Downhole quantitative evaluation of gas kick during deepwater drilling with deep learning using pi-lot-scale rig data. J. Pet. Sci. Eng. 2022, 208, 109136. [Google Scholar] [CrossRef]
  15. Yang, H.; Li, J.; Liu, G.; Wang, C.; Jiang, H.; Luo, K.; Wang, B. A new method for early gas kick detection based on the consistencies and differences of bottomhole pressures at two measured points. J. Pet. Sci. Eng. 2019, 176, 1095–1105. [Google Scholar] [CrossRef]
  16. Hu, Z.; Yang, J.; Wang, L.; Hou, X.; Zhang, Z.; Jiang, M. Intelligent identification and time-efficiency analysis of drilling operation conditions. Oil Drill. Prod. Technol. 2022, 44, 241–246. [Google Scholar]
  17. Liao, M.Y. Drilling state monitoring and fault diagnosis based on multi-parameter fusion by neural network. J. China Univ. Pet. 2007, 31, 149–152. [Google Scholar]
  18. Nybo, R.; Bjorkevoll, K.S.; Rommetveit, R. Spotting a false alarm. integrating experience and real-time analysis with artificial intelligence. In Proceedings of the SPE Intelligent Energy International Conference and Exhibition, Amsterdam, The Netherlands, 25–27 February 2008. SPE112212. [Google Scholar]
  19. David, H.; Stuart, J.; Ben, J. Early kick detection for deepwater drilling: New probabilistic methods applied in the field. In Proceedings of the SPE Annual Technical Conference and Exhibition, New Orleans, LA, USA, 30 September–3 October 2001. SPE71369. [Google Scholar]
  20. Pournazari, P.; Ashok, P.; van Oort, E.; Unrau, S.; Lai, S. Enhanced kick detection with low-cost rig sensors through automated pattern recognition and real-time sensor calibration. In Proceedings of the SPE Middle East Intelligent Oil and Gas Conference and Exhibition, Abu Dhabi, United Arab Emirates, 15–16 September 2015. SPE176790. [Google Scholar]
  21. Al-Obaidi, A.R.; Mohammed, A.A. Numerical Investigations of Transient Flow Characteristic in Axial Flow Pump and Pressure Fluctuation Analysis Based on the CFD Technique. J. Eng. Sci. Technol. Rev. 2019, 12, 70–79. [Google Scholar] [CrossRef]
  22. Muojeke, S.; Venkatesan, R.; Khan, F. Supervised data-driven approach to early kick detection during drilling operation. J. Pet. Sci. Eng. 2020, 192, 107324. [Google Scholar] [CrossRef]
  23. Hargreaves, D.; Jardine, S.; Jeffryes, B. Early kick detection for deepwater drilling: New probabilistic methods applied in the field. In Proceedings of the SPE Annual Technical Conference and Exhibition, Denver, CO, USA, 30 October–2 November 2011; OnePetro: Richardson, TX, USA, 2001. [Google Scholar]
  24. Reitsma, D. A simplified and highly effective method to identify influx and losses during Managed Pressure Drilling without the use of a Coriolis flow meter. In Proceedings of the SPE/IADC Managed Pressure Drilling and Underbalanced Operations Conference and Exhibition, Kuala Lumpur, Malaysia, 24–25 February 2010; OnePetro: Richardson, TX, USA, 2010. [Google Scholar]
  25. Geekiyanage, S.C.; Ambrus, A.; Sui, D. Feature selection for kick detection with machine learning using laboratory data. In Proceedings of the International Conference on Offshore Mechanics and Arctic Engineering, Glasgow, Scotland, UK, 9–14 June 2019; American Society of Mechanical Engineers: New York, NY, USA, 2019; Volume 58875. [Google Scholar]
  26. Bang, J.; Mjaaland, S.; Solstad, A.; Hendriks, P.; Jensen, L.K. Acoustic gas kick detection with wellhead sonar. In Proceedings of the SPE Annual Technical Conference and Exhibition, New Orleans, LA, USA, 25–28 September 1994; OnePetro: Richardson, TX, USA, 1994. [Google Scholar]
Figure 1. Pattern of flow rate differential in overflow and other events.
Processes 11 01997 g001
Figure 2. Pattern of incremental change of the mud pit during overflow and other events.
Processes 11 01997 g002
Figure 3. Pattern of CP and SPP changes in overflow and other events.
Processes 11 01997 g003
Figure 4. Pattern of ROP changes during overflow and other events.
Processes 11 01997 g004aProcesses 11 01997 g004b
Figure 5. Flow wave data before data processing.
Processes 11 01997 g005
Figure 6. Flow wave data after data processing.
Processes 11 01997 g006
Figure 7. Overflow flow difference curve.
Processes 11 01997 g007
Figure 8. Schematic diagram of the pattern matching method.
Processes 11 01997 g008
Figure 9. Matching result of the optimal solution of flow wave data.
Processes 11 01997 g009
Figure 10. Change in kick characteristic parameters before and after 0–600 s overflow.
Processes 11 01997 g010
Figure 11. Flow difference optimal matching result.
Processes 11 01997 g011
Figure 12. Optimal matching results of mud pool increment.
Processes 11 01997 g012
Figure 13. Optimal matching results of SPP and CP.
Processes 11 01997 g013
Figure 14. Optimal matching results of ROP.
Processes 11 01997 g014
Figure 15. Overflow probability analysis curve based on kick characteristic parameters.
Processes 11 01997 g015
Figure 16. Comparison between the PRKD model and the traditional threshold method for overflow diagnosis.
Processes 11 01997 g016
Figure 17. Flow difference curves under different levels of noise.
Processes 11 01997 g017
Figure 18. Kick probability distribution curves of the PRKD method under different noise levels.
Processes 11 01997 g018
Disclaimer/Publisher’s Note: The statements, opinions and data contained in all publications are solely those of the individual author(s) and contributor(s) and not of MDPI and/or the editor(s). MDPI and/or the editor(s) disclaim responsibility for any injury to people or property resulting from any ideas, methods, instructions or products referred to in the content.

