Article

Determination of Soil Agricultural Aptitude for Sugar Cane Production in Vertisols with Machine Learning

by
Ofelia Landeta-Escamilla
1,*,
Alejandro Alvarado-Lassman
1,*,
Oscar Osvaldo Sandoval-González
1,
José de Jesús Agustín Flores-Cuautle
2,
Erik Samuel Rosas-Mendoza
2,
Albino Martínez-Sibaja
1,
Norma Alejandra Vallejo Cantú
1 and
Juan Manuel Méndez Contreras
1
1
Tecnológico Nacional de México, Instituto Tecnológico de Orizaba, Av. Oriente 9, 852, Col. Emiliano Zapata, Orizaba 94320, Mexico
2
Programa de Investigadoras e Investigadores por México del CONACYT, Av. Insurgentes Sur 1582, Ciudad de México 03940, Mexico
*
Authors to whom correspondence should be addressed.
Processes 2023, 11(7), 1985; https://doi.org/10.3390/pr11071985
Submission received: 18 May 2023 / Revised: 20 June 2023 / Accepted: 27 June 2023 / Published: 30 June 2023

Abstract

:
Sugarcane is one of the main agro-industrial products consumed worldwide, and, therefore, the use of suitable soils is a key factor to maximize its production. As a result, the need to evaluate soil matrices, including many physical, chemical, and biological parameters, to determine the soil’s aptitude for growing food crops increases. Machine learning techniques were used to perform an in-depth analysis of the physicochemical indicators of vertisol-type soils used in sugarcane production. The importance of the relationship between each of the indicators was studied. Furthermore, and the main objective of the present work, was the determination of the minimum number of the most important physicochemical indicators necessary to evaluate the agricultural suitability of the soils, with a view to reducing the number of analyses in terms of physicochemical indicators required for the evaluation. The results obtained relating to the estimation of agricultural capability using different numbers of parameters showed accuracy results of up to 91% when implementing three parameters: Potassium (K), Calcium (Ca) and Cation Exchange Capacity (CEC). The reported results, relating to the estimation of the physicochemical parameters, indicated that it was possible to estimate eleven physicochemical parameters with an average accuracy of 73% using only the data of K, Ca and CEC as input parameters in the Machine Learning models. Knowledge of these three parameters enables determination of the values of soil potential in regard to Hydrogen (pH), organic matter (OM), Phosphorus (P), Magnesium (Mg), Sulfur (S), Boron (B), Copper (Cu), Manganese (Mn), and Zinc (Zn), the Calcium/Magnesium ratio (Ca/Mg), and also the texture of the soil.

1. Introduction

To achieve efficient and safe methods of food production it is important to improve agricultural techniques and adapt farming practices to attend to the needs of the soil and its appropriate management. There are multiple factors to achieve good crop management and to optimize it, which require continuous evaluation for appropriate decisions to be made. Additionally, predicting suitable areas to grow food in faces the issue of uncertainty in the quality of the soil and the corresponding practices required to improve the health of the soil to ensure it can fulfill the demands for global food necessities. World sugarcane production in 2018 was 2,042,654 thousand tons, of which 56,842 thousand tons were from Mexico (the seventh highest sugarcane producing country) [1]. The state of Veracruz in Mexico contributes 38% of the sugarcane production [2].
The agricultural aptitude of soil to obtain above 80 t/ha of sugarcane requires, among others, the following: available Nitrogen above 300 kg/ha, Phosphorus (P) above 40 ppm, Potassium (K) above 468 ppm, and potential of Hydrogen (pH) between 6.6 and 7.3 amo [3,4]. These parameters have to be maintained and monitored because the properties of soil vary greatly due to agricultural cropping patterns [5]
The challenge is still the optimization of the parameters that determine soil capability to produce food using a minimum of physicochemical parameters. A strategy that has proved to improve decision making in agriculture is the use of Artificial Intelligence (AI), which analyzes big volumes of data [6] to solve nonlinear problems where there may be no mathematical representations and to obtain models based on experience in cases of supervised learning. AI has been employed in regard to many fruit, vegetable and cereal crops, such as potato, lemon, and wheat [7]. In regard to maize, AI exhibited good predictive capacity, obtaining the lowest root mean square error (RMSE) and the highest determination coefficient ( R 2 ) [8]. In general, all of the results obtained provided accurate descriptive data [6]. The evaluated areas have included fertilizer efficiency, prediction of rainfall, crop production, soil preparation, crop pattern, and precision agriculture [9].
In this AI field, several models, such as the Decision Tree model (DT), have been implemented to evaluate the population dynamics of soil organisms and how these dynamics are affected by changes in different biological and physicochemical environmental attributes and agricultural practices. AI has also been used to relate morphological, physical and chemical soil properties to soil structure by creating a framework for Soil Quality assessment, resulting in an adequate index that reproduces the effect of the interactions between physicochemical variables, the arrangement of soil fragments and biological activity in the soil [10].
Principal Component Analysis (PCA) was used to evaluate soil variables and concluded that Magnesium (Mg), Calcium (Ca), potential of Hydrogen (pH), Silt, Clay, and Potassium (K) are the main variables determining Soil Quality [11]. These methods appear to be more sensitive to disturbances for management practices [12]. Other research, that included 18 parameters and different soils, in terms of crop, residue and fertilization, showed that the created indicator was most affected by the Nitrogen–Phosphorus–Potassium (NPK) rate, and that other parameters failed to correlate yield significantly. Additionally, the PCA synthesized the data [13].
Other research proposed two Soil Quality Index (SQI) approaches, applying PCA and Expert Opinion (EO),by which 24 physical and chemical parameters were evaluated in the surface and the control sections (0–100 cm) in soil. The results indicated five principal components for the first methodology and six indicators for the second, the latter performing better in both the surface and control section evaluations [14].
Regression methods, such as Relative Risk (RR), which is an alternative approach to partial least squares regression (SIMPLS), Principal Component Regression (PCR), and Partial Least Squares Regression (PLSR), were applied to synthesize ten physical and chemical variables in soils, and it was concluded that the PLSR method was the most robust [15,16]. Furthermore, Deep Autoencoders (DAs) have been applied to satellite images to determine change detection in burnt areas, in mapping forests [17] and in landslide susceptibility prediction [18]. Excellent classification results in three of the projects [17,19] indicated that DL is an adequate tool in evaluating complex matrices of variables. In Table 1 a comparative analysis of state-of-the-art research, separated into configuration, target and main contribution, is presented.
Therefore, the present research aimed to ascertain, by comparing algorithms, the technique requiring the least parameters to achieve accurate results in determining the capability of soils. Additionally, the results provide correlations among physicochemical variables which could help farmers determine soil amendments faster to increase crop yields.

2. Materials and Methods

2.1. Study Case

Veracruz is the state of Mexico that has the most sugar mills (20) in the country. The experimental sites included those having the most sugar mills in a region called the High Mountains in Veracruz, Mexico. Till June 2021 this region had 326,706 ha of sugarcane and a total production of 19,134,311 tons, earning $45,984.21 USD per ton [2]. The area has 57 municipalities with an approximate area of 6053 km 2 . The soils sampled covered 0.5% of the total surface planted with sugar cane. The soil is classified as Vertisol (Vp) according to the World Soil Resources Report [1]. Figure 1 shows the selected soil and other classifications of soils presented in the studied area.
Specifically, the obtained soil samples were collected at the municipalities of Atoyac (18°55 00.0 N 96°46 00.0 W), Camaron de Tejeda (19°01 00.0 N 96°37 00.0 W), Carrillo Puerto (18°47 00.0 N 96°34 00.0 ), Coetzala (18°47 00.0 N 96°55 00.0 W), Ixtaczoquitlan (18°51 04.6 N 97°03 04.4 W), Cordoba (18°51 018.300 N 96°57’002.200 W), and El Naranjal (18°47 038.100 N 96°55 030.5 W), which are areas that traditionally cultivate sugarcane and include fertilizers, pesticides, herbicides and fuel in the processes of cultivation and harvesting [33].

2.2. Soil Sampling and Physicochemical Determinations

The sampling procedure implemented to obtain the soil samples was the one described in the standard SESDPROC-300-R3 (Environmental Protection Agency, 2014) and three samples were obtained from each site. One from 0 to 10 cm, another from 10 to 20 cm and a third from 20 to 30 cm. All of the samples were subjected to laboratory analysis to measure the following 27 physicochemical parameters: texture (%sand, %silt, and %clay); physical parameters: pH, electric conductivity, apparent density, field capacity 1/3 bar, and permanent wilting point 15 Bar; OM, CEC, Sodium (Na), CS for Na, and Hydrogen (H); macronutrients: phosphorus (P), Potassium (K), Calcium (Ca), Nitrogen–Nitrate ( N 2 NO 3 ), K/Mg ratio, Ca/Mg ratio, Magnesium (Mg), Sulfur (S), CS for K, CS for Ca and CS for Mg; micronutrients: Boron (B), Copper (Cu), Iron (Fe), Manganese (Mn), and Zinc (Zn). The textural analysis was performed using the Bouyoucos hydrometer, pH was measured by the 1:1 method ASTM D4972-13, electrical conductivity (EC) was measured by the conductimetry method, and apparent density was measured by the method proposed by the United States Department of Agriculture (USDA). The Walkley and Black method [34] (FAO, 2019) was conducted with the aim of determining the amount of OM expressed regarding total organic carbon. Atomic absorption spectrometry was used to determine the global composition of Na, K, Mg, and Ca in the soils. The composites were digested in hot HCl and deionized distilled water solution (2:1 ratio) and, afterwards, the solution was filtered and submitted for analysis. Exchangeable Cations, Nitrogen, Phosphorous, and S Exchangeable cations were measured using silver thiourea, following the method described by Pleyser and Juo [35]. Total nitrogen was measured by the Kjheldhal method, phosphorous was measured by colorimetry, and S was measured by turbidimetry.

2.3. Soil Aptitude Evaluation

The results obtained from the parameters measured by the laboratory were separated into 4 different groups, based on data from the literature of the desirable variables in the soil for higher production of sugarcane (16 variables were by this system) [4,36,37]. The four groups were the following: (1) unsuitable, (2) low, (3) media, and (4) high. Afterwards, the results were summarized in a final evaluation of three groups (good, medium and bad) using the following criteria: (1) Samples with 13% or less unsuitable values and eight parameters or more (out of 16) scoring high were considered to have good quality soils; (2) Samples with 62.5% of parameters in either medium, high or both were included in the medium group; (3) Samples having seven parameters in either unsuitable or low, or in the sum of both, were classified in the bad quality group. It must be mentioned that no samples were included in two groups with these rules.

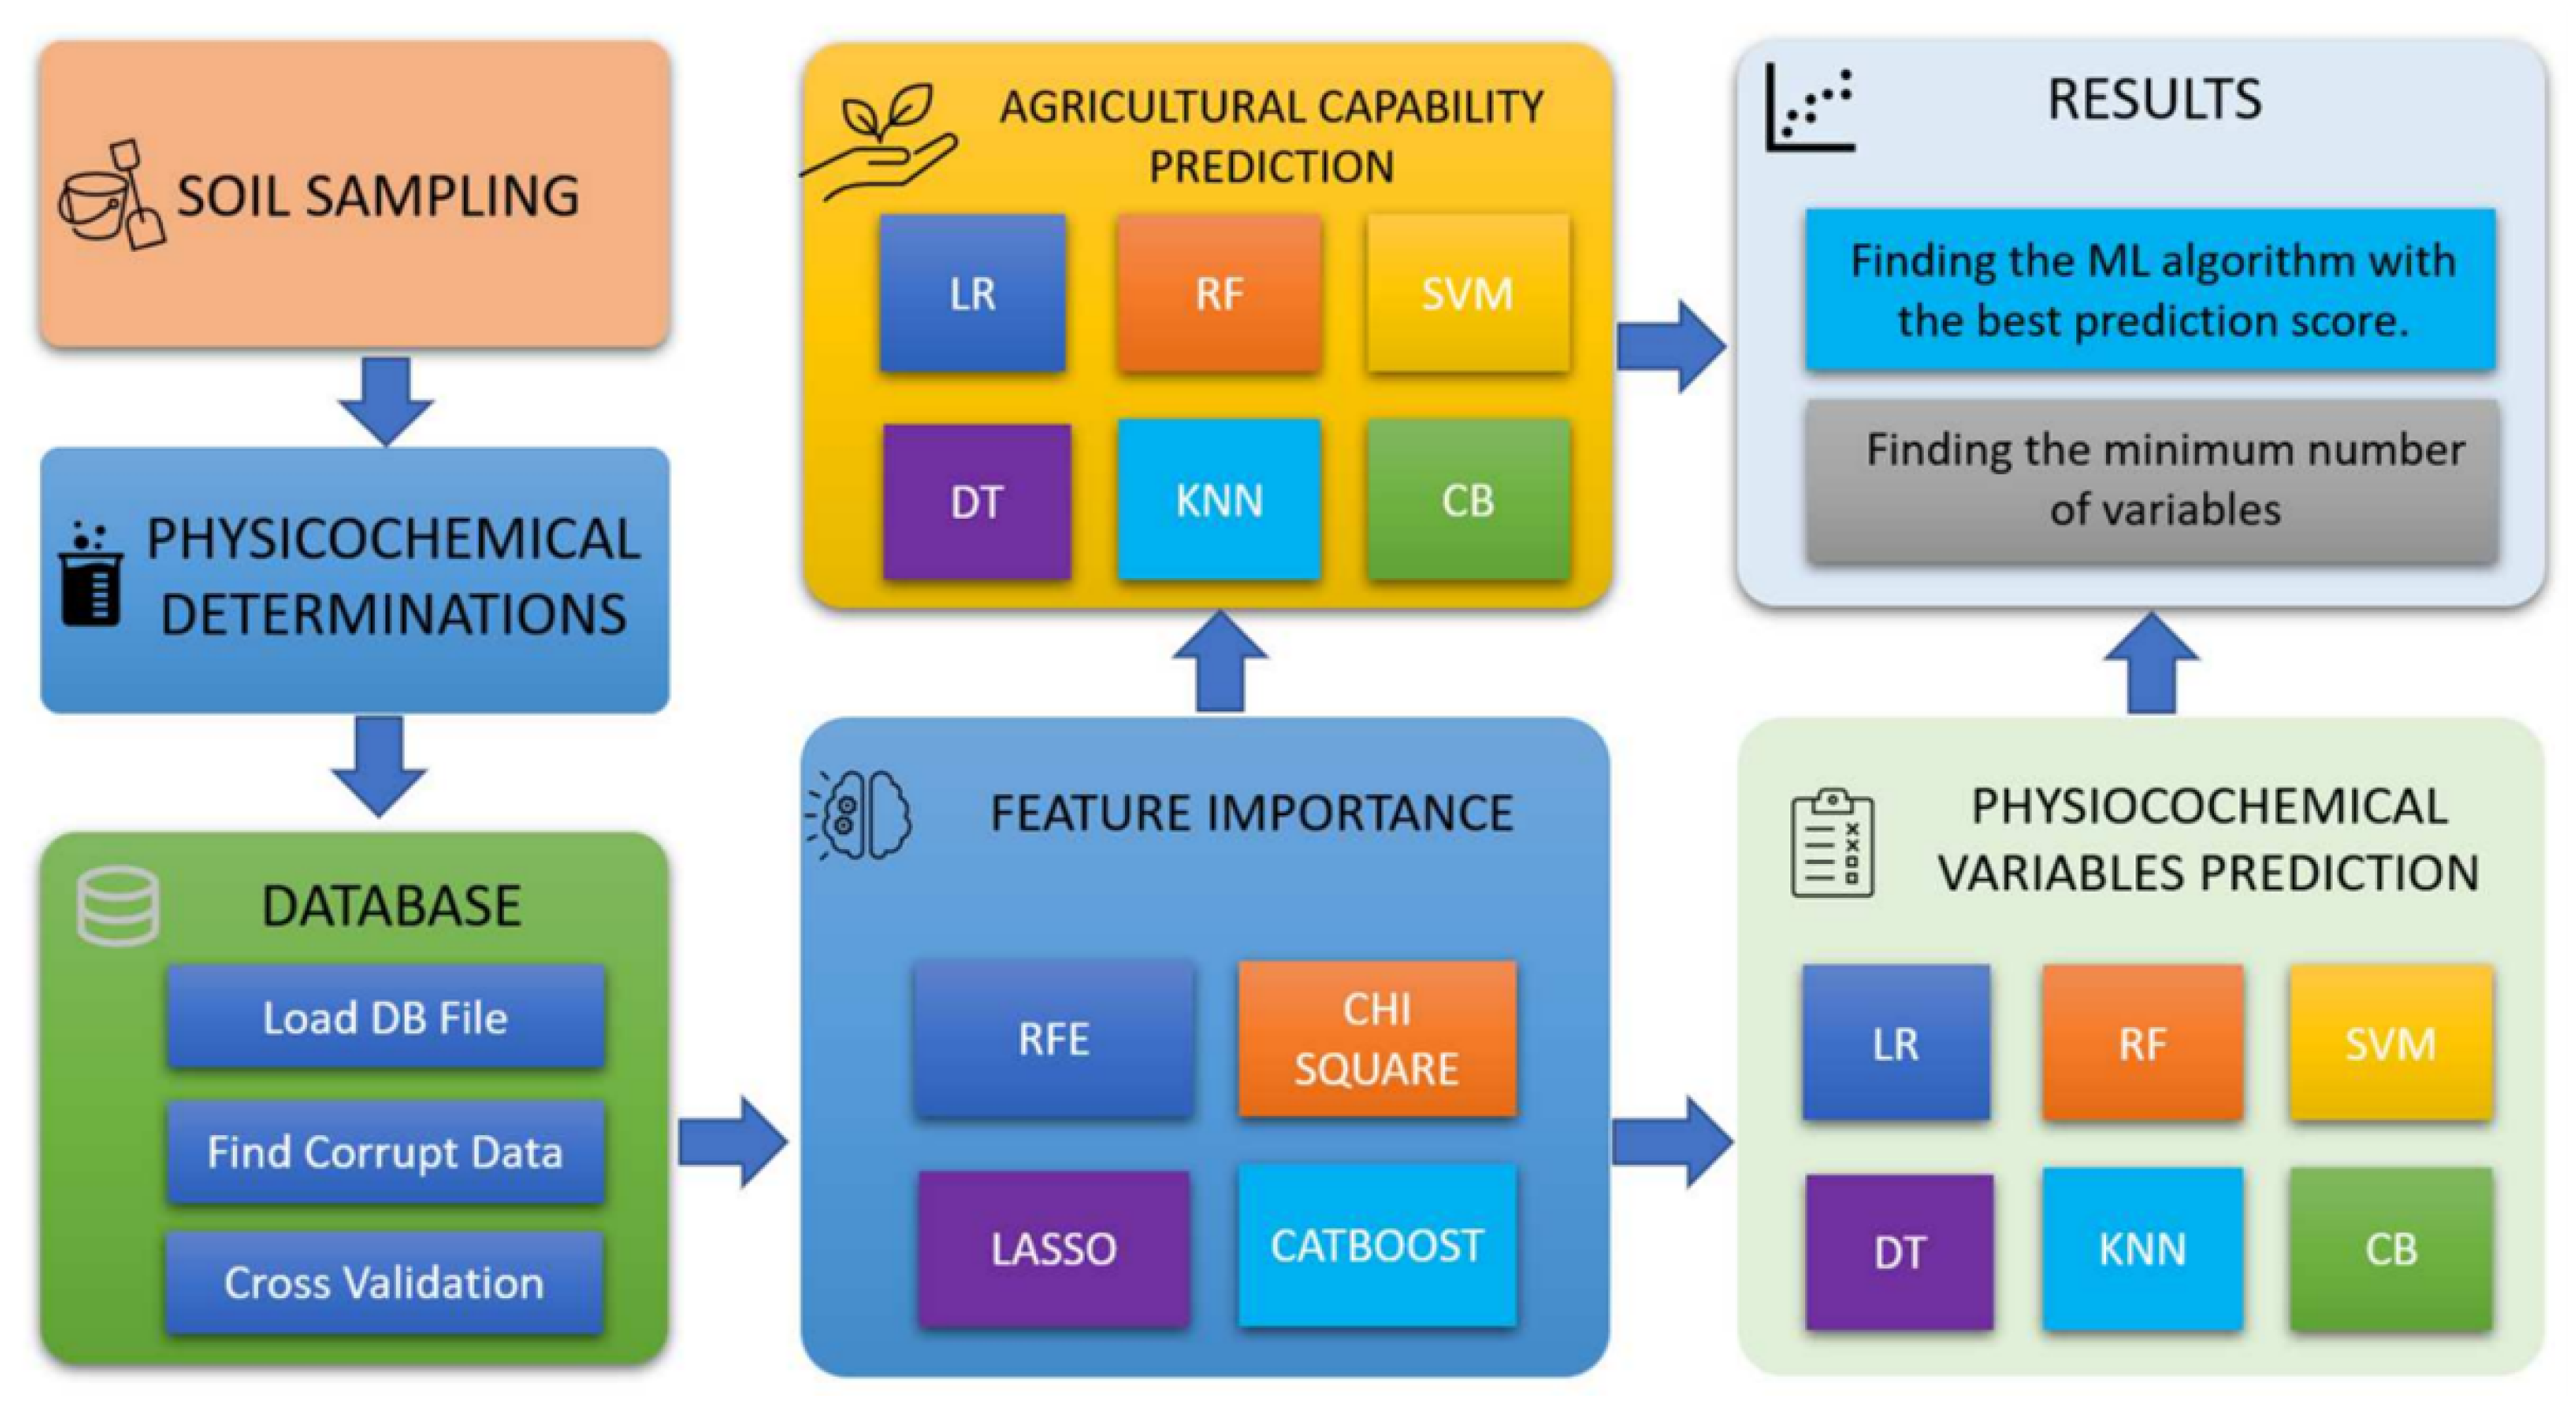
2.4. Machine Learning

To achieve the objective of the present study and for better comprehension of the process, all the experiments evaluated with machine learning methodologies were segmented into four categories, listed and explained below. Figure 2 presents the schematic diagram of the methodology used in the present work.

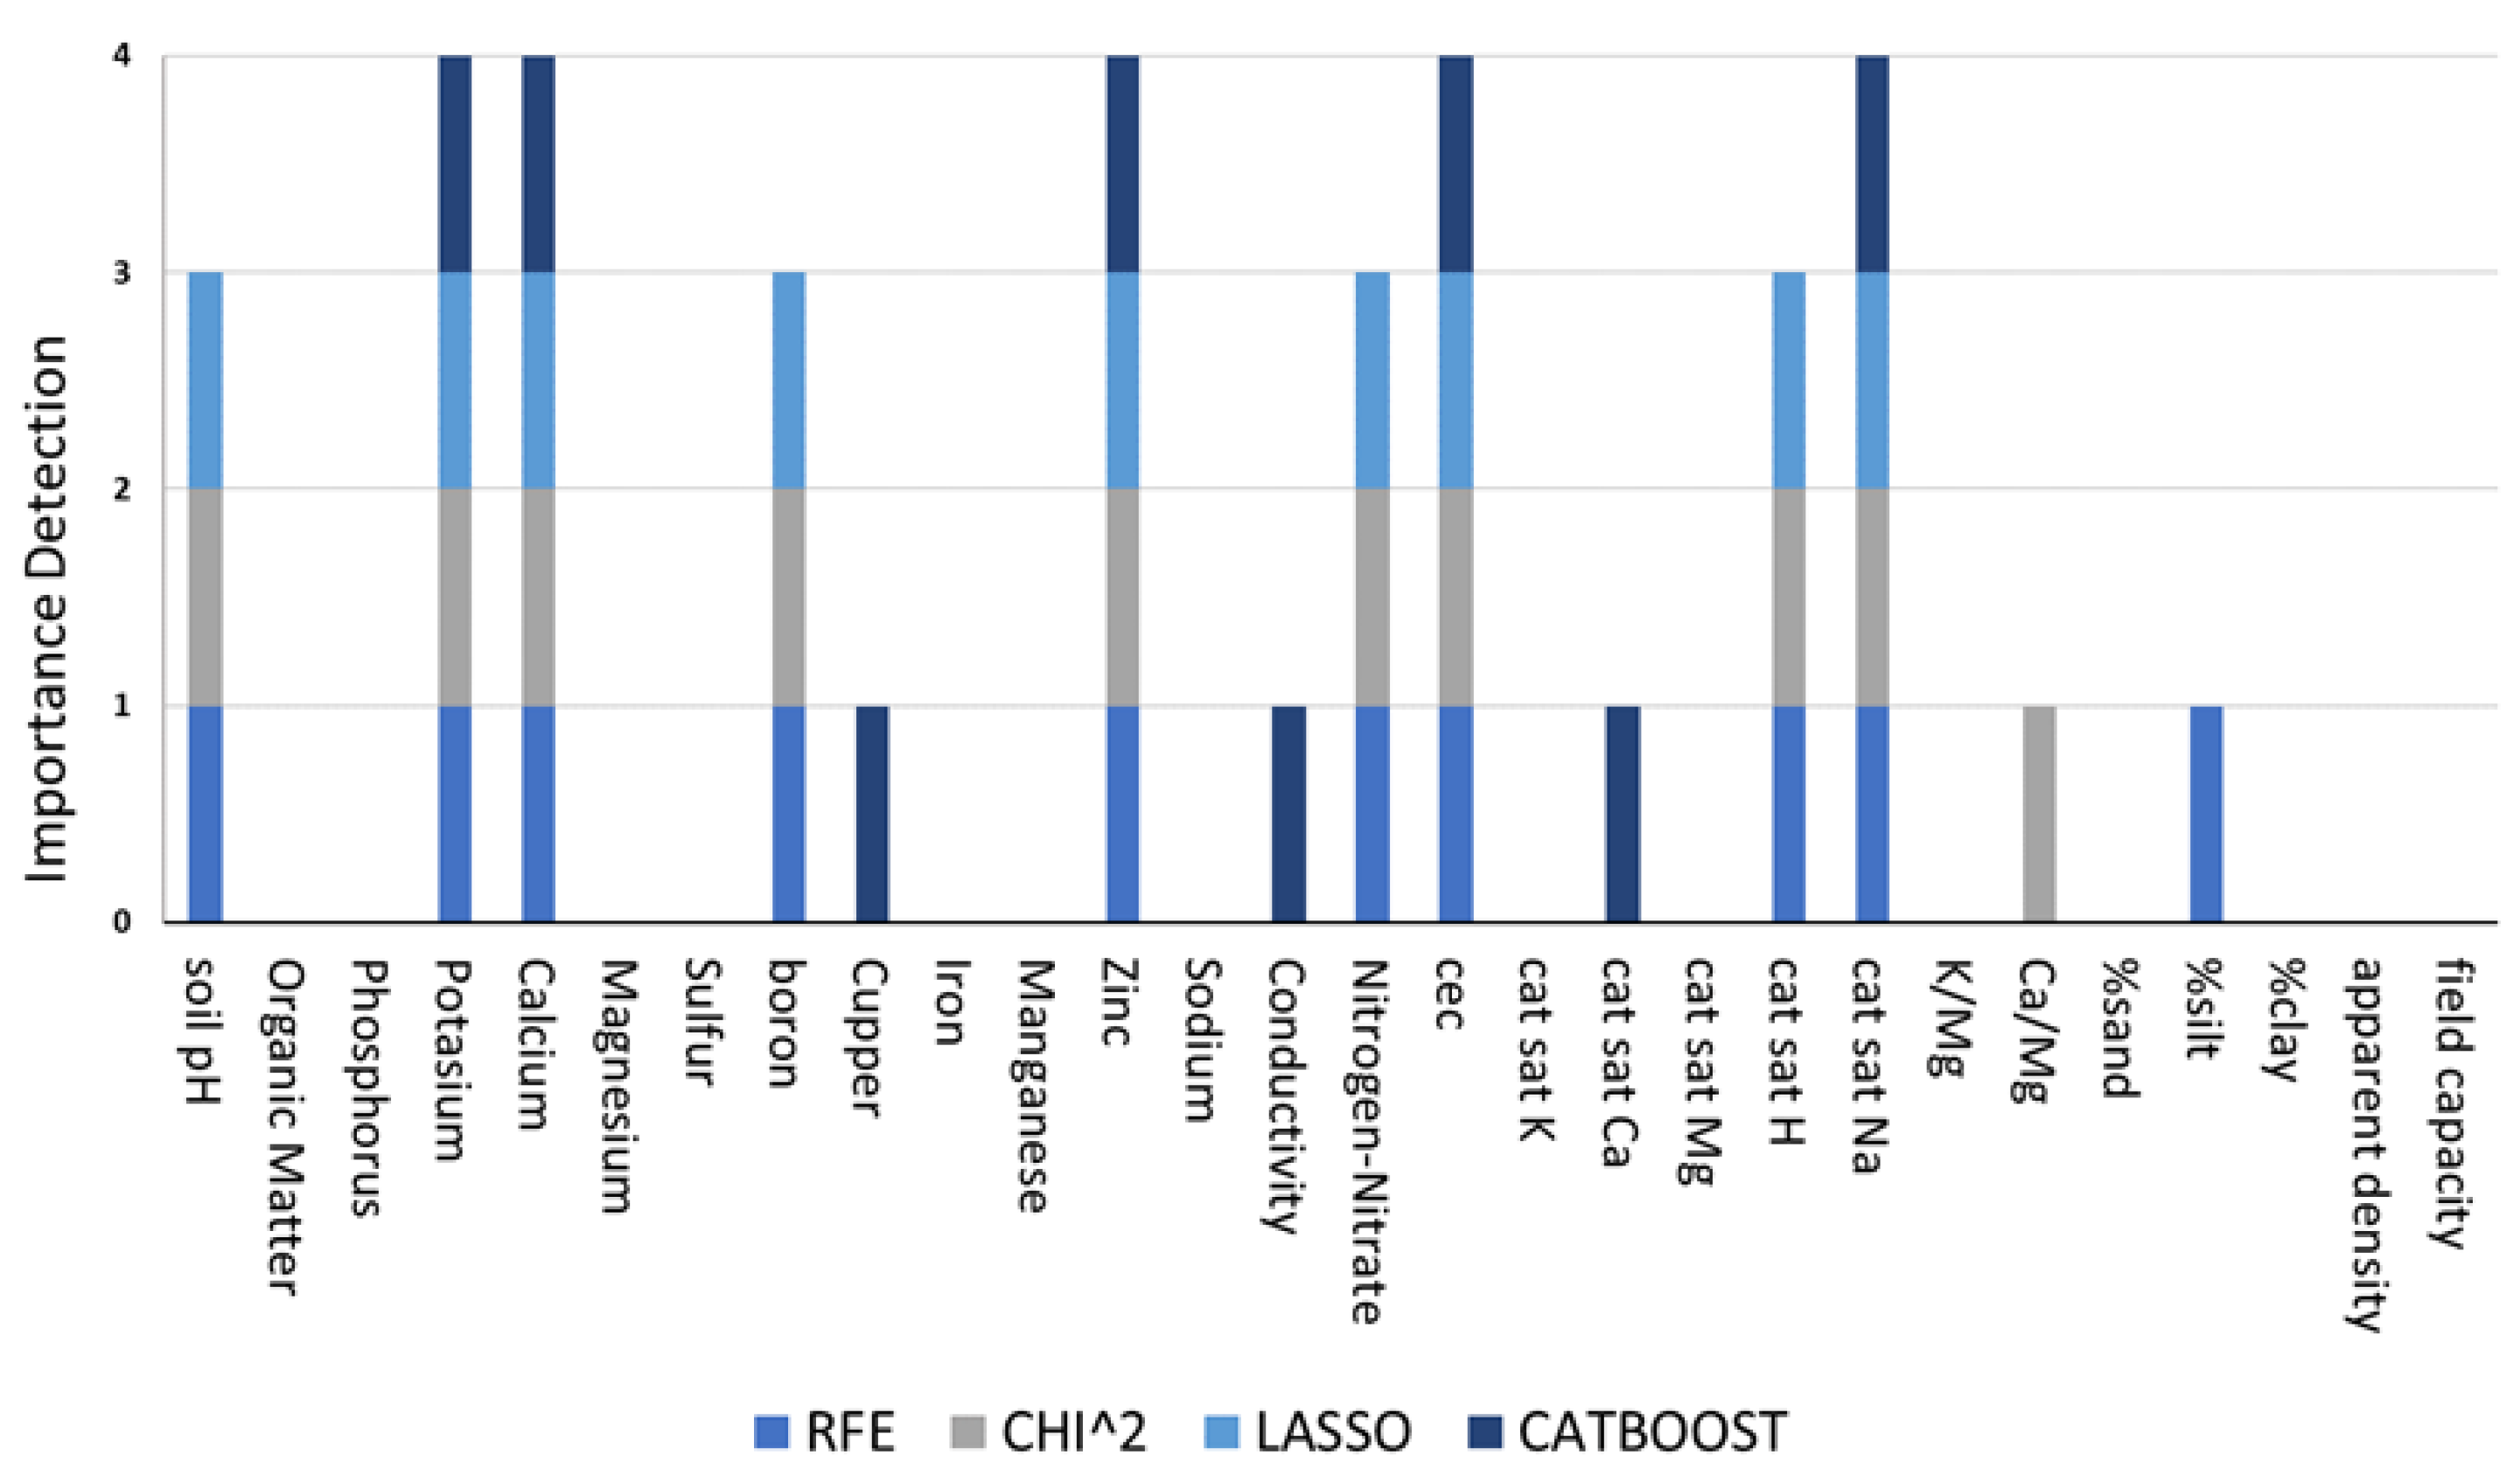
2.5. Feature Importance Analysis

The Recursive Feature Elimination (RFE), Chi Square, Least Absolute Shrinkage and Selection operator (LASSO) and Catboost (CB) algorithms were implemented to determine, in detail, the most relevant physicochemical parameters, by executing different machine learning models. The database from the laboratory analysis used for the experiments contained one hundred soil samples of the studied area. This database included the 28 parameters listed in the soil sampling physicochemical determination and the soil aptitude evaluation. All these parameters were evaluated with the four algorithms mentioned to determine the feature importance. The experiments and analysis of the data were developed in Python programming language using Sci-Kit learn libraries.

2.6. Agricultural Capability Prediction

Through the identification of relevant variables, another experiment was carried out to predict the aptitude of soil to grow sugarcane, with the objective of ascertaining how many variables could determine the capability of soil. Reducing the number of variables in the determination of the physicochemical parameters determining soil quality could decrease time and costs. The tests were implemented using 27, 8, 5 and 3 variables, according to the variables that showed higher importance in the Feature Importance Analysis executed. For the first experiment, all 27 variables were used and the capability of soil was the predicted variable. For the second experiment, 8 variables were used as inputs in the methodology (Soil pH, K, Ca, B, Zn, N 2 - NO 3 CEC, CS for H, CS for Na) and the capability of soil was the predicted variable. For the experiment with five elements (K, Ca, Zn, CEC y CS for Na), the feature performance results obtained in the experiments were used. Finally, the experiments with three variables (K, Ca y CEC) were used to predict the capability of soil. These experiments were carried out by using the following machine learning techniques: linear regression (LR), Decision Tree (DT), Random Forest (RF), K Nearest Neighbor (KNN), Support Vector Machine (SVM) and Catboost (CB). To implement these methodologies, a cross validation of the data was executed to ensure the separation of the training data from the test data to avoid having significant variance that could lead to an error in the accuracy determination of each method. Another fundamental segment was the tuning of the hyperparameters, by implementing algorithms, such as Grid Search and Random Search, to find which variables were the more adequate hyperparameters to obtain better accuracy in predictions. Figure 3 shows the schematic diagram of the prediction of agricultural capability and the determination of physicochemical variables.

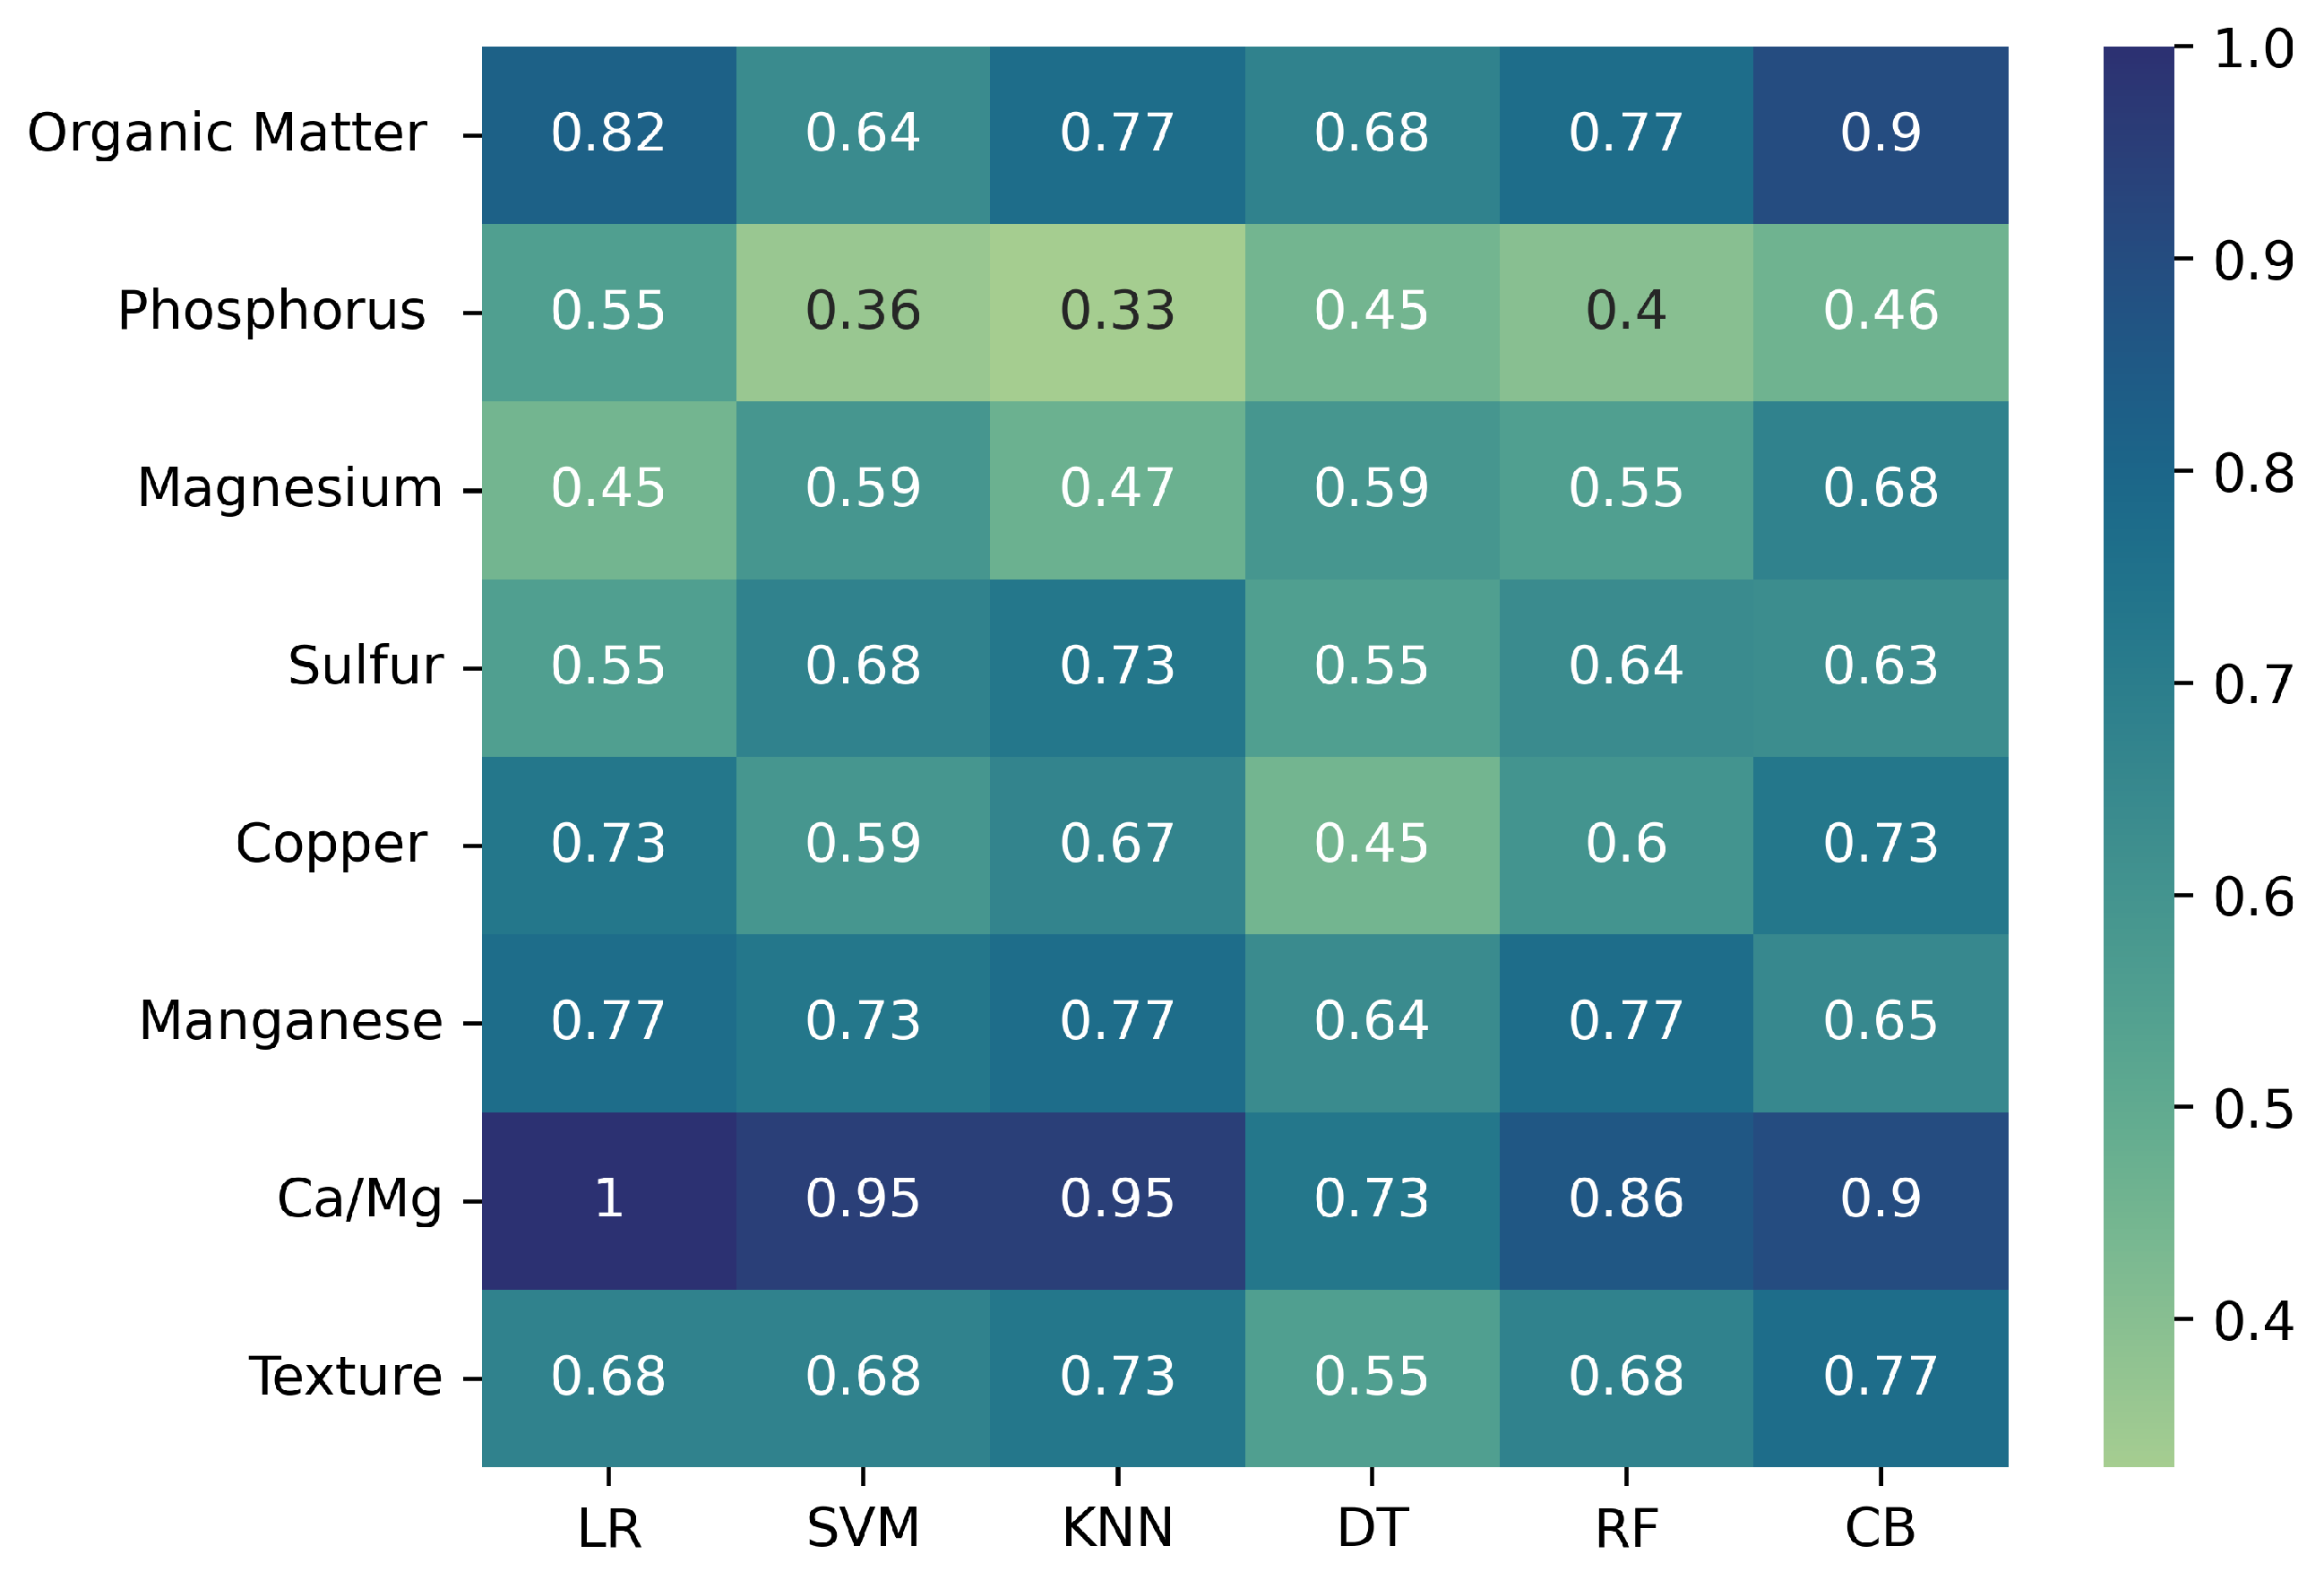
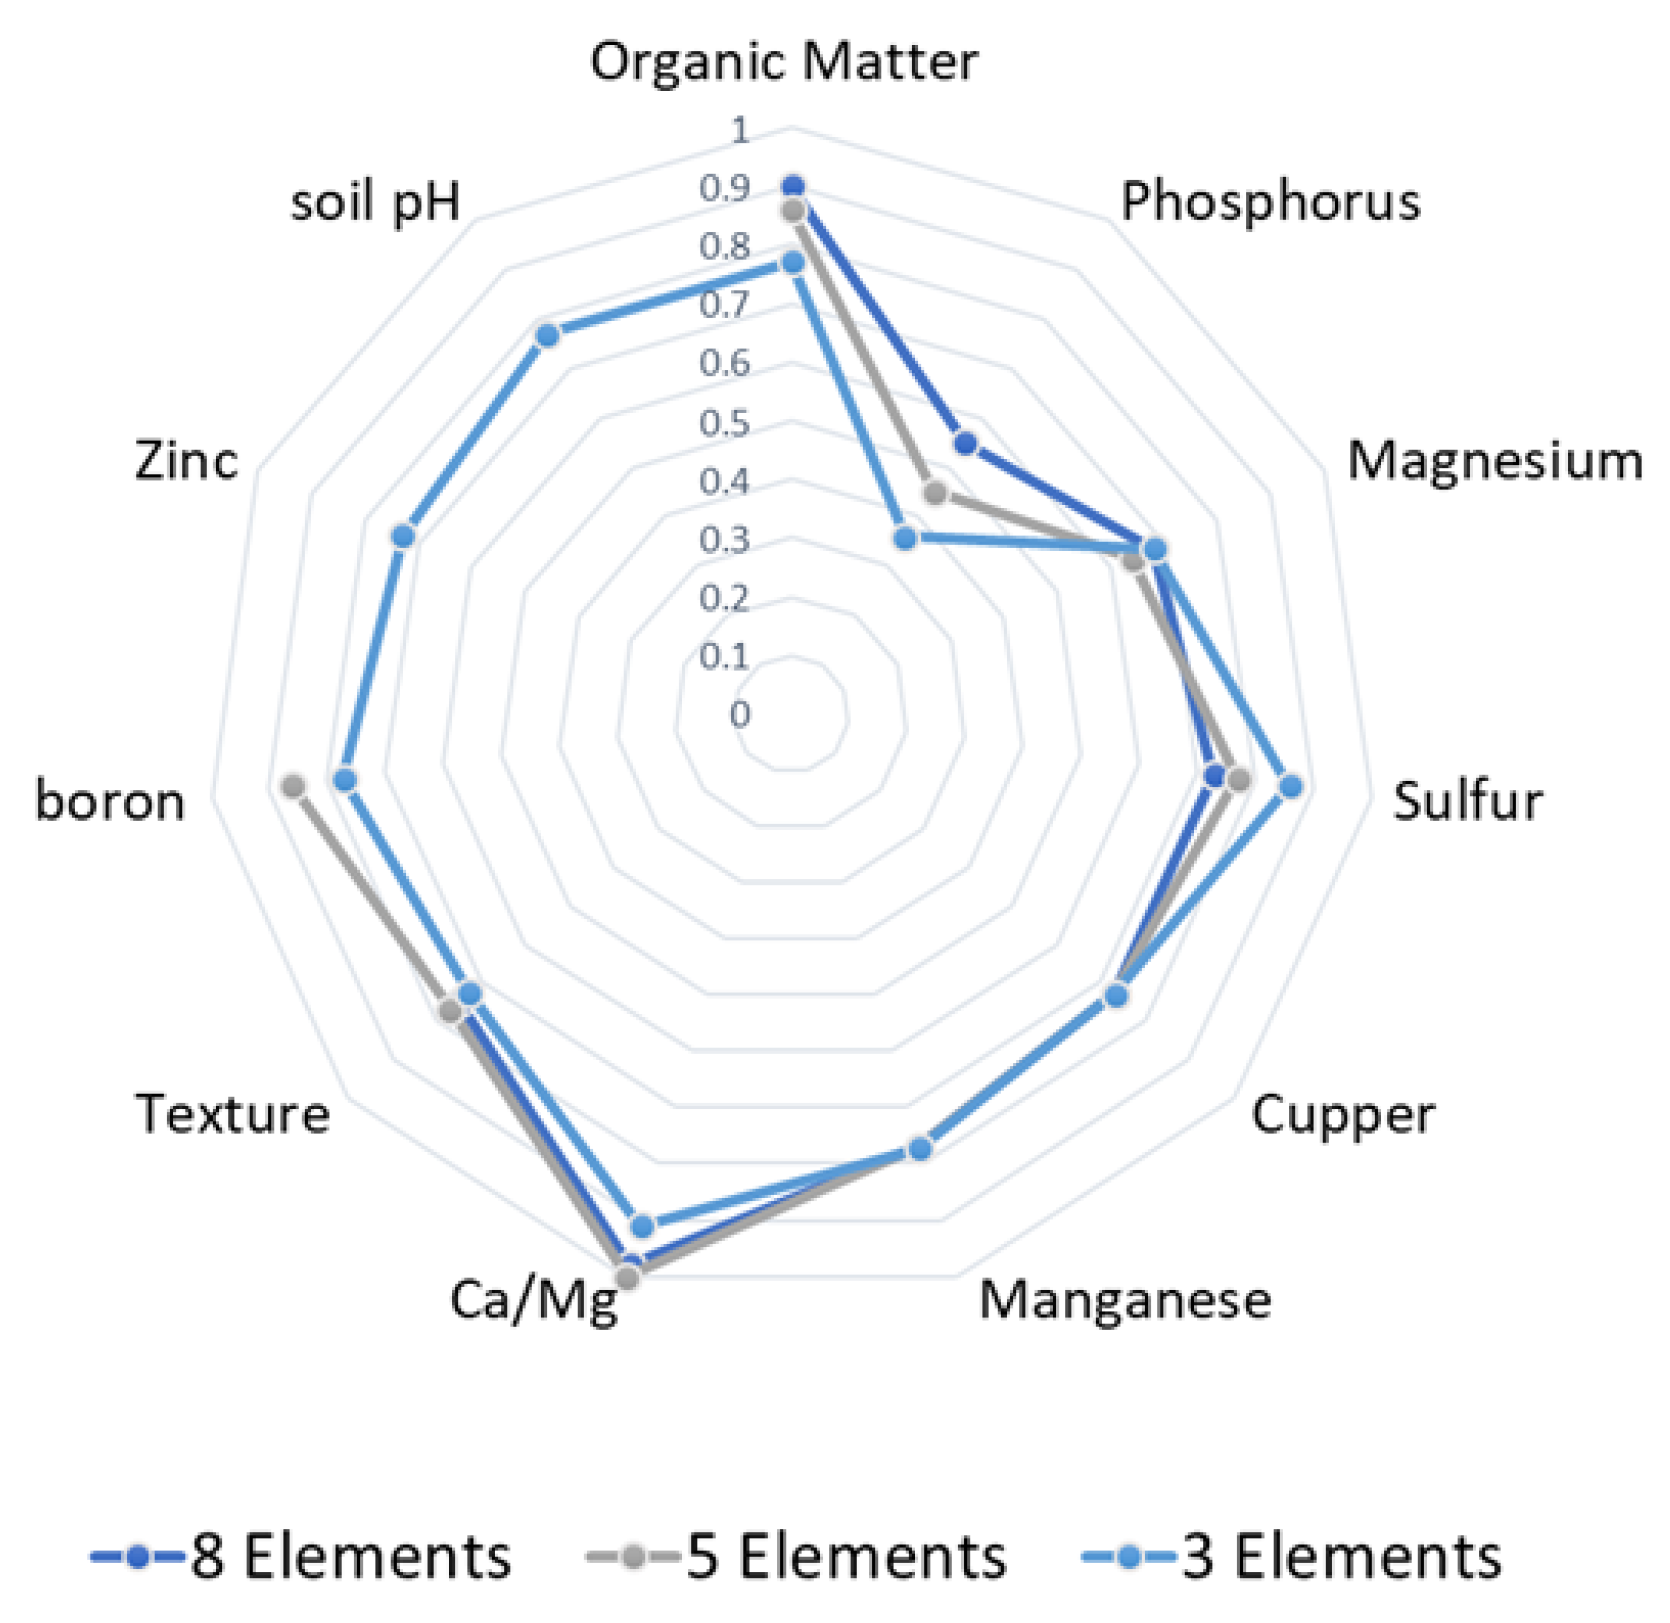
2.7. Physicochemical Variables Prediction

The last segment of the experimentation was focused on the determination of the physicochemical parameters in soil through the values of some of the parameters of higher importance. The present segment estimates a great variety of physicochemical parameters from a reduced number of known parameters. Three experiments were executed using different numbers of parameters, selected by relevance, and determined using different machine learning techniques, such as LR, DT, RF, KNN, SVM and CB. A prediction of different physicochemical parameters was determined. The first test was executed using the elements of Soil pH, Potassium, Ca, B, Zn, Nitrogen-Nitrate, CEC, CS H, CS for Na with the objective of predicting OM, P, Mg, S, Cu, Mn, Ca/Mg and Texture. In the second experiment, potassium, Ca, Zn, CEC, and CS for N were considered with the objective of predicting OM, P, Mg, S, B, Cu, Mn, Ca/Mg and texture. Finally, in the third experiment, three parameters were used, K, Ca, and CEC, to predict the values of the parameters of soil pH, OM, P, Mg, S, B, Cu, Mn, Zn, Ca/Mg and Texture. The results obtained enabled the accuracy of each ML technique for the prediction of each physicochemical property of soil to be ascertained. It also enabled determination of the accuracy of the predictions from a certain number of parameters (8, 5 and 3 elements).

3. Results

3.1. Soil Aptitude Evaluation

The results of the soil aptitude evaluation clearly indicated that pH, organic matter, phosphorus, potassium, calcium, conductivity, zinc, and nitrogen–nitrate marked important differences between bad and good soil aptitudes. Similarly, in the results indicating bad aptitude evaluation, a greater presence of elements such as sulfur, CS for H, CS for Na was found. The Figure 4 shows the results obtained from the physicochemical properties of the soils with respect to their soil aptitude classification.

3.2. Feature Importance Results

The physicochemical analyses performed in the previous section offered the possibility to determine the impact of each variable individually with respect to soil aptitude. However, it was important to perform an analysis of the behavior of each variable with respect to the others in order to know how they were interconnected and related to the soil aptitude evaluation. The results of this relevancy analysis indicated that K, Ca, Zn, CEC, and CS for Na were the parameters recognized by the four techniques (RFE, CHI SQUARE, LASSO, CB) as the relevant parameters in determining the soil aptitude of vertisol soil. There were also parameters, such as pH, B, N 2 NO 3 and CS H, where 3 techniques concurred in their importance (RFE, CHI SQUARE and LASSO). Figure 5 shows the results obtained by these 4 methods. These parameters of importance were used in the following experiments, wherein accuracy in the determination of soil aptitude using a reduced number of parameters was evaluated with data presented in this study.

3.3. Agricultural Capability Prediction Results

The results found after implementing the ML algorithms showed the average of the accuracy results of the 6 algorithms with respect to the identification of the soil capability. After specifically analyzing the results by algorithm type, the following observations were made: by using 27 parameters as the input parameters in the ML algorithms, the highest average accuracy was obtained with CB 93%; when using 8 parameters the highest average accuracy was obtained with RF 91%; when using 5 parameters the highest average accuracy was achieved with LR 91%; when using 3 parameters there were two algorithms with the highest average accuracy, these being LR and KNN (91%). Figure 6 shows the best scores related to the accuracy of the ML algorithms in the soil quality prediction.

3.4. Physicochemical Parameters Prediction Results

The experiments carried out in this section were focused on ascertaining the accuracy with which it was possible to determine the physicochemical parameters of soil from a reduced number of elements as input variables of the ML algorithms. In the first experiment, 8 elements (Soil pH, K, Ca, B, Zn, N 2 NO 3 , CEC, CS H, CS Na) were used as the input parameters and it was possible to predict OM, P, Mg, S, Cu, Mn, Ca/Mg and Texture. Figure 7 shows the results focused on the evaluation of accuracy of the 6 machine learning algorithms executed in the predictions. It can be appreciated, from Figure 7, that, for each component to be predicted there was an algorithm that had the best accuracy and for each element to be predicted there was an algorithm presenting the best accuracy. Mostly, the CB algorithm presented the best accuracy globally with 71.5%. The one with the least accurate results was the DT algorithm with 58% accuracy. The parameters that could be predicted were OM (90% using CB), texture (77% using CB) and Mn (77% using LR) and the parameter with the least accurate result was P with 0.55 accuracy using LR. Figure 6 provides a graphic with the results of the best predictions for each element. To the left of the name of each element is the name of the ML algorithm executed with which the best result was obtained.
In the second experiment, 5 elements (K, Ca, Zn, CEC and CS N) were implemented as inputs and it was possible to predict OM, P, Mg, S, B, Cu, Mn, Ca/Mg and texture. Figure 8 shows the results focusing on the evaluation of accuracy of the 6 ML algorithms used in the prediction. It can be appreciated from Figure 8 that, for each component being estimated or predicted, there was an algorithm that had great accuracy. Therefore, Figure 8 indicates which algorithm presented the best accuracy in prediction for each element. Broadly, 10 parameters were predicted with the KNN algorithm, which had the best global accuracy with 73.11%, and the least global accuracy was obtained with CB (64%). The parameters predicted with more accuracy were Ca/Mg (100% using KNN), B (86% using RF) and OM (86% using LR), and the parameter with less accuracy was P with 45% using LR. Figure 8 provides a graphic with the results of the predictions with the best accuracy for each element. To the left of the name of each element is the ML algorithm executed in which the best accuracy was obtained.
In the third experiment, 3 elements (K, Ca and CEC) were used as inputs for the evaluation and it was possible to predict soil pH, OM, P, Mg, S, B, Cu, Mn, Zn and Ca/Mg. Figure 9 shows the results focusing on the evaluation of the accuracy of the 6 ML algorithms used in the prediction. The general average of the prediction of the 12 parameters was best executed by the KNN algorithm, with a global accuracy of 68%, and the least accurate global result was obtained with the DT algorithm, with 68% accuracy. The parameters that could be predicted with higher accuracy were Ca/Mg (91% using SVM) and S (0.86 using RF) and the least accurate prediction was for P (36% using SVM). Figure 9 provides a graphic with the results of the best predictions for each element. To the left of the name of each element is the ML algorithm with which the best accuracy was obtained.
Figure 10 provides a radial graphic with the accuracy of the ML algorithms using 8, 5 and 3 elements as inputs. The average accuracy was 76% for 8 elements as inputs, 76% for 5 elements as inputs and 73% for 3 elements as inputs.

4. Discussion

The discussion of the present study is divided into three segments: relevant parameters, agricultural capability prediction and physicochemical parameters prediction. This study indicates that the four implemented techniques, RFE, CHI SQUARE, LASSO and CB, determined K, Ca, Zn, CEC and CS for Na as being the most relevant parameters for vertisol-type soil, and pH, B, N and CS H were determined to be relevant by three techniques (RFE, CHI SQUARE, and LASSO). Meanwhile, [27] determined available Phosphorus (P), available Potassium (K), organic carbon (OC), boron (B) and pH as being relevant for a village-wise soil by implementing Extreme Learning Machine (ELM) and [20] established that the relevant parameters were OC, N, pH, CEC, base saturation and exchangeable cation, when implementing quantile regression forest (QRF) and the cubist model (CB). It is important to implement various techniques to validate the parameters to be used.
In the segment regarding the agricultural capability prediction, the present research evaluated the relevance of different numbers of parameters, and had good accuracy results for the different techniques (77% to 93%) for specific technique and number of parameters. Other authors have also evaluated the prediction ability of different models, with accuracy results in the range of 85 to 95% [38,39] reported when implementing three algorithms, with Random forest having the highest accuracy (72%), which was below the results obtained in the present study, and, furthermore, the number of samples was not mentioned and neither was the percentage of data used for training the model.
From the results, it is possible to have higher accuracy in agricultural capability prediction using only three parameters for vertisol soils cultivated with sugarcane, these being those with higher significance, namely, K, Ca and CEC. Most of the producers add N, P and K fertilizers to soils because these have commonly been considered to increase yield, without evaluating the present state of the soils. It is remarkable that, from the present study, for one parameter to remain relevant is needs to connect with the rest of the parameters. Additionally, the CEC is connected to the presence of organic matter, which is known not only to be a relevant parameter to increase yield, but also soil structure, availability of other cations and pH. Finally, Ca is also relevant, as its presence complements the physical parameters and pH and the possible presence of complex structures that could affect or impact absorption and availability of minerals.
It can also be observed that with three parameters it is possible to have a system capable of great accuracy in predicting soil aptitude. The impact these results can have is relevant because the results indicate that it is not necessary to analyze all the parameters to determine the ability of soil to grow sugar cane. By implementing ML algorithms using K, Ca, and CEC as input parameters one can, with high accuracy, ascertain soil aptitude.
The third aspect to discuss is that the present study evaluated the possibility of predicting parameters from other soil physicochemical parameters. It was observed that 10 parameters were likely to be predicted with the KNN algorithm, which had the best global accuracy of 73%, while the least global accuracy was obtained with CB (64%). The parameters predicted with more accuracy were Ca/Mg (1.0 using KNN), B (86% using RF) and OM (86% using LR) and the parameter with least accuracy was P with 45%, using LR. Other authors have aimed to predict different parameters, with accuracy ranging from 86% to 97%, such as the following: exchangeable sodium percentage with different models (ANN (89%) and Adaptive Neuro Fuzzy Inference System (92%)) [40], OM with different models (Kennard-Stone (KS), Successive Projections Algorithm (SPA), Competitive adaptive weight weighting algorithm (CARS) and their combination).

5. Conclusions

The present study evaluated the potential of different ML algorithms in predicting the agricultural aptitude of soils with the least number of parameters and to determine if it was possible to predict some other parameters to reduce the amount of soil analysis in laboratories. After presenting the results, it can be concluded that the capability of Vertisol soils in sugarcane production can be determined with three parameters and excellent accuracy is obtained by using the KNN and LR algorithms. When evaluating the prediction parameters from other parameters, many excellent prediction results were obtained for different ML algorithms. These correlations can have an impact in developing countries on the methodologies implemented to determine the agricultural capability of soils, so as to help in increasing crop yields and coping with the environmental states of soils.

Author Contributions

Conceptualization, O.L.-E., N.A.V.C. and O.O.S.-G.; methodology, J.M.M.C., J.d.J.A.F.-C. and A.A.-L.; validation, J.M.M.C., J.d.J.A.F.-C., O.L.-E. and O.O.S.-G.; formal analysis, A.M.-S. and O.O.S.-G.; investigation, J.M.M.C., E.S.R.-M. and A.A.-L.; writing—original draft preparation, J.d.J.A.F.-C., O.L.-E., N.A.V.C. and O.O.S.-G.; writing—review and editing, J.d.J.A.F.-C., A.A.-L., E.S.R.-M., A.M.-S., O.L.-E. and O.O.S.-G.; visualization, J.M.M.C., A.A.-L. and A.M.-S.; supervision, O.O.S.-G. and O.L.-E. All authors have read and agreed to the published version of the manuscript.

Funding

This research was funded by the Consejo Nacional de Ciencia y Tecnología (CONACYT), Sectorial fund of environmental, grant number 26282.

Informed Consent Statement

This work does not contain any studies with human participants performed by any of the authors.

Data Availability Statement

Dataset is uploaded on GitHub Repository name: Physicochemical-Analysis-Sugarcane-Soils, https://github.com/oosg/Physicochemical-Analysis-Sugarcane-Soils.git, accesed on 29 June 2023.

Acknowledgments

We are grateful to Tecnológico Nacional de México and CONACYT for the scholarships granted to the students for this project.

Conflicts of Interest

The authors declare no conflict of interest.The funders had no role in the design of the study; in the collection, analyses, or interpretation of data; in the writing of the manuscript, or in the decision to publish the results.

Abbreviations

The following abbreviations are used in this manuscript:
CaCalcium
Ca/MgCalcium/Magnesium
CARSCompetitive adaptive weight weighting algorithm
CBCatBoost
CECCation exchange capacity
CS HCationic Saturation for Hydrogen
CS NCationic Saturation for Nitrogen
CuCopper
DBSCANDensity-Based Spatial Clustering of Applications with Noise
DLDeep Learning
DTDecision Tree
EOExpert opinion
KPotassium
KNNK nearest neighbor
LASSOleast absolute shrinkage and selection operator
LRLinear Regression
MgMagnesium
MLMachine Learning
MnManganese
N2-NO3Nitrogen - Nitrate
NPKAmount of Nitrogen, Phosphorus and Potassium
OCOrganic Carbon
OMOrganic Matter
PPhosphorus
PCAPrincipal Component Analysis
PCRPrincipal Component Regression
pHPotential of hydrogen
PLSRPartial Least Squares Regression
RFRandom Forest
RFERecursive Feature Elimination
RRRelative Risks
SSulfur
SIMPLSAn alternative approach to partial least squares regression
SPASmart Process Automation
SQISoil Quality Indexes
SVMSupport Vector Machine
VIRSVisible near Infrared Spectroscopy
WNNWavelet Neural Network
ZnZinc

References

  1. FAO. International Soil Classification System for Naming Soils and Creating Legends for Soil Maps; World Soil: Rome, Italy, 2015; p. 203. Available online: https://www.fao.org/3/i3794en/I3794en.pdf (accessed on 28 June 2023).
  2. Secretaría de Agricultura, Ganadería, Desarrollo Rural, Pesca y Alimentación. Reporte Final de Producción de Caña y Azucar Zafra 2017/2018. 2018. Available online: https://www.gob.mx/cms/uploads/attachment/file/371833/REPORTE_FINAL_.pdf (accessed on 28 June 2023).
  3. Durán, R.Q.; Sánchez, A.G.; Lombana, A.C.; Arboleda, F.M.; Aguas, J.S.T.; González, J.A.C.; Murillo, C.A.O. Grupos Homogéneos de Suelos del área Dedicada al Cultivo de la caña de Azúcar en el valle del río Cauca (Segunda Aproximación); Publicación Cenicaña: Cali, Colombia, 2008. [Google Scholar]
  4. Rivera, N.A.; Vargas, L.A.O.; Mendoza, G.G. Evaluación de aptitud de tierras al cultivo de caña de azúcar en la Huasteca potosina, México, por técnicas geomáticas. Rev. Geogr. Norte Gd. 2013, 55, 141–156. [Google Scholar] [CrossRef]
  5. Chami, D.E.; Daccache, A.; Moujabber, M.E. What are the impacts of sugarcane production on ecosystem services and human well-being? A review. Ann. Agric. Sci. 2020, 65, 188–199. [Google Scholar] [CrossRef]
  6. Sánchez, P.; Ortiz, C.; Gutiérrez, M.; Gómez, J. Local Land Classification and its Relationship with Sugarcane Crop in the South of Veracruz. Terra 2002, 20, 359–369. [Google Scholar]
  7. Romero, J.R.; Roncallo, P.F.; Akkiraju, P.C.; Ponzoni, I.; Echenique, V.C.; Carballido, J.A. Using classification algorithms for predicting durum wheat yield in the province of Buenos Aires. Comput. Electron. Agric. 2013, 96, 173–179. [Google Scholar] [CrossRef]
  8. Dorado, H.; Delerce, S.; Jimenez, D.; Cobos, C. Finding optimal farming practices to increase crop yield through global-best harmony search and predictive models, a data-driven approach. In Lecture Notes in Computer Science (Including Subseries Lecture Notes in Artificial Intelligence and Lecture Notes in Bioinformatics); Springer: Berlin/Heidelberg, Germany, 2018; 11289 LNAI; pp. 15–29. [Google Scholar] [CrossRef]
  9. Sethy, P.K.; Panigrahi, G.R.; Barpanda, N.K.; Behera, S.K.; Rath, A.K. Application of Soft Computing in Crop Management; Springer: Singapore, 2018; Volume 695, pp. 633–646. [Google Scholar] [CrossRef]
  10. Moncada, M.P.; Gabriels, D.; Cornelis, W.M. Data-driven analysis of soil quality indicators using limited data. Geoderma 2014, 235–236, 271–278. [Google Scholar] [CrossRef]
  11. Shankar, S.V.; Radha, M.; Kumaraperumal, R.; Gowsar, S.N. Statistical evaluation of physico-chemical properties of Soils of Coimbatore district using Dimensionality Reduction Technique S.Vishnu. Int. Arch. Appl. Sci. Technol. 2019, 10, 84–89. [Google Scholar]
  12. Tesfahunegn, G.B. Soil quality assessment strategies for evaluating soil degradation in Northern Ethiopia. Appl. Environ. Soil Sci. 2014, 2014, 646502. [Google Scholar] [CrossRef] [Green Version]
  13. Armenise, E.; Redmile-Gordon, M.A.; Stellacci, A.M.; Ciccarese, A.; Rubino, P. Developing a soil quality index to compare soil fitness for agricultural use under different managements in the mediterranean environment. Soil Tillage Res. 2013, 130, 91–98. [Google Scholar] [CrossRef]
  14. Vasu, D.; Singh, S.K.; Ray, S.K.; Duraisami, V.P.; Tiwary, P.; Chandran, P.; Nimkar, A.M.; Anantwar, S.G. Soil quality index (SQI) as a tool to evaluate crop productivity in semi-arid Deccan plateau, India. Geoderma 2016, 282, 70–79. [Google Scholar] [CrossRef]
  15. de Paul Obade, V.; Lal, R. A standardized soil quality index for diverse field conditions. Sci. Total Environ. 2016, 541, 424–434. [Google Scholar] [CrossRef]
  16. Lal, R. Restoring soil quality to mitigate soil degradation. Sustainability 2015, 7, 5875–5895. [Google Scholar] [CrossRef] [Green Version]
  17. Shao, Z.; Zhang, L.; Wang, L. Stacked Sparse Autoencoder Modeling Using the Synergy of Airborne LiDAR and Satellite Optical and SAR Data to Map Forest Above-Ground Biomass. IEEE J. Sel. Top. Appl. Earth Obs. Remote Sens. 2017, 10, 5569–5582. [Google Scholar] [CrossRef]
  18. Faming, H.; Jing, Z.; Chuangbing, Z.; Yuhao, W.; Jinsong, H.; Li, Z. A deep learning algorithm using a fully connected sparse autoencoder neural network for landslide susceptibility prediction. Landslides 2020, 17, 217–229. [Google Scholar] [CrossRef]
  19. de Bem, P.P.; de Carvalho Júnior, O.A.; de Carvalho, O.L.F.; Gomes, R.A.T.; Fontes Guimarães, R. Performance Analysis of Deep Convolutional Autoencoders with Different Patch Sizes for Change Detection from Burnt Areas. Remote Sens. 2020, 12, 2576. [Google Scholar] [CrossRef]
  20. Hounkpatin, K.O.; Bossa, A.Y.; Yira, Y.; Igue, M.A.; Sinsin, B.A. Assessment of the soil fertility status in Benin (West Africa)—Digital soil mapping using machine learning. Geoderma Reg. 2022, 28, e00444. [Google Scholar] [CrossRef]
  21. Xu, M.; Chu, X.; Fu, Y.; Wang, C.; Wu, S. Improving the accuracy of soil organic carbon content prediction based on visible and near-infrared spectroscopy and machine learning. Environ. Earth Sci. 2021, 80, 326. [Google Scholar] [CrossRef]
  22. Dong, Z.; Wang, N.; Liu, J.; Xie, J.; Han, J. Combination of machine learning and VIRS for predicting soil organic matter. J. Soils Sediments 2021, 21, 2578–2588. [Google Scholar] [CrossRef]
  23. Wang, Z.; Wang, G.; Ren, T.; Wang, H.; Xu, Q.; Zhang, G. Assessment of soil fertility degradation affected by mining disturbance and land use in a coalfield via machine learning. Ecol. Indic. 2021, 125, 107608. [Google Scholar] [CrossRef]
  24. Singh, B.; Sihag, P.; Pandhiani, S.M.; Debnath, S.; Gautam, S. Estimation of permeability of soil using easy measured soil parameters: Assessing the artificial intelligence-based models. ISH J. Hydraul. Eng. 2021, 27, 38–48. [Google Scholar] [CrossRef]
  25. Vaheddoost, B.; Guan, Y.; Mohammadi, B. Application of hybrid ANN-whale optimization model in evaluation of the field capacity and the permanent wilting point of the soils. Environ. Sci. Pollut. Res. 2020, 27, 13131–13141. [Google Scholar] [CrossRef]
  26. Helfer, G.A.; Barbosa, J.L.V.; dos Santos, R.; da Costa, A.B. A computational model for soil fertility prediction in ubiquitous agriculture. Comput. Electron. Agric. 2020, 175, 105602. [Google Scholar] [CrossRef]
  27. Suchithra, M.S.; Pai, M.L. Improving the prediction accuracy of soil nutrient classification by optimizing extreme learning machine parameters. Inf. Process. Agric. 2020, 7, 72–82. [Google Scholar] [CrossRef]
  28. Pandith, V.; Kour, H.; Singh, S.; Manhas, J.; Sharma, V. Performance Evaluation of Machine Learning Techniques for Mustard Crop Yield Prediction from Soil Analysis. J. Sci. Res. 2020, 64, 394–398. [Google Scholar] [CrossRef]
  29. Peethambaran, B.; Anbalagan, R.; Kanungo, D.P.; Goswami, A.; Shihabudheen, K.V. A comparative evaluation of supervised machine learning algorithms for township level landslide susceptibility zonation in parts of Indian Himalayas. Catena 2020, 195, 104751. [Google Scholar] [CrossRef]
  30. Wu, C.; Chen, Y.; Hong, X.; Liu, Z.; Peng, C. Evaluating soil nutrients of Dacrydium pectinatum in China using machine learning techniques. Forest Ecosyst. 2020, 7, 30. [Google Scholar] [CrossRef]
  31. Inazumi, S.; Intui, S.; Jotisankasa, A.; Chaiprakaikeow, S.; Kojima, K. Artificial intelligence system for supporting soil classification. Results Eng. 2020, 8, 100188. [Google Scholar] [CrossRef]
  32. Yang, M.; Xu, D.; Chen, S.; Li, H.; Shi, Z. Evaluation of machine learning approaches to predict soil organic matter and pH using vis-NIR spectra. Sensors 2019, 19, 263. [Google Scholar] [CrossRef] [PubMed] [Green Version]
  33. Meza-Palacios, R.; Aguilar-Lasserre, A.A.; Morales-Mendoza, L.F.; Pérez-Gallardo, J.R.; Rico-Contreras, J.O.; Avarado-Lassman, A. Life cycle assessment of cane sugar production: The environmental contribution to human health, climate change, ecosystem quality and resources in México. J. Environ. Sci. Health-Part A Toxic Hazard. Subst. Environ. Eng. 2019, 54, 668–678. [Google Scholar] [CrossRef]
  34. FAO. Standard operating procedure for soil organic carbon Walkley-Black method. Glob. Soil Lab. Netw. 2019, 1, 1–25. [Google Scholar]
  35. Pleysier, J.L.; Juo, A.S.R. A single-extraction method using silver-thiourea for measuring exchangeable cations and effective CEC in soil with variable charges. Soil Sci. 1980, 129, 205–211. [Google Scholar]
  36. Chaves, M. Nutrición y Fertilización de la Caña de Azúcar en Costa Rica. In XI Congreso Nacional Agronómico/III Congreso Nacional de Suelos; Sistema Integrado de Información Documental Centroamericano: San José, Costa Rica, 1999; pp. 193–214. [Google Scholar]
  37. Norma Oficial Mexicana NOM-021-RECNAT-2000, Que Establece las Especificaciones de Fertilidad, Salinidad y Clasificación de Suelos, Estudios, Muestreo y anáLisis; Diario Oficial de la Federación:: Ciudad de México, México, 2002; pp. 1–65. Available online: https://faolex.fao.org/docs/pdf/mex50674.pdf (accessed on 28 June 2023).
  38. Wu, X.; Wang, Q.; Liu, M.; Wu, Y. In-situ soil moisture sensing. ACM Trans. Sens. Netw. 2012, 8, 1–30. [Google Scholar] [CrossRef]
  39. Kumar, T.G.K.; Shubha, C.; Sushma, S.A. Random Forest Algorithm for Soil Fertility Prediction and Grading Using Machine Learning; Blue Eyes Intelligence Engineering and Sciences Publication: Bhopal, India, 2019; Volume 9, pp. 1301–1304. [Google Scholar] [CrossRef]
  40. Keshavarzi, A.; Bagherzadeh, A.; Omran, E.S.E.; Iqbal, M. Modeling of soil exchangeable sodium percentage using easily obtained indices and artificial intelligence-based models. Model. Earth Syst. Environ. 2016, 2, 130. [Google Scholar] [CrossRef] [Green Version]
Figure 1. Types of soils present in the studied area include Andosol (purple), Leptosol (grey), Acrisol (green), Vertisol (pink), Umbrisol (mauve), Luvisol (chartreuse), Phaeozem (brown), Cambisol (orange), Chernozem (dark brown) and Arenosol (white) (a) and the samples location (blue spots) (b).
Processes 11 01985 g001
Figure 2. Schematic diagram of the applied methodology.
Processes 11 01985 g002
Figure 3. Schematic diagram of the prediction of agricultural capability and the determination of relevant physicochemical variables.
Processes 11 01985 g003
Figure 4. Soil Aptitude Evaluation.
Processes 11 01985 g004
Figure 5. Feature Importance using RFE, Chi Square, LASSO and CB.
Processes 11 01985 g005
Figure 6. Features Importance using RFE, Chi Square, LASSO and CB.
Processes 11 01985 g006
Figure 7. Accuracy of the Ml algorithms using 8 input variables.
Processes 11 01985 g007
Figure 8. Accuracy of the ML algorithms using 5 input variables.
Processes 11 01985 g008
Figure 9. Accuracy of the ML algorithms using 3 input variables.
Processes 11 01985 g009
Figure 10. The average accuracy using 8, 5 and 3 elements as an input variables.
Processes 11 01985 g010
Table 1. Comparative table of different state-of-the-art research separated into configuration, target and main contribution.
Name/Ref.ConfigurationTargetMain Contribution
[20]Comparative assessment of the cubist model and the quantile random forest modelsSoil fertility index mapThe topographic covariates had strong predictive ability for all the soil properties along with the bioclimatic variables.
[21]Visible near-infrared spectroscopy and machine learning models, such as Partial Least Square Regression (PLSR), Support Vector Machine (SVM), and Wavelet Neural Network (WNN)Soil organic carbonA combination of the techniques was most suitable in pre-processing data with different models.
[22]Visible near-infrared spectroscopy (VIRS) and machine learning (PLSR), Support Vector Machine (SVM), Artificial Neural Networks (ANN), cubist combined with VIRSSoil organic matterThe combination of algorithms resulted in more precise calibration–validation models.
[23]Successive projections algorithm (SPA), competitive adaptive weight weighting algorithm (CARS), and the combination of Smart Process Automation (SPA) and (CARS)Soil organic matterThe combination of algorithms resulted in more precise calibration–validation models.
[24]Kriging interpolation, density-based spatial clustering of applications and noise (DBSCAN) validated with random forest (RF) algorithmsSoil fertility degradation (SFD)Implementing Random Forest and clustering provided an accuracy above 95%.
[25]SVM model paired with 7 Gaussian Process, Random forest (RF) and multi-linear regression (MLP)Permeability of soil (PS)The parameters of time and water head were the most effective to estimate permeability of soil.
[26]Artificial intelligence model based on ANNHydraulic conductivity (Ks)The model predicts Ks by means of soil parameters, such as silt, clay, organic matter, bulk density, pH, and electrical conductivity.
[27]Architectural modelSoil fertilityThe model predicted organic matter and clay
[28]Extreme Learning Machine model with different activation functionsAvailable phosphorus, available potassium, Organic carbon (OC), B, and pHThe model predicted four of the five parameters evaluated.
[29]Various machine learning techniques (K-Nearest)Land susceptibility zonation (LSZ)The susceptibility maps of the Landslid model paired with the extreme learning adaptive neuro fuzzy inference system (LSM-ELANFIS-VII) provided the most accurate results.
[30]Neighbor Naïve Bayes (KNN), Multinomial Logistic Regression,Soil nutrient qualityTwo models were accurate and some uncertainties in the process are to be studied.
[31]ANN and RFMustard crop yieldThe parameters used were pH, electrical conductivity (EC), OC, Nitrogen (N), P, K, S, Cu, iron (Fe), Zinc (Zn) and Mn and the most accuracy was obtained with the KNN and the ANN.
[32]Evaluation of soil nutrient content through machine learning modelsSoil nutrient qualityTwo models were accurate and some uncertainties in the process are to be studied.
Disclaimer/Publisher’s Note: The statements, opinions and data contained in all publications are solely those of the individual author(s) and contributor(s) and not of MDPI and/or the editor(s). MDPI and/or the editor(s) disclaim responsibility for any injury to people or property resulting from any ideas, methods, instructions or products referred to in the content.

