Abstract
Oxy–fuel (O2/CO2) combustion technology shows great potential for carbon reduction. However, difference in the combustion atmosphere would affect coal combustion characteristics and pollutant emissions. In order to explore oxy–fuel combustion characteristics, two typical Chinese coals, sub–bituminous and lean coal, were utilized. Based on thermogravimetry and pilot–scale test, the ignition and burnout characteristics under oxy–fuel and air combustion atmosphere were investigated. Besides, the NOx emission characteristics were also investigated on the pilot–scale test. Through experimental results, these two kinds of coal showed different combustion characteristics, mainly due to differences in coal quality. Compared with air combustion, oxy–fuel combustion affected the coal combustion process. Firstly, the ignition temperature of sub–bituminous and lean coal decreased from 418 and 477 °C to 405 and 415 °C, respectively; the burnout temperature also decreased from 855 and 985 °C to 808 and 838 °C, respectively. Then, coal combustion performance was evaluated by comprehensive combustion characteristics (S); with an increase in S from, respectively, 3.659 and 2.013 to 4.826 and 3.545 × 10⁻⁸(min−2 × K−3), the combustion performance significantly improved. Then, the char burnout time was advanced for 1~3 min. Similar results were obtained on the pilot–scale test. The ignition temperatures decreased from 505 and 552 to 490 and 512 °C, respectively. Moreover, the char burnout rate increased by 0.5~5% and 2~11%, respectively. Lastly, the NOx concentration in flue gas was 2.2~2.6 and 2.0~2.3 times higher for the two kinds of coal under oxy–fuel combustion.
1. Introduction
With the rapid development of the global economy, there will be further demand for electricity in the future. According to a report from the International Energy Agency [], global electricity demand grew by more than 6% in 2021, and coal–fired power plants covered more than half of that demand. Despite the growing share of renewable energy, coal–fired power generation still provides about one–third of the world’s electricity and its dominance is hard to replace in the short term. However, the use of fossil fuels would cause serious environmental problems and is not conducive to sustainable development. Nowadays, global warming is becoming increasingly serious due to huge CO2 emissions. The greenhouse effect will lead to melting glaciers and frozen soil and rising sea level, which will not only harm the balance of natural ecosystems, but also affect human health and even threaten human survival. Besides, large amounts of pollutants such as NOX and SO2 will pollute the atmosphere and cause acid rain, posing significant challenges to human survival. As the world’s largest carbon emitter, China has pushed aggressively to reduce carbon emissions. In September 2020, President Xi Jinping announced at the United Nations General Assembly that China would achieve carbon peaking by 2030 and carbon neutrality by 2060; this goal demonstrates China’s confidence and determination in addressing climate change issues. However, China’s CO2 emissions in 2019 were about 9.8 Gt, of which coal–related CO2 emissions accounted for about 75.4%, as coal has dominated China’s carbon emissions []. Therefore, it is urgent to promote low–carbon and clean coal–fired power plants.
In order to facilitate the transformation, the most effective way is to improve the efficiency further and reduce coal consumption of power plants, which can radically solve the problem. As we all know, the water vapor Rankine cycle is commonly used for power generation, and its thermal efficiency has hit a bottleneck so far. Further improvement in thermal efficiency requires an increase in the vapor temperature entering the tube, but vapor at an ultra–high temperature, such as 700 °C, would react with metal materials [], which limits further improvement in thermal efficiency. The supercritical carbon dioxide Brayton cycle (S–CO2 cycle) power generation technology has recently become a research hotspot in the power industry, where the Brayton cycle replaces the Rankine cycle to achieve higher thermal efficiency. Compared to the conventional water vapor Rankine cycle, the S–CO2 cycle has several significant advantages: high efficiency in the mild turbine inlet temperature zone and a compact system including turbo machinery and heat exchangers, suitable for several heat sources, including nuclear power, fossil fuels, waste heat, and solar []. However, the application of S–CO2 cycle to coal–fired power plants is limited to conceptual designs [,], which means its future industrial application will take time.
In addition, another effective way to reduce CO2 emissions is to combine coal power with renewable energy, which can replace coal–fired power generation and promote energy recycling. For example, biomass is regarded as a carbon–neutral renewable energy, and its co–firing with coal is a relatively fast and effective technique for partial decarbonization of coal–fired power plants []. However, the difference in fuel characteristics between coal and biomass results in engineering and environmental problems associated with the treatment and supply of fuel, slagging, fouling, and corrosion of the heating surfaces [], if co–firing is introduced in coal–fired power plants. Therefore, circulating fluidized bed (CFB) technology seems to be the most suitable for co–firing biomass and coal due to its excellent fuel flexibility []. Over the past few decades, CFB has been widely applied in areas of energy conversion, such as coal combustion and gasification. It has also been reported that CFB power plants of different sizes could operate effectively and efficiently with a range of biomass types and loads in co–firing applications, with lower net CO2 emissions compared to coal as the sole fuel and only a slight fall in efficiency for electricity generation []. Additionally, CFB, as a clean combustion technology, has the advantages of good combustion at low temperatures and air–staged combustion. Compared to conventional boilers, CFB is also a method that can effectively reduce NOx emissions, ensuring that pollutant emissions more easily meet standards [,,].
Finally, the separation of CO2 from flue gas is a critical issue in the treatment of CO2. Carbon capture, storage, and utilization (CCUS) is an internationally recognized advanced carbon reduction technology, and its application in coal-fired power plants would have great prospects []. Generally, carbon capture is the core step of CCUS, accounting for more than 70% of the cost in the whole technology chain. According to different capture stages, there are three main methods: pre–combustion, in–combustion (also called oxy–fuel combustion), and post–combustion []. Among them, oxy–fuel combustion technology is superior in retrofitting the existing power plants only with the addition of ancillary equipment, including air separation and CO2 purification and compression unit; it has a comparatively lower capture cost and the largest potential for CO2 capture [,]. Oxy–fuel combustion as a new combustion technology refers to utilizing the mixture of pure oxygen and recycled flue gas instead of air as a combusting agent, after which a gas consisting mainly of CO2 and H2O is generated that is ready for sequestration without stripping the CO2 from the flue gas. As for conventional air combustion, only 10~20% CO2 is present as a dilute gas in the flue gas, resulting in costly capture using amine absorption. However, several successfully operated oxy–fuel industrial demonstrations and commercial projects have generally obtained a flue gas stream with 90% CO2 []. Evidently, CO2 capture is more easily achieved from a concentrated CO2 stream. In conclusion, the development of oxy–fuel combustion technology is an effective means to promote CO2 emission reduction.
Although oxy–fuel combustion is beneficial for achieving low carbon emissions, the presence of high–concentration CO2 in the combustion atmosphere would affect the coal combustion process, which should not be negligible. Indeed, oxy–fuel combustion has been studied for decades. Many studies have reported that CO2 has an effect on coal pyrolysis [,], combustion [,,,], and pollutant formation [,]. However, the reported results are inconsistent due to the differences in coal quality and experimental conditions. Differences in coal types would affect combustion characteristics and pollutants release. Besides, experimental results would also be different due to the different reaction chamber and flow conditions [,] during the reaction, which limits the reported research. Until now, many existing studies on oxy–fuel combustion are basic research based on thermogravimetry using a single coal particle. However, it is necessary to carry out a pilot–scale test that simulates the combustion of pulverized coal particle groups in the actual boiler to apply oxy–fuel combustion technology. Therefore, it is practical to study the oxy–fuel combustion characteristics of specific coals from thermogravimetric experiments to more extensive scale tests; these efforts contribute to the industrial application of oxy–fuel combustion technology.
Therefore, two typical Chinese coals used in power plants were chosen as experimental materials, including sub–bituminous and lean coal. Comparative experimental studies were conducted under simulated oxy–fuel and air atmospheres to investigate oxy–fuel combustion characteristics. First, the ignition and burnout characteristics of pulverized coal were studied using a thermogravimetric analyzer. Furthermore, a pilot–scale test, closer to engineering practice, was carried out using an electric heating pulverized coal combustion experimental furnace to explore the oxy–fuel combustion characteristics of the pulverized coal particle group, including ignition, burnout, and NOx emission. Objectively, thermogravimetric experiments and pilot–scale tests agreed and proved that oxy–fuel combustion can promote ignition and burnout. Moreover, the NOx emission in flue gas was higher under oxy–fuel combustion.
2. Experiment
2.1. Experimental Materials
In order to explore the impact of differences in coal types, two typical Chinese coals, including sub–bituminous and lean coals, were selected. The proximate analysis and ultimate analysis are shown in Table 1.

Table 1.
Proximate and ultimate analysis of coal.
2.2. Experimental Process
In order to study oxy–fuel combustion characteristics, a comparative experiment of air combustion is required. Therefore, two types of coal and two combustion atmospheres were adopted in this work. Different coal types and combustion atmospheres were adopted to form different experiments: sub–bituminous coal + oxy–fuel, sub–bituminous coal + air, lean coal + oxy–fuel and lean coal + air. Besides, experimental studies are carried out on a thermogravimetric and pilot–scale setup.
2.2.1. Thermogravimetric Experiment
Thermogravimetry is a relatively mature and reliable technique that helps to understand the thermal behavior of coal. Therefore, experiments were performed on an infrared–thermogravimetric analyzer (METTLER) to understand how oxy–fuel combustion can affect coal combustion. The experimental steps are as follows:
- Sample pretreatment: coal samples were dried at 45 °C for 8 h in N2 to remove external water from coal samples. Then, samples were sieved using a 200–mesh standard sieve to obtain pulverized coal particles with a size <75 μm. By drying under N2 at 105 °C for 1.5 h, the internal water in coal can be removed.
- Coal ignition experiment: a certain amount of pulverized coal (15–20 mg) was weighed and put in the thermogravimetric analyzer. During the experiment, the temperature increase rate was controlled at 40 °C/min, and the temperature increased from room temperature to the final temperature of 1100 °C. The gas flow rate was adjusted to simulate two different atmospheres: oxy–fuel (CO2:O2 = 74:26) and air (N2:O2 = 79:21), and the reaction gas flow rate was 3.1 mL/s. Besides, N2 was used as the purge gas at a flow rate of 0.78 mL/s.
- Char burnout experiment: coal samples were heated in an N2 environment at 900 °C for 7 min to obtain char by fully removing the volatiles. Then, it was placed in a thermogravimetric analyzer. Similarly, the temperature increased linearly to the final temperature (700, 800, 900 °C). When the final temperature was reached and kept stable, the atmosphere was quickly switched as step (2). After that, the char was held at the final temperature for 36 min until it was fully burned out.
2.2.2. Pilot–Scale Test
To simulate the conditions in an actual industrial process, an electrically heated furnace is used for pulverized coal particle group combustion characterization, as shown in Figure 1.
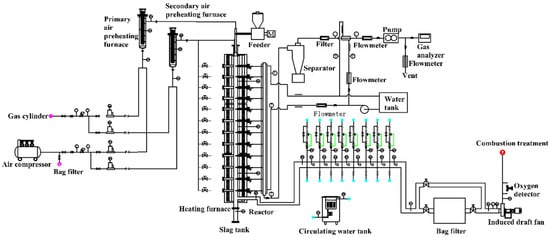
Figure 1.
Sketch of the electrically heated pulverized furnace experimental system to study the coal combustion characteristics.
The above system is suitable for pulverized coal particle group, with a designed powder amount of 0.1~0.5 kg/h. The system can be maintained for a long time under high temperatures ranging from 800 to 1200 °C due to an external electric heating source. The structure and function of each part of the system are as follows:
- Body: including furnace body, electric heating system (silicon molybdenum rod, transformer, etc.), fire observation port, temperature measurement port, gas sampling port, adsorbent injection port, and high–temperature sampling port for smoke and dust.
- Fuel and combustion systems: including pulverized coal feeding and metering devices, burners, etc.
- Air supply system: including air supply fan, primary air pipeline, secondary air pipeline, primary wind power heater, secondary wind power heater, flow meter, manual adjustment valve, compressed air pipeline, etc.; because the oxygen–enriched combustion test needs to use different concentrations of O2/CO2. For gas distribution, the original air supply pipeline was modified and air compressor was not involved. The O2/CO2 cylinders after decompression through the corresponding mass flow meters are used for precise gas distribution.
- Flue gas system: including tail flue, manual adjustment valve, bag filter, induced draft fan, etc.
- Cooling system: including flue gas cooler, feed pipe, water pump, flow meter, electric regulating valve, return pipe, cooling tower, etc.
- Measurement and control systems: including flow, pressure, temperature, and oxygen measurement devices and PLC control systems (real–time data acquisition and processing systems, electric heating power automatic adjustment systems, and safety protection systems).
- Sampling system: including sampling tubes, cartridges, flow meters, vacuum pumps, etc.
3. Results and Discussion
3.1. Thermogravimetric Experiment Analysis
3.1.1. Coal Ignition Characteristics
Ignition is the initial stage of the combustion process and can influence flame stability, extinction, and subsequent combustion status. In engineering practice, the ignition characteristics of coal particles are crucial for boiler design and combustion control []. Figure 2 and Figure 3 show mass change vs. temperature (TG), mass change rate vs. temperature (DTG), and temperature difference between reference and sample vs. temperature (DTA) of coal combustion under oxy–fuel and air atmosphere. Apparently, the presented TG and DTG curves of sub–bituminous coal and lean coal are roughly similar to the trend of TG and DTG in other studies [,], with nothing unusual happening, which proves the reliability of the experimental results and ensures that subsequent analysis based on TG and DTG is meaningful.
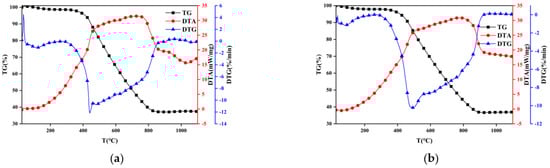
Figure 2.
TG, DTG, and DTA curves of thermogravimetric experiment. (a) Sub–bituminous coal + oxy–fuel; (b) sub–bituminous coal + air.
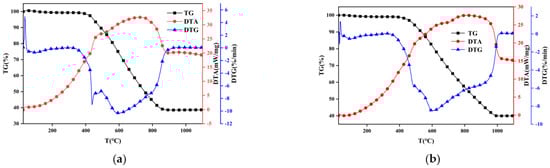
Figure 3.
TG, DTG, and DTA curves of thermogravimetric experiment. (a) Lean coal + oxy–fuel; (b) lean coal + air.
Through thermogravimetric experiments, TG, DTG, and DTA curves were obtained under different coal types and combustion atmospheres during combustion. Then, TG, DTG, and DTA of the four different experimental groups are put together for analysis to clarify the effect of coal quality and combustion atmosphere. The results are shown in Figure 4, Figure 5 and Figure 6.
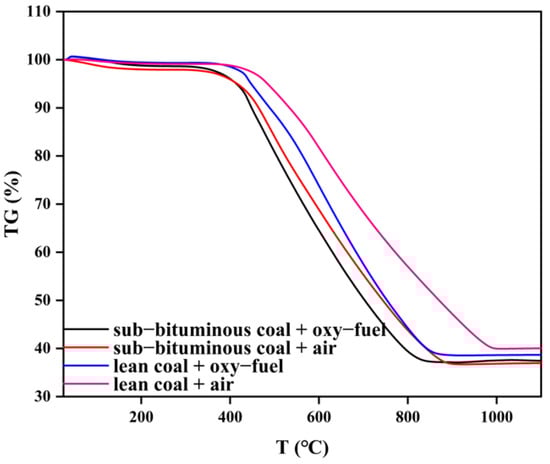
Figure 4.
TG curves under different coal quality and atmosphere.
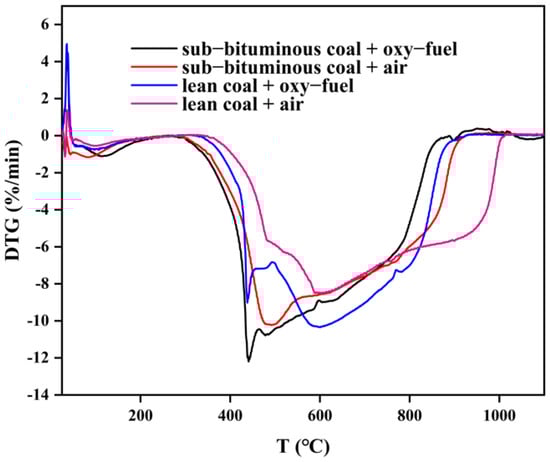
Figure 5.
DTG curves under different coal quality and atmosphere.
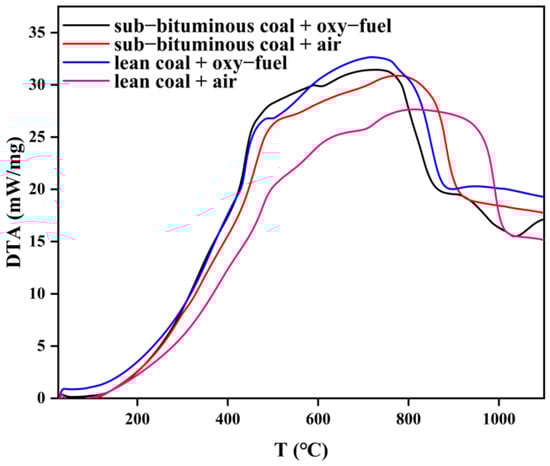
Figure 6.
DTA curves under different coal quality and atmosphere.
In Figure 4, the four TG curves differ from each other. It can be seen that the slope of the TG curve for sub–bituminous coal is larger, indicating that its mass loss is faster. Meanwhile, total mass loss is greater for sub–bituminous coal. Due to the increase of the amount of in the oxy–fuel atmosphere, the TG slope further increases; thus, mass loss is further accelerated, and this effect is more evident for lean coal. In Figure 5, DTG curves are also different, indicating mass loss rate varies from each other. As can be seen, the peak size of DTG and the corresponding temperatures are different. The peak mass loss rate of sub–bituminous coal is larger and located in the relatively low temperature range. Sub–bituminous coal has a lower coalification degree due to the higher volatile content and facilitates the release of volatile components. As the combustion atmosphere varies, the peak increases and shifts toward lower temperatures. This indicates that volatile release as well as char combustion is promoted under oxy–fuel combustion. Furthermore, the ignition mode can also be determined by TG/DTG curves. There are three ignition modes: homogeneous, heterogeneous, and hetero–homogeneous []. In Figure 4 and Figure 5, only one obvious peak on DTG curves under air combustion was observed. Besides, the mass loss segment on TG curves is smooth, which belongs to heterogeneous ignition. However, under oxy–fuel combustion, two peaks appear on DTG curves, corresponding to volatile release and char combustion, which belong to homogeneous ignition. The variation in combustion atmospheres leads to a difference in ignition mode. Due to the increase in O2 concentration, the volatile release is accelerated; the volatile release rate is also faster than the particle surface heating rate. Meanwhile, the presence of CO2 inhibits the combustion of char and delays char ignition. Figure 6 shows a significant difference in DTA curves, indicating that heat release during coal combustion is variable. The area between the DTA curve and X–axis can represent the heat release during the combustion process. However, the weight of samples in the four experimental groups differs; the area divided by the amount can be used to measure heat release. The result is that sub–bituminous coal + air > lean coal + oxy–fuel > sub–bituminous coal + oxy–fuel > lean coal + air. Although lean coal has a higher calorific value, its high coalification degree makes the combustion condition poor under air atmosphere. Therefore, the heat release of lean coal is less than sub–bituminous coal under air combustion. When the combustion atmosphere varies, the heat release of lean coal is more. This can be explained as the gasification reaction occurs due to the improvement of the combustion condition by CO2. As for sub–bituminous coal, the condition is already good under air combustion, but the gasification reaction is endothermic, which reduces heat release.
The characteristic temperatures during the combustion process are generally obtained through the TG/DTG method. According to this method, ignition temperature can be determined. In Figure 7, there is a peak point A on the DTG curve, and the temperature of point A is peak temperature Tp. Then, a vertical line is drawn through point A and intersects at point B on the TG curve. Next, a tangent line is drawn through point B to the TG curve; it intersects with the parallel line of the mass loss starting at point C, called the ignition point. Its temperature is ignition temperature Ti. In addition, burnout temperature Tb is also important. When mass loss reaches 98% total mass loss on the TG curve, the corresponding point is the burnout point.
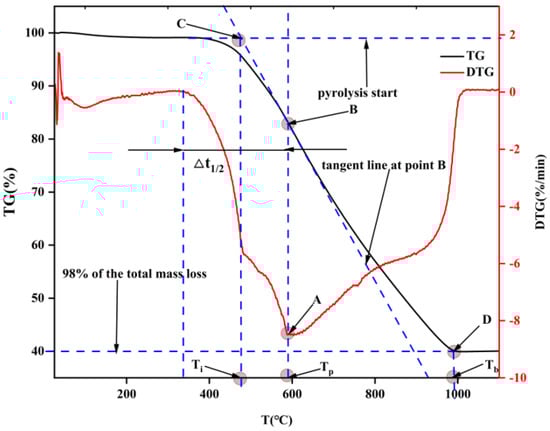
Figure 7.
Determination of the temperature characteristics.
Several indexes are proposed to describe coal combustion status. Among them, the comprehensive combustion characteristics index S is wildly applicable [], which considers both ignition and burnout temperature, and thus, can comprehensively assess coal combustion performance. The definition of S is shown in Equation (1), and a larger S represents better combustion status:
In the above equation, (dm/dt)max, (dm/dt)mean are maximum and mean conversion rate during combustion. These characteristic parameters obtained from TG/DTG curves and comprehensive combustion index S are shown in Table 2.
Table 2.
Characteristics parameters and evaluation index S in the combustion process.
As shown above, Ti, Tb and ti, tb are lower for sub–bituminous coal under the same combustion atmosphere. Besides, (dm/dt)max and (dm/dt)mean are higher compared to lean coal, regardless of oxy–fuel or air atmosphere. However, when the combustion atmosphere varied from air to oxy–fuel, Ti and Tb both decreased, and ti and tb further reduced. This phenomenon verified that oxy–fuel combustion could improve coal combustion. Similarly, the increase in S under an oxy–fuel atmosphere can also prove this.
3.1.2. Char Burnout Characteristics
The coal combustion process mainly includes volatile release and subsequent char combustion. However, char combustion is the slowest step of the overall coal combustion process and affects the residence time and, therefore, the heat transfer and efficiency []. In general, studying how oxy–fuel combustion can affect char combustion is necessary. Figure 8, Figure 9 and Figure 10 present TG curves during combustion at different temperatures.
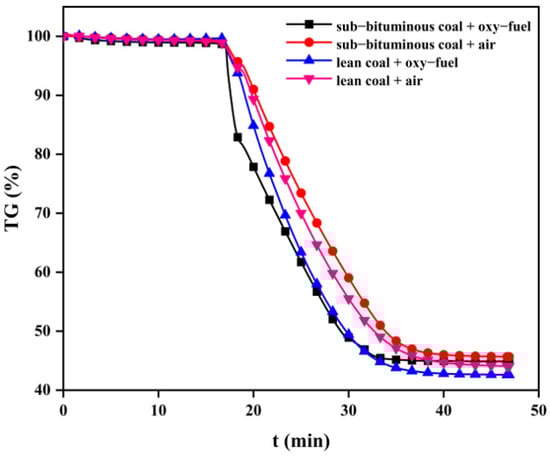
Figure 8.
TG curves during the combustion process of char at 700 °C.
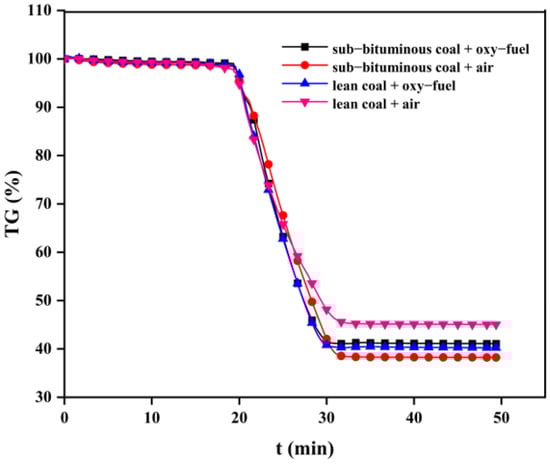
Figure 9.
TG curves during the combustion process of char at 800 °C.
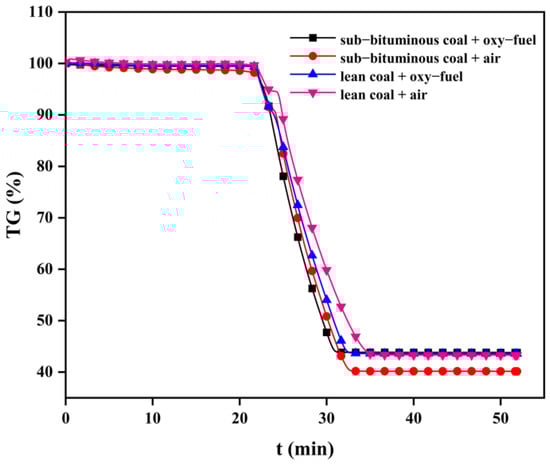
Figure 10.
TG curves during the combustion process of char at 900 °C.
As can be seen, char combustion behaviors are distinct with different coal types and combustion atmospheres. The TG curve slope of sub–bituminous coal is significantly higher than lean coal. This can be explained by sub–bituminous coal being more volatile; hence, its char has developed a pore structure that can provide more reaction sites for O2 and CO2. In addition, under oxy–fuel combustion, the TG curve slope increased significantly because the gasification reaction of CO2 occurred to increase char consumption. The overall mass loss rate increased as the temperature changed from 700 to 900 °C. It can be explained that the combustion process of char involves several chemical reactions and the breakage of chemical bonds requires enough heat; thus, a higher temperature can provide more heat and enhance molecular thermal motion. The burnout time can be regarded as the time corresponding to mass loss on the TG curve no longer changing. As shown in Table 3, sub–bituminous coal burned out faster than lean coal. When the combustion atmosphere was changed to oxy–fuel, the sub–bituminous and lean coal burnout times were shortened by 1~3 min and 1~2 min, respectively. There is no doubt that oxy–fuel improves char combustion. Moreover, as the temperature varied from 700 to 900 °C, burnout time was reduced by about half. This phenomenon indicated that increased reaction temperature could also improve char combustion.
Table 3.
The burnout time (min) under different conditions.
In this work, R (specific reaction rate) is used to describe the reaction rate during char combustion. R is defined as Equation (2):
where is the char conversion, %, and t is the reaction time, s. R vs. can be obtained from the TG curve. The results are shown in Table 4. R10, R30, R50, R70, and R90 represent the corresponding specific reaction rate for = 0.1, 0.3, 0.5, 0.7, and 0.9, respectively. It was evident that R decreased gradually with the increase of , because char is constantly consumed. In addition, sub–bituminous coal had higher R than lean coal under oxy–fuel and air atmospheres, but the difference became smaller as increased. It can also be seen that R increased when the combustion atmosphere changed to oxy–fuel, because the presence of CO2 can consume char through a gasification reaction. Since the gasification reaction of CO2 is endothermic, the gasification reaction becomes stronger. As the reaction temperature is increased, a higher specific reaction rate is realized.
Table 4.
Variation of specific reaction rate R during char combustion.
3.2. Analysis of Pilot–Scale Test
3.2.1. Ignition Characteristics
When pulverized coal is thrown into the furnace chamber, if the flue gas temperature does not rise significantly (temperature rise rate below 0.4 °C/s), it is considered that it has not yet ignited. Then, when the temperature rise rate reaches 0.4 °C/s or more, it is assumed to have ignited, and the corresponding flue gas temperature is the ignition temperature. The results are shown in Figure 11 and Figure 12. Obviously, the ignition temperature of sub–bituminous coal is lower than that of lean coal. Moreover, the ignition temperature decreased for oxy–fuel combustion, 15 °C lower for sub–bituminous coal and 40 °C lower for lean coal, indicating that oxy–fuel combustion promotes the ignition process.
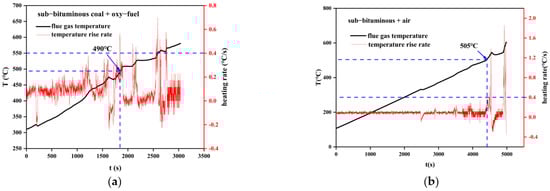
Figure 11.
Variation of flue gas temperature during coal combustion. (a) Sub–bituminous coal + oxy–fuel; (b) sub–bituminous coal + air.
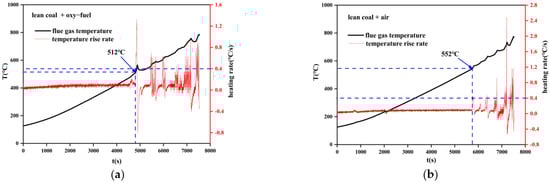
Figure 12.
Variation of flue gas temperature during coal combustion. (a) Lean coal + oxy–fuel; (b) lean coal + air.
3.2.2. Char Burnout Characteristics
The ash mass of pulverized coal is assumed to be constant during combustion. Therefore, the ash content of the fly ash is measured for each test condition based on the ash tracer method, and the char burnout rate B is calculated using Equation (3) to evaluate the burnout characteristics of pulverized coal:
where A0 is the raw coal dry basis ash, %, and A is the fly ash dry basis ash, %.
In Figure 13, under temperatures ranging from 900 to 1100 °C, the burnout rate of sub–bituminous coal under oxy–fuel combustion increased 0.5~5% compared to air combustion. Similarly, lean coal is 2~11% higher under temperatures ranging from 1000 to 1200 °C. This indicates that oxy–fuel combustion makes char combustion better.
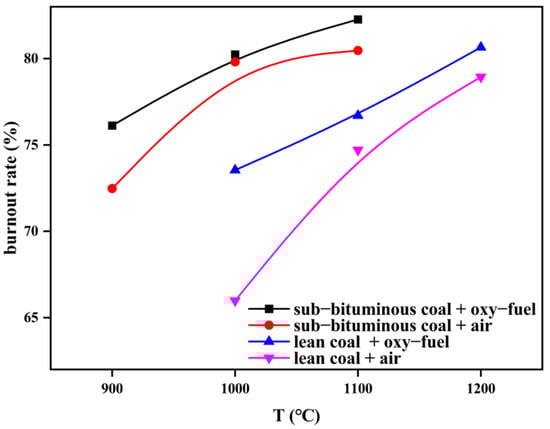
Figure 13.
Char burnout rate of different coal types under different combustion atmospheres.
Besides, under temperatures ranging from 1000 to 1100 °C, the burnout rate of sub–bituminous coal is 7~10% higher than that of lean coal under oxy–fuel combustion and 7~20% higher under air combustion, which indicates that the combustion characteristics of sub–bituminous coal are better. The difference between them gradually decreases as the temperature increases.
3.2.3. NOx Emission
NOx is a typical pollutant produced during coal combustion. Under oxy–fuel combustion, high concentrations of O2 and CO2 have an important effect on the formation of NOx []. During the test, flue gas is collected to analyze the content of different components, such as CO and NO. In order to evaluate the NOx emission, flue gas composition was converted to mass concentration measured as NO2 in dry flue gas at the standard condition and O2 = 6% by Equation (4):
where : mass concentration of NOx under specified conditions, mg/m3 (O2 = 6%), : NO volumetric concentration of the actual measured dry flue gas, ppm, : NO2 volumetric concentration of dry flue gas measured, ppm, and : measured oxygen content of dry flue gas, %.
Figure 14, Figure 15 and Figure 16 show the variation of flue gas composition collected during the combustion process for sub–bituminous coal + oxy–fuel, and it contains the result of multiple samplings under steady state. Due to the use of a screw feeder, both NOx and CO change vs. time made it difficult to intuitively evaluate the variation of NOx and CO. Therefore, the average value can be used to reflect the NOx and CO concentration. It can be observed in Figure 14, Figure 15 and Figure 16 that the CO concentration is decreased, while the NOx concentration increases. This phenomenon shows a negative correlation between CO and NOx because CO can promote NOx reduction. Besides, it can be observed that the NOx emission of sub-bituminous coal under oxy–fuel combustion is 2.2~2.6 times higher compared to air combustion under temperatures ranging from 900 to 1100 °C, as shown in Figure 17. Similarly, for lean coal, under temperatures ranging from 1000 to 1200 °C, the NOx emission is 2.0~2.3 times higher. These indicate that oxy–fuel combustion leads to higher NOx emission because a higher concentration of O2 would accelerate the oxidation reaction occurring on the char surface. Then, the temperature near coal particles increases and the release rate of N promotes, resulting in higher NOx concentration in the flue gas. However, the amount of flue gas from oxy–fuel combustion boilers is significantly less than conventional air–fired boilers due to flue gas recycling, i.e., only a quarter of the air–fired boilers. Therefore, total NOx emission under oxy–fuel combustion decreases.
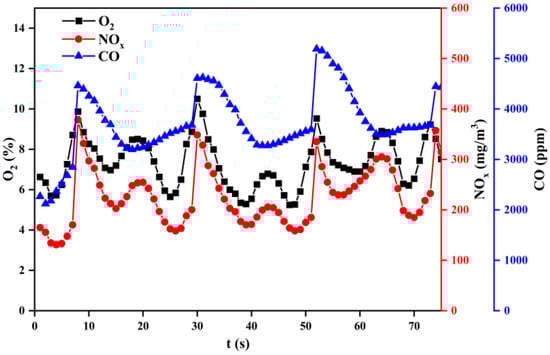
Figure 14.
Variation of flue gas composition during a combustion process at 900 °C.
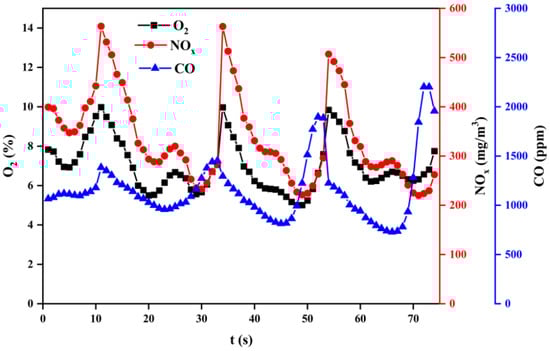
Figure 15.
Variation of flue gas composition during a combustion process at 1000 °C.
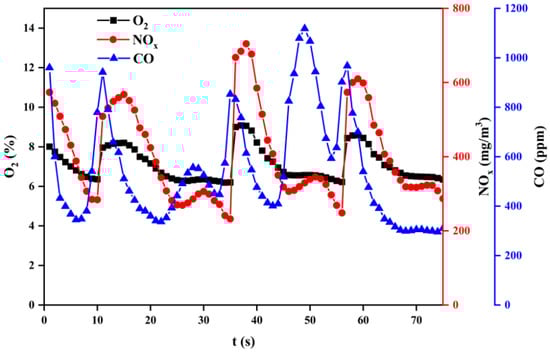
Figure 16.
Variation of flue gas composition during a combustion process at 1100 °C.
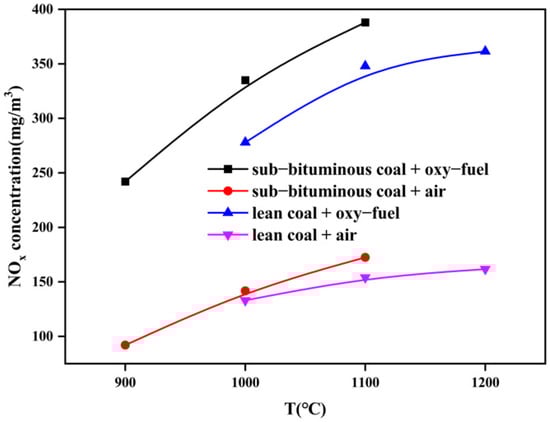
Figure 17.
Variation of NOx emission of different coal types under different combustion atmospheres.
In addition, under temperatures ranging from 1000 to 1100 °C, the NOx emission of sub–bituminous coal is about 1.1 times higher than that of lean coal under air combustion. When it is changed to oxy–fuel, the NOx emission is about 1.2 times higher. These verify that more NOx is formed during sub–bituminous coal combustion. This is because the nitrogen content is higher in sub–bituminous coal, while a higher coal rank tends to keep the fuel N in the solid phase of the char after cracking [], resulting in more fuel NOx. Besides, as the temperature increases, the NOx emission of both sub–bituminous and lean coal increases due to the fact that the consumption rate of char is accelerated and the reduction of already–formed NOx on the surface of coal char is reduced.
Regarding NOx, the role of CO and SO2 should be considered. CO is a typical reducing agent which can reduce NOx in flue gas by promoting its reduction []. As for SO2, it has been shown that the presence of SO2 would inhibit the conversion of CO to CO2, after which CO further affects NOx formation []. However, the transformation of CO at high temperatures (above 1200 K) is independent of the presence of SO2 []. In this work, the reaction temperature is 900~1200 °C, which is high enough. Additionally, the two typical coals have a low sulfur content, so SO2 does not seem not to be important. Moreover, the CO concentration will not be high under oxy–fuel and high temperatures, as shown in Figure 14, Figure 15 and Figure 16. Perhaps the inhibition effect of SO2 on CO oxidation can be ignored. To sum up, this research aims to focus on combustion characteristics and nitrogen oxide emission of typical coals in oxy–fuel atmosphere. The consideration of the interaction between the various components in the flue gas should be another work in the future.
4. Conclusions
Through thermogravimetric experiments and pilot–scale tests, the ignition, combustion, and pollutant emission characteristics under oxy–fuel combustion are expounded. The conclusions are as follows:
- Compared to lean coal, sub–bituminous coal shows better ignition and burnout performance, but higher NOx emissions, which are determined by the coal quality.
- Under oxy–fuel combustion, ignition and burnout temperature decrease, and the comprehensive combustion performance of coal improves because of the higher concentration of O2.
- Under oxy–fuel combustion, the burnout rate increases while burnout time decreases. Additionally, the specific reaction rate becomes higher due to the presence of CO2, leading to gasification.
- Under oxy–fuel combustion, NOx concentration in flue gas increases because a higher concentration of O2 promotes fuel NOx formation.
Author Contributions
Conceptualization, M.W.; Methodology, Investigation, M.W. and G.W. (Guohua Wei); Resources, Supervision, Project administration, Z.P.; Formal analysis, J.W.; Writing—original draft, M.W.; Writing—review and editing, G.W. (Guangmeng Wang), G.J., L.Z. and J.G. All authors have read and agreed to the published version of the manuscript.
Funding
This research was supported by Natural Science Foundation of Heilongjiang Province of China (JQ2022E003).
Data Availability Statement
Not applicable.
Acknowledgments
This research was funded by Huazhong University of Science and Technology.
Conflicts of Interest
The author declares no conflict of interest.
References
- Electricity Market Report-January 2022, IEA, Paris. Available online: https://www.iea.org/reports/electricity-market-report-january-2022 (accessed on 15 July 2022).
- Guan, Y.; Shan, Y. Assessment to China’s recent emission pattern shifts. Earth’s Future 2021, 9, e2021EF002241. [Google Scholar] [CrossRef]
- Murakoshi, T.; Suzuki, K. Microscopic analysis of the initiation of high-temperature damage of Ni-Based heat-resistant alloy. In International Mechanical Engineering Congress and Exposition; ASME: New York, NY, USA, 2016; Volume 50633, p. V009T12A034. [Google Scholar]
- Ahn, Y.; Bae, S.J. Review of supercritical CO2 Power cycle technology and current status of research and development. Nucl. Eng. Technol. 2015, 47, 647–661. [Google Scholar] [CrossRef]
- Le Moullec, Y. Conceptual study of a high efficiency coal-fired power plant with CO2 capture using a supercritical CO2 Brayton cycle. Energy 2013, 49, 32–46. [Google Scholar] [CrossRef]
- Xu, J.; Sun, E. Key issues and solution strategies for supercritical carbon dioxide coal fired power plant. Energy 2018, 157, 227–246. [Google Scholar] [CrossRef]
- Zhang, X.; Meloni, S. Technology Developments in the Cofiring of Biomass. In IEA; Clean Coal Centre: London, UK, 2020. [Google Scholar]
- Ryabov, G.A. Cofiring of Coal and Fossil Fuels is a Way to Decarbonization of Heat and Electricity Generation. Therm. Eng. 2022, 69, 405–417. [Google Scholar] [CrossRef]
- Giglio, R.; Wehrenberg, J. Fuel Flexible Power Generation Technology Advantages of CFB Technology for Utility Power Generation; Power Gen International: Orlando, FL, USA, 2010. [Google Scholar]
- McIlveen-Wright, D.R.; Huang, Y. A technical and environmental analysis of co-combustion of coal and biomass in fluidised bed technologies. Fuel 2007, 86, 2032–2042. [Google Scholar] [CrossRef]
- Liukkonen, M.; Hälikkä, E. Modelling of nitrogen oxide emissions in fluidized bed combustion using artificial neural networks. Int. J. Data Eng. 2010, 1, 26–35. [Google Scholar]
- Krzywanski, J.; Blaszczuk, A. Artificial intelligence treatment of NOx emissions from CFBC in air and oxy-fuel conditions. In CFB-11: Proceedings of the 11th International Conference on Fluidized Bed Technology; Chemical Industry Press: Beijing, China, 2014; pp. 619–624. [Google Scholar]
- Muskala, W.; Krzywanski, J. Model research of coal combustion in circulating fluidized bed boilers. Chem. Process Eng. 2008, 29, 473–492. [Google Scholar]
- Wei, N.; Jiao, Z. Decarbonizing the coal-fired power sector in China via carbon capture, geological utilization, and storage technology. Environ. Sci. Technol. 2021, 55, 13164–13173. [Google Scholar] [CrossRef]
- Choi, D.; Kim, H. Enhanced accessibility of carbon in pyrolysis of brown coal using carbon dioxide. J. CO2 Util 2018, 27, 433–440. [Google Scholar] [CrossRef]
- Koytsoumpa, E.I.; Bergins, C. The CO2 economy: Review of CO2 capture and reuse technologies. J. Supercrit. Fluids 2018, 132, 3–16. [Google Scholar] [CrossRef]
- Chen, L.; Yong, S.Z. Oxy-fuel combustion of pulverized coal: Characterization, fundamentals, stabilization and CFD modeling. Prog. Energy Combust. Sci. 2012, 38, 156–214. [Google Scholar] [CrossRef]
- Schdffknecht, G.; Al-Makhadmeh, L. Oxy-fuel coal combustion-A review of the current state-of-the-art. Int. J. Greenhouse Gas Control 2011, 5, S16–S35. [Google Scholar] [CrossRef]
- Duan, L.; Zhao, C. Investigation on coal pyrolysis in CO2 atmosphere. Energy Fuels 2009, 23, 3826–3830. [Google Scholar] [CrossRef]
- Luo, Y.; Ben, H. Impact of CO2 on pyrolysis products of bituminous coal and platanus sawdust. Polymers 2019, 11, 1370. [Google Scholar] [CrossRef]
- Zhou, K.; Lin, Q. Ignition and combustion behaviors of single coal slime particles in CO2/O2 atmosphere. Combust. Flame 2018, 194, 250–263. [Google Scholar] [CrossRef]
- Hecht, E.S.; Shaddix, C.R. Effect of CO2 and steam gasification reactions on the oxy-combustion of pulverized coal char. Combust. Flame 2012, 159, 3437–3447. [Google Scholar] [CrossRef]
- Zhou, Y.; Jin, X. Numerical investigation on separate physicochemical effects of carbon dioxide on coal char combustion in O2/CO2 environments. Combust. Flame 2016, 167, 52–59. [Google Scholar] [CrossRef]
- Niu, S.; Lu, C. Thermogravimetric analysis of combustion characteristics and kinetic parameters of pulverized coal in oxy-fuel atmosphere. J. Therm. Anal. Calorim. 2009, 98, 267–274. [Google Scholar] [CrossRef]
- Park, D.C.; Day, S.J. Nitrogen release during reaction of coal char with O2, CO2, and H2O. Proc. Combust. Inst. 2005, 30, 2169–2175. [Google Scholar] [CrossRef]
- Duan, L.; Zhao, C. Sulfur evolution from coal combustion in O2/CO2 mixture. J. Anal. Appl. Pyrolysis 2009, 86, 269–273. [Google Scholar] [CrossRef]
- Qu, M.; Ishigaki, M. Ignition and combustion of laser-heated pulverized coal. Fuel 1996, 75, 1155–1160. [Google Scholar] [CrossRef]
- Maffei, T.; Khatami, R. Experimental and modeling study of coal particle combustion in O2/N2 and Oxy-fuel (O2/CO2) atmosphere. Combust. Flame 2013, 160, 2559–2572. [Google Scholar] [CrossRef]
- Faúndez, J.; Arenillas, A. Ignition behaviour of different rank coals in an entrained flow reactor. Fuel 2005, 84, 2172–2177. [Google Scholar] [CrossRef]
- Liao, Y.; Ma, X. Thermogravimetric analysis of the co-combustion of coal and paper mill sludge. Appl. Energy 2010, 87, 3526–3532. [Google Scholar]
- Magdziarz, A.; Wilk, M. Thermogravimetric study of biomass, sewage sludge and coal combustion. Energy Convers. Manag. 2013, 75, 425–430. [Google Scholar] [CrossRef]
- Essenhigh, R.H.; Misra, M.K. Ignition of coal particles: A review. Combust. Flame 1989, 77, 3–30. [Google Scholar] [CrossRef]
- Vamvuka, D.; Sfakiotakis, S. Combustion behaviour of biomass fuels and their blends with lignite. Thermochim. Acta 2011, 526, 192–199. [Google Scholar] [CrossRef]
- Edge, P.; Gharebaghi, M. Combustion modelling opportunities and challenges for oxy-coal carbon capture technology. Chem. Eng. Res. Des. 2011, 89, 1470–1493. [Google Scholar] [CrossRef]
- Li, S.; Xu, Y. Measurements and modelling of oxy-fuel coal combustion. Proc. Combust. Inst. 2009, 37, 2643–2661. [Google Scholar] [CrossRef]
- Glarborg, P.; Jensen, A.D. Fuel nitrogen conversion in solid fuel fired systems. Prog. Energy Combust. Sci. 2003, 29, 89–113. [Google Scholar] [CrossRef]
- Wang, C.; Du, Y. Investigation on the NO reduction with coal char and high concentration CO during Oxy-fuel Combustion. Energy Fuels 2012, 26, 7367–7377. [Google Scholar] [CrossRef]
- Krzywanski, J.; Czakiert, T. Gaseous emissions from advanced CLC and oxyfuel fluidized bed combustion of coal and biomass in a complex geometry facility: A comprehensive model. Energy 2022, 251, 123896. [Google Scholar] [CrossRef]
- Giménez-López, J.; Martínez, M. SO2 effects on CO oxidation in a CO2 atmosphere, characteristic of oxy-fuel conditions. Combust. Flame 2011, 158, 48–56. [Google Scholar] [CrossRef]
Disclaimer/Publisher’s Note: The statements, opinions and data contained in all publications are solely those of the individual author(s) and contributor(s) and not of MDPI and/or the editor(s). MDPI and/or the editor(s) disclaim responsibility for any injury to people or property resulting from any ideas, methods, instructions or products referred to in the content. |
© 2023 by the authors. Licensee MDPI, Basel, Switzerland. This article is an open access article distributed under the terms and conditions of the Creative Commons Attribution (CC BY) license (https://creativecommons.org/licenses/by/4.0/).