
Influence of Central Air on Flow and Combustion Characteristics and Low-Load Stabilization Performance of a Babcock Burner


Abstract
:1. Introduction
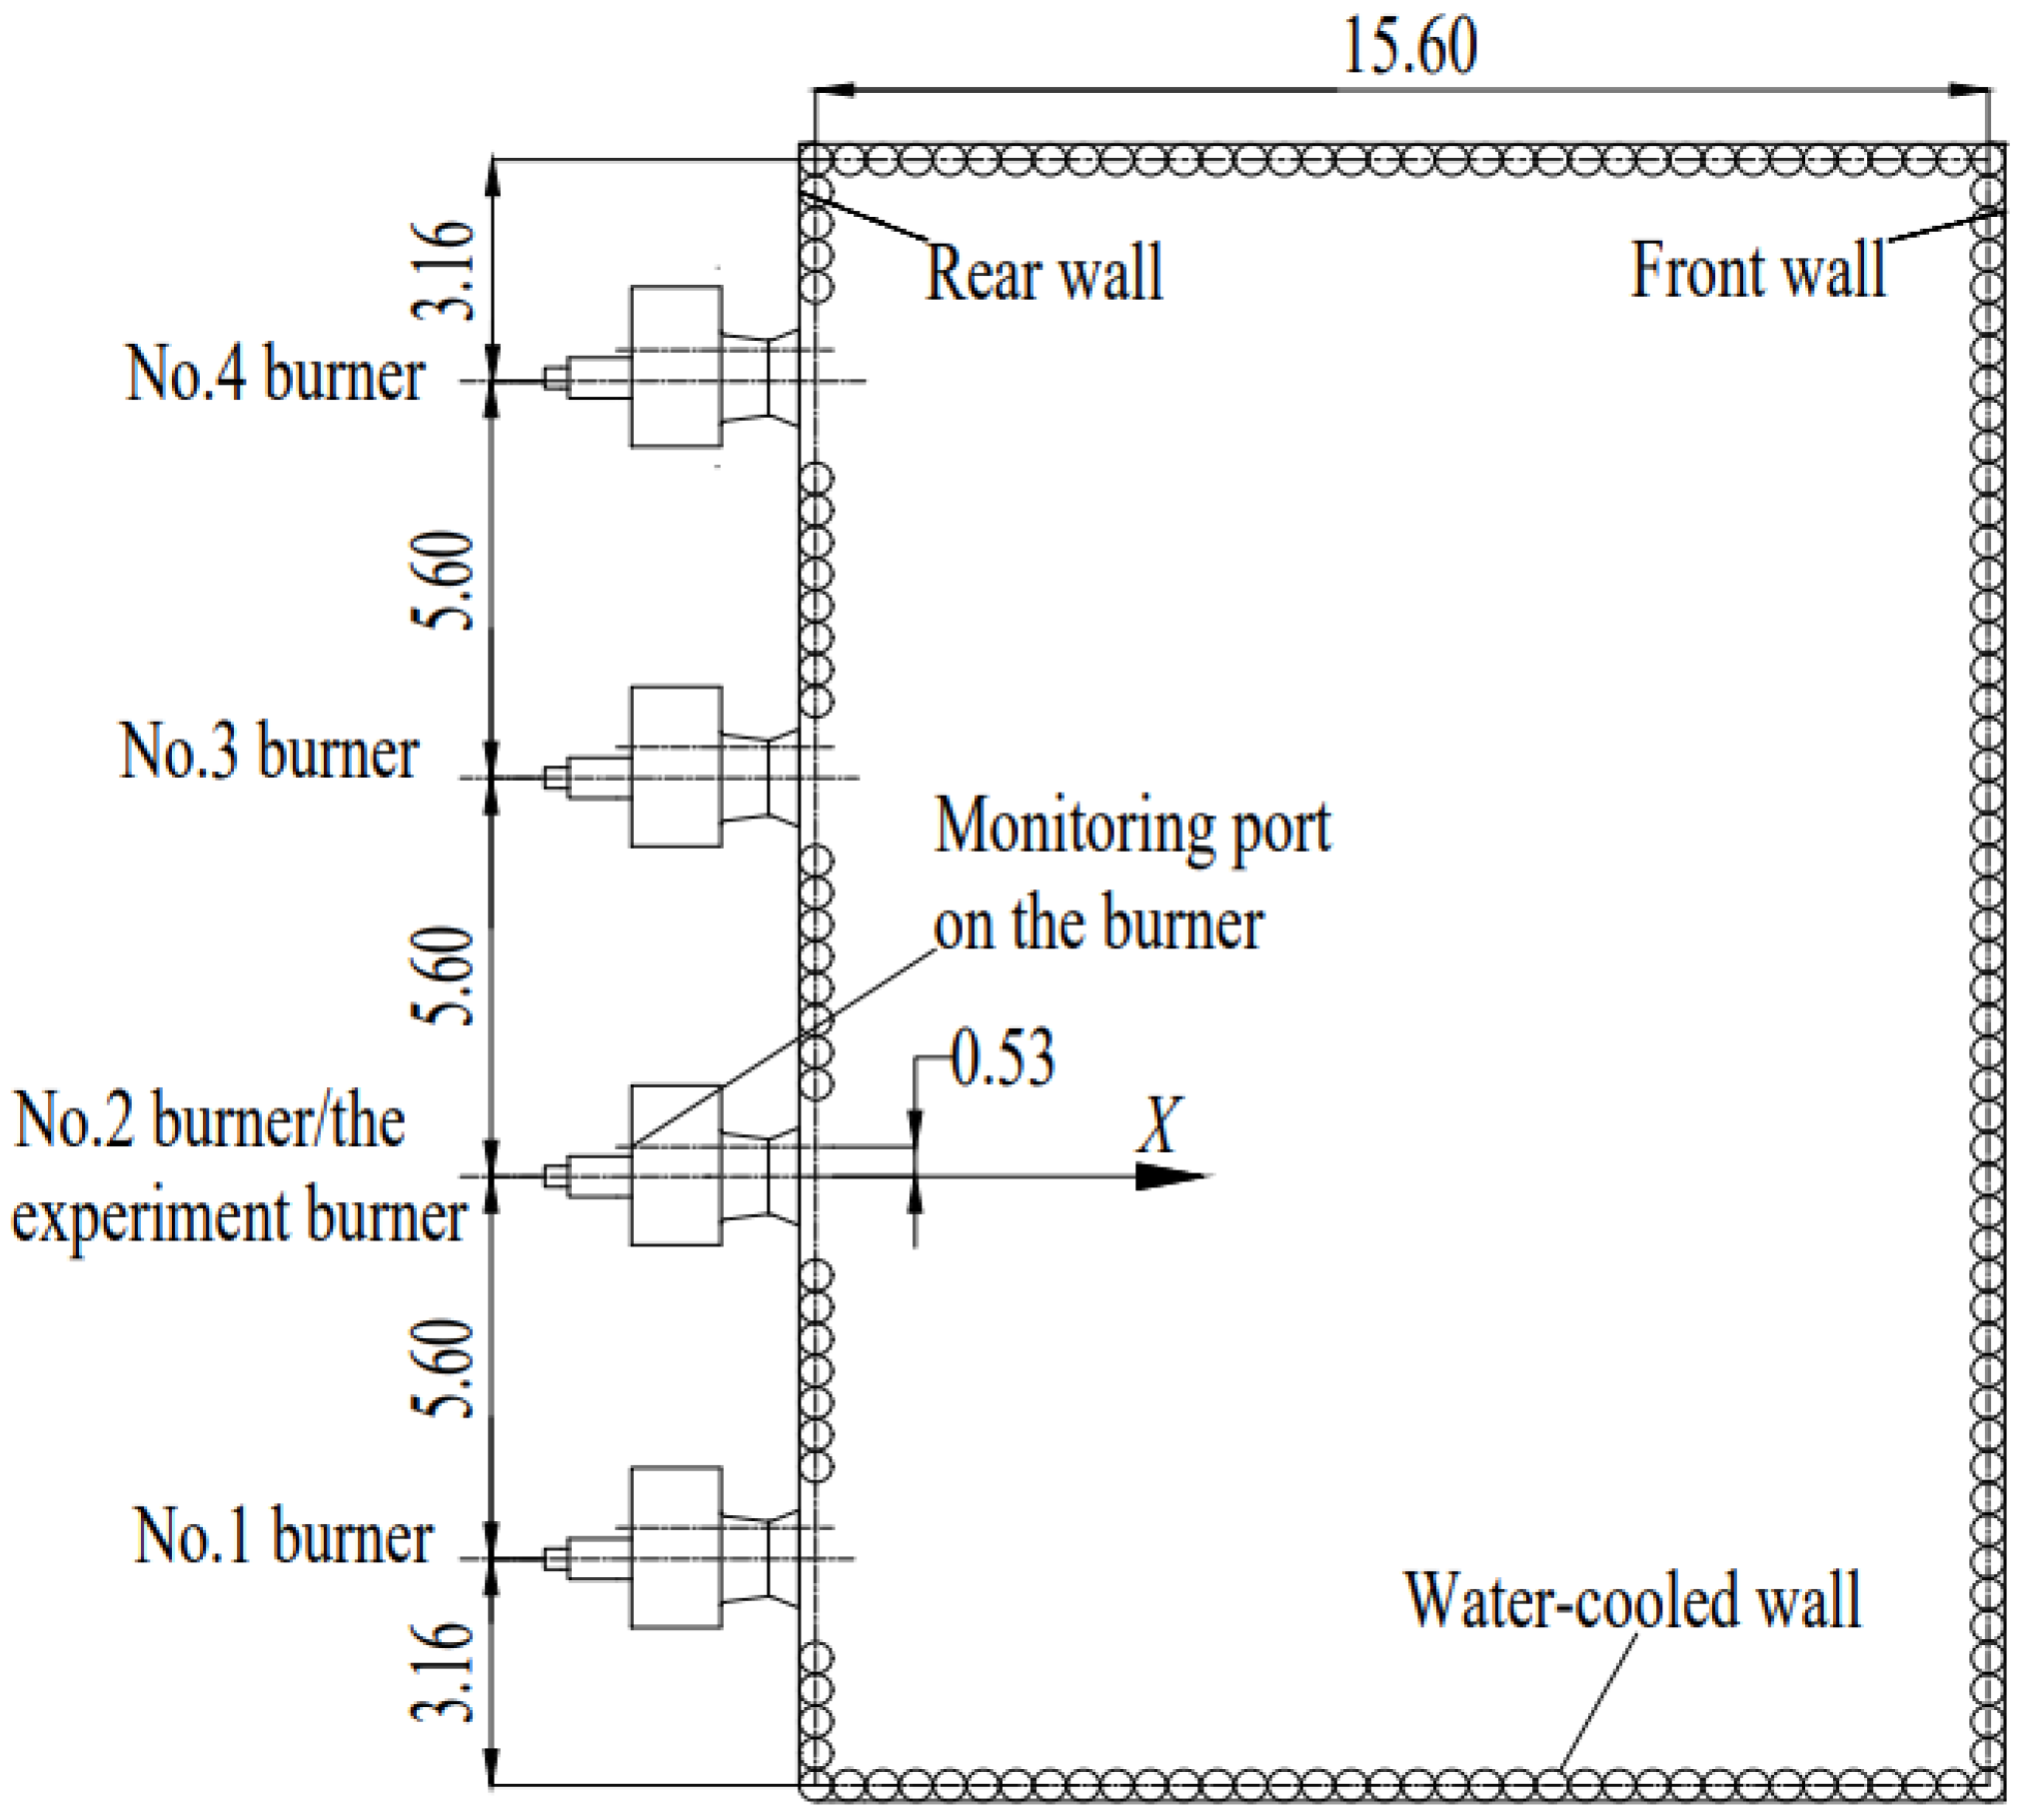
2. Utility Boiler
3. Cold Air Experiments of the Burner Model
3.1. Test Instruments and Methods
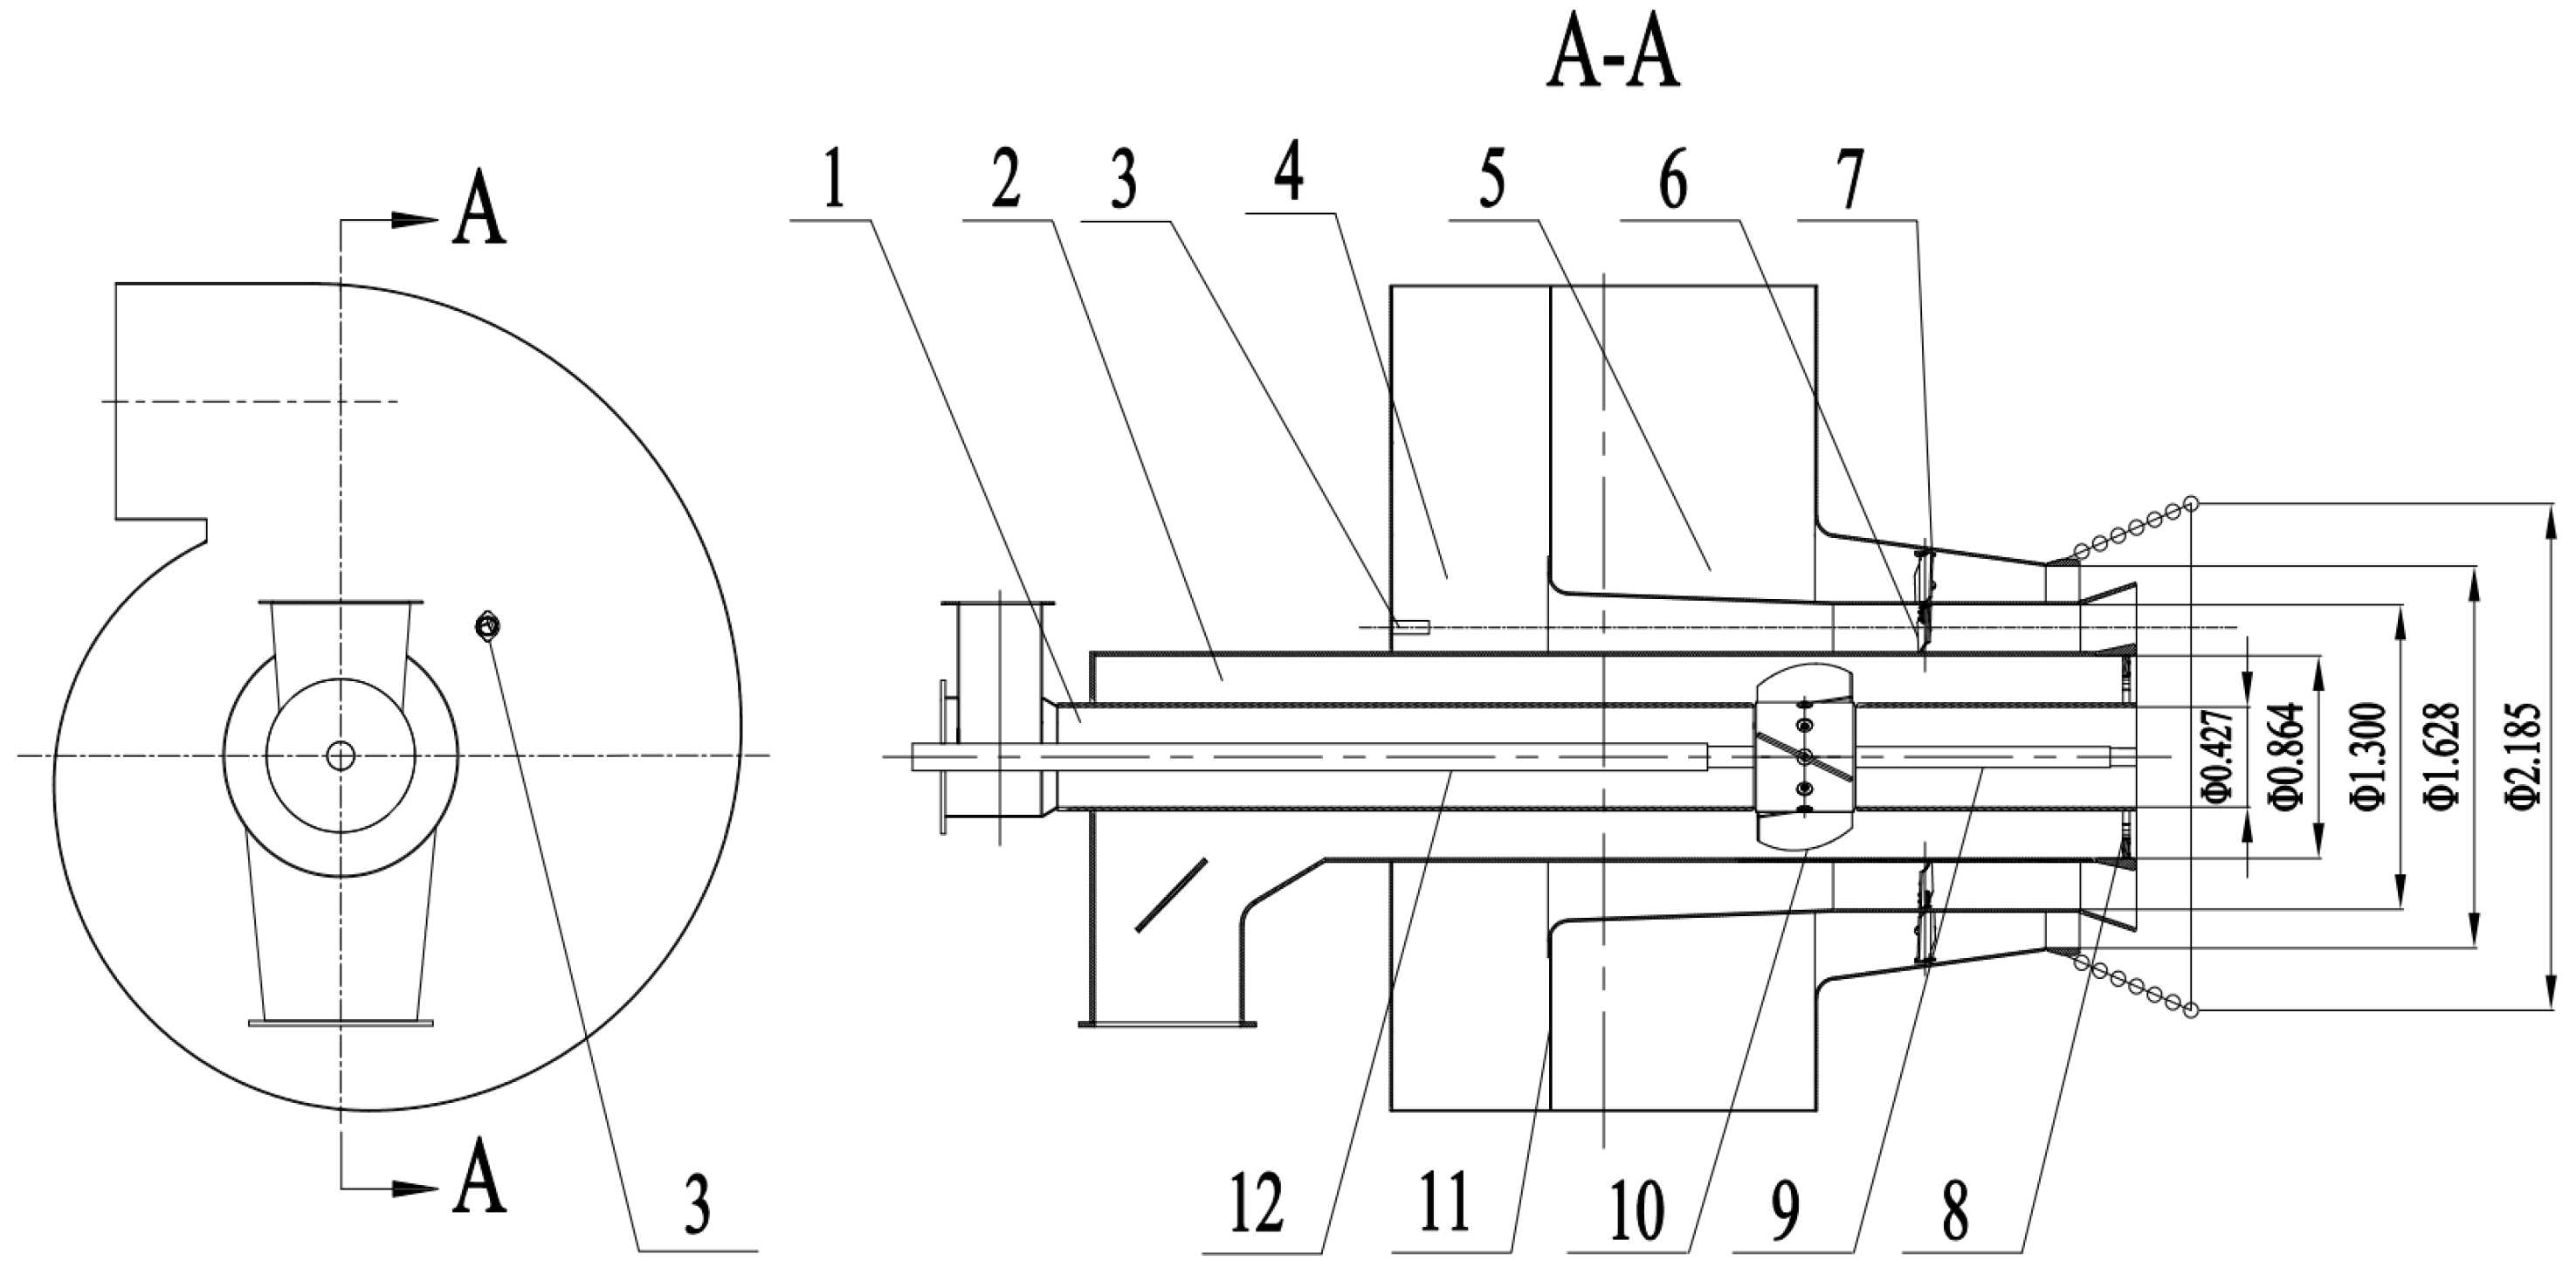
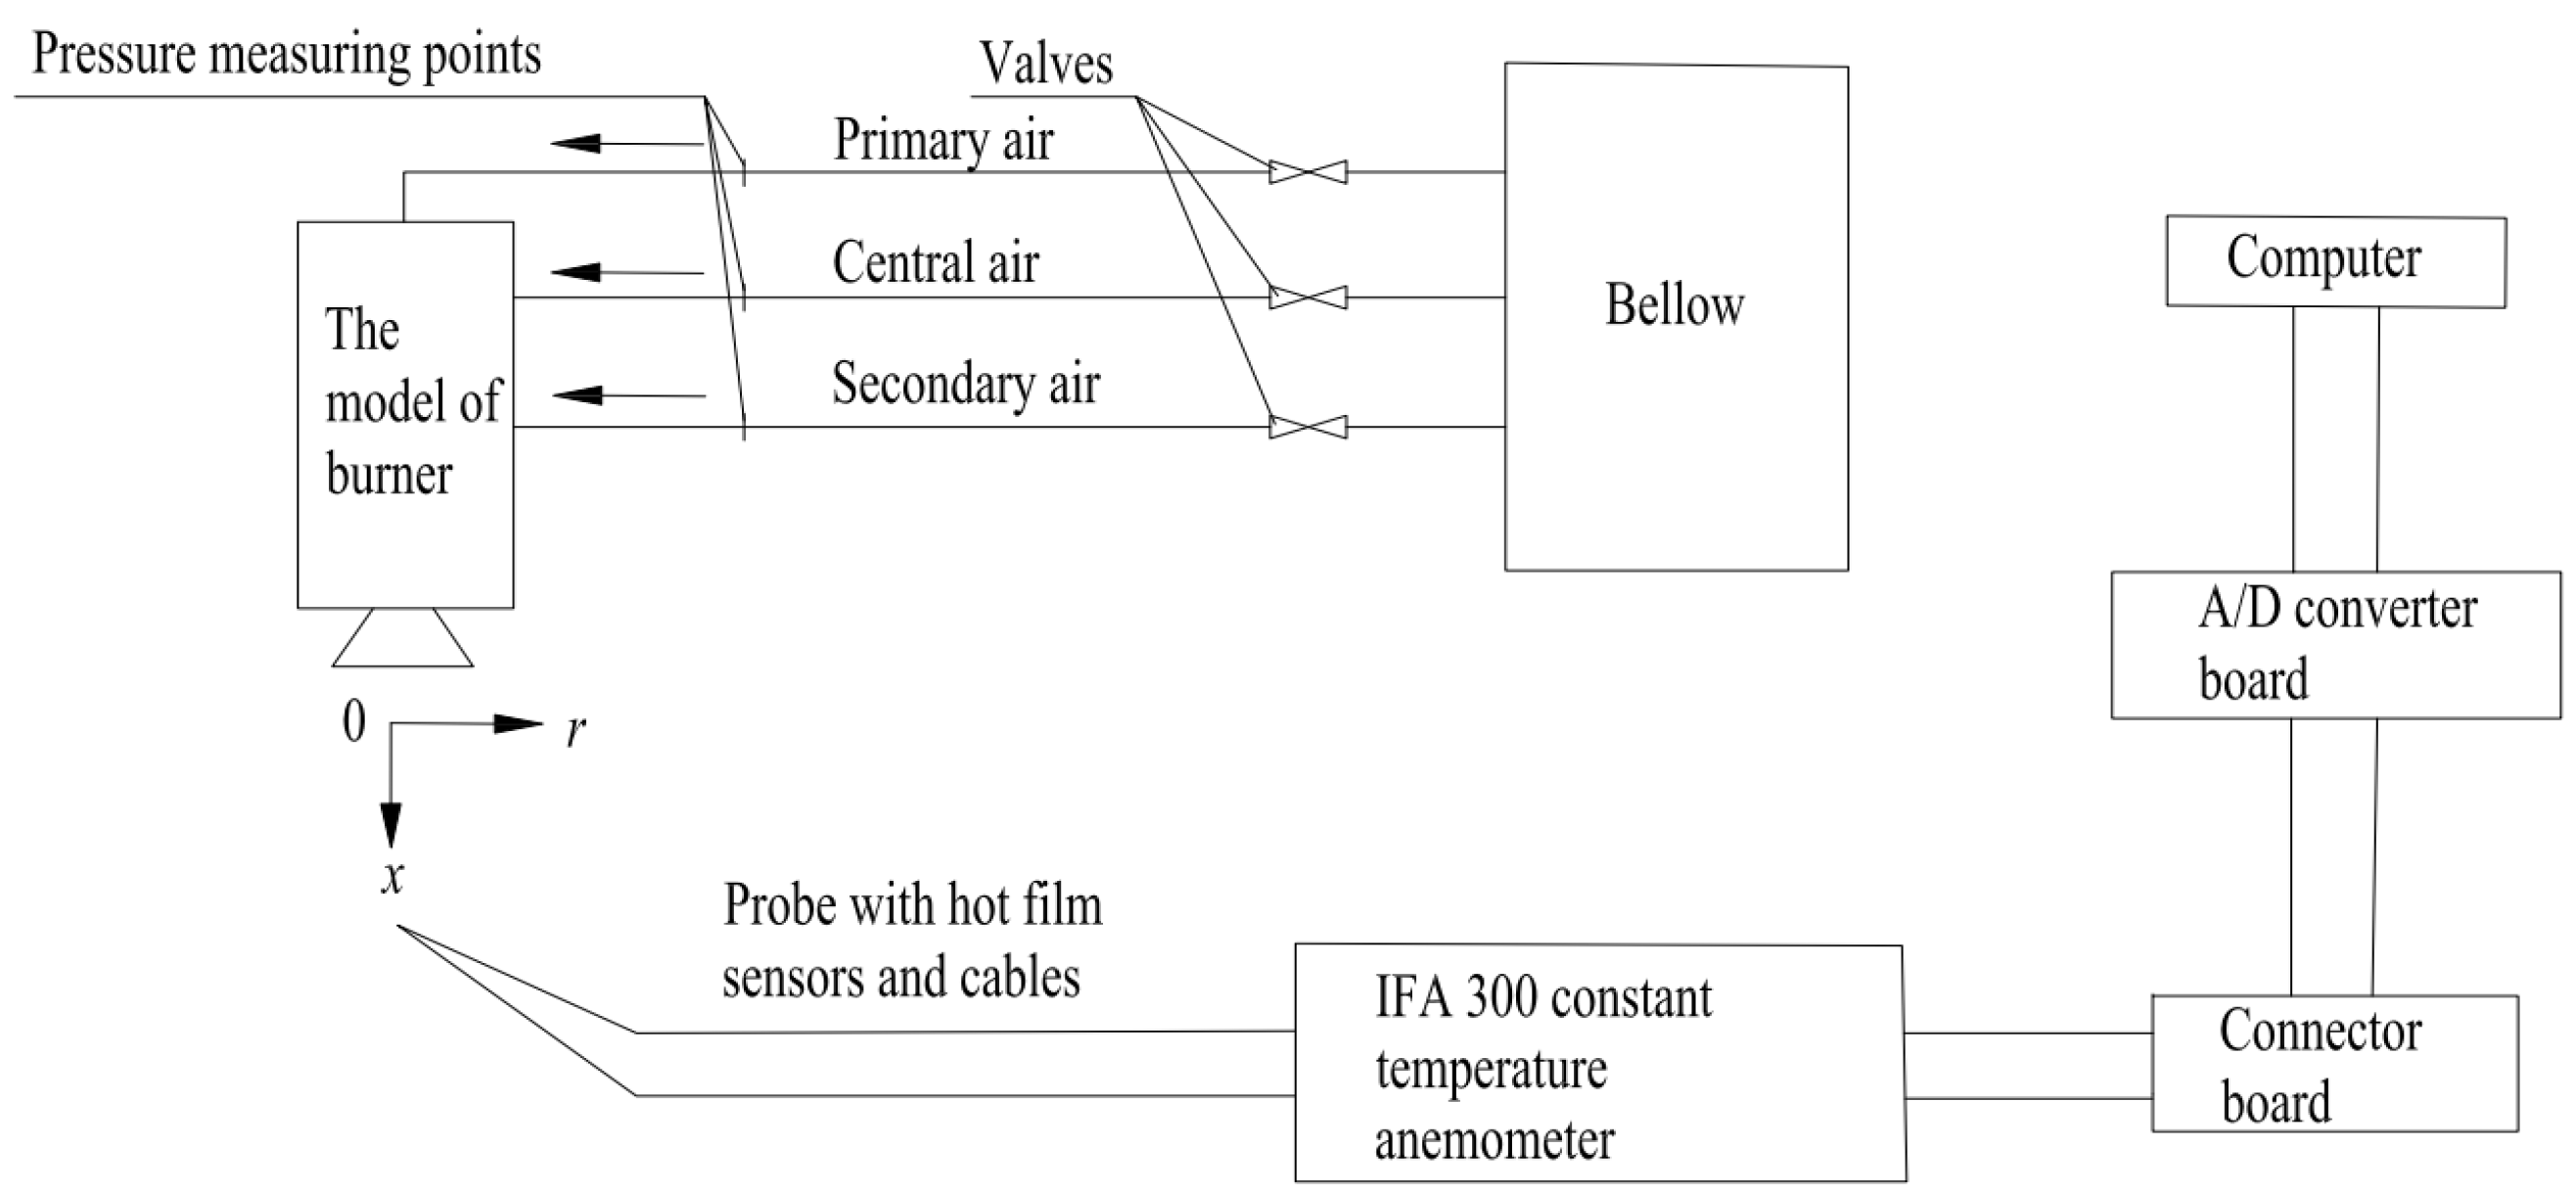
3.1.1. Single-Phase Experimental Equipment
3.1.2. Single-Phase Experimental Method
3.1.3. Single-Phase Experimental Parameters
3.2. Result of Cold Air Experiments
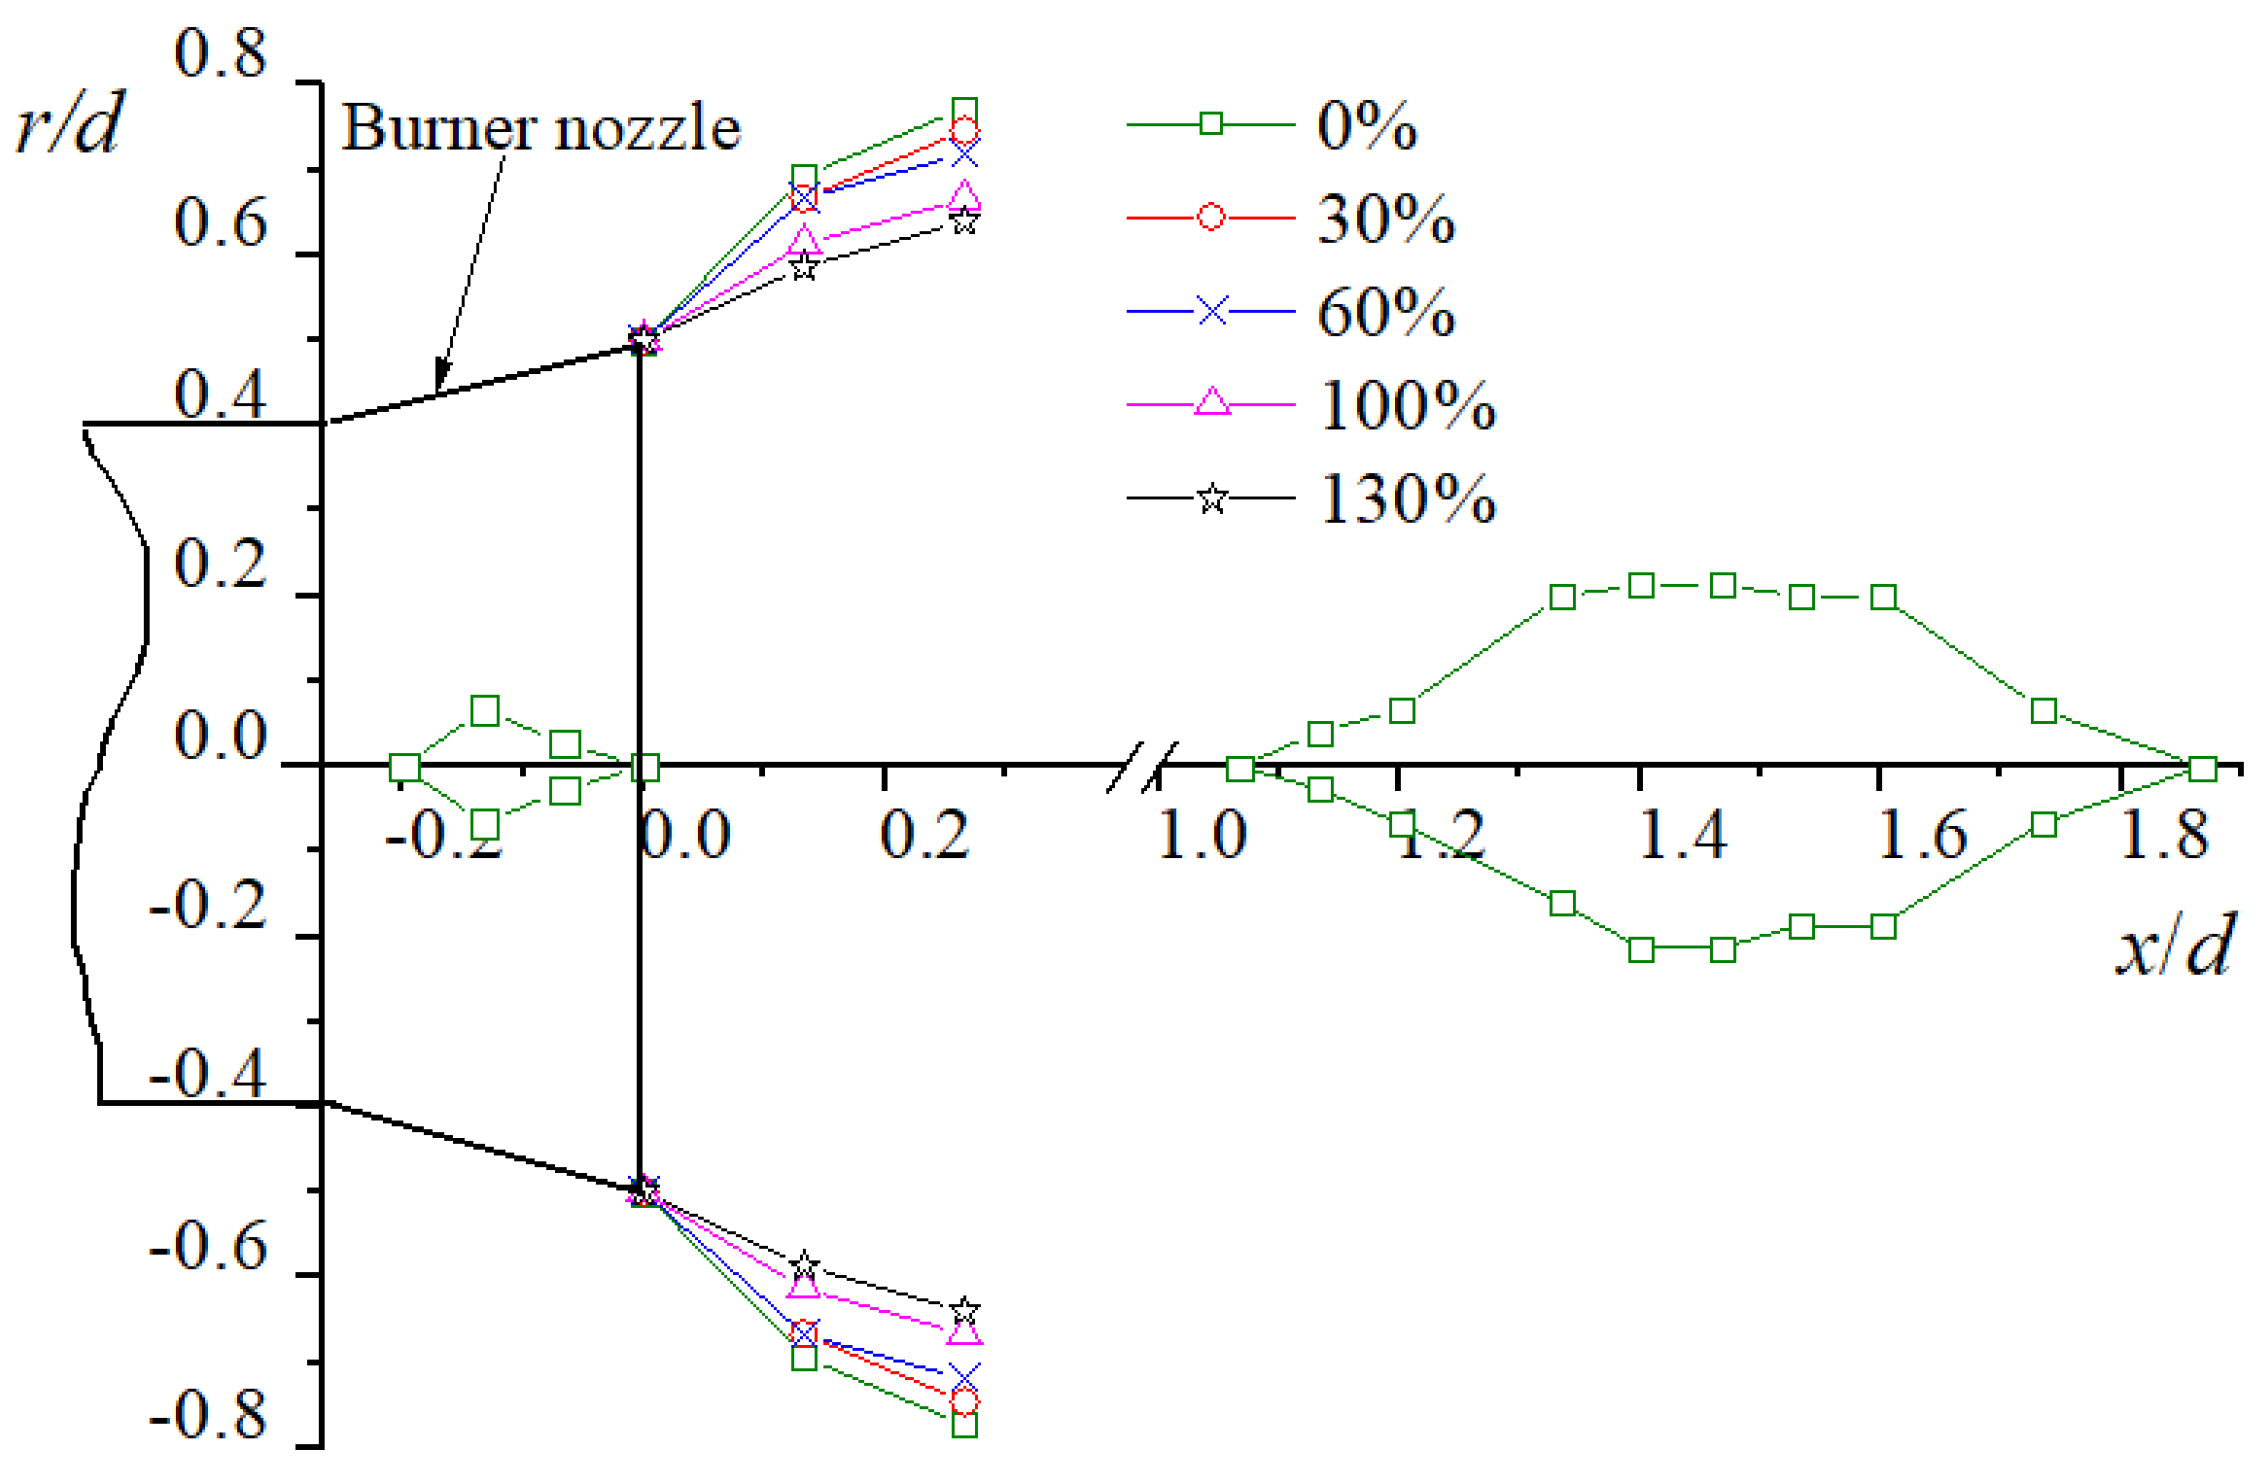
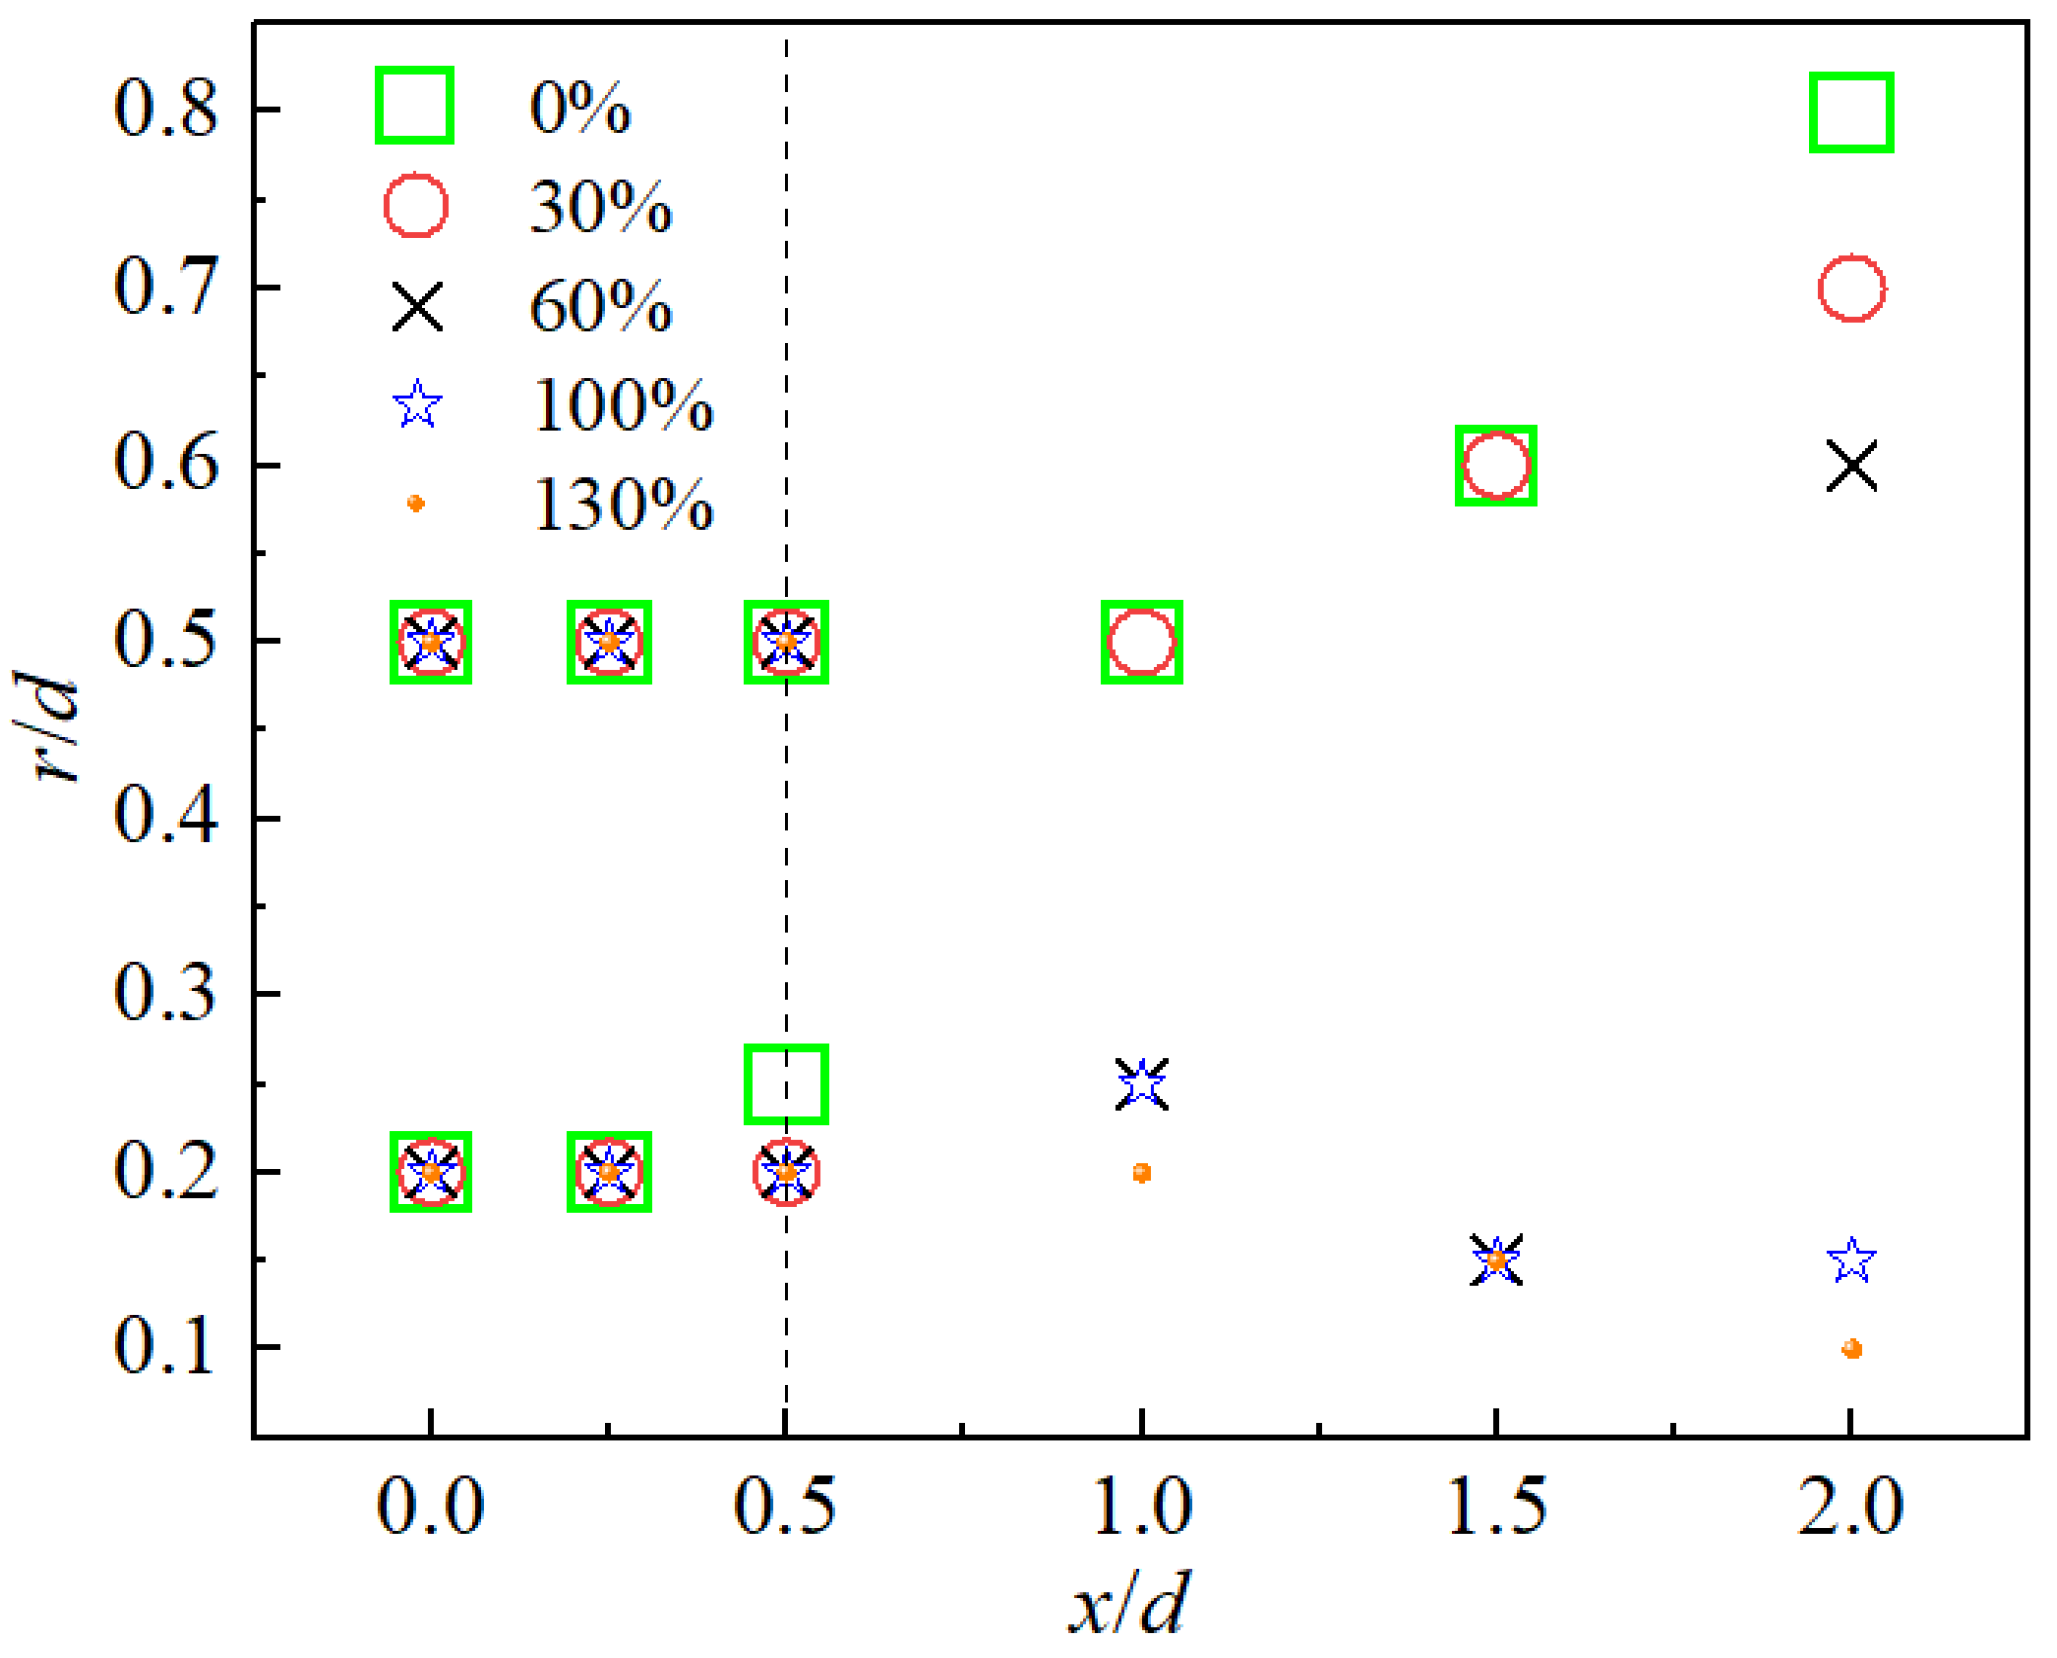
3.2.1. Jet Boundary and Recirculation Zone Boundary of Burner under Different Central Air Mass Flow
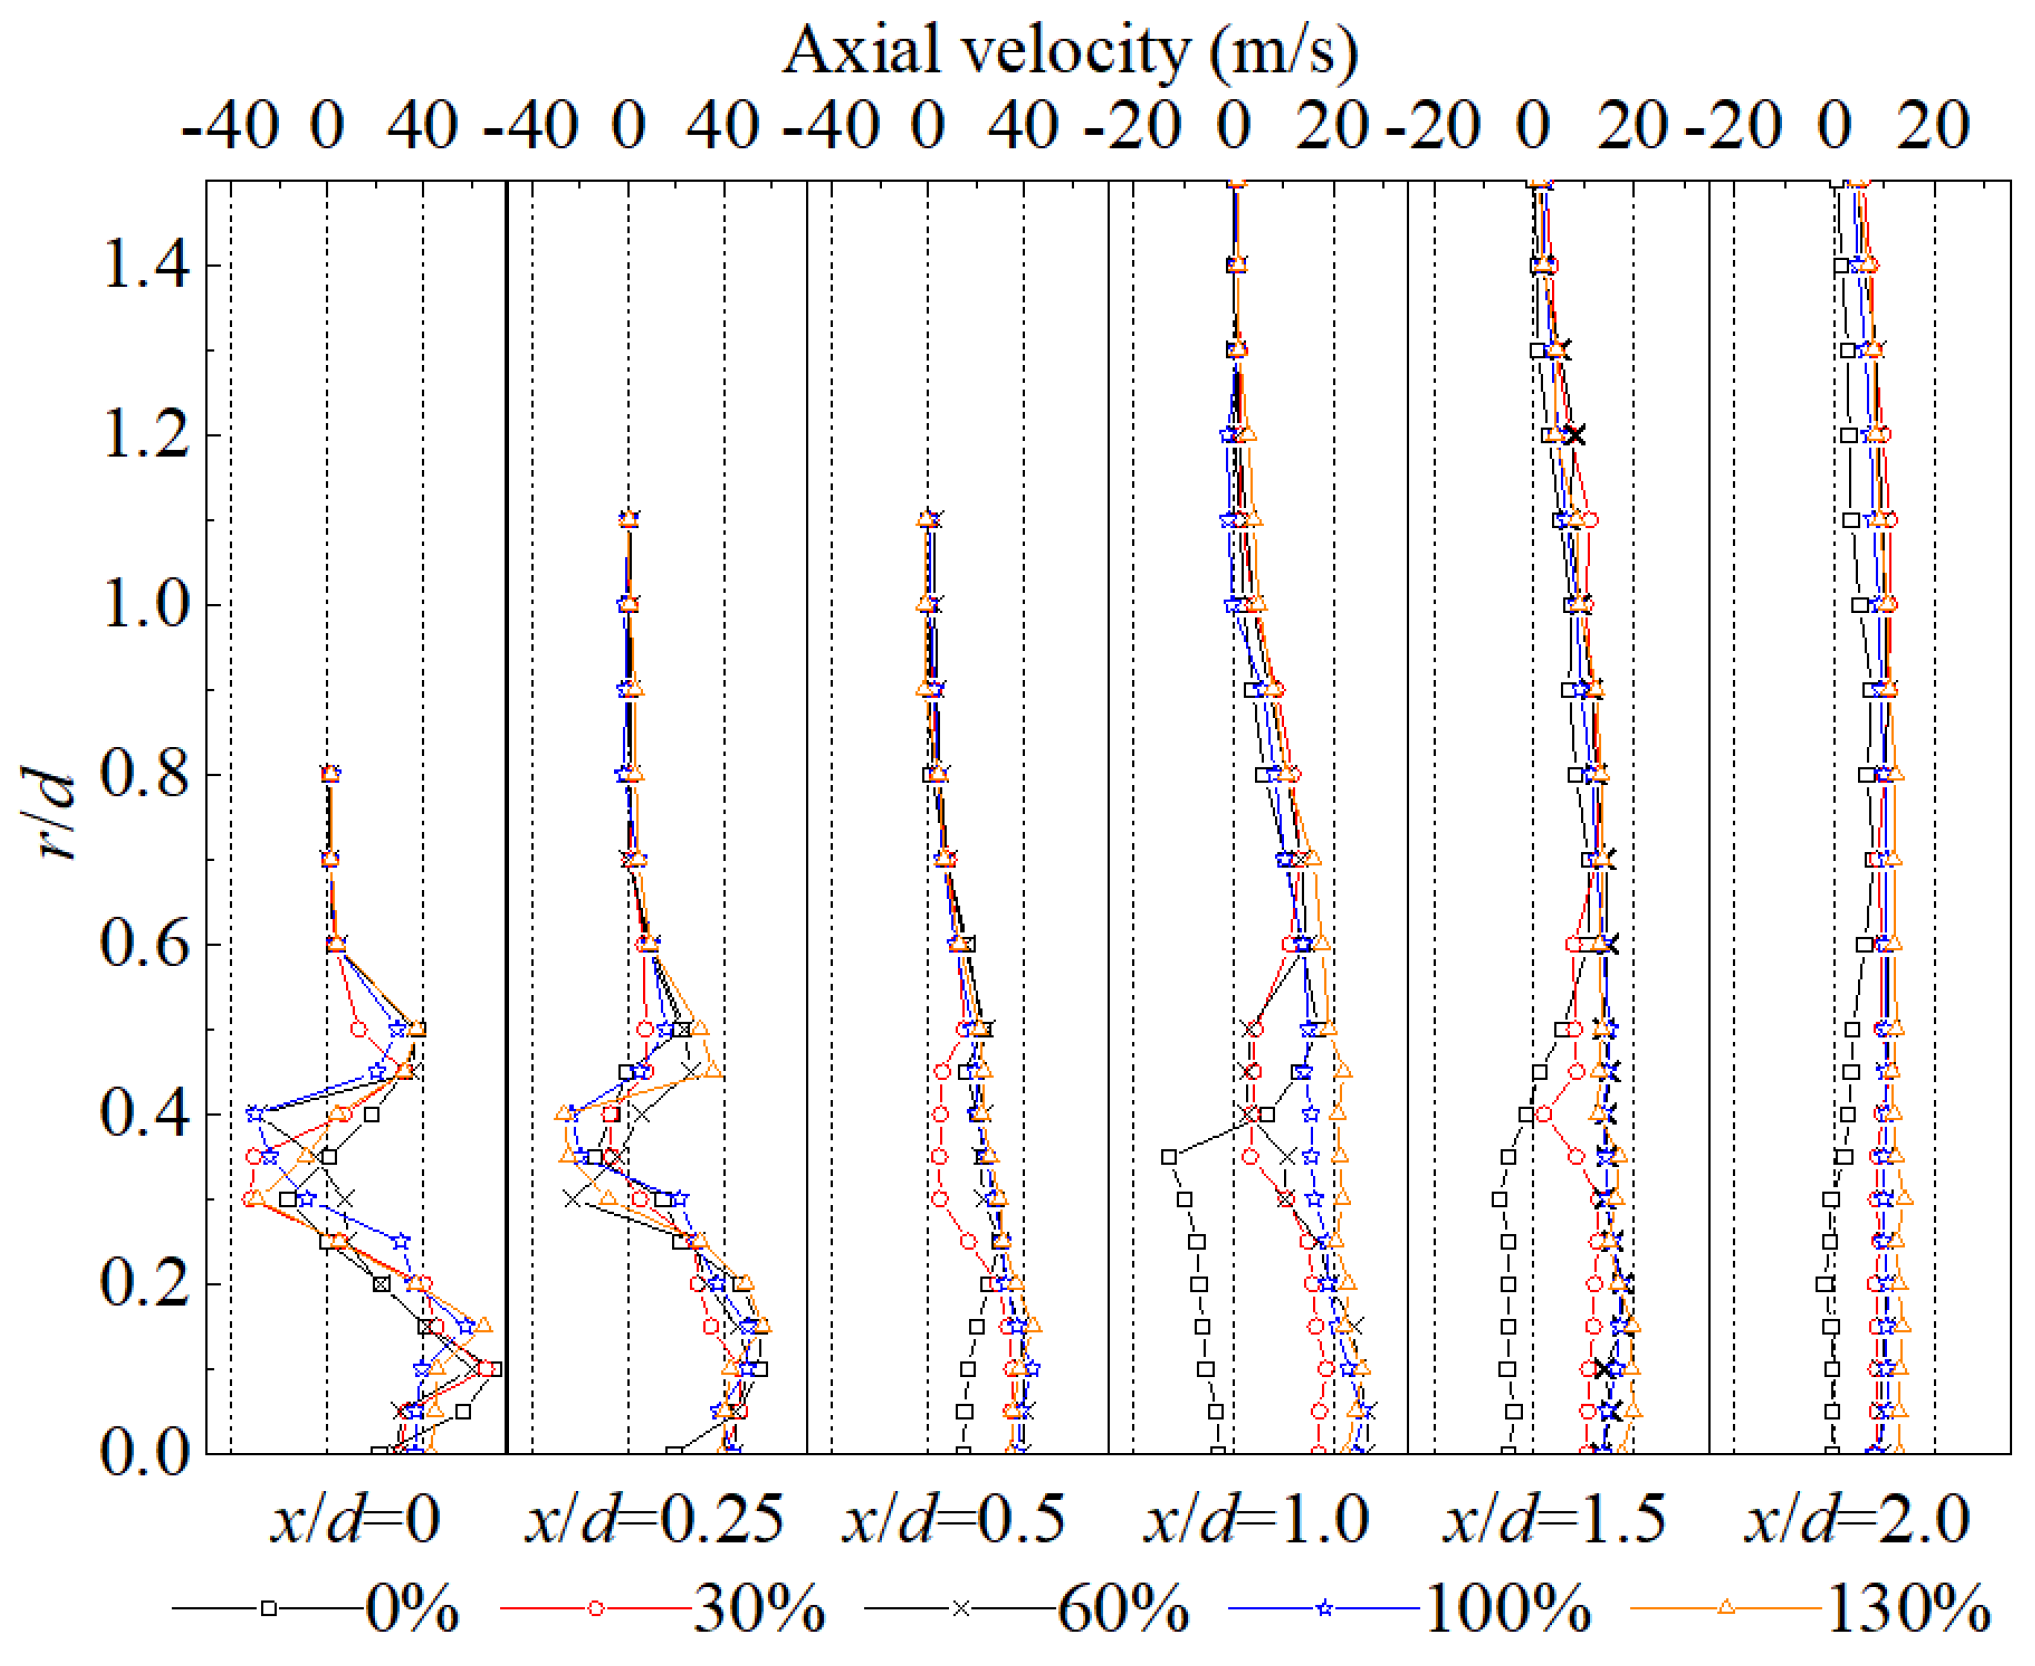
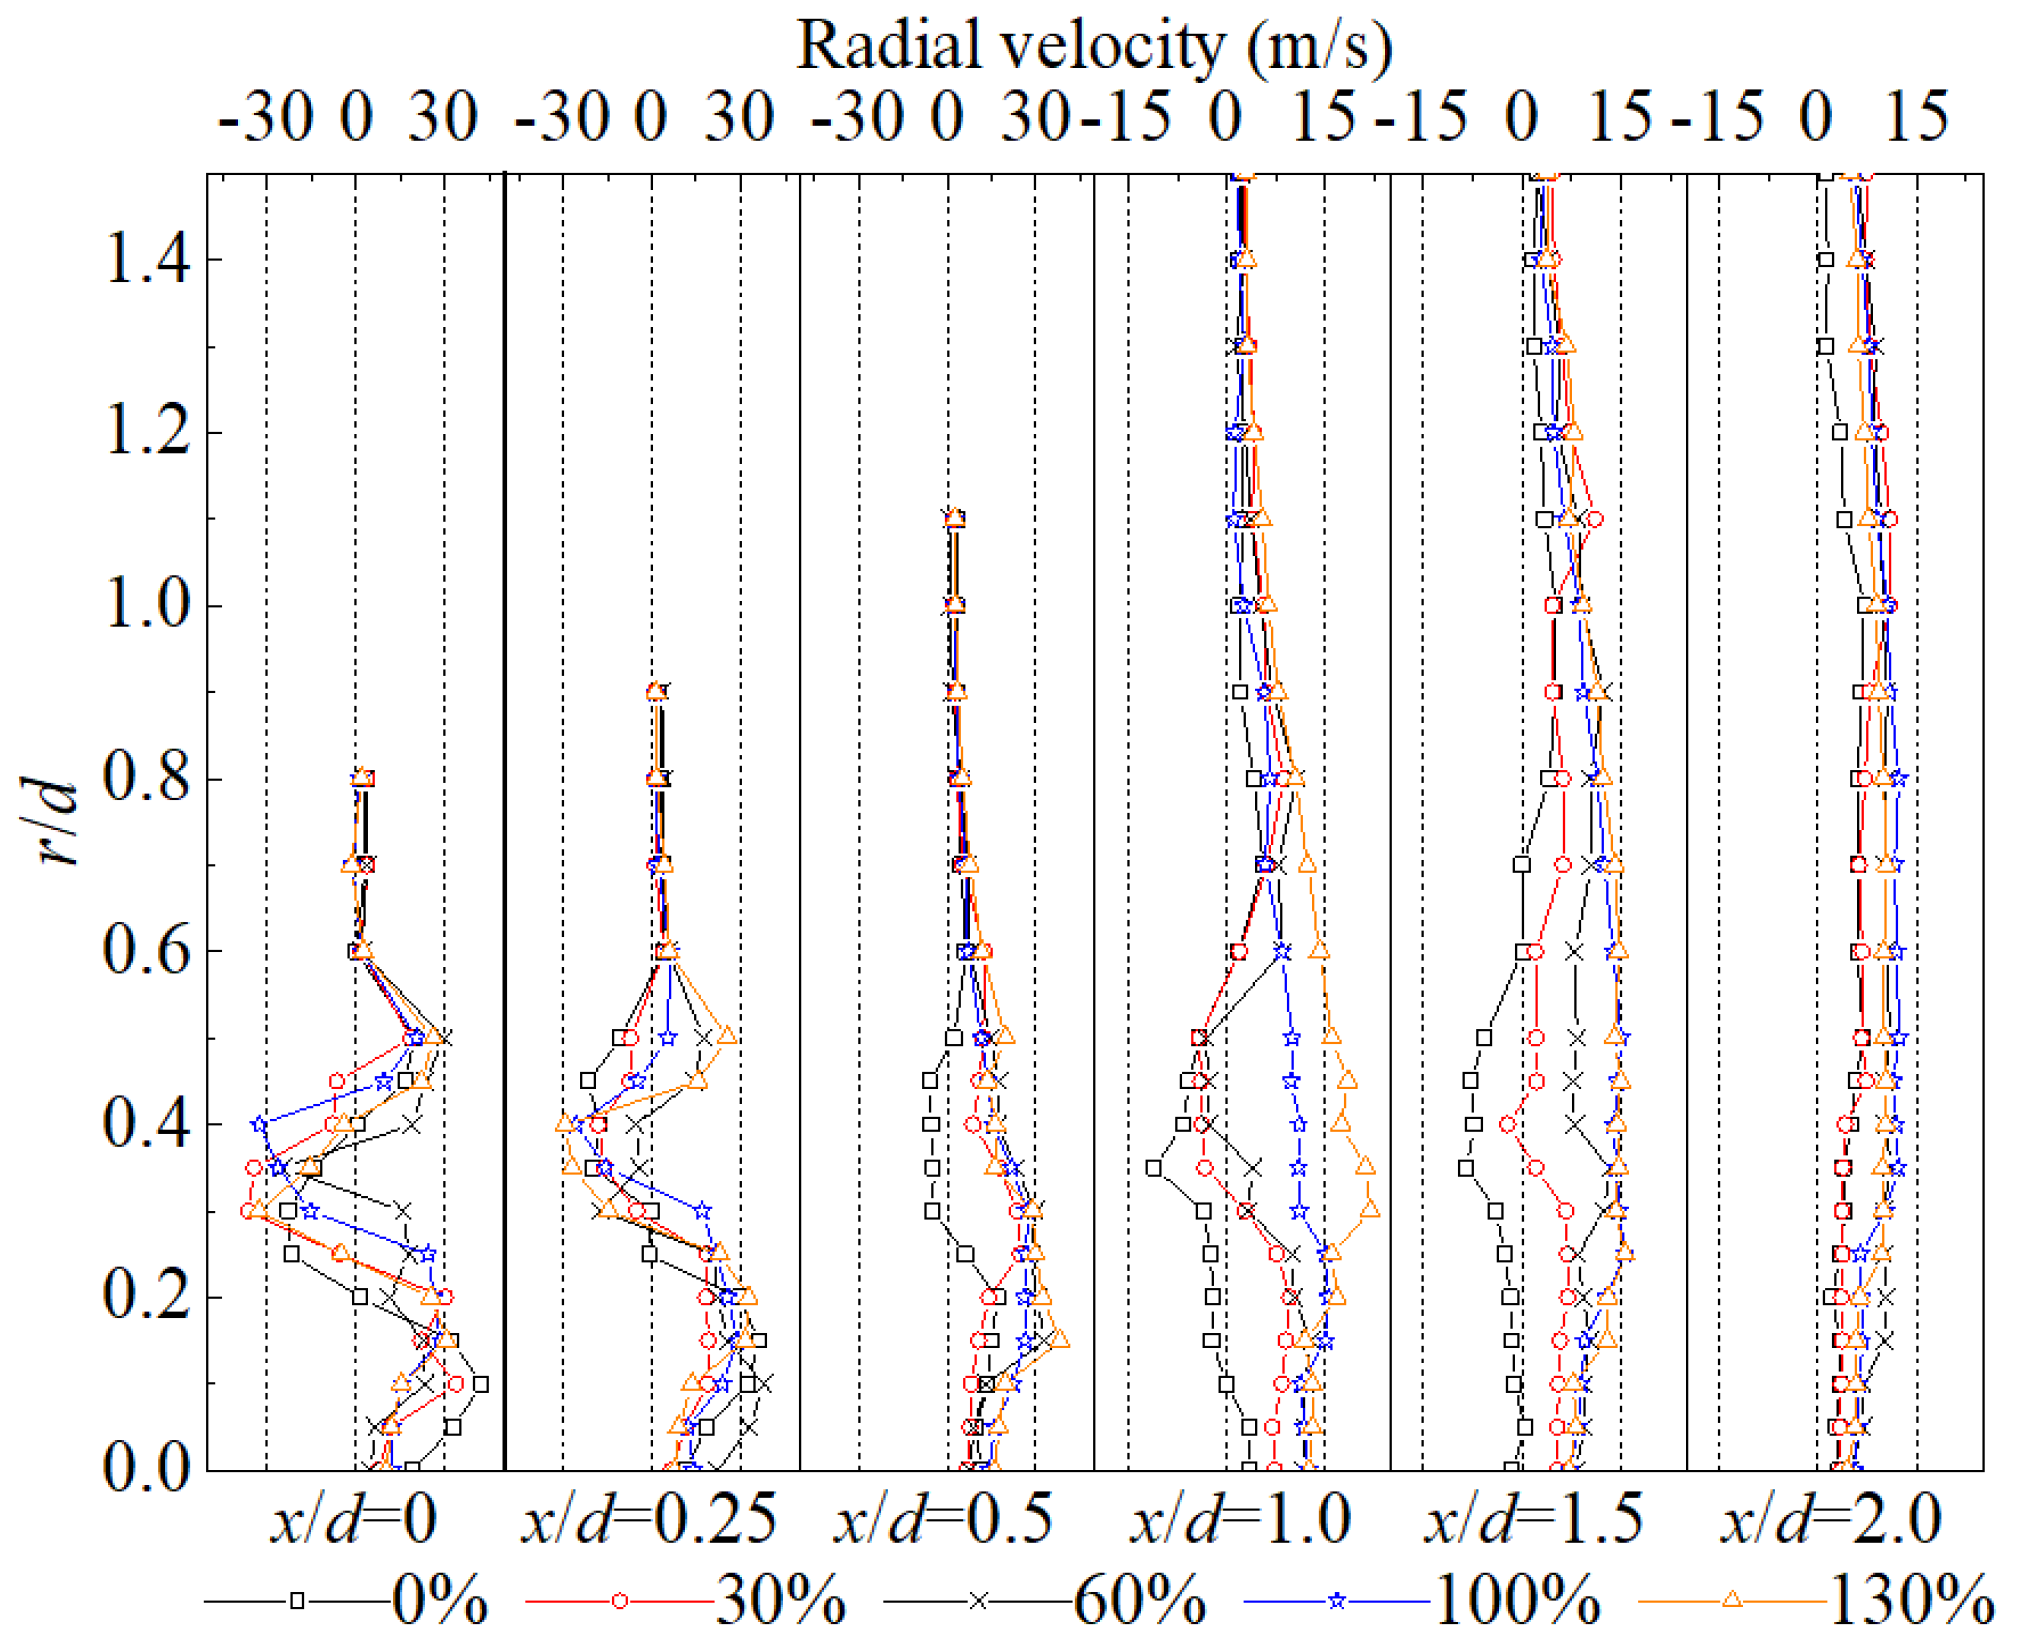
3.2.2. Speed Distribution of Burner with Different Central Air Mass Flow
4. Industrial Measurement of Burner and Boiler Low Load Operation Experiment
4.1. Data Acquisition Techniques
4.2. Result of Situ Industrial Experiments
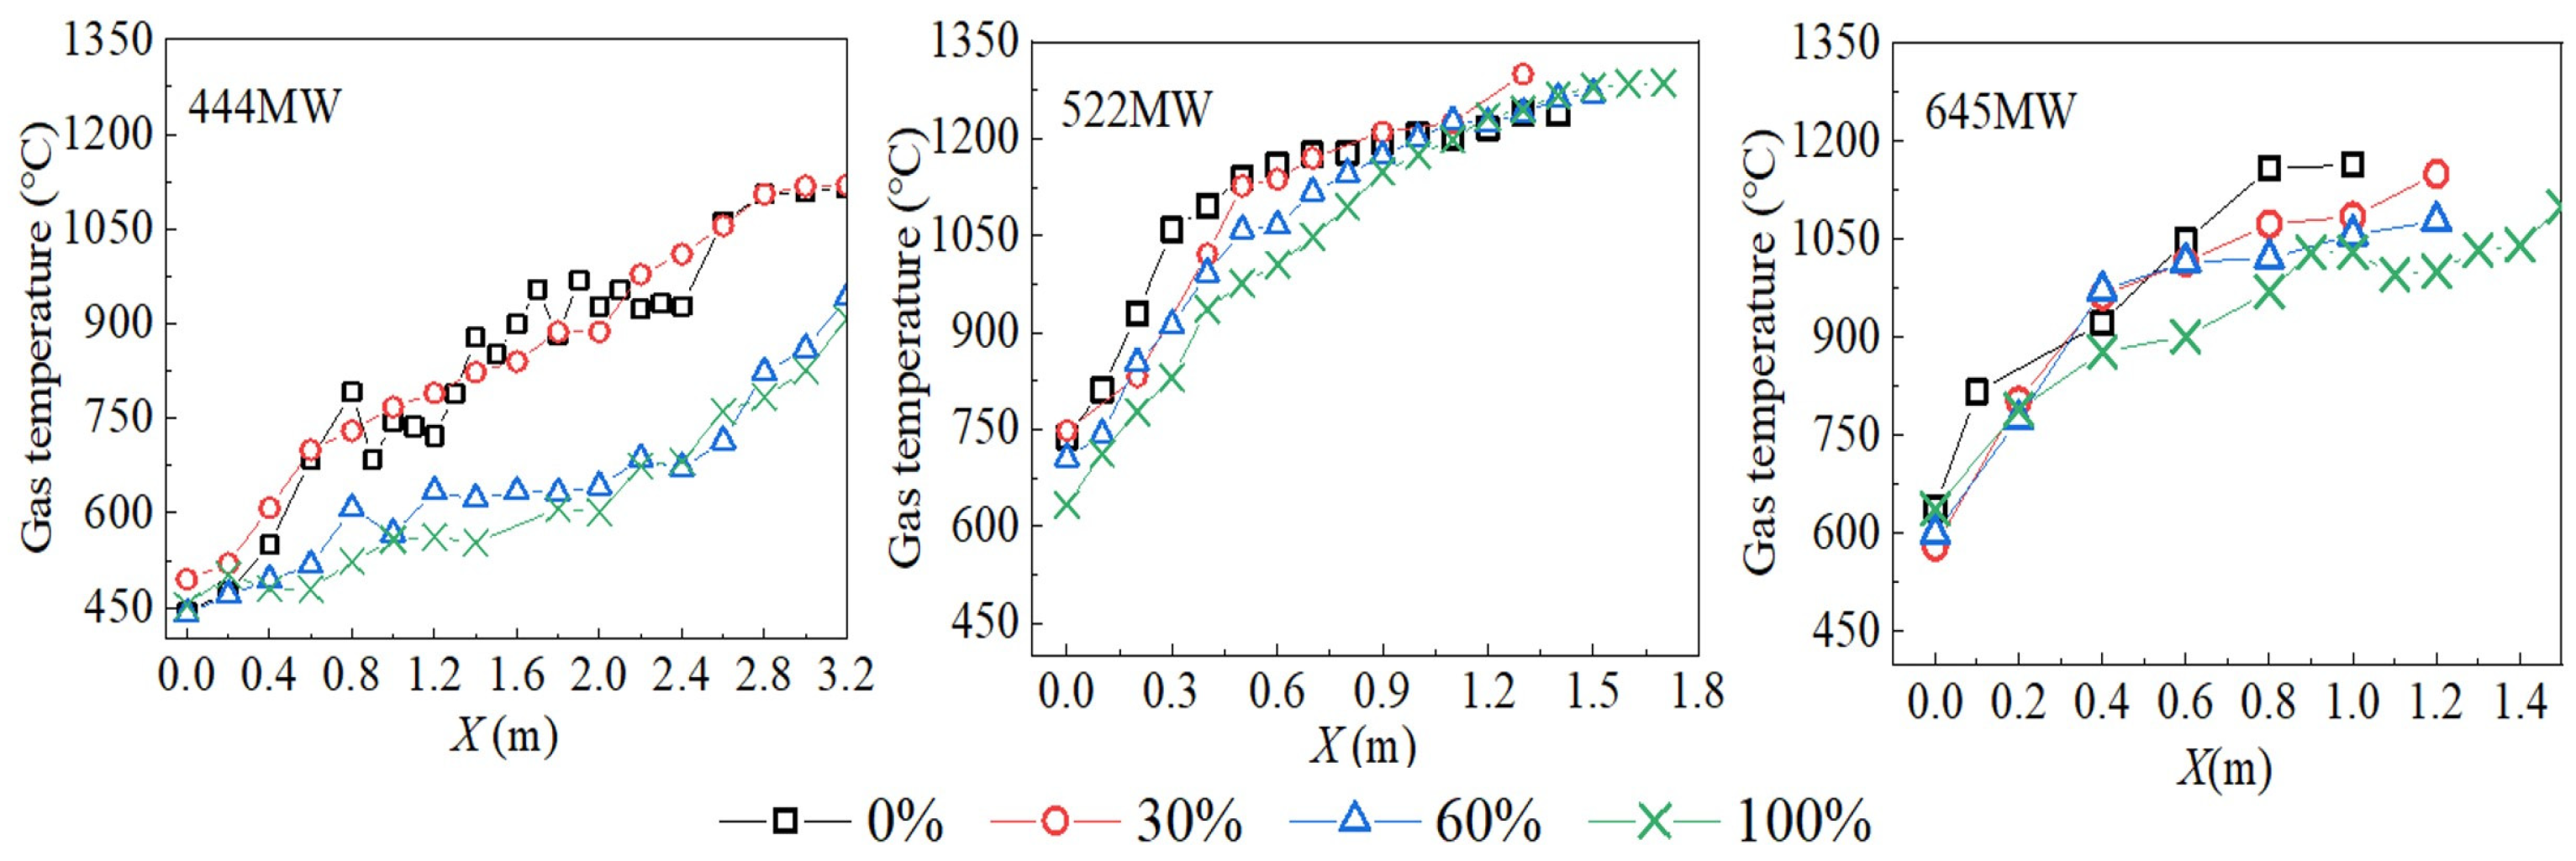
4.2.1. Measurements of Gas Temperature in the Burner Region
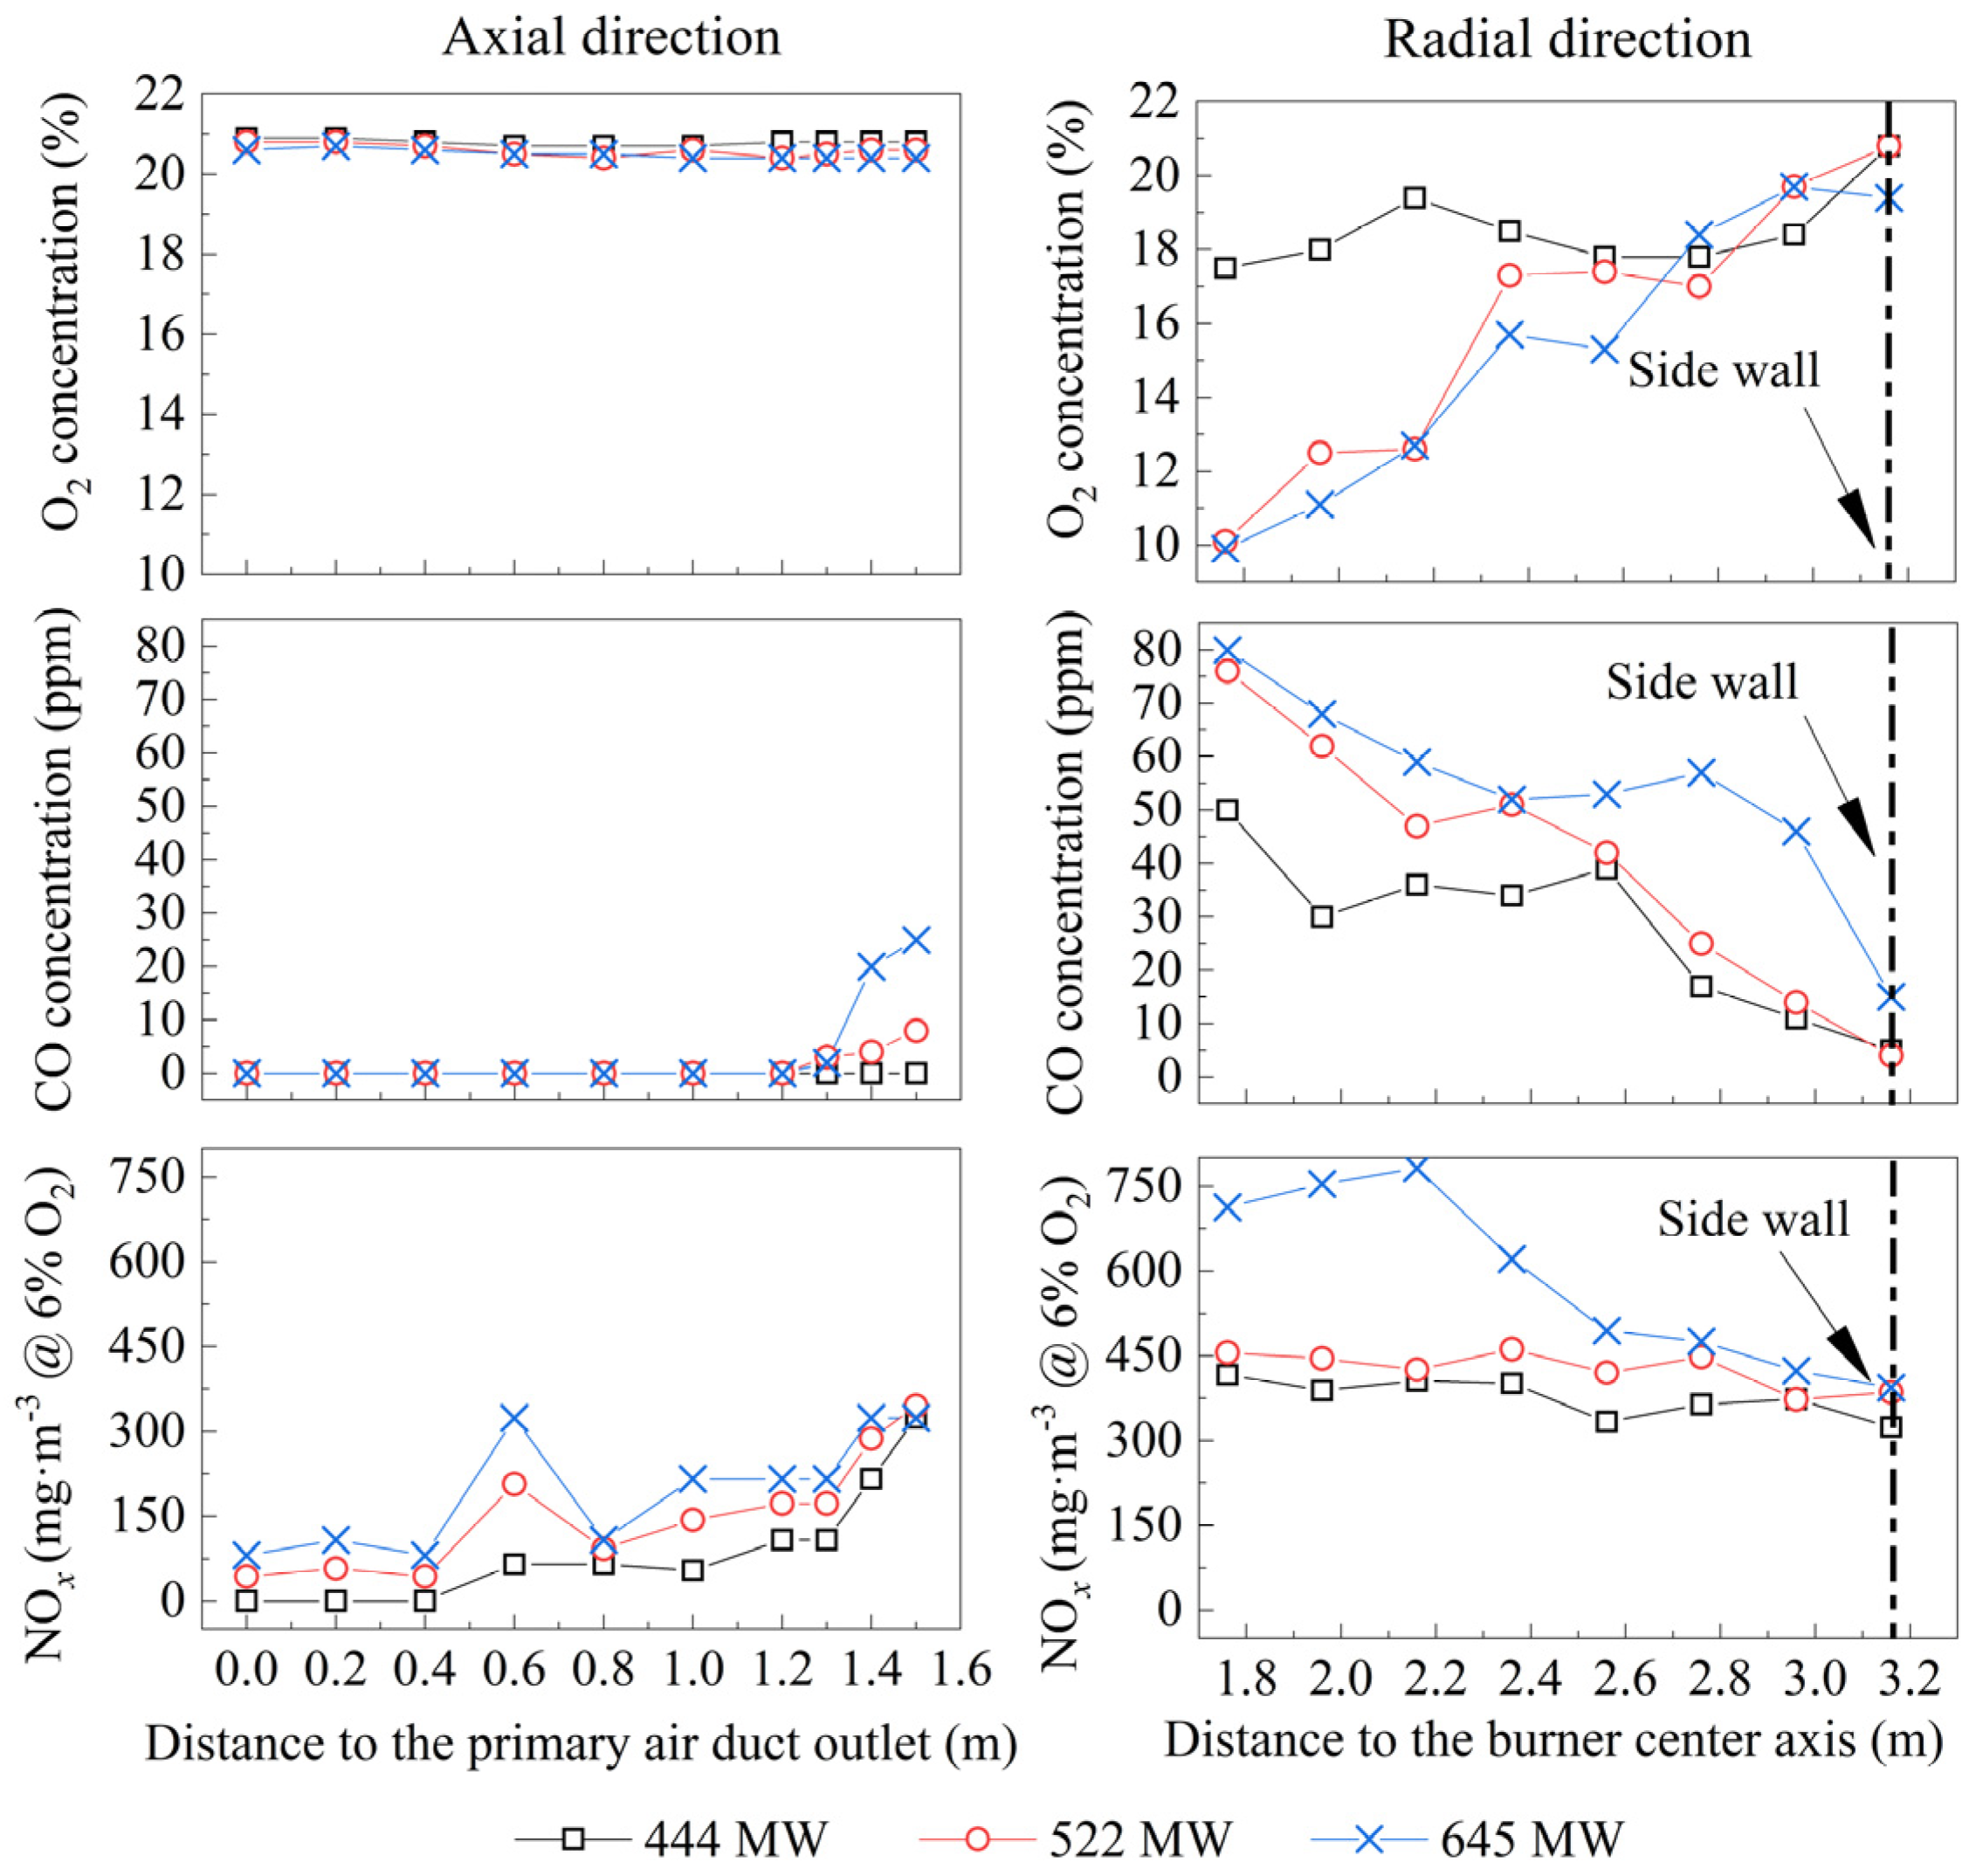
4.2.2. Measurements of Gas Species Concentrations in the Burner Region
4.2.3. Boiler Low Load Operation Experiment
5. Discussion
6. Conclusions
Author Contributions
Funding
Data Availability Statement
Acknowledgments
Conflicts of Interest
References
- Miao, Y.C.; Liu, S.H.; Zheng, Y.J.; Wang, S.; Chen, B.; Zheng, H.; Zhao, J. Numerical study of the effects of local atmospheric circulations on a pollution event over Beijing-Tianjin-Hebei, China. J. Environ. Sci. 2015, 30, 9–20. [Google Scholar] [CrossRef]
- Hu, H.; Yang, Q.; Lu, X.; Wang, W.; Wang, S.; Fan, M. Air pollution and control in different areas of China. Crit. Rev. Environ. Sci. Technol. 2010, 40, 452–518. [Google Scholar] [CrossRef]
- Thomas, R.A.; Hawkins, E.; Philip, D.J. CO2, the greenhouse effect and global warming: From the pioneering work of Arrhenius and Callendar to today’s Earth System Models. Endeavour 2016, 40, 178–187. [Google Scholar]
- National Energy Administrator. January to February 2023 National Electricity Industry Statistics. Available online: https://www.nea.gov.cn/2023-03/21/c_1310704448.htm (accessed on 20 May 2023).
- Verleysen, K.; Coppitters, D.; Parente, A.; De Paepe, W.; Contino, F. How can power-to-ammonia be robust? Optimization of an ammonia synthesis plant powered by a wind turbine considering operational uncertainties. Fuel 2020, 266, 117049. [Google Scholar] [CrossRef]
- Bai, X.F.; Ding, H.; Lian, J.J.; Ma, D.; Yang, X.; Sun, N.; Xue, W.; Chang, Y. Coal production in China: Past, present, and future projections. Int. Geol. Rev. 2018, 60, 535–547. [Google Scholar] [CrossRef]
- Yin, C.G.; Rosendahl, L.; Condra, T. Further study of the gas temperature deviation in large-scale tangentially coal-fired boilers. Fuel. 2003, 82, 1127–1137. [Google Scholar] [CrossRef]
- Song, M.H.; Huang, Y.; Huang, Q. Discussion on low-load stable combustion technology of swirl pulverized-coal burner. Proc. CSEE 2021, 41, 4552–4566. [Google Scholar]
- Zeng, L.Y.; Li, Z.Q.; Zhao, G.B.; Shen, S.; Zhang, F. Effect of the vane angle for outer secondary air on the flow and combustion characteristics and NOx emissions of the low-NOx axial-swirl coal burner. Numer. Heat Transf. Part A 2011, 59, 43–57. [Google Scholar] [CrossRef]
- You, C.F.; Zhou, Y. Effect of operation parameters on the slagging near swirl coal burner throat. Energy Fuels 2006, 20, 1855–1861. [Google Scholar] [CrossRef]
- Ochi, K.; Kiyama, K.; Yoshizako, H.; Okazaki, H.; Taniguchi, M. Latest low-NOx combustion technology for pulverized-coal-fired boilers. Hitachi Rev. 2009, 58, 187–193. [Google Scholar]
- Liu, J.Q.; Sun, B.M.; Zhang, G.C. Numerical simulation and optimization on stable combustion of a 1000 MW ultra supercritical unit swirl combustion boiler. Proc. CSEE 2012, 08, 19–27. [Google Scholar]
- Wang, L.; Li, Z.Q.; Hao, J.B.; Song, Z. Effct of central air on the performance of the swirl burner. Chin. J. Mech. Eng. 2000, 06, 63–67. [Google Scholar] [CrossRef]
- Wang, L.; Wu, S.H.; Li, Z.Q. The effects of cenrtal air on combustion of the radial bias combustion swirl burner. Power Eng. 2000, 20, 615–619. [Google Scholar]
- Lu, H.; Liu, H.F.; Li, W.F.; Xu, J.L. Bubble formation in an annular granular jet dispersed by a central air round jet. AIChE J. 2013, 59, 1882–1893. [Google Scholar] [CrossRef]
- Huang, L.Y.; Liu, C.C.; Deng, T.D.; Jiang, H.; Wu, P. Experimental investigation on the influence of central airfow on swirl combustion stability and fame shape. J. Therm. Anal. Calorim. 2021, 144, 503–514. [Google Scholar] [CrossRef]
- Chen, Z.C.; Li, Z.Q.; Zhu, Q.Y.; Jing, J. Gas/particle flow and combustion characteristics and NOx emissions of a new swirl coal burner. Energy 2011, 36, 709–723. [Google Scholar] [CrossRef]
- Al-Halbouni, A.; Giese, A.; Tali, E.; Leicher, J.; Albus, R.; Görner, K. Combustor concept for industrial gas turbines with single digit NOx and CO emission values. Energy Procedia 2017, 120, 134–139. [Google Scholar] [CrossRef]
- Han, J.D.; Zhu, L.B.; Lu, Y.P.; Mu, Y.; Mustafa, A.; Ge, Y. Numerical simulation of combustion in 35 t/h industrial pulverized coal furnace with burners arranged on front wall. Processes 2020, 8, 1272. [Google Scholar] [CrossRef]
- Xie, B.; Zhang, G.C. Effect of center wind on combustion characteristics of HT-NR3 swirl burner. Therm. Power Gener. 2015, 44, 35–40+45. [Google Scholar]
- Marcel, R.; Gerd, O.; Klaus, G. Improving the load flexibility of coal-fired power plants by the integration of a thermal energy storage. Appl. Energy 2019, 236, 607–621. [Google Scholar]
- Martin, K.; Michal, K. Control of a boiler-turbine unit using MPC-based reference governors. Appl Therm Eng. 2017, 110, 1437–1447. [Google Scholar]
- Li, Z.Q.; Kuang, M.; Zhu, Q.Y. Aerodynamic characteristics within a cold small scale model for a down-fired 350 MWe utility boiler applying a multiple injection and multiple-staging technology: Effect of the staged-air declination angle. Exp. Therm. Fluid. Sci. 2012, 38, 184–194. [Google Scholar] [CrossRef]
- Chen, Z.C.; Li, Z.Q.; Jing, J.P.; Chen, L.; Wu, S.; Yao, Y. Study on flow fields of centrally fuel rich swirl burner and its applications. Korean J. Chem. Eng. 2009, 26, 1186–1193. [Google Scholar] [CrossRef]
- Mueller, U.R. On the accuracy of turbulence measurements with inclined hot-wires. J. Fluid. Mech. 1982, 119, 155–172. [Google Scholar] [CrossRef]
- Jing, J.P.; Li, Z.Q.; Zhu, Q.Y.; Chen, Z.; Ren, F. Influence of primary air ratio on flow and combustion characteristics and NOx emissions of a new swirl coal burner. Energy 2011, 36, 1206–1213. [Google Scholar] [CrossRef]
- Li, S.; Li, Z.Q.; Jiang, B.K.; Chen, Z.; Zhang, X. Effect of secondary air mass flow rate on the airflow and combustion characteristics and NOx formation of the low-volatile coal-fired swirl burner. Asia Pac. J. Chem. Eng. 2015, 10, 858–875. [Google Scholar] [CrossRef]
- De Soete, G.G. Measurement of flame temperature with a multi-element thermocouple. J. Energy Inst. 1981, 54, 113–116. [Google Scholar]
- Xie, J.Y.; Chen, H.W. Distribution of ignition temperature and ignition heat of power coal in China. CIESC J. 2015, 66, 4170–4176. [Google Scholar]
- Guo, L.; Zhai, M.; Wang, Z.; Zhang, Y.; Dong, P. Comparison of bituminous coal and lignite during combustion: Combustion performance, coking and slagging characteristics. J. Energy Inst. 2019, 92, 802–812. [Google Scholar] [CrossRef]
- Li, X.G.; Zeng, L.Y.; Zhang, X.; Fang, N.; Song, M.; Chen, Z.; Li, Z. Effects of the fuel-lean coal/air flow damper opening on combustion, energy conversion and emissions in a supercritical down-fired boiler. Fuel 2021, 292, 120319. [Google Scholar] [CrossRef]
- Zhang, S.Q.; Chen, L.; Liu, Z.Y. Discussion on key problems of depth peak adjustment for large coal-fired boilers. South. Energy Constr. 2022, 9, 16–28. [Google Scholar]


| Items | Parameters |
|---|---|
| Passage area of the primary air (m2) | 0.4221 |
| Exit area of the primary air (m2) | 0.2754 |
| Exit area of the inner secondary air (m2) | 0.8608 |
| Exit area of the outer secondary air (m2) | 0.8251 |
| Exit area of the central air (m2) | 0.1431 |
| Temperature of the primary air (°C) | 119 |
| Temperature of the secondary air (°C) | 325 |
| Mass flow rate of the primary air (kg·s−1) | 6.67 |
| Mass flow rate of the inner secondary air (kg·s−1) | 5.47 |
| Mass flow rate of the outlet secondary air (kg·s−1) | 7.21 |
| Mass flow rate of the central air (kg·s−1) | 1.83 |
| Central Air Mass Flow to Reference Condition (%) | Central Air Mass Flow (kg·s−1) | Inner Secondary Air Mass Flow (kg·s−1) | Outer Secondary Air Mass Flow (kg·s−1) | Primary Air Mass Flow (kg·s−1) | Airflow Spread Angle Measured by Thin Cloth (°) |
|---|---|---|---|---|---|
| 0 | 0 | 0.337 | 0.444 | 0.393 | 46 |
| 30 | 0.033 | 0.337 | 0.444 | 0.393 | 43 |
| 60 | 0.067 | 0.337 | 0.444 | 0.393 | 40 |
| 100 | 0.112 | 0.337 | 0.444 | 0.393 | 32 |
| 130 | 0.145 | 0.337 | 0.444 | 0.393 | 28 |
| Parameter | Central Air Mass Flow | ||||
|---|---|---|---|---|---|
| 0% | 30% | 60% | 100% | 130% | |
| D/d | 0.13 | 0.13 | 0.11 | 0.14 | 0.13 |
| qr+ (x/d = 0) | 3.04 | 3.23 | 3.53 | 4.19 | 3.95 |
| qr− (x/d = 0) | 1.52 | 1.70 | 1.37 | 1.85 | 1.58 |
| Σq (x/d = 0) | 1.52 | 1.53 | 2.16 | 2.34 | 2.37 |
| qr+ (x/d = 0.25) | 3.03 | 3.15 | 3.84 | 4.97 | 5.60 |
| qr− (x/d = 0.25) | 0.95 | 0.59 | 0.91 | 2.06 | 2.59 |
| Σq (x/d = 0.25) | 2.08 | 2.56 | 2.93 | 2.91 | 3.01 |
| Boiler load | Proximate analysis (wt.%) | Net heating value (kJ/kg) | |||
| a | 1 | ||||
| 444 MW | 53.10 | 30.28 | 14.90 | 1.72 | 20,667 |
| 522 MW | 54.13 | 31.04 | 13.41 | 1.42 | 20,998 |
| 645 MW | 53.34 | 32.48 | 13.10 | 1.08 | 20,775 |
| 280 MW&262 MW | 57.08 | 27.66 | 13.28 | 1.98 | 21,160 |
| Boiler load | Ultimate analysis (wt.%) | ||||
| a | |||||
| 444 MW | 57.58 | 2.65 | 5.56 | 0.88 | 1.24 |
| 522 MW | 57.81 | 2.57 | 5.08 | 0.86 | 1.22 |
| 645 MW | 57.26 | 2.70 | 4.47 | 0.87 | 1.14 |
| Item | 444 MW | 522 MW | 645 MW | 280 MW | 262 MW |
|---|---|---|---|---|---|
| Main steam flow (t·h−1) | 1339 | 1574 | 1945 | 844 | 790 |
| Main steam pressure (MPa) | 14.1 | 15.4 | 16.3 | 14.5 | 14.5 |
| Main steam temperature (°C) | 535 | 534 | 536 | 520 | 517 |
| Reheat stream temperature ( °C) | 539 | 536 | 538 | 532 | 530 |
| Reheat stream pressure (MPa) | 1.59 | 2.01 | 2.84 | 1.29 | 1.22 |
| Primary air temperature (°C) | 110 | 110 | 119 | 110 | 110 |
| Secondary air temperature (°C) | 315 | 327 | 325 | 315 | 315 |
| Total fuel consumption (kg·s−1) | 56.9 | 68.1 | 75.0 | 32.0 | 29.9 |
| Minimum temperature at denitration inlet (°C) | 354 | 358 | 377 | 313 | 310 |
Disclaimer/Publisher’s Note: The statements, opinions and data contained in all publications are solely those of the individual author(s) and contributor(s) and not of MDPI and/or the editor(s). MDPI and/or the editor(s) disclaim responsibility for any injury to people or property resulting from any ideas, methods, instructions or products referred to in the content. |
© 2023 by the authors. Licensee MDPI, Basel, Switzerland. This article is an open access article distributed under the terms and conditions of the Creative Commons Attribution (CC BY) license (https://creativecommons.org/licenses/by/4.0/).
Share and Cite
Huang, C.; Li, Z.; Wang, Y.; Lu, Y.; Liu, H.; Chen, Z. Influence of Central Air on Flow and Combustion Characteristics and Low-Load Stabilization Performance of a Babcock Burner. Processes 2023, 11, 1916. https://doi.org/10.3390/pr11071916
Huang C, Li Z, Wang Y, Lu Y, Liu H, Chen Z. Influence of Central Air on Flow and Combustion Characteristics and Low-Load Stabilization Performance of a Babcock Burner. Processes. 2023; 11(7):1916. https://doi.org/10.3390/pr11071916
Chicago/Turabian StyleHuang, Chunchao, Zhengqi Li, Yufei Wang, Yue Lu, Huacai Liu, and Zhichao Chen. 2023. "Influence of Central Air on Flow and Combustion Characteristics and Low-Load Stabilization Performance of a Babcock Burner" Processes 11, no. 7: 1916. https://doi.org/10.3390/pr11071916
APA StyleHuang, C., Li, Z., Wang, Y., Lu, Y., Liu, H., & Chen, Z. (2023). Influence of Central Air on Flow and Combustion Characteristics and Low-Load Stabilization Performance of a Babcock Burner. Processes, 11(7), 1916. https://doi.org/10.3390/pr11071916