Article

Operating and Thermal Efficiency Boundary Expansion of Argon Power Cycle Hydrogen Engine

School of Automotive Studies, Tongji University, Shanghai 201804, China
*
Author to whom correspondence should be addressed.
Processes 2023, 11(6), 1850; https://doi.org/10.3390/pr11061850
Submission received: 6 June 2023 / Revised: 14 June 2023 / Accepted: 17 June 2023 / Published: 19 June 2023
(This article belongs to the Special Issue Control of Injector Spray Characteristics and Synthetic Fuels)

Abstract

:
The efficiency enhancement of argon power cycle engines through theoretical means has been substantiated. However, the escalation of in-cylinder temperatures engenders abnormal combustion phenomena, impeding the augmentation of compression ratios and practical efficiency. This study presents a comprehensive investigation employing experimental and simulation techniques, aiming to extend the boundaries of thermal efficiency and operational capabilities for hydrogen-powered argon cycle engines. The impact of hydrogen direct injection, intake boost, and port water injection is evaluated in conjunction with an argon power cycle hydrogen engine. The hydrogen direct injection, particularly at an engine speed of 1000 rpm, significantly increases the indicated mean effective pressure from 0.39 MPa to 0.72 Mpa, surpassing the performance of the port hydrogen injection. Manipulating the hydrogen direct injection timing results in the formation of a stratified mixture, effectively attenuating the combustion rate, and resolving the issue of excessively rapid hydrogen combustion within an Ar/O2 environment. The implementation of super lean combustion, combined with intake-boosting, achieves a maximum gross indicated thermal efficiency of 57.89%. Furthermore, the port water injection proves to be an effective measure against knock, broadening the operational range of intake-boosted conditions. Notably, the maximum gross indicated thermal efficiency recorded for the port water injection group under intake-boosted conditions reaches 59.35%.

1. Introduction

In pursuit of carbon neutrality within a limited timeframe, researchers are dedicated to substituting fossil fuels with renewable and environmentally friendly energy sources across various domains. Hydrogen, deemed an ideal renewable energy carrier, can be generated through diverse methodologies, such as methanol decomposition, methane reforming, and water electrolysis [1]. Furthermore, numerous techniques exist for harnessing energy from hydrogen, including internal combustion engines and fuel cells [2]. Hydrogen possesses a lower heating value of 120 MJ/kg and exhibits a flammability limit ranging from 4% vol. to 75% vol. at 298 K and 1 atm, enabling lean combustion and emission reduction. Additionally, hydrogen displays a laminar flame speed of 1.85 m/s at 298 K, 1 atm, and stoichiometric conditions [3,4]. The extensive flammability range, high flame speed, and low ignition energy requirements contribute to the efficiency of hydrogen-based engines. Consequently, hydrogen exhibits great potential as a fuel for internal combustion engines (ICE). Nonetheless, the optimization of strategies is essential to regulate NOx emissions resulting from hydrogen combustion in the air, and further advancements are necessary to enhance the thermal efficiency of hydrogen-fueled engines.
The argon power cycle (APC) hydrogen engine introduces a novel approach for achieving both high efficiency and zero emissions by substituting nitrogen with argon [5], wherein the primary constituent of the working fluid is argon, possessing a specific heat ratio (γ) of 1.67. Notably, the specific heat ratio of an Ar/O2 mixture surpasses that of air (γ < 1.40). Based on the efficiency equation of an ideal Otto cycle, as depicted in Equation (1), a greater specific heat ratio contributes to elevated thermodynamic efficiency.
η = 1     1   /   CR γ     1  
Experimental evidence has confirmed the improved indicated thermal efficiency (ITE) of APC hydrogen engines [6,7,8,9]. However, it is important to note that a higher specific heat ratio of the mixture leads to a higher combustion temperature and combustion rate, resulting in increased heat transfer losses and the occurrence of abnormal combustion phenomena, including knock, pre-ignition, and backfire. The presence of severe backfire or knock imposes limitations on the compression ratio of APC hydrogen engines. Kuroki et al. [10] conducted argon cycle experiments utilizing a Toyota engine, wherein abnormal combustion restricted the compression ratio to 4:1, with a maximum ITE of 41%. Killingsworth and Dibble et al. [11] found that stoichiometric combustion in APC hydrogen engines limited the compression ratio to 5.5:1 due to knock, which remains significantly lower compared to gasoline engines (typically ranging from 9:1 to 12:1), with the highest ITE recorded as 44.1%. In recent years, researchers have explored various technical approaches to mitigate knock, such as homogenous charge compression ignition, spark-assisted compression ignition [12], reducing the intake temperature below freezing [13,14], and substituting hydrogen with natural gas [12,13,14]. A summary of previous APC hydrogen engine studies is listed in Table 1.
It can be seen from Table 1 that previous studies on spark ignition APC hydrogen engines have predominantly focused on the engines with port hydrogen injection (PHI) systems. As for compression ignition APC hydrogen engines, although a hydrogen direct injection (HDI) was applied, the effects of the HDI strategy have not been researched. Intake boost has not been applied to APC hydrogen engines in the previous studies.
However, HDI has been extensively investigated in conventional hydrogen ICEs breathing the air, and it serves as a viable reference for APC hydrogen engines. In conventional hydrogen ICEs, HDI is considered a more suitable technical approach than PHI. This is because hydrogen, being a low-density gaseous fuel, occupies a considerable volume with PHI, resulting in reduced air breathed into the cylinder. The utilization of HDI, as opposed to PHI, yields a theoretical power density increase of 41% [18]. Additionally, backfire is a frequently encountered abnormal combustion phenomenon. Intake manifold damage can occur when the mixture ignites prematurely in the intake port due to a hotspot or exhaust reflux. The implementation of HDI enables closed-valve injection, theoretically eliminating the occurrence of backfire. In recent years, the injection pressure of HDI has surpassed that of PHI, typically exceeding 10 MPa [2]. Wallner et al. [19] conducted experiments on a conventional hydrogen ICE employing a 10 MPa HDI pressure and an 11.5:1 compression ratio. The results indicated that the HDI engine operated steadily within an equivalence ratio range of 0.25 to 0.9. Furthermore, HDI has the potential to enhance the ITE of hydrogen engines in comparison to PHI. Wimmer et al. [18] conducted a comparative study of ITE between HDI and PHI under different engine loads using a single-cylinder conventional hydrogen ICE. The study revealed that the equivalence ratio achievable with HDI could be lower than that of PHI at the same engine load, leading to a higher thermodynamic efficiency. Despite the higher heat transfer associated with HDI due to the increased in-cylinder temperatures, the ITE of HDI remained higher, exceeding 40% under medium engine loads. In contrast to conventional gasoline direct injection (GDI) engines, the injection strategy employed in HDI engines exerts a more pronounced influence on mixture formation and combustion. This distinction arises from the gaseous nature of hydrogen, characterized by a high diffusion coefficient and thermal conductivity. Consequently, an optimized injection strategy holds significant potential for achieving a substantial increase in thermal efficiency [20,21].
Previous studies have demonstrated the potential of the APC to enhance the thermal efficiency of hydrogen-fueled engines. However, the presence of abnormal combustion phenomena in APC hydrogen engines imposes limitations on both the compression ratio and the thermal efficiency. Addressing the challenge of mitigating knock induced by elevated in-cylinder temperatures at higher compression ratios remains an important research gap, which, if addressed, could lead to further improvements in thermal efficiency and expanded operating ranges. Additionally, while majority of prior investigations on APC hydrogen engines have employed PHI systems, exploring the effects of HDI on APC hydrogen engines warrants further research.
This paper presents a comprehensive investigation comprising experimental and simulation studies. Initially, HDI was implemented in an APC hydrogen engine, and a comparative analysis with PHI was conducted through experimental measurements. Subsequently, a three-dimensional simulation was employed to analyze the distribution of hydrogen in the HDI APC engine. By adjusting the parameters of HDI, stratified combustion was achieved, effectively retarding the combustion rate, and suppressing knock in the APC hydrogen engine. To further enhance the dynamic performance, intake boost was introduced, resulting in the attainment of super-lean combustion. However, it was observed that intake boost heightened the susceptibility of the APC hydrogen engine to knock. To address this issue and inhibit knock occurrence, port water injection (PWI) was implemented in the APC hydrogen engine. PWI demonstrated greater effectiveness in expanding the operating range under intake-boosted conditions. By combining HDI, intake boost, and PWI, an impressive gross indicated thermal efficiency (ITEg) of 59.35% was achieved in the APC hydrogen engine.

2. Research Approach

2.1. Experiment Setup

Experiments were carried out based on a four-stroke, three-cylinder GDI engine. Specifications of the engine are shown in Table 2. An Ar/O2 mixture with a molar ratio of 79:21 was selected as an oxidant. The hydrogen injection pressure was 10 MPa. The schematic diagram of the test bench is shown in Figure 1.
The engine was coupled with an API FR100 eddy current dynamometer. The throttle of the APC hydrogen engine was always fully open. An Omega FMA-2600A mass flow control meter controlled the pressure and mass flow of the Ar/O2 mixture. In this test condition, argon was not cycled. After passing through an Emerson Elite CMFS007M Coriolis flow meter, hydrogen was directly injected into the cylinder. A Kistler 6115C spark plug cylinder pressure sensor measured the in-cylinder pressure. Pressure transmitters and k-type thermocouples, respectively, measured the other pressure and temperature. Analog data were sampled by NI PCI 6250, and NI Compact RIO controlled the actuators in the engine. Control and acquisition user interfaces were displayed on a computer.
This engine was modified with a PWI system. The schematic diagram of the PWI system is shown in Figure 2. Water was transported to three port injectors by a pump. The water pressure was 0.3 MPa, controlled by a pressure-regulating valve.
The errors of measuring instruments associated with thermal efficiency calculation are shown in Table 3. The error of thermal efficiency was calculated according to the propagation of uncertainty principle. For the sake of simplicity and clarity of the figures, this study only shows the error bars of thermal efficiency in all the figures.
The engine performance data were based on the average of 200 engine cycles. η ITE was calculated by Equation (2), also known as net ITE (ITEn). W 0 720 is the indicated work in the whole cycle, i.e., from a 0 °crank angle (CA) to 720 °CA, m f is the mass of fuel per cycle, and LHV is the lower heating value of the fuel.
η ITE = W 0 720   /   ( m f   ×   LHV )
ITEg, namely η ITEg was calculated by Equation (3).   W IVC EVO is the indicated work from intake valve close (IVC) to exhaust valve open (EVO) in a cycle, i.e., −122 °CA ATDC to 153 °CA ATDC in this study. By comparing it, the influence of intake and exhaust flow was eliminated because intake boost was implemented.
η ITEg = W IVC EVO   /   ( m f   ×   LHV )
Indicated mean effective pressure (IMEP) was calculated by Equation (4), also known as net IMEP (IMEPn). V s is the cylinder-swept volume.
IMEP = W 0 720   /   V s
Gross IMEP (IMEPg) was calculated by Equation (5). Similar to ITEg, IMEPg is a parameter to characterize the engine performance from IVC to EVO.
IMEP g   = W IVC EVO   /   V s
The coefficient of variation of IMEP (COV), which indicates the fluctuation between engine cycles, was calculated by Equation (6). σ IMEP is the standard deviation of IMEP, μ IMEP is the mean IMEP of 200 cycles, and COV = 5% is the threshold of engine stability.
COV = σ IMEP   /   μ IMEP
The heat release rate (HRR) was calculated by Equation (7). γ is the specific heat ratio, P is the in-cylinder pressure, V is the cylinder volume, and θ is the crank angle.
dQ n d θ = γ γ     1 P dV d θ + 1 γ     1 V dP d θ
The equivalence ratio ( φ ) was calculated by Equation (8). n H 2 is the mole fraction of hydrogen in the mixture, and n O 2 is the mole fraction of oxygen in the mixture.
φ = n H 2   /   ( 2   ×   n O 2 )
The knock intensity (KI) is quantified by the maximum absolute value of in-cylinder pressure in one cycle after bandpass filtering. It is generally stipulated that knock occurs when the KI > 0.1 MPa. In this study, KI was calculated from the average cylinder pressure of 200 cycles, representing the average knock intensity of 200 cycles. The knock ratio (KR) was calculated by Equation (9). When the KI of a single cycle is more than 0.1 MPa, this cycle will be judged to have knock. N knock is the number of knock cycles, and N total is the total number of 200 cycles.
KR = N knock   /   N total   ×   100 %
The crank angle of 10% heat release (CA10) represents the moment when fuel starts to burn, CA50 indicates the middle point of combustion, and the crank angle of 90% heat release (CA90) is the end of combustion.

2.2. Simulation Setup

A 3D geometrical model of this engine was imported into Converge, and then it was divided according to different boundaries. In this investigation, the combustion chamber was subjected to an encryption with a scaling factor of two. Additionally, the intake port and cylinder underwent adaptive mesh refinement (AMR) with a level three refinement strategy to capture variations in the inlet velocity and cylinder temperature. The encryption procedure also incorporated a level three encryption for the intake valve cone and the exhaust valve cone. Close to the spark plug, two spherical encryptions were implemented, with encryption levels respectively specified as level four and level five. Moreover, level four encryption was applied to the injection region of the direct injection nozzle, as indicated in Table 4.
A mesh sensitivity analysis was then carried out. When the other parameters were the same, the pressure with different grid sizes was as shown in Figure 3. When the base grid size is too big, pressure will deviate from other groups. Considering the calculation accuracy and time consumption, a base grid size of 4 mm was employed.
Since the number of cells is dynamic, during the whole cycle, the minimum number of cells was 138,162, and the maximum number of cells was 686,574. The mesh of the model is shown in Figure 4.
Both the combustion model based on SAGE and the turbulence model based on the RNG k-ε model in RANS were employed [22,23]. Turbulent kinetic energy, k, and turbulent dissipation rate, ε, were calculated by Equations (10) and (11). τ ij is the Reynolds stress, u i is the speed of each point, S is the source term, and S s is the discrete source term.
ρ k t + ρ u i k x i = τ ij u i x j + x j μ Pr k k x j   ρ ε + C s 1 . 5 S s
ρ ε t + ( ρ u i ε ) x i = x j μ Pr ε ε x j + C ε 3 ρ ε u i x i + C ε 1 u i x j τ ij   C ε 2 ρ ε + C s S s ε k + S     ρ R
R and η were calculated by Equations (12) and (13). The other parameters were empirical values.
R = C μ η 3 ( 1     η   /   η 0 ) ( 1 + β η 3 ) ε 2 k
η = k ε S ij = k ε 2 S ij S ij
Then, the boundary conditions were modified to calibrate the model. The main cases of simulation are shown in Table 5, and the unit of flow rate was standard liter per minute (SLPM).
The first eight cases were tested in the experiment, and the last four cases were only used to explore the boundary of hydrogen injection timing (INT). Therefore, the comparison between the in-cylinder pressure of the simulation and experiment of the first eight cases is shown in Figure 5, and the pressure at ignition timing (IGT), the maximum pressure, and the maximum pressure phase are listed in Table 6. In summary, the relative error met the requirements.
In this study, the change of thermodynamic parameters was qualitatively analyzed by a one-dimensional simulation with GT-Power in some cases. The one-dimensional model was built according to the engine parameters as listed in Table 2. The calibration conditions are listed in Table 7, and the comparison between the simulation and experiment pressure is shown in Figure 6.
The comparison between the key parameters of the one-dimensional simulation and experiment is presented in Table 8. In summary, the relative error of the one-dimensional simulation model was acceptable.

3. Results and Discussion

3.1. Effects of HDI on APC Hydrogen Engine

In this section, HDI and PHI based on the APC hydrogen engine are compared in the experiment first. The oxidant flow rate (OFR) was controlled to 430 SLPM, so that the intake pressure (absolute) was 0.1 MPa, the hydrogen flow rate (HFR) was variable, and the engine speed was 1000 rpm. The hydrogen INT of PHI was −270 °CA ATDC, while that of HDI was −60 °CA ATDC. IGT was adjusted to maximum brake-torque timing (MBT). However, when the equivalence ratio was 0.365, 0.42, and 0.465, IGT was, respectively, delayed to 5 °CA ATDC, 10 °CA ATDC, and 10 °CA ATDC to evade knock. Figure 7 shows the IMEP and ITE of the PHI and HDI APC engines with different equivalence ratios in the experiment.
The KR of each condition is marked in Figure 7. The KI was marked only when it was more than 0.1 MPa, and COV was marked only when it was more than 5%. Under PHI conditions, the APC hydrogen engine can only work stably when the equivalence ratio is between 0.17 and 0.21. Under HDI conditions, when the equivalence ratio is 0.18, the APC hydrogen engine cannot work stably. However, the APC hydrogen engine can work almost without knock when equivalence ranges from 0.18 to 0.29. By delaying IGT, the HDI APC engine can work stably with an equivalence ratio up to 0.42, which means the HDI APC engine works stably with 0.21 < φ < 0.42. Compared with PHI, HDI sharply extended the operating range of the APC hydrogen engine. The ITE of HDI was lower than that of PHI under φ = 0.17 conditions because of an unstable working state. However, with the increase of the equivalence ratio, the ITE of HDI was higher than that of PHI, and the difference in the ITE between HDI and PHI was larger. In summary, HDI can avoid knock at a higher equivalence ratio, resulting in a higher ITE.
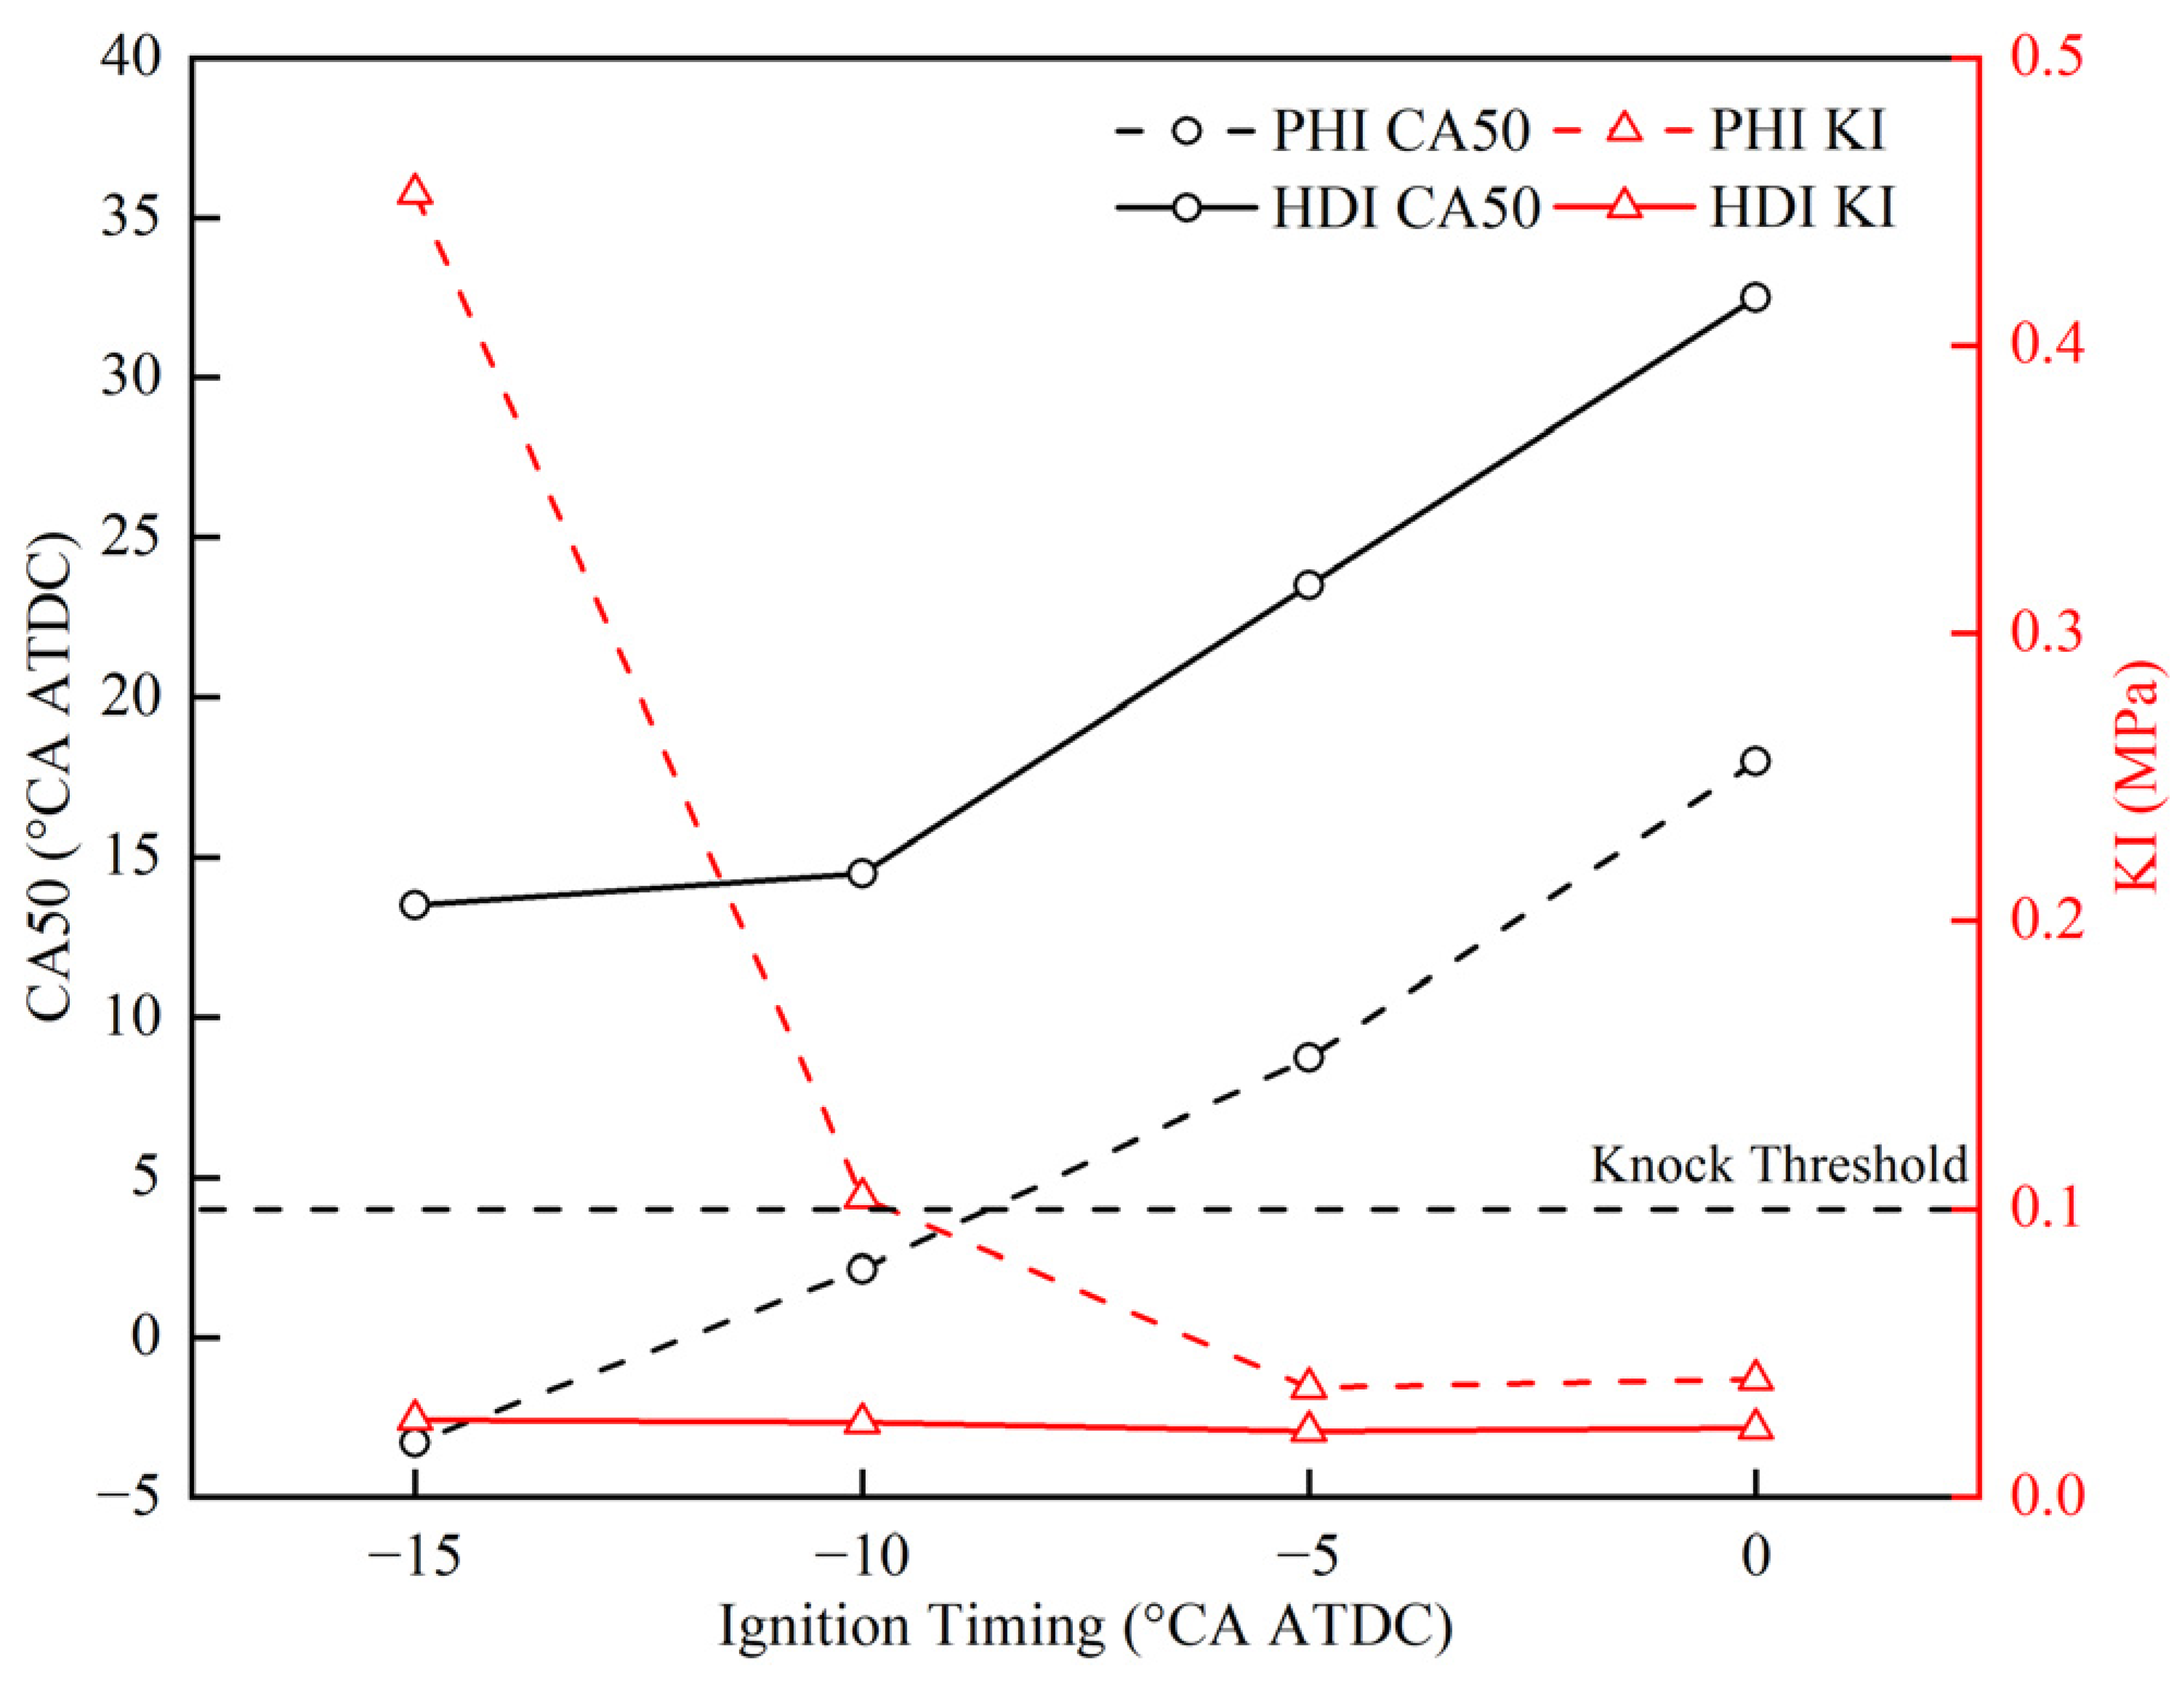
To explore the reason for the HDI operating range extension on the APC hydrogen engine, and the influence of the INT of HDI on combustion, further experiments were carried out. Under 1000 rpm speed, OFR = 430 SLPM, HFR = 30 SLPM, and the INTs of PHI and HDI of, respectively, −270 °CA ATDC and −60 °CA ATDC conditions, the CA50 and KI of PHI and HDI with different IGTs in the experiment are shown in Figure 8. For both PHI and HDI, CA50 was advanced, and the KI was higher with an earlier IGT. However, at an identical IGT, the CA50 of HDI was significantly later than that of PHI.
The experiment results of the CA50 and KI with different INTs of HDI under HFR = 40 SLPM, OFR = 430 SLPM, and −10 °CA ATDC IGT conditions are illustrated in Figure 9. CA50 was earlier, and the KI was higher with a more advanced INT, except for −40 °CA ATDC INT, i.e., for −40 °CA ATDC INT, CA50 was earlier, and the KI was higher than those of −50 °CA and −60 °CA ATDC INT.
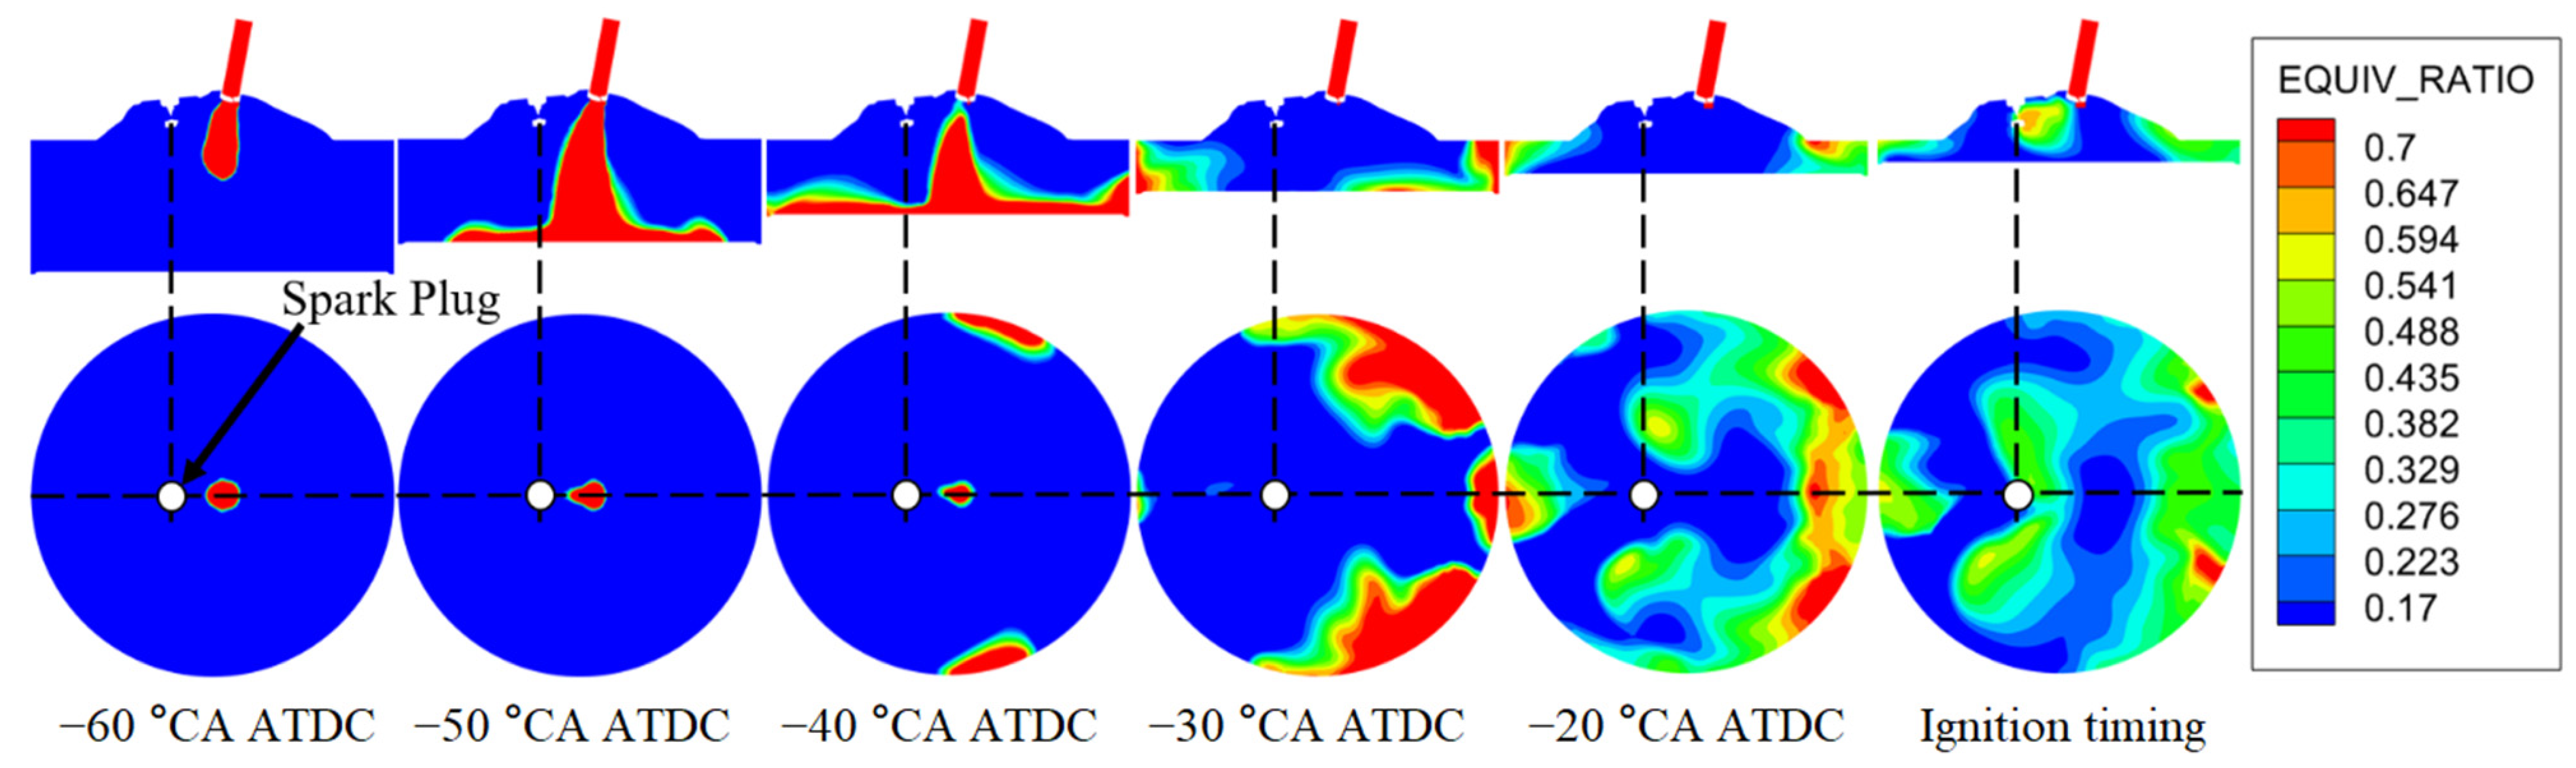
The distribution of hydrogen in the cylinder was clarified through a three-dimensional simulation. Under 1000 rpm speed, HFR = 40 SLPM, OFR = 430 SLPM, −10 °CA ATDC IGT, and −60 °CA ATDC INT conditions, the variation of hydrogen distribution with CA is shown in Figure 10. According to the PHI experiment, under these conditions, unstable combustion will occur with φ < 0.17. Therefore, 0.17 was the lower limit of φ in this figure.
After INT, hydrogen jets hit the piston top first due to the small nozzle angle. As the piston went upward, hydrogen was compressed and diffused to the cylinder wall, then bounced back to the center of the combustion chamber. If there is a large enough time interval between INT and IGT, the hydrogen jets will go back and forth between the center of the combustion chamber and the cylinder wall several times, and the mixture will eventually reach a homogeneous state.
In this case, the mixture was stratified at IGT. However, unlike conventional stratified combustion, most of the mixture near the spark plug was lean. The rich area was concentrated near the cylinder wall, which is not conducive to flame propagation. The mixture under the PHI condition is considered homogeneous, so fuel burned faster than in the HDI condition (−60 °CA ATDC INT), as shown in Figure 8. When the overall equivalence is too low, this stratified state will deteriorate combustion, which also explains the unstable working state of HDI under the φ = 0.18 condition, as shown in Figure 7.
Furthermore, under 1000 rpm speed, HFR = 40 SLPM, OFR = 430 SLPM, and −10 °CA ATDC IGT conditions, simulations with INT ranging from −40 °CA ATDC to −270 °CA ATDC were carried out. Hydrogen distribution at IGT with different INTs is shown in Figure 11. The text under each image represents the INT.
A dimensionless number coefficient of uniformity (CU) was introduced to quantify the uniformity of the mixture. CU is defined as in Equation (14):
CU = 1     σ phi   /   μ phi
where σ phi is the standard deviation of the equivalence ratio, μ phi is the average value of the equivalence ratio, and the CU of these cases is shown in Figure 12.
With an earlier INT, the in-cylinder mixture became more homogeneous, as indicated by the higher CU shown in Figure 12. However, the combustion rate is determined not by CU but by the specific mixture distribution. Figure 10 illustrates that at the IGT, the mixture surrounding the spark plug for an INT of −50 °CA ATDC was leaner compared to that of the −60 °CA ATDC INT, with a rich region located near the cylinder wall, leading to slower combustion. Conversely, hydrogen accumulated in the center of the cylinder at the IGT with an INT of −40 °CA ATDC, explaining the more rapid combustion observed for the INT of −40 °CA ATDC compared to −50 °CA and −60 °CA ATDC, as shown in Figure 9.
When the INT was advanced to a position earlier than −70 °CA ATDC, a rich zone with φ > 0.6 no longer existed in the cylinder, and the area of the lean zone with φ < 0.17 was also reduced. This resulted in a more homogeneous in-cylinder mixture, which also accounts for the gradual advancement of the CA50 when the INT was earlier than −60 °CA ATDC, as depicted in Figure 9. Furthermore, Figure 12 demonstrates that the CU exceeded 0.8 and slowly increased when the INT was earlier than −100 °CA ATDC, indicating a high level of mixture uniformity in the cylinder. The trends observed in Figure 9 align with this pattern, as the change in CA50 became less significant when the INT was earlier than −100 °CA ATDC.
In conclusion, HDI in the APC hydrogen engine allows for the formation of a stratified mixture that discourages rapid combustion by adjusting the INT. This effectively addresses the issue of hydrogen burning too quickly in an Ar/O2 atmosphere and helps suppress knock. HDI significantly expands the operating range of the APC hydrogen engine due to its characteristics of combustion retardation and inhibition of backfire.

3.2. Effects of Intake Boost on the APC Hydrogen Engine

To further improve the APC hydrogen engine’s dynamic performance and thermal efficiency with HDI, intake boost is introduced in this section, which enhances the power output while the mixture is not enriched. The intake pressure (absolute) of the intake-boosted condition was set to 0.2 MPa. According to the energy flow model of four-stroke internal combustion engines, different mean effective pressures (MEP) inside the engine are shown in Figure 13a. In this study, the compression energy of the intake boost was provided outside of the APC hydrogen engine, so the energy flow model was changed, as shown in Figure 13b.
Fuel MEP (FuelMEP) consists of released heat MEP (QMEP) and combustion losses MEP (CLMEP). QMEP comprises heat transfer losses MEP (HTMEP), exhaust losses MEP (EXMEP), and IMEPg. IMEPg contains IMEPn and pumping losses MEP (PMEP). Finally, brake MEP (BMEP) is IMEPn minus friction losses MEP (FMEP). It can be seen that pumping losses MEP turned into pumping gains MEP (to facilitate comparison, it is still abbreviated to PMEP). To eliminate the influence of external energy on load and thermal efficiency and to better compare intake-boosted and naturally aspirated conditions, IMEPg and ITEg were selected for further analysis.
Under 1000 rpm speed, φ = 0.22, and IGT −10 °CA ATDC conditions, a comparison of the cylinder pressure with the −100 °CA ATDC INT between natural aspirate (OFR = 430 SLPM) and intake boost (OFR = 800 SLPM) in the experiment is shown in Figure 14a, and the CA50 and KI with different INTs of natural aspirate and intake boost are shown in Figure 14b.
When the other parameters were the same, the cylinder pressure during the intake, compression, and power strokes in intake-boosted conditions was significantly higher compared to the naturally aspirated groups, whereas there was minimal difference in the cylinder pressure during the exhaust stroke. The intake-boosted group exhibited a maximum cylinder pressure of 7.82 MPa, whereas the naturally aspirated group recorded 5.01 MPa, indicating a substantial increase in the load of the APC hydrogen engine due to intake boost. Figure 14b presents the KR for each KI point, excluding KR = 0. As the HFR of intake-boosted groups was approximately 1.86 times that of the naturally aspirated groups, the hydrogen distribution within the cylinder significantly differed from each other. Consequently, the CA50 of the intake-boosted groups was higher than that of the naturally aspirated groups, even with the same INT. In the naturally aspirated groups, the KR was zero when the INT was −50 °CA ATDC and −60 °CA ATDC. In contrast, the minimum KR in the intake-boosted groups was 16%. With the advancement of the INT, both the KI and KR in intake-boosted groups increased more rapidly than in the naturally aspirated groups due to the higher load. The KI exceeded the knock threshold when the INT was earlier than −80 °CA ATDC in both groups. In summary, intake boost amplified the load of the APC hydrogen engine and increased the propensity for knock at the same equivalence ratio. The one-dimensional simulation results depicted in Figure 15 support this observation by demonstrating an increase in the temperature and pressure at ignition timing as the intake pressure rose. For instance, when the intake pressure rose from 0.1 MPa to 0.2 MPa, the temperature at ignition timing surged from 865.96 K to 965.69 K (an approximately 100 K increase), and the pressure at ignition timing elevated from 2.32 MPa to 5.08 MPa. The elevated temperature and pressure levels promoted the occurrence of spontaneous hydrogen combustion, thereby heightening the probability of knock.
The effect of intake boost on the thermal efficiency was analyzed as follows. Under the 1000 rpm condition, trends of ITEg and COV with different equivalence ratios of intake boost and natural aspirate in the experiment are shown in Figure 16.
The maximum ITEg point with COV < 5% under each equivalence ratio was selected in this figure. If the minimum COV under a certain equivalence ratio was still higher than 5%, which means the APC hydrogen engine could not work stably under this condition, the figure will not show the ITEg of this point. If the KI of a specific point exceeded 0.1 MPa, it will be marked in the figure. The working condition of the APC hydrogen engine at 1000 rpm can be divided into four parts according to different equivalence ratios. When φ > 0.255, due to the knock tendency enhancement of the intake boost, no matter how the parameters are adjusted, the APC hydrogen engine with intake boost cannot work stably (COV > 5%). In contrast, as mentioned earlier, the APC hydrogen engine with natural aspirate can work stably under 0.21 < φ < 0.42. The second part was 0.21 < φ ≤ 0.255, and the KI and COV of intake-boosted groups declined with the decrease of the equivalence ratio, which means that the APC hydrogen engine worked more steadily. The ITEg of both the naturally aspirated and intake-boosted conditions increased with the reduction of the equivalence ratio, and the ITEg of the intake-boosted conditions was slightly higher than that of the naturally aspirated conditions. When the mixture was diluted with 0.165 < φ ≤ 0.21, the COV of the naturally aspirated groups increased as the equivalence ratio decreased, indicating that the in-cylinder mixture was too lean for the naturally aspirated conditions. However, the APC hydrogen engine under intake-boosted conditions still worked stably due to the higher load. The ITEg of intake boost was higher than natural aspirate in this part. In other words, intake boost broadened the lean combustion boundary of the APC hydrogen engine and improved the thermal efficiency under super-lean combustion conditions. The equivalence ratio of the last part was less than 0.165. Under this condition, the mixture was too thin, and even the APC hydrogen engine with intake boost cannot work consistently.
The ITEg tended to increase and then decrease as the equivalence ratio decreased for both intake boost and natural aspirate. Nevertheless, the maximum ITEg occurred at different equivalence ratios. The APC hydrogen engine with natural aspirate had the highest ITEg of 56.39% under φ = 0.213. The APC hydrogen engine with intake boost reached a 57.89% ITEg under φ = 0.204. To sum up, intake boost not only broadened the lean combustion, load, and thermal efficiency boundaries of the APC hydrogen engine, but also introduced a stronger knock tendency, and limited the increase of the equivalence ratio compared with natural aspirate.
The experiment results of the MEPs and the thermal efficiency of the above operating points under intake boost are shown in Figure 17. IMEPg showed a decreasing trend with the reduction of the equivalence ratio. Since the intake boost pressure was the same, the PMEP of these cases was almost identical, about 0.04 MPa. The difference between ITEg and ITEn was the efficiency caused by pumping gains, ranging from 2.75% to 3.97%.

3.3. Effects of PWI on the APC Hydrogen Engine

In this section, PWI based on the HDI APC engine is implemented. Water INT was set to −360 °CA ATDC. Experiments of PWI under 1000 rpm (both natural aspirate and intake boost), 1500 rpm (both natural aspirate and intake boost), and 2000 rpm (only natural aspirate) conditions were conducted, as listed in Table 9.
A comparison of the different parameters among the no PWI, 15.89 mg, 24.42 mg, and 32.94 mg water injections per cycle (water injection duration is 2 ms/cycle, 4 ms/cycle, and 6 ms/cycle) conditions in the experiment is shown in Figure 18.
When IGT was constant, the CA50 was delayed by at least 3.5 °CA with the implementation of PWI. It is worth noting that under the 1500 rpm, intake boost, and IGT = 0 °CA ATDC conditions without PWI, a pre-ignition occurred, leading to CA50 even earlier than the IGT by −5 °CA ATDC. However, with the 15.89 mg/cycle of PWI, pre-ignition was inhibited, and CA50 was substantially delayed from −5 °CA ATDC to 27 °CA ATDC. Furthermore, CA50 was further delayed with an increase in the amount of PWI while keeping the other parameters constant. The comparison of IMEPg among these conditions was more intricate. When examining the 2000 rpm naturally aspirated condition with 0 °CA ATDC IGT, IMEPg decreased with the implementation of PWI because the KI of the no PWI group was lower than the knock threshold. For the 1500 rpm naturally aspirated condition with 0 °CA ATDC IGT, the IMEPg of the no PWI group was slightly higher than that of the 15.89 mg/cycle PWI group. However, for the other three groups, the IMEPg increased at 0 °CA ATDC IGT with PWI due to the higher KI values in the absence of PWI. A similar pattern persisted when increasing the amount of PWI. In summary, KI = 0.22 MPa serves as a critical threshold. When the original condition’s KI is higher than 0.22 MPa, introducing PWI or increasing the amount of PWI will increase the IMEPg, and vice versa. In all five groups, the introduction of PWI and an increase in the PWI amount consistently reduced the KI, which helped to offset the increase in the KI caused by advancing the IGT. Regarding the COV, PWI effectively kept the COV within the stability threshold for all five groups.
In order to elucidate the aforementioned phenomena, the experimental conditions were verified through simulation. Specifically, the natural aspirate condition was maintained at 1000 rpm, while keeping all parameters consistent with Case 1, as detailed in Table 9, and the IGT was 0 °CA ATDC. Water injection mass flow rates of 15.89 mg/cycle, 24.42 mg/cycle, and 32.94 mg/cycle were employed. The resulting temperatures, pressures, and specific heat ratios for these cases are presented in Figure 19.
As the water injection mass increased, notable changes were observed in the compression stroke and combustion process. The pressure during compression decreased, alongside a significant reduction in temperature during the compression and power strokes. At IGT, the rise in the water injection mass from 0 to 32.94 mg/cycle resulted in a decline in pressure from 2.73 MPa to 2.08 MPa, accompanied by a decrease in temperature from 854.96 K to 641.79 K. The diminishing pressure and temperature levels led to a decrease in the combustion speed and knock inhibition.
Conversely, an increase in the water injection mass led to a substantial decrease in the specific heat ratio. During the intake stroke under the water injection conditions, the specific heat ratio experienced an initial sharp decline followed by a subsequent increase, whereas the condition without the water injection exhibited a gradual increase. The discrepancies in the specific heat ratio between the intake and compression strokes among these cases were much more pronounced compared to those observed in the power and exhaust strokes. This discrepancy is attributed to the conversion of hydrogen and a portion of oxygen into water after combustion, resulting in a closer alignment between the proportion of water in the power and exhaust strokes compared to the intake and compression strokes. To summarize, the reduction in the specific heat ratio gave rise to a loss of thermodynamic efficiency.
The ITEg and IMEPg boundaries of the APC hydrogen engine with HDI are shown in Figure 20. The working condition of the APC hydrogen engine was still divided into five groups: 1000 rpm natural aspirate, 1000 rpm intake boost, 1500 rpm natural aspirate, 1500 rpm intake boost, and 2000 rpm natural aspirate. The highest ITEg or IMEPg operating point with COV < 5% of each group was selected.
Figure 20 demonstrates the relationship between IMEPg and the equivalence ratio for both the naturally aspirated and intake-boosted conditions in the APC hydrogen engine experiment. The IMEPgs of the naturally aspirated and intake-boosted conditions, respectively, showed good linearity, and most operating points fell within the 95% confidence band, which means that after optimization, WPI at least did not significantly reduce the dynamic performance of the APC hydrogen engine. In conventional ICE, the operating points of high thermal efficiency and working ability often appear above 2000 rpm. However, limited by the severe knock tendency, even with the application of WPI, the highest thermal efficiency point of the APC hydrogen engine appeared at 1000 rpm, and the expected thermal efficiency improvement caused by the increase in the engine speed did not occur.
PWI raised the maximum equivalence ratio from 0.47 to 0.54 and increased the IMEPg from 0.78 MPa to 0.88 MPa (a 12.82% increase) at different engine speeds under naturally aspirated conditions. In intake-boosted conditions, the maximum equivalence ratio increased from 0.25 to 0.31, and the IMEPg increased from 0.89 MPa to 1.14 MPa (a 28.09% increase) at different engine speeds. However, it is challenging to increase the IMEPg solely by delaying the IGT and increasing the equivalence ratio due to the stronger knock tendency in intake-boosted conditions. PWI proved more effective in intake-boosted conditions than in naturally aspirated conditions. Regarding the ITEg, when the original working conditions involve knock, introducing PWI and adjusting IGT can yield a higher ITEg. For example, under a φ = 0.34, 2000 rpm naturally aspirated condition, the ITEg increased from 51.13% to 52.36% by application of WPI.
PWI had positive effects on the thermal efficiency primarily due to knock avoidance, combustion stability improvement, and heat transfer losses reduction. However, it also had negative effects on the thermal efficiency, primarily due to a reduction in the specific heat ratio and the increase of thermodynamic losses. When the negative effects outweighed the positive effects, the ITEg of conditions with PWI was lower than that of conditions without PWI. For example, the highest ITEg among 1000 rpm naturally aspirated conditions without PWI was 56.39% (at φ = 0.21), whereas the highest ITEg among 1000 rpm naturally aspirated conditions with PWI was 53.89% (at φ = 0.34). Conversely, when the positive effects outweighed the negative effects, the ITEg of conditions with PWI was higher than that of conditions without PWI. For instance, the highest ITEg among 1000 rpm intake-boosted conditions without PWI was 57.89% (at φ = 0.20), whereas the highest ITEg among 1000 rpm intake-boosted conditions with PWI was 59.35% (at φ = 0.27).

3.4. Analysis of the APC Hydrogen Engine Boundaries’ Expansion

In order to assess the impact of different technical approaches on the expansion of thermal efficiency and dynamic boundaries, the parameters of the APC hydrogen engines operating at 1000 rpm are presented in Table 10. Initially, the substitution of HDI for PHI effectively inhibited knock, resulting in an increase of the maximum ITEg from 54.12% to 56.39%, and of the maximum IMEPg from 0.41 MPa to 0.78 MPa.
Subsequently, the introduction of an increased intake pressure from 0.1 MPa to 0.2 MPa enabled the realization of intake boost. Although this modification led to a rise in the maximum IMEPg from 0.78 MPa to 0.89 MPa, and in the maximum ITEg from 56.39% to 57.89%, the desired enhancements in the IMEPg and ITEg were not fully achieved due to the higher tendency for knock under the intake-boosted condition.
Finally, WPI was implemented to further suppress knock, resulting in a significant improvement in the engine performance. With the application of WPI, the maximum IMEPg reached 1.06 MPa, and the maximum ITEg reached 59.35%.
To clarify the expansion of the APC hydrogen engine boundaries, the previous studies’ results were summarized and illustrated in Figure 21. The APC hydrogen engine boundaries were evaluated by the extreme values of five parameters, i.e., maximum compression ratio, maximum speed, minimum equivalence ratio under stable working conditions, maximum ITEg, and maximum IMEPg. Unfortunately, some parameters were not revealed in the previous studies, e.g., the minimum equivalence ratio under stable working conditions of De Boer and Ikegami, the maximum IMEPg of Kuroki, and the engine speed of Cech [6,7,10,11,15,16,17].
Ikegami, Mitani, and Cech [7,15,16] used compression ignition on the APC hydrogen engine and achieved good performance, i.e., Ikegami achieved the highest compression ratio of 16 and IMEPg of 1.29 MPa (estimated), and Mitani [15] reached the lowest equivalence ratio of 0.161 and a 2000 rpm engine speed, which is higher than other published papers. In further APC hydrogen engine research, a higher thermal efficiency may be available using compression ignition. Only Kuroki [10] used HDI in the APC hydrogen engine with spark ignition. However, due to the low injection pressure at that time, HDI was performed during the intake stroke, and could not suppress knock.
In this study, the APC hydrogen engine could work stably under 2000 rpm with a 0.72 MPa IMEPg, which is the same speed as that of Mitani [15] (tied for the highest), but the IMEPg was higher than Mitani’s at 0.3 MPa. The highest IMEPg of this study was 1.14 MPa, which is the second highest among the published papers. The lowest equivalence ratio under stable working conditions was 0.165, which is close to that of Mitani [15]. It is noteworthy that this study obtained the highest ITEg of 59.35% through the combination of HDI, intake boost, and PWI at a compression ratio of only 9.6, which is the highest ITEg among published papers, and has the potential to further increase the compression ratio and the thermal efficiency.

4. Conclusions

This paper focused on the experimental and simulation analysis of an APC hydrogen engine, exploring various techniques to expand its operating range and improve thermal efficiency. A comparison between HDI and PHI was conducted, followed by an investigation into the injection characteristics of HDI using three-dimensional simulations. To further expand the working conditions, intake boost was applied to the APC hydrogen engine, enabling stable combustion of leaner mixtures. In an attempt to suppress severe knock, the use of PWI was explored. The major conclusions drawn from this study can be summarized as follows:
(1) Under naturally aspirated conditions at a 1000 rpm engine speed, HDI extended the operating range of the APC hydrogen engine compared to PHI. HDI increased the equivalence ratio from 0.17–0.21 to 0.21–0.42 and the maximum IMEP from 0.39 MPa to 0.77 MPa (IMEPg from 0.41 MPa to 0.78 MPa). By avoiding knock, HDI improved the ITE of the APC hydrogen engine at higher equivalence ratios compared to PHI.
(2) Through a combination of experimental and simulation results, the effects of the HDI INT on the APC hydrogen engine were researched for the first time. It was found that adjusting the INT in HDI led to a stratified combustion state in the cylinder, with a lean mixture near the spark plug and a rich mixture near the cylinder wall. In conventional ICE, the stratified state of the mixture is involved to increase the combustion rate. Conversely, the APC hydrogen engine needs a stratified state of the mixture that retards the combustion rate, compensating for the inherently fast combustion rate of the APC hydrogen engine and suppressing knock.
(3) The effects of intake boost on the APC hydrogen engine were analyzed for the first time. It significantly enhanced the dynamic performance and thermal efficiency of the APC hydrogen engine at a 1000 rpm engine speed, expanding the lean combustion boundary to an equivalence ratio of φ = 0.165. However, intake boost also increased the propensity for knock, and stable operation was not achievable at equivalence ratios higher than φ = 0.255 due to severe knock.
(4) PWI proved effective at delaying the CA50 and suppressing knock by decreasing the in-cylinder pressure and temperature. It was particularly efficient in widening the operating range of the intake-boosted conditions. Overall, PWI improved the equivalence ratio from 0.25 to 0.31 and the IMEPg from 0.89 MPa to 1.14 MPa. The maximum ITEg with PWI in the intake-boosted conditions reached 59.35%. The operating characteristics of the APC hydrogen engine are different from the conventional ICE. Due to the severe knock tendency under higher engine speeds, after being optimized by PWI, the highest thermal efficiency point of the APC hydrogen engine was still at 1000 rpm, which is much lower than the conventional ICE.
(5) A comprehensive five-dimensional analysis demonstrated the expansion of the APC hydrogen engine’s boundaries. This study achieved the highest ITEg of 59.35%, surpassing other published papers. The lowest equivalence ratio achieved in this study was 0.165, which is close to the lowest reported in the literature. Furthermore, the APC hydrogen engine stably operated at 2000 rpm, tying for the highest reported speed in the existing literature.

Author Contributions

Conceptualization, W.D., J.D. and L.L.; methodology, R.D.; investigation, W.D., C.W., R.D., H.Y., Y.T., and Z.M.; data curation, W.D.; writing—original draft preparation, W.D.; writing—review and editing, J.D. and L.L. All authors have read and agreed to the published version of the manuscript.

Funding

This work was supported by the Natural Science Foundation of China (grant number 52076153), the Science and Technology Plan Project of Shanghai (grant number 22ZR1463000), and the Science and Technology Plan Project of Ningbo (grant number 2022Z023).

Data Availability Statement

Data are available in this paper.

Conflicts of Interest

The authors declare no conflict of interest.

Abbreviations

AMRadaptive mesh refinement
APCargon power cycle
ATDCafter top dead center
BMEPbrake mean effective pressure
CAcrank angle
CA10crank angle of 10% heat release
CA50crank angle of 50% heat release
CA90crank angle of 90% heat release
CLMEPcombustion losses mean effective pressure
COVcoefficient of variation of IMEP
CUcoefficient of uniformity
EXMEPexhaust losses mean effective pressure
FSfull scale
GDIgasoline direct injection
HDIhydrogen direct injection
HFRhydrogen flow rate
HRRheat release rate
HTMEPheat transfer losses mean effective pressure
ICEinternal combustion engine
IGTignition timing
IMEPindicated mean effective pressure
IMEPggross indicated mean effective pressure
IMEPnnet indicated mean effective pressure
INRinjection ratio
INTinjection timing
ITEindicated thermal efficiency
ITEggross indicated thermal efficiency
ITEnnet indicated thermal efficiency
KIknock intensity
KRknock ratio
MEPmean effective pressure
OFRoxidant flow rate
PHIport hydrogen injection
PMEPpumping losses mean effective pressure
PWIport water injection
QMEPreleased heat mean effective pressure
SLPMstandard liter per minute

References

  1. Yilanci, A.; Dincer, I.; Ozturk, H.K. A review on solar-hydrogen/fuel cell hybrid energy systems for stationary applications. Prog. Energy Combust. Sci. 2009, 35, 231–244. [Google Scholar] [CrossRef]
  2. Verhelst, S.; Wallner, T. Hydrogen-fueled internal combustion engines. Prog. Energy Combust. Sci. 2009, 35, 490–527. [Google Scholar] [CrossRef] [Green Version]
  3. Verhelst, S. Recent progress in the use of hydrogen as a fuel for internal combustion engines. Int. J. Hydrog. Energy 2014, 39, 1071–1085. [Google Scholar] [CrossRef] [Green Version]
  4. Das, L.M. Hydrogen-Fueled Internal Combustion Engines; Woodhead Publishing: Cambridge, UK, 2016; pp. 177–217. [Google Scholar] [CrossRef]
  5. Laumann, E.A.; Reynolds, R.K. Hydrogen-Fueled Engine; Patent Application National Aeronautics and Space Administration: Pasadena, CA, USA, 1978.
  6. De Boer, P.C.T.; Hulet, J.-F. Performance of a hydrogen-oxygen-noble gas engine. Int. J. Hydrogen Energy 1980, 5, 439–452. [Google Scholar] [CrossRef]
  7. Ikegami, M.; Miwa, K.; Shioji, M. A study of hydrogen fuelled compression ignition engines. Int. J. Hydrogen Energy 1982, 7, 341–353. [Google Scholar] [CrossRef]
  8. Deng, J.; Gong, X.; Zhan, Y. Experimental on in-cylinder combustion characteristics of methane in argon-oxygen atmosphere. Trans. Csice 2017, 35, 38–43. [Google Scholar] [CrossRef]
  9. Mohammed, A.M.; Masurier, J.B.; Elkhazraji, A. A Path towards High Efficiency Using Argon in an HCCI Engine; SAE Technical Paper; SAE: Warrendale, PA, USA, 2 April 2019. [Google Scholar] [CrossRef]
  10. Kuroki, R.; Kato, A.; Kamiyama, E. Study of High Efficiency Zero-Emission Argon Circulated Hydrogen Engine; SAE Technical Paper; SAE: Warrendale, PA, USA, 12 April 2010. [Google Scholar] [CrossRef]
  11. Killingsworth, N.J.; Rapp, V.H.; Flowers, D.L. Increased efficiency in SI engine with air replaced by oxygen in argon mixture. Proc. Combust. Inst. 2011, 33, 3141–3149. [Google Scholar] [CrossRef] [Green Version]
  12. Shi, S.; Tomomatsu, Y.; Chaturvedi, B. Engine efficiency enhancement and operation range extension by argon power cycle using natural gas. Appl. Energy 2021, 281, 116109. [Google Scholar] [CrossRef]
  13. Jan, S.; Mohammed, A.; Elkhazraji, A. The Road towards High Efficiency Argon SI Combustion in a CFR Engine: Cooling the Intake to Sub-Zero Temperatures. SAE Technical Paper; SAE: Warrendale, PA, USA, 14 April 2020. [Google Scholar] [CrossRef]
  14. Elkhazraji, A.; Mohammed, A.; Jan, S. On Maximizing Argon Engines’ Performance via Subzero Intake Temperatures in HCCI Mode at High Compression Ratios. SAE Technical Paper; SAE: Warrendale, PA, USA, 14 April 2020. [Google Scholar] [CrossRef]
  15. Mitani, S.; Sawada, D.; Kosuda, T. Study of increased thermal efficiency using argon circulated hydrogen engine. Toyota Tech. Rev. 2008, 56, 64–69. [Google Scholar]
  16. Cech, M.; Knape, M.; Wilfert, T. The emission-free hydrogen closed-cycle engine. MTZ Worldw. 2021, 82, 42–47. [Google Scholar] [CrossRef]
  17. Jin, S.; Deng, J.; Wang, C. Knock Inhibition in Hydrogen Fueled Argon Power Cycle Engine with a Higher Compression Ratio by Water Direct Injection at Late Exhaust Stroke; SAE Technical Paper; SAE: Warrendale, PA, USA, 11 April 2023. [Google Scholar] [CrossRef]
  18. Wimmer, A.; Wallner, T.; Ringler, J. H2-Direct Injection-A Highly Promising Combustion Concept; SAE Technical Paper; SAE: Warrendale, PA, USA, 11 April 2005. [Google Scholar] [CrossRef]
  19. Wallner, T.; Nande, A.; Naber, J. Evaluation of Injector Location and Nozzle Design in a Direct-Injection Hydrogen Research Engine; SAE Technical Paper; SAE: Warrendale, PA, USA, 23 June 2008. [Google Scholar] [CrossRef]
  20. Yong, L.; Wenzhi, G.; Pan, Z. Effects study of injection strategies on hydrogen-air formation and performance of hydrogen direct injection internal combustion engine. Int. J. Hydrogen Energy 2019, 44, 26000–26011. [Google Scholar] [CrossRef]
  21. Toshio, S.; Shuji, O. Mixture distribution measurement using laser induced breakdown spectroscopy in hydrogen direct injection stratified charge. Int. J. Hydrogen Energy 2009, 34, 2488–2493. [Google Scholar] [CrossRef] [Green Version]
  22. Tolias, I.C.; Venetsanos, A.G.; Markatos, N. CFD modeling of hydrogen deflagration in a tunnel. Int. J. Hydrogen Energy 2014, 39, 20538–20546. [Google Scholar] [CrossRef]
  23. Richards, K.J.; Senecal, P.K.; Pomraning, E. CONVERGE 3.0 Manual; Convergent Science: Madison, WI, USA, 2020. [Google Scholar]
Figure 1. Schematic of the test bench.
Processes 11 01850 g001
Figure 2. Schematic of the PWI system.
Processes 11 01850 g002
Figure 3. Sensitivity analysis.
Processes 11 01850 g003
Figure 4. Mesh of the simulation model.
Processes 11 01850 g004
Figure 5. Comparison between the experiment and simulation pressure of different cases.
Processes 11 01850 g005
Figure 6. Comparison between the experiment and simulation pressure of different cases.
Processes 11 01850 g006
Figure 7. IMEP and ITE with different equivalence ratios in the experiment.
Processes 11 01850 g007
Figure 8. CA50 and KI with different ignition timings in the experiment.
Processes 11 01850 g008
Figure 9. CA50 and KI with different injection timings of HDI in the experiment.
Processes 11 01850 g009
Figure 10. Hydrogen distribution process of simulation with CA under −60 °CA ATDC injection timing.
Processes 11 01850 g010
Figure 11. Hydrogen distribution of the simulation with different injection timings at ignition timing.
Processes 11 01850 g011
Figure 12. CU of the simulation with different injection timings at ignition timing.
Processes 11 01850 g012
Figure 13. Comparison of energy flow models [9].
Processes 11 01850 g013
Figure 14. Comparison between natural aspirate and intake boost in the experiment.
Processes 11 01850 g014
Figure 15. Temperature and pressure at ignition timing with different intake pressures by simulation.
Processes 11 01850 g015
Figure 16. ITEg and COV of different equivalence ratios in the experiment.
Processes 11 01850 g016
Figure 17. ITEs and MEPs of different equivalence ratios in the experiment.
Processes 11 01850 g017
Figure 18. Comparison of different parameters in the PWI experiments.
Processes 11 01850 g018
Figure 19. Simulation results of WPI in Case 1.
Processes 11 01850 g019
Figure 20. IMEPg and ITEg boundaries of different conditions in the experiment.
Processes 11 01850 g020
Figure 21. Comparison of the APC hydrogen engine boundaries [6,7,10,11,15,16,17].
Processes 11 01850 g021
Table 1. Summary of previous APC hydrogen engine studies.
YearNameCompression RatioThermal EfficiencyTechnical Approaches
1980De Boer [6]5.5~12:149% ITEgSpark ignition, PHI
1982Ikegami [7]11.9:1, 15.5:149% ITEgCompression ignition, HDI
2008Mitani [15]13:154% ITECompression ignition, HDI
2010Kuroki [10]4:141% ITESpark ignition, HDI
2011Killingsworth [11]4.5~7:144.1% ITESpark ignition, PHI
2021Cech [16]15.5:155% ITECompression ignition, HDI
2023Jin [17]9.6:150.32% ITESpark ignition, PHI, water direct injection
Table 2. Specifications of the engine.
ParametersValue
cylinder number3
displacement (L)1.0
compression ratio9.6:1
cylinder bore (mm)73.4
piston stroke (mm)78.6
connection rod length (mm)136
Table 3. Errors of measuring instruments.
Instrument TypePhysical QuantityError
Kistiler 6115Ccylinder pressure±0.03% FS (Full scale)
Emerson Elite CMFS007Mhydrogen mass flow±0.25% Rd (Reading)
Flow meter transmitterhydrogen mass flow±0.2% FS
API FR 100engine speed±1 rpm
Table 4. Mesh refinement of the simulation model.
Refinement AreaRefinement StrategyLevel
combustion chamberfixed embedding2
spark plugfixed embedding4, 5
intake valve cone and exhaust valve conefixed embedding3
injection nozzlesfixed embedding4
intake portAMR3
cylinderAMR3
Table 5. Main cases of the simulation model.
CaseSpeed
(rpm)
Hydrogen Flow Rate
(SLPM)
Hydrogen Injection Timing
(°CA ATDC)
Ar/O2 Flow Rate
(SLPM)
Ignition Timing
(°CA ATDC)
1100040−40430−10
2100040−50430−10
3100040−60430−10
4100040−70430−10
5100040−80430−10
6100040−90430−10
7100040−100430−10
8100040−120430−10
9100040−140430−10
10100040−160430−10
11100040−180430−10
12100040−270430−10
Table 6. Comparison between the experiment and simulation parameters.
CasePressure at IGT (MPa)Maximum Pressure (MPa)Maximum Pressure Phase
(°CA ATDC)
ExperimentSimulationExperimentSimulationExperimentSimulation
12.262.214.884.858.57.83
22.222.213.973.941516.26
32.242.224.74.699.57.25
42.242.234.84.798.49
52.292.245.014.997.56.06
62.262.235.094.9965.67
72.312.265.014.946.56.72
82.382.315.135.034.55.85
Table 7. Comparison between the experiment and simulation parameters.
ParametersValue
Speed (rpm)1000
Hydrogen flow rate (SLPM)50
Hydrogen injection timing (°CA ATDC)−60
Ar/O2 flow rate (SLPM)430
Ignition timing (°CA ATDC)−5
Temperature behind throttle (K)293
Table 8. Comparison between the experiment and simulation parameters.
CaseITE (%)IMEP (MPa)Maximum Pressure (MPa)CA50 (°CA ATDC)
Experiment51.220.515.318.5
Simulation51.450.535.158.38
Table 9. Parameters of WPI cases.
CaseSpeed
(rpm)
HFR
(SLPM)
Hydrogen INT
(°CA ATDC)
AFR
(SLPM)
Equivalence RatioIntake Pressure
(MPa)
1100060−604300.3320.1
2100090−708000.2680.2
31500105−806200.4030.1
41500140−10012000.2780.2
52000115−1008000.3420.1
Table 10. Contribution of different technical approaches.
Technical ApproachMaximum IMEPg (MPa)Maximum ITEg (%)Intake Pressure (MPa)
PHI0.4154.120.1
HDI0.7856.390.1
HDI + intake boost0.8957.890.2
HDI + intake boost + WPI1.0659.350.2
Disclaimer/Publisher’s Note: The statements, opinions and data contained in all publications are solely those of the individual author(s) and contributor(s) and not of MDPI and/or the editor(s). MDPI and/or the editor(s) disclaim responsibility for any injury to people or property resulting from any ideas, methods, instructions or products referred to in the content.

