1. Introduction
In this era, the electricity demand is increasing enormously due to rapid expansion in technologies. Day by day, human beings are looking for a maintained and comfortable lifestyle. Nowadays, the maximum electricity demand is fulfilled by conventional energy sources. As the availability of conventional sources is very limited, governments should switch toward renewable sources to fulfill the increasing demand. Over the past few decades, every country has faced enormous problems regarding environmental pollution, and one of its main causes is the power sector as it consumes a huge number of conventional resources. To mitigate this issue, the power network has introduced a vast area for the renewable power sector. The main attention of the power sector is grabbed by renewable energy as it causes much fewer environmental issues compared to conventional energy. The growing concern of society regarding nature and the harsh effect of emissions in the power sector has pushed strategies to increase the scope of renewable energy in the electricity market. Power generated from renewable energy sources causes minor pollutants from decarbonization-generating technologies [
1]. According to the United States Environmental Protection Agency, greenhouse gases are one of the major air-polluting agents. The electrical power sector was responsible for 25% of total greenhouse gas emissions, which was the second largest share of greenhouse gas emissions in the USA in 2020 [
2]. Although the figures are specificallyfrom the USA, further studies reveal that almost similar trends are followed throughout the world. To counter environmental pollution, the engagement of renewable power generation has become a necessity. Among the different renewable sources, wind, solar, and hydropower deserve special mention due to their clean, reliable, and versatile nature for long-term usage. There are many other advantages of using a renewable source, such as reduced tariffs, reduced pollution levels, etc. In 2020, around 29% of power was generated from renewable sources, and 256 GW capacity of renewable power has been newly added worldwide. Despite having huge potential for renewable generation, India has exploited a very small amount of the total capacity [
3]. The government of India (GOI) set an aim to generate 175 GW of power from renewable sources by 2022, of which 100 GW from solar, 60 GW from wind, and the rest from other renewable sources [
4]. To encourage the citizens of India to use renewable energy, the GOI has launched several subsidy policies for renewable power installation.
In the past few decades, researchers have mainly focused on wind, hydro, and solar-power-generation techniques. Ming et al. [
5] focus on the policy barrier, status, and tools for hydro energy in China. The benefits and scenarios of small hydropower plants were displayed in [
6] for the year 2014. Mishra et al. [
7] examined the present status and plans of small hydro in the Indian power sector. In recent times, many countries’ governments have focused on small hydropower plants for electricity production. The present and past scenarios of hydropower were exploited in [
8,
9,
10,
11] for Pakistan, Malaysia, and Thailand, respectively. The status of the hydropower plant in the western Himalayas region (Jammu and Kashmir) was displayed by Sharma et al. in [
12,
13]. The author of [
14] illustrated a review of ultra-modern computational optimization techniques in sustainable and renewable energy. This offered a clear image of the newest research achievements in the arena of sustainable energy. Ashwani et al. [
15] focused on the outline of India’s renewable energy sources and their opportunities, as well as their current status, availability, and notable achievements. The authors also discussed governmental initiatives for eliminating complications and enhancing the placement of renewable energy in the future.
The rise in wind power plant installation has been seen in the last two decades around the globe and the average lifespan of a wind power plant is considered to be around 20 years. The author of [
16] proposed some strategies thatneed to be implemented by the government and private power plant owners to maximize the benefits of renewable sources. The optimal location of a wind power plant and the related factors that limit its installation was discussed by Rediske et al. [
17]. Nowadays, offshore wind plants are located far from the shore and deeper into the sea. As wind energy prices are reducing, the wind power market is becoming more competitive [
18]. Over the past few decades, sustainability has entered policy debate. Government bodies are imposing several regulations to mitigate the adverse effects of CO
2 on the environment [
19]. Kunz et al. [
20] displayed that the most evolution in a sustainable energy system depends on wind as lynchpin technology.
After completing comprehensive and careful analysis, itwas revealed that a few pieces of literature have already been completed by some researchers in the arena of wind, hydro, and solar power, but as per the authors’ best knowledge, no one has displayed all the probable features related to wind, solar, and hydropower in the world, as well as in the Indian power region.
All the recent strategies, objectives, government skills, and achievements that are crucial for the development of renewable power in India, as well as global power systems, are stated in this paper.
The adaptation of wind, solar, and hydropower plants, as well as the present power status around the globe, are also focused on in this paper with real-time data.
This paper also presents comparative studies among the different renewable energy sources, which provide a clear idea as to how global power producerscanfind the best options to invest their money in new renewable power plant installation.
2. Renewable Power Plant Scenarios
This section presents the basic generating process of different types of renewable sources, along with the world’s largest renewable power plant details.
2.1. Hydroelectric Power Plant
In a hydropower plant, a reservoir and a dam are constructed to store the water and release it when required. When water falls from a height, then potential energy is converted into kinetic energy, which gives a great thrust to the turbine present at the power plant. Dams are mainly constructed in mountain areas where they can properly achieve the head difference between the upper and lower basin. The turbine rotates the shafts and in turn, electricity is produced. The catchment area is the entire space behind the dam, draining into a waterway through which the dam has been constructed at an appropriate place. The reservoir is a huge gathering of water behind a hydropower dam and delivers water uniformly to the turbine over the year to generate electricity. A surge tank is placed in the lower channel end area of a feeder, barrage pipe, and closed conduit to absorb unexpected rises in pressure and speedily supply necessary water [
21].
Recently, a new kind of hydropower generator has been introduced. This type of generator uses the vortex present in the water to turn the turbine and generate electricity [
22]. This generator can be located even at lesser natural altitudes, which is an additional advantage of this kind of generator. Conventional generators need ample water heads to produce the required thrust. However, most of the rivers in India do not have enough water throughout the year, apart from during the monsoon period. If instances of turbulence are to be assumed, then this type of generator might receive massive demand in the future.
The hydropower plant is not only considered a resource to produce electricity, but they also do not contaminate the air, soil, and water like other power plants. Hydroelectric power plays a ruling part in the development of the world’s power sector. Both the small and large hydropower industries remained contributors to the power industry. The world’s first hydropower plant started its commercial operation in the year 1882, on the Fox River in Wisconsin, USA [
23].
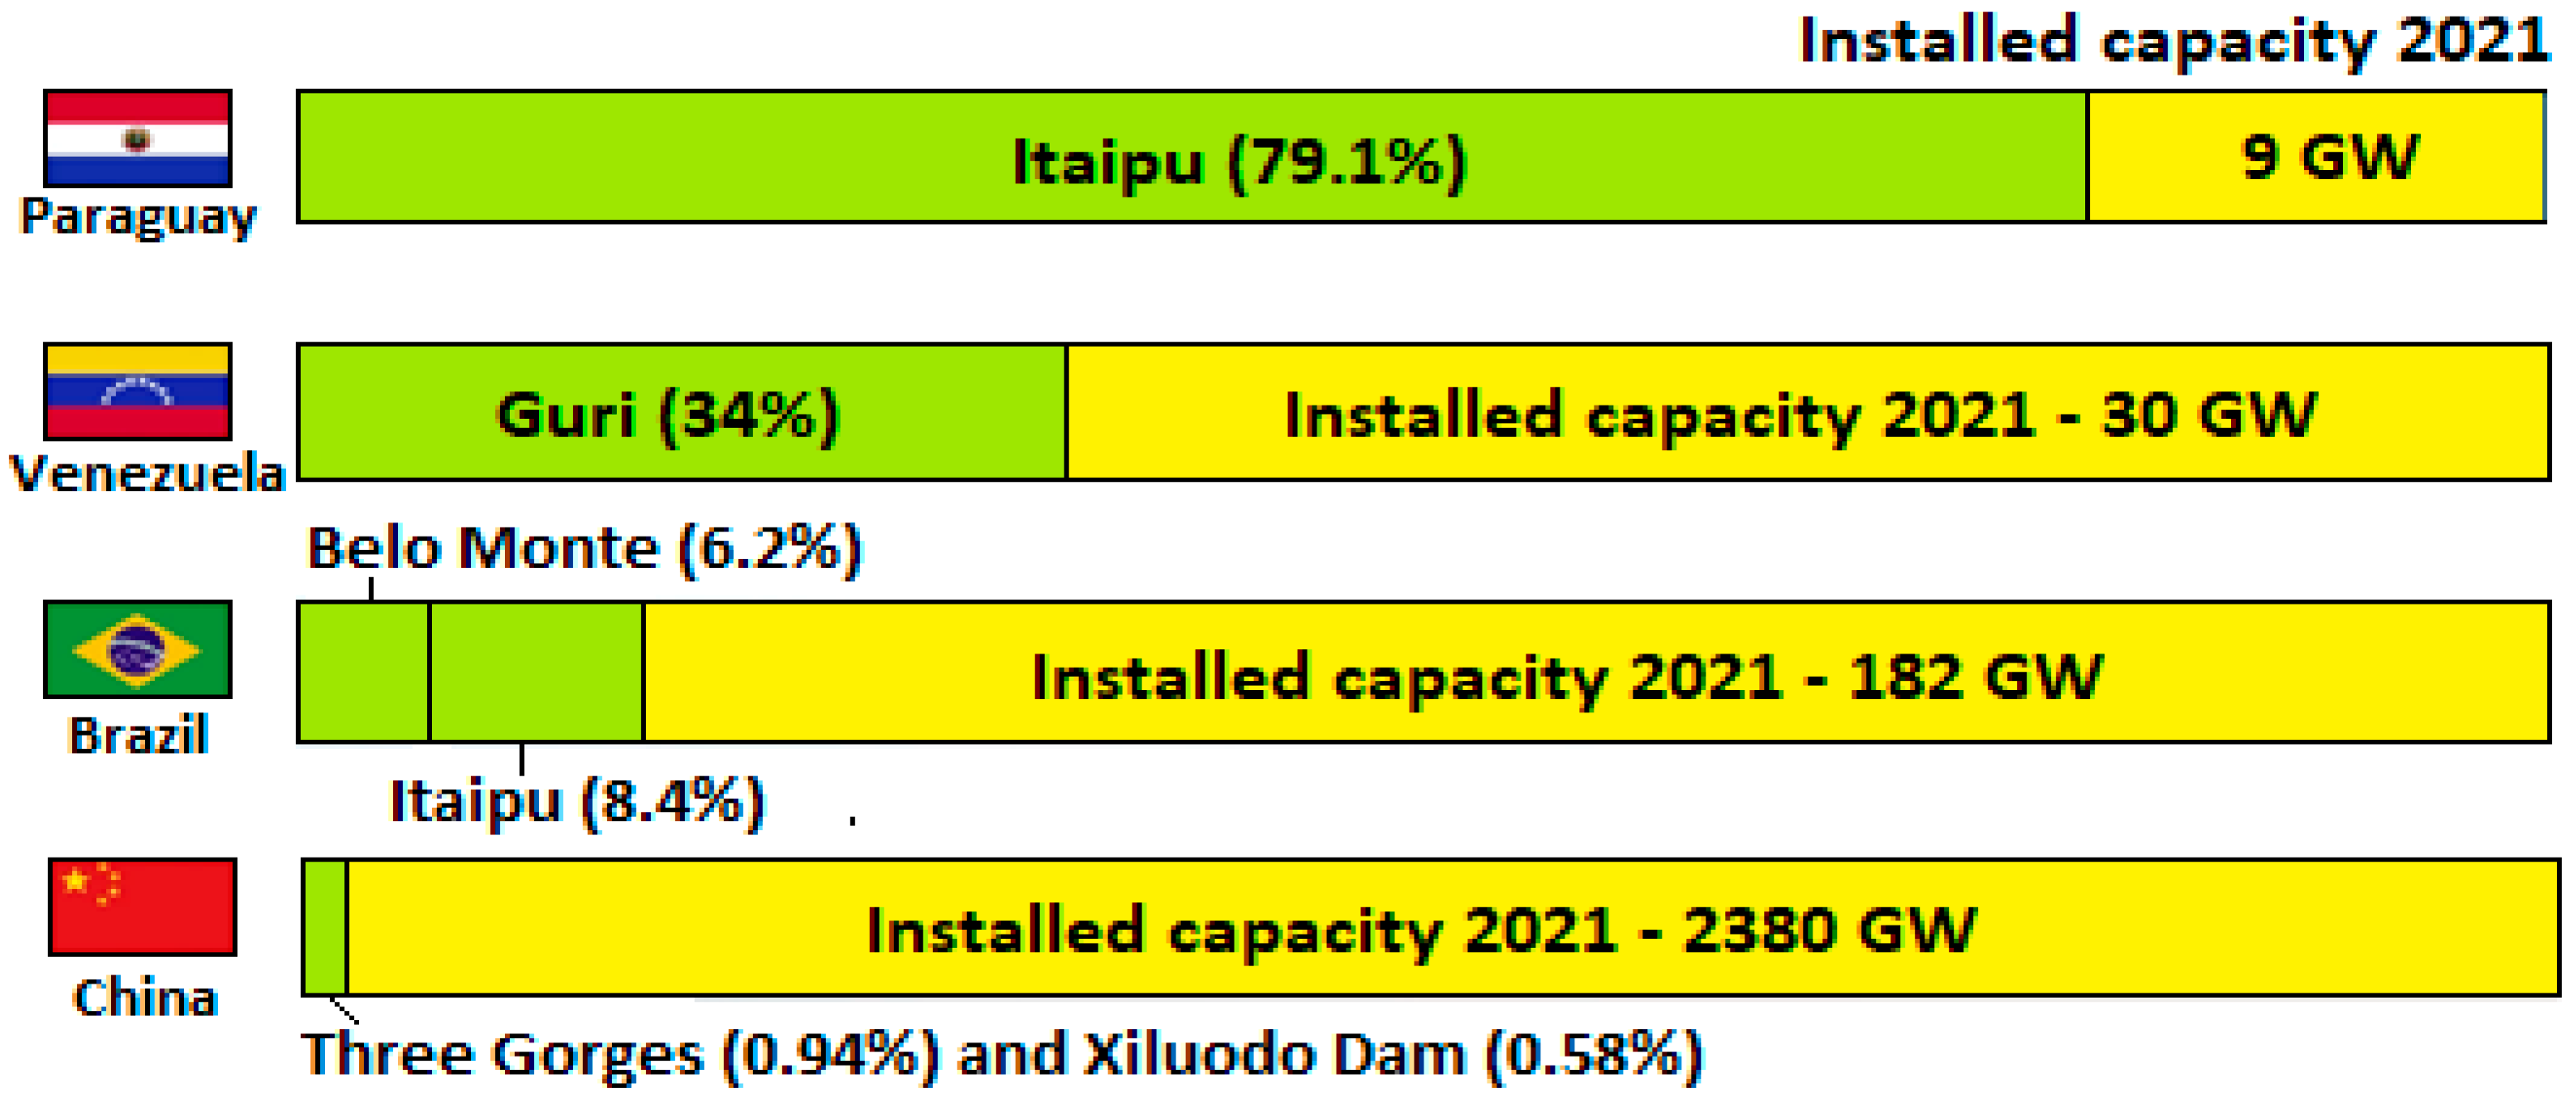
Table 1 presents the largest hydropower plant in the world as of December 2022 [
24]. Three Gorges is the leading hydropower plant in the globe. Its construction started in 1993, and it took almost 20 years to complete, with the largest capacity of 22.5 GW. It is 181 m tall and 2335 m wide. The yearly estimated power production of this hydropower plant is 85 TWh. It is maintained and functioned by China Three Gorges Corporation (CTGC). For operation, it uses the water of the Yangtze River.
Figure 1 depicts the dam’s contribution to the country’s electricity capacity for Paraguay, Venezuela, Brazil, and China.
India’s first hydropower plant was built in 1897 in Darjeeling, West Bengal. The overall expected potential of India in the hydro sector is 145,000 MW with a load factor of 60%. The hydropower sector has exploited about 26% of the potential and around 85,000 MW demand so far in India [
25].
2.2. Wind Power Plant
Wind turbines are a recent version of windmills, which avail the power of the wind to produce electrical energy. In a wind farm, the observable parts are towering turbines. The turbines consist of sets of blades, shafts, and a control box beside them that contains a bearing, hub, hydraulics, gearbox, inverter, rotor, and generator, which is called a nacelle [
26]. The spinning of blades due to wind flow creates kinetic energy. The rotating blades allow the shaft, which is attached to the nacelle, to turn, and the generators in the nacelle convert kinetic energy into electrical energy. The wind turbine can be operated at any wind speed, from very low to very high wind. Around 80% of the time, it can generate electricity but not always at full capacity [
27].
Wind farms need to be situated in the breeziest place to opt for extreme energy, which will let them produce the best output. They are more oftenseen at hilltop or coastal regions. Wind farms that are located in coastal regions or the seaside are called offshore wind farms, and wind farms that are situated in drylands are called onshore wind farms [
28]. The Haliade-X wind turbine is a new-generation wind turbine, declared to be the furthermost powerful offshore wind turbine [
29]. The world’s first known wind turbine was created by Prof. James Blyth of Anderson’s College, Scotland to produce electricity. The cloth-sailed wind turbine had a height of 10 m. It was used to charge accumulators for lighting cottages [
30]. The details of the world’s ten largest wind farms are depicted in
Table 2.
2.3. Solar Power Plant
Solar is considered an infinite energy source. Solar power converts sunlight into electrical power either through mirrors or through photovoltaic (PV) panels. This energy can be stored in batteries or used to generate electricity. Solar panels are mainly made up of silicon or germanium, which is usually mounted in a metal panel with a glass covering. When the small particles of light or photons hit the fine silicon or germanium surface of the solar panel, they strike electrons off the silicon atoms. Solar power is considered to be clean energy as it does not create any harmful greenhouse gas.
It has great efficiency with operating times of more than 25 years. The carbon footprint of a solar panel is very small. The material used in a solar panel is recyclable, so the carbon footprint continues to shrink [
32]. NTPC has commissioned India’s largest floating solar power project in Ramagundam with a capacity of 100 MW. It has an eco-friendly nature and advanced technology.
In 1839, a French physicist, Edmond Becquerel, discovered a PV effect during the conduction of an experiment with a metal cell’s electrodes in a conducting compound solution. The cell generated more energy when kept direct under sunlight [
33]. Tengger solar park is known as the ‘the great wall of Solar’ and is located in Zhongwei, Ningxia, China. This power plant is owned by China National Grid and the Zhongwei Power Supply Company. The project started in 2012 and was completed in 2017. The biggest solar power plant details in the world are displayed in
Table 3 [
34].
3. Global Power Scenario
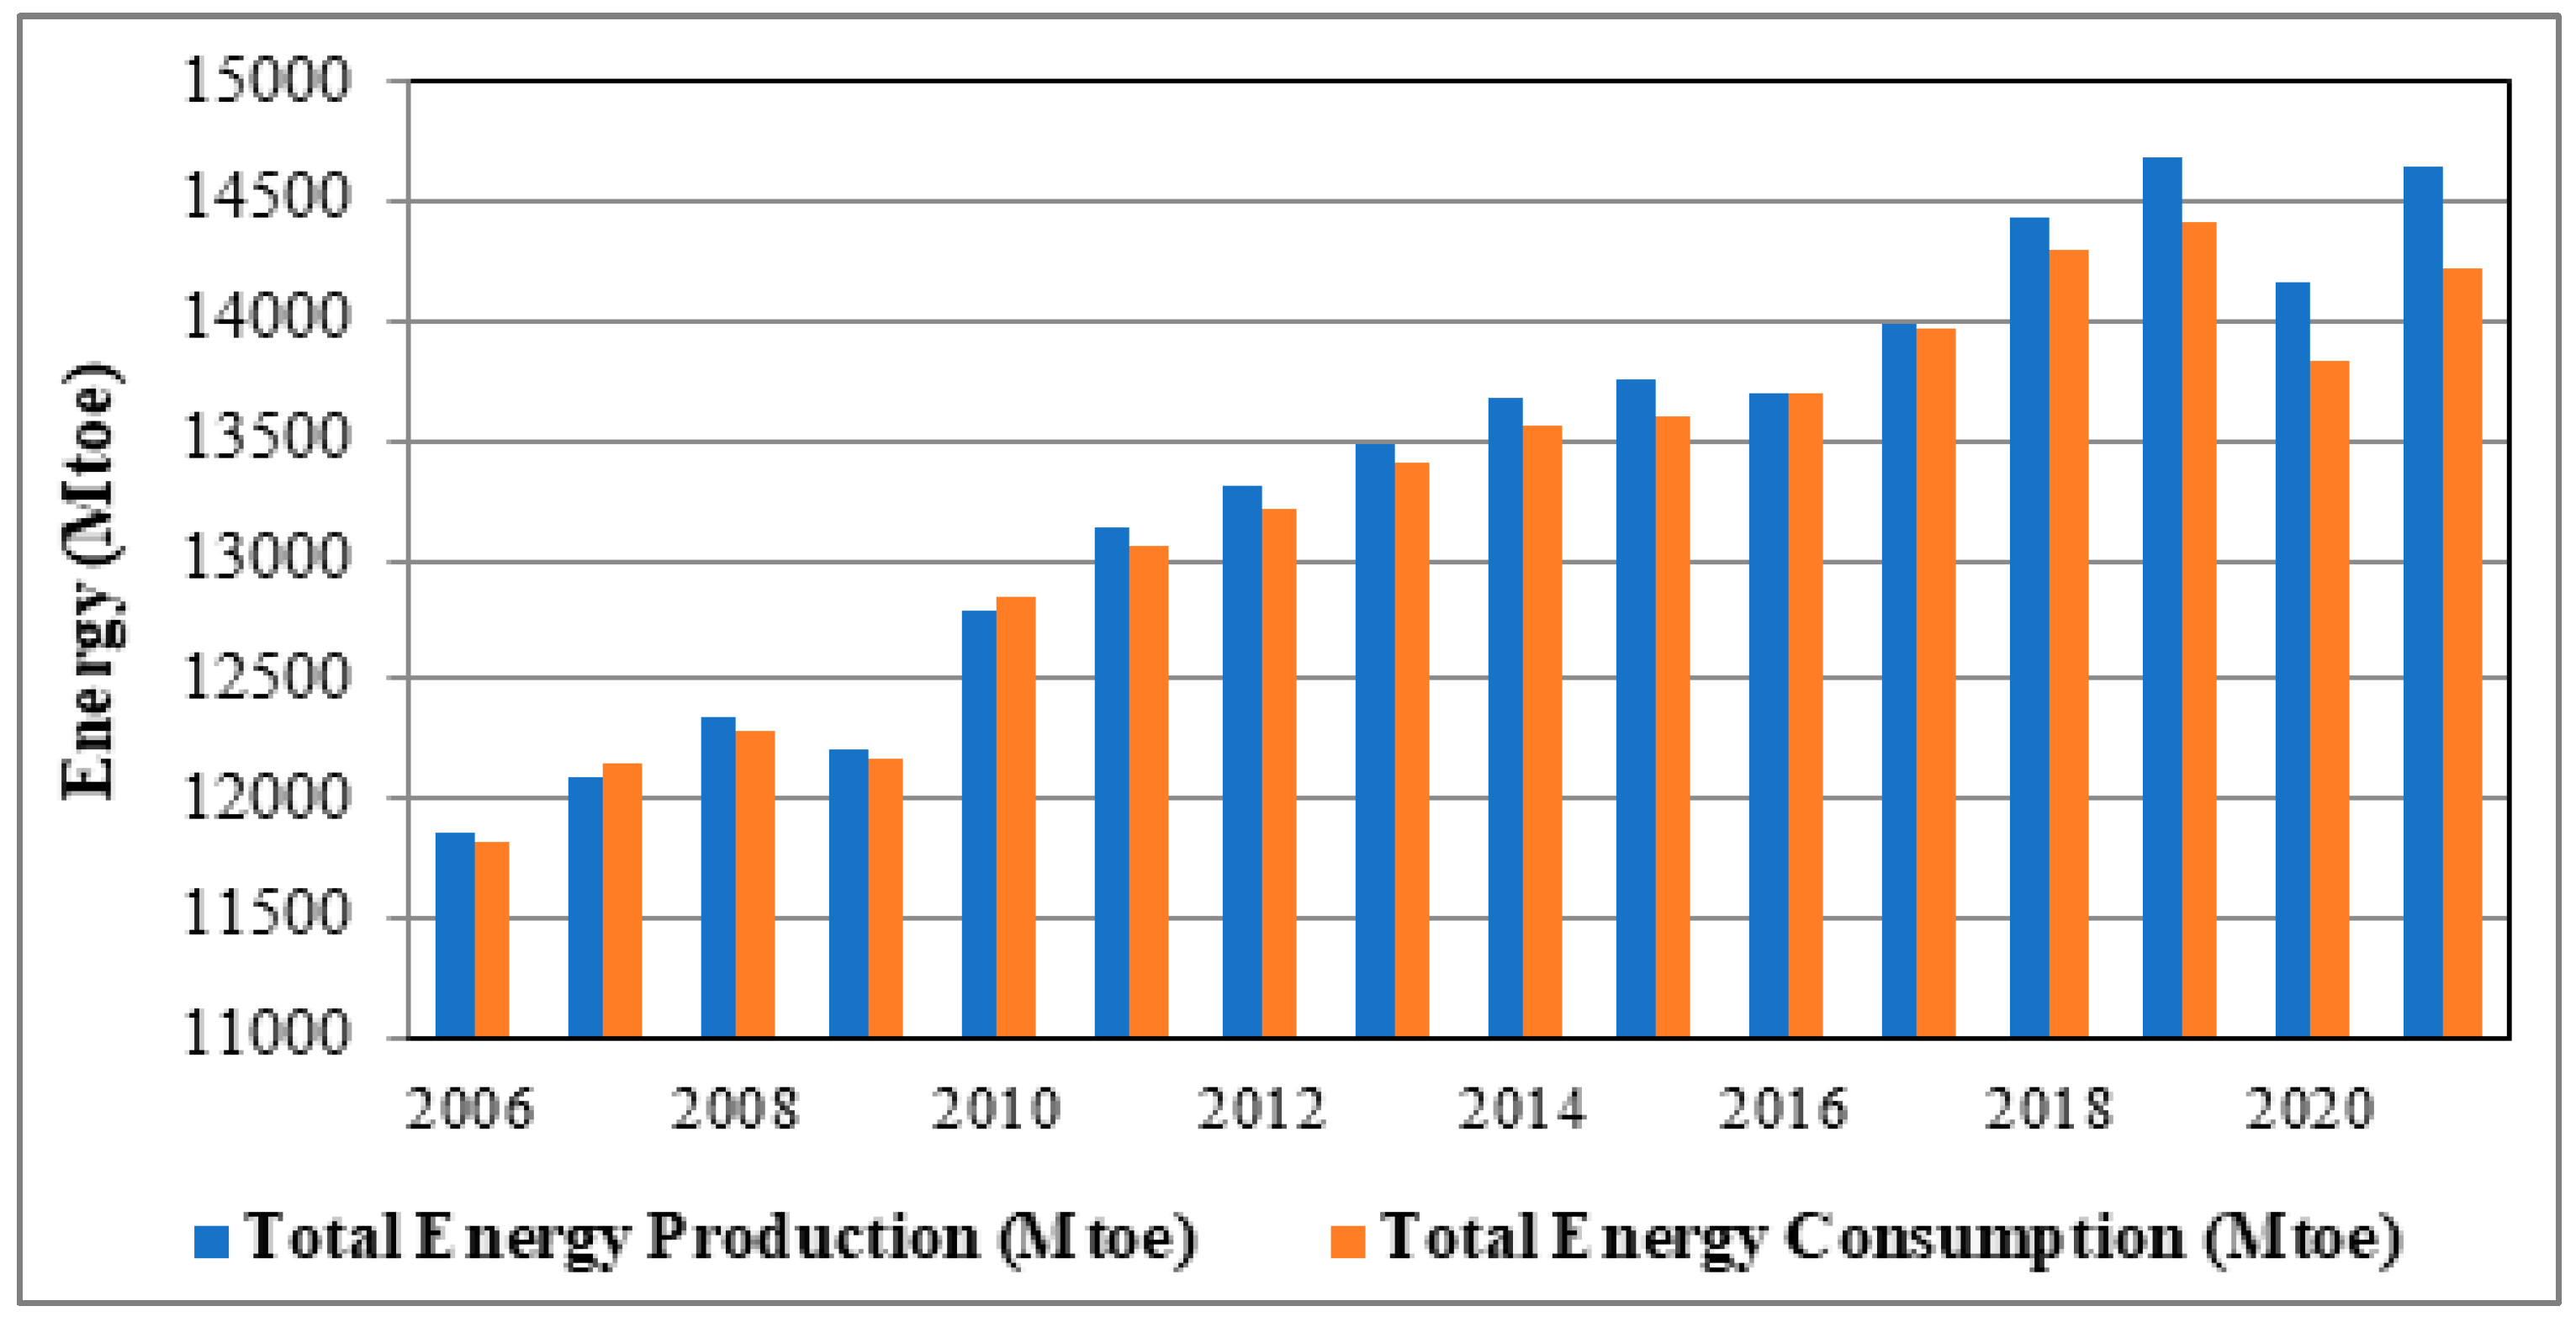
Throwing light on the past 15 years’worth of data on the consumption of energy, a very sharp rise grabs the attention, as is evident from
Figure 2. To keep up with this growing demand, a steeper rise in the production curve is evident.
In the race of keeping the production and demand line in synchronization, the rising levels of pollution went unnoticed, which resulted in a rise in greenhouse gas emissions and environmental pollution.
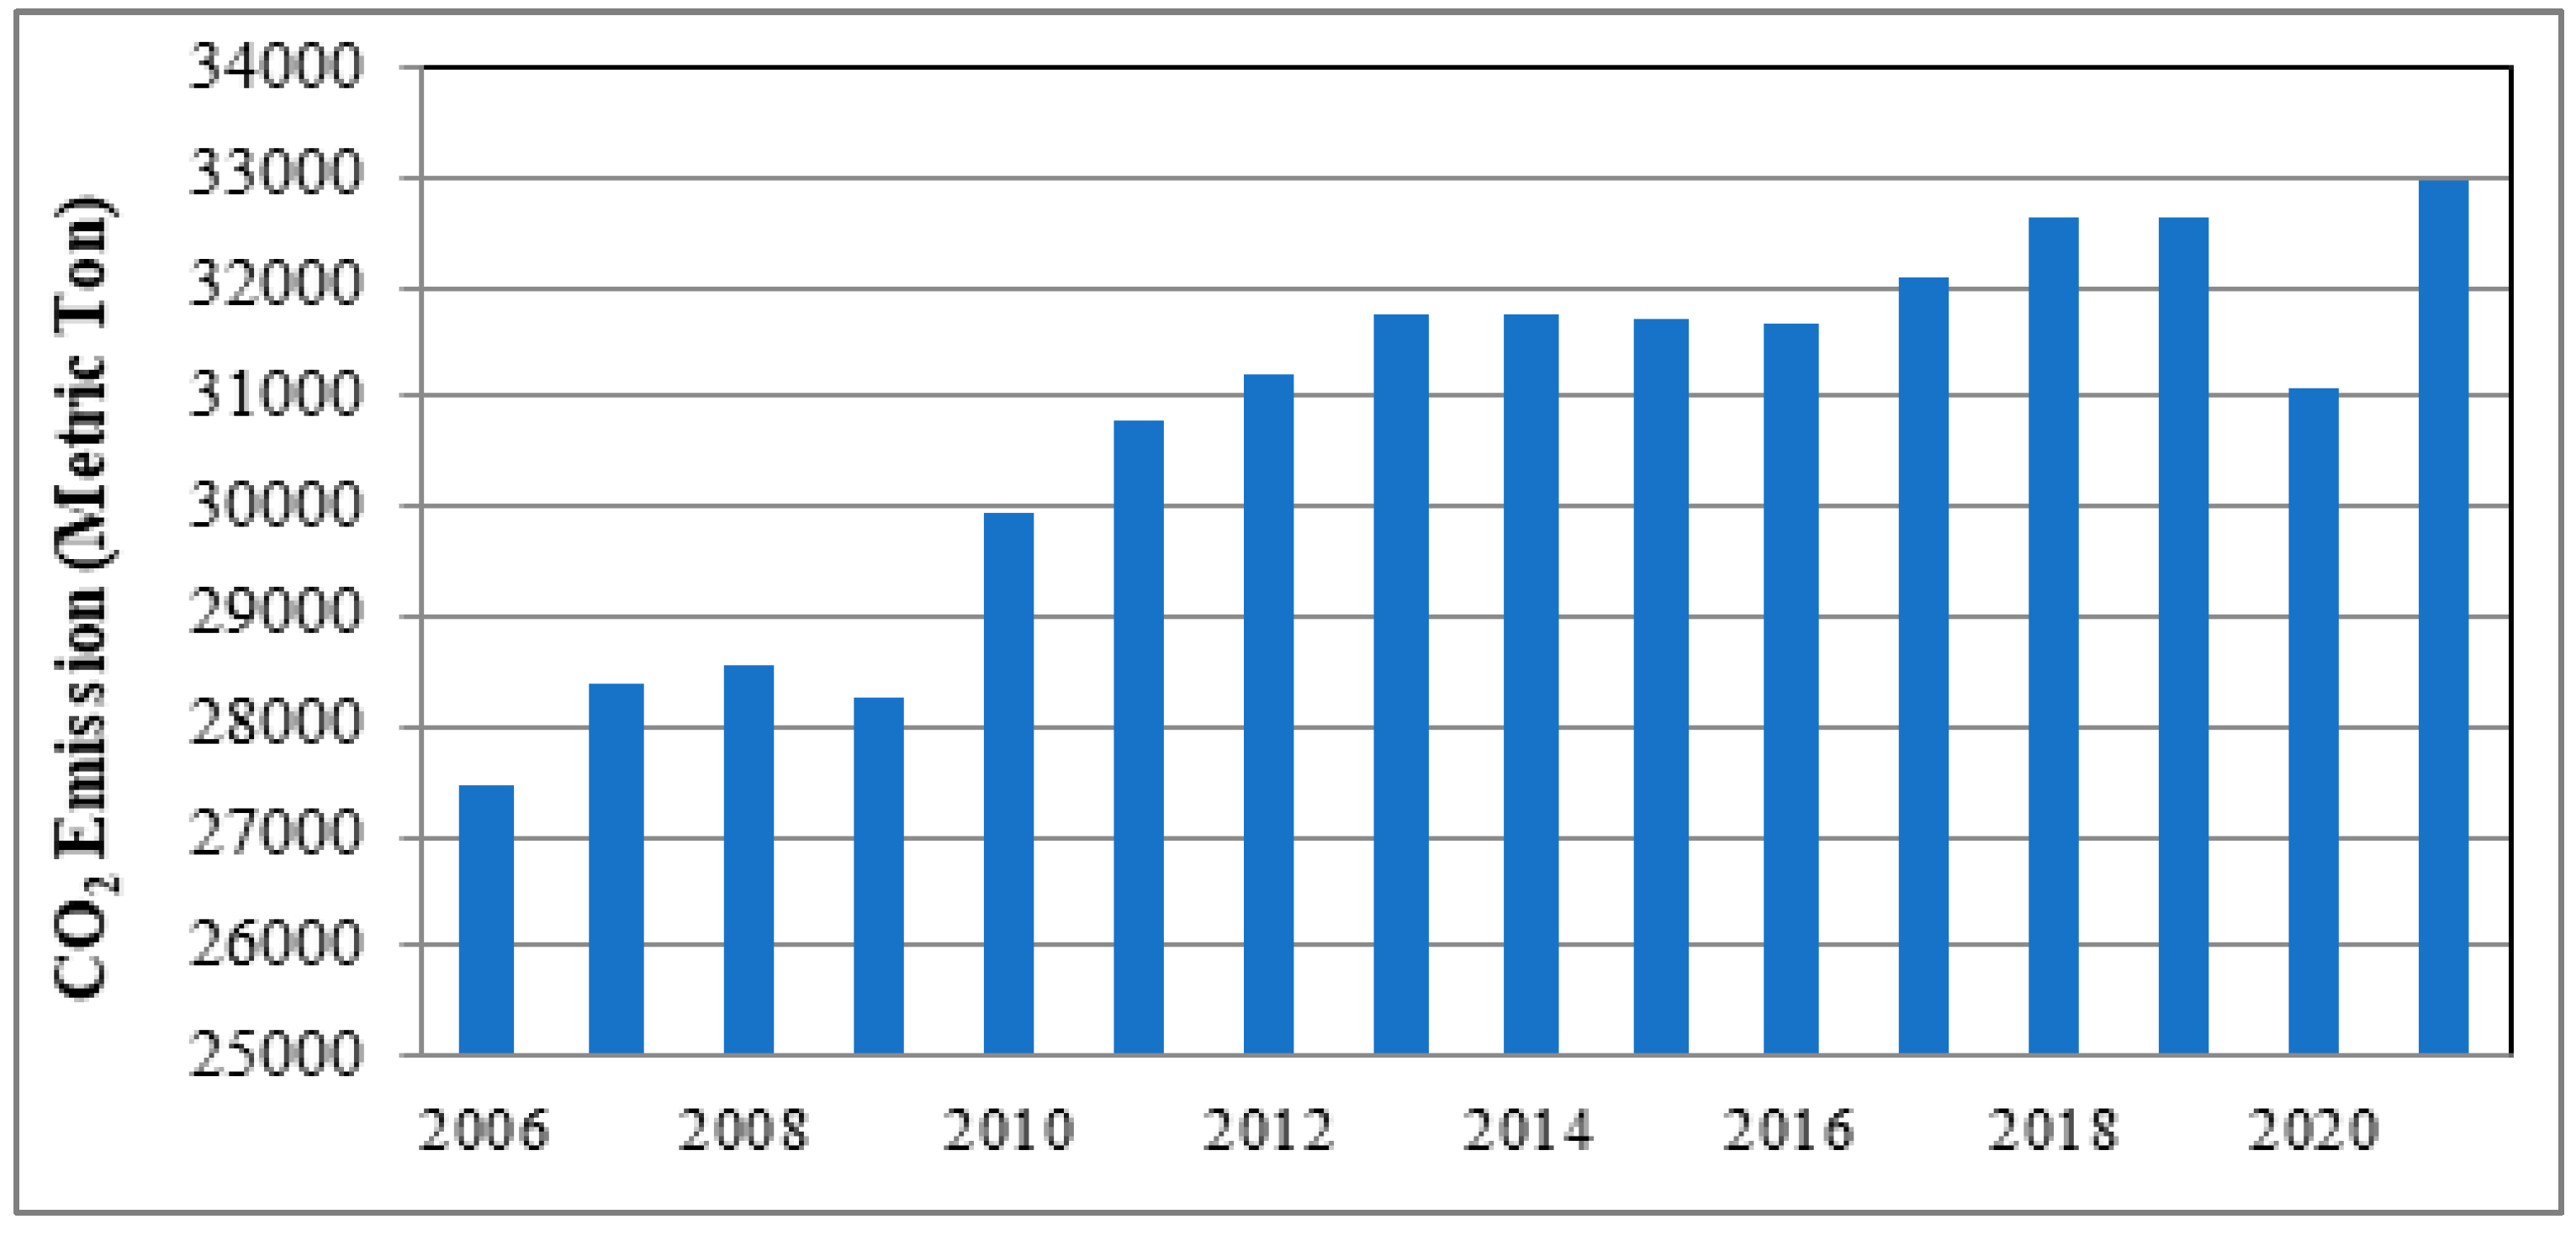
Figure 3 displays the rising trend in the level of CO
2 emission for the past 15 years [
35]. These data are for emissions from power plants only. It is evident from the graph that CO
2 emissions reached a whopping level of 32,969 metric tons in 2021, compared to 27,464 metric tons in 2006.
However, a growing consciousness is now being witnessed in all parts of the world. Consequently, the usage of renewable energy for electricity production has gained momentum. In particular, 2017 was a record-breaking year for renewable energy. This year witnessed the largest-ever increase in renewable power capacity, as well as increases in investment and advances in enabling technologies.
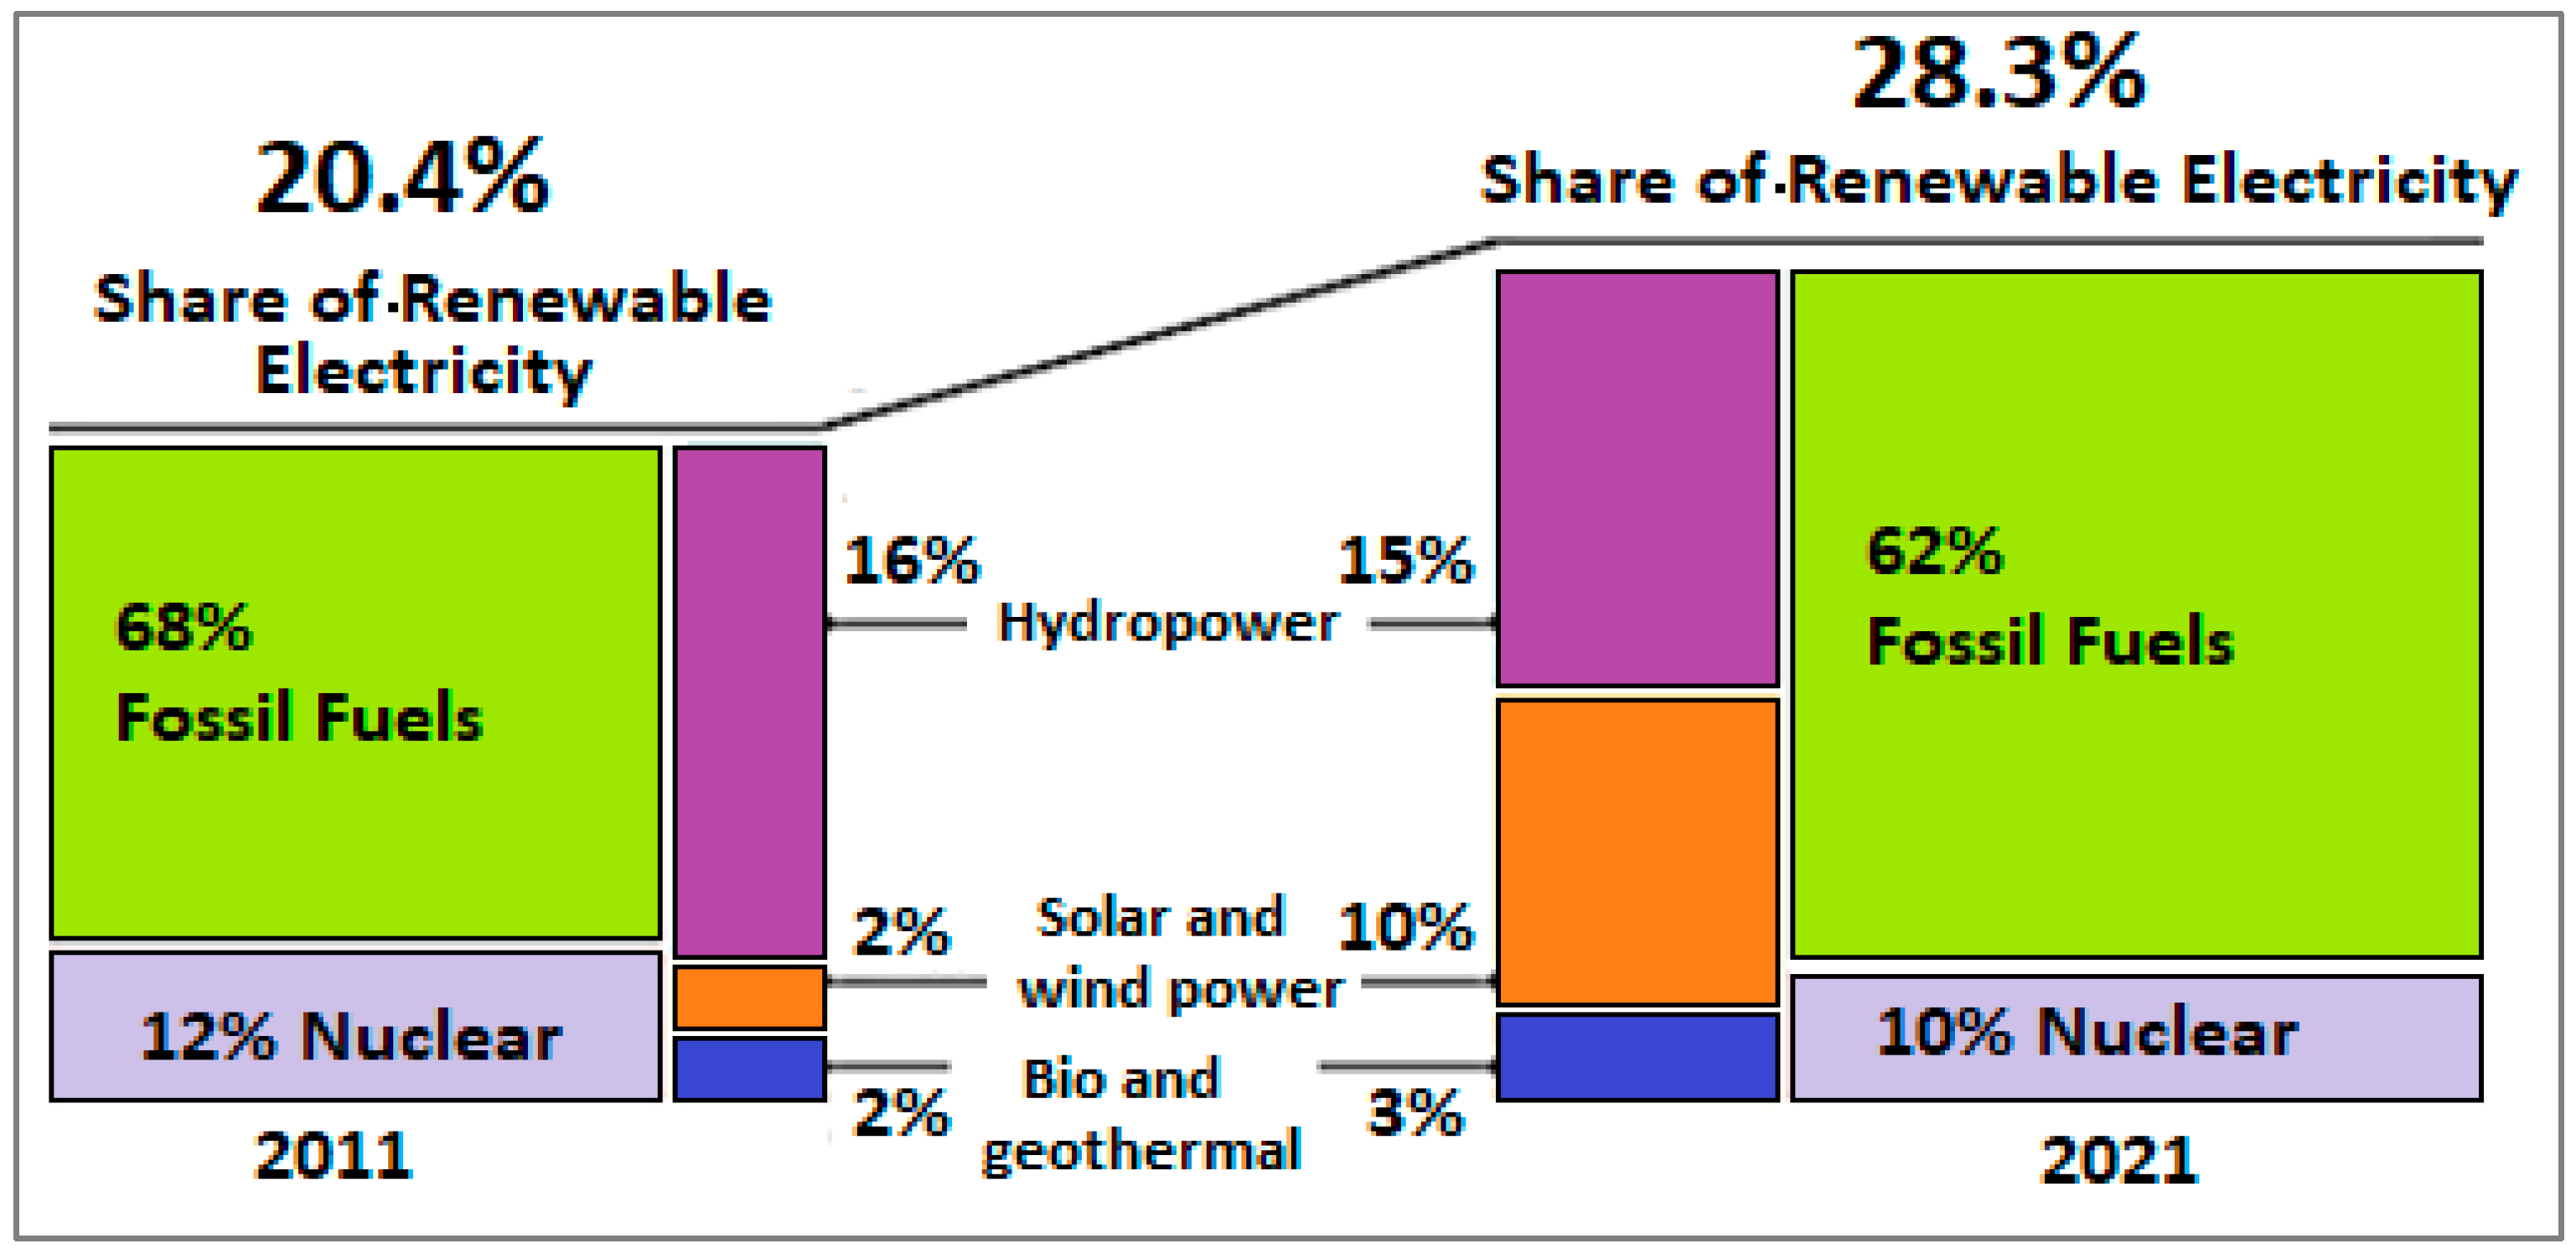
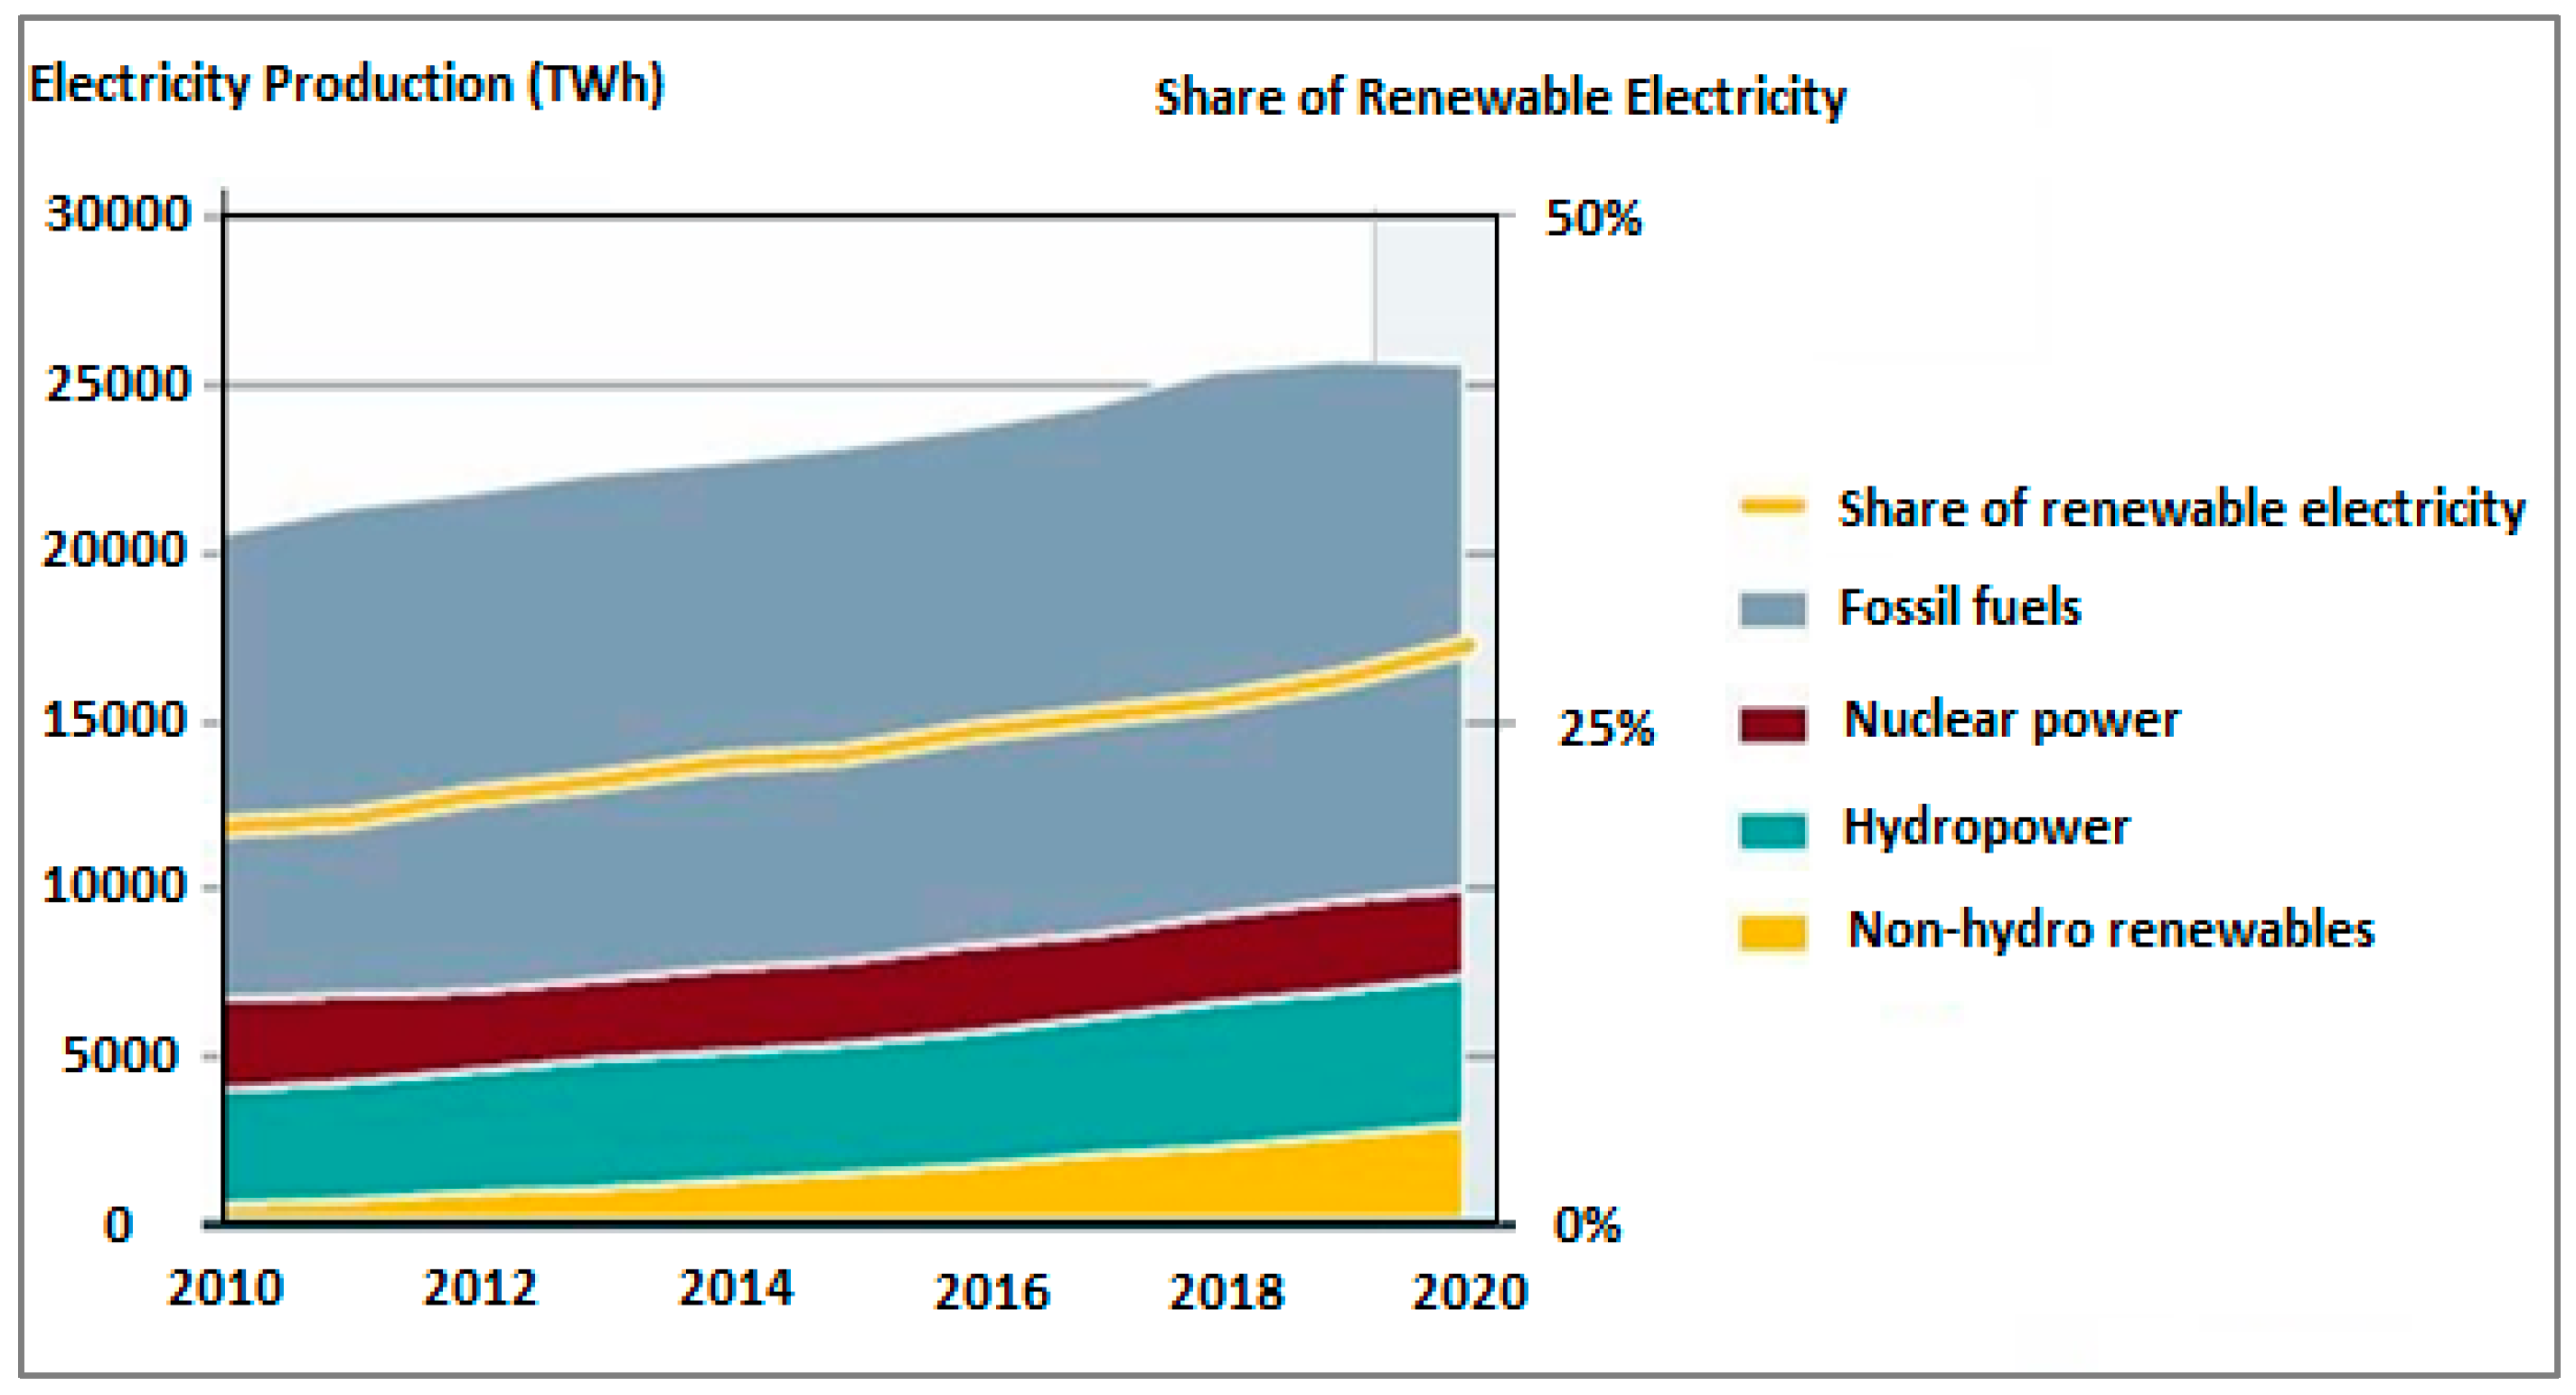
Figure 4 shows the percentage of energy shared by different sources throughout the world. Fossil fuels remain one of the major sources of energy and is a matter of concern [
36]. However, with a large investment inflow in renewable energy sources, this situation can be changed. A comparison of energy production between 2011 and 2021 indicates a rise in the use of modern renewable sources throughout the world. Almost 28.3% of electricity produced in 2021 came from renewable energy sources, which is larger than the renewable energy used in 2011 with only 20.4% total energy conversion. Among the renewable energy sources, hydropower is one of the most consistent and efficient electricity-generation sources (shown in
Figure 4). Approximately 15% of global electricity was produced by hydropower plants in 2021 [
36].
Figure 5 shows the details about global electricity production by source and the share of renewable energy from 2010 to 2020. In this figure, renewable energy is divided into two parts, i.e., renewable with and without hydropower. Starting from 2010, electricity production increased day by day with all types of sources, but the most important thing is that the electricity-generation rate from renewable energy sources increased at the very firstrate [
36]. This happened due to the large involvement of governments regarding the use of renewable energy sources.
Table 4 depicts the renewable energy indicators at the end of 2020. Approximately USD five billion in new annual investment was observed in 2020 from the immediate previous year (i.e., 2019). The additional investment in renewable energy directly indicates the motive of several countries toward the renewable dominating power system [
36].
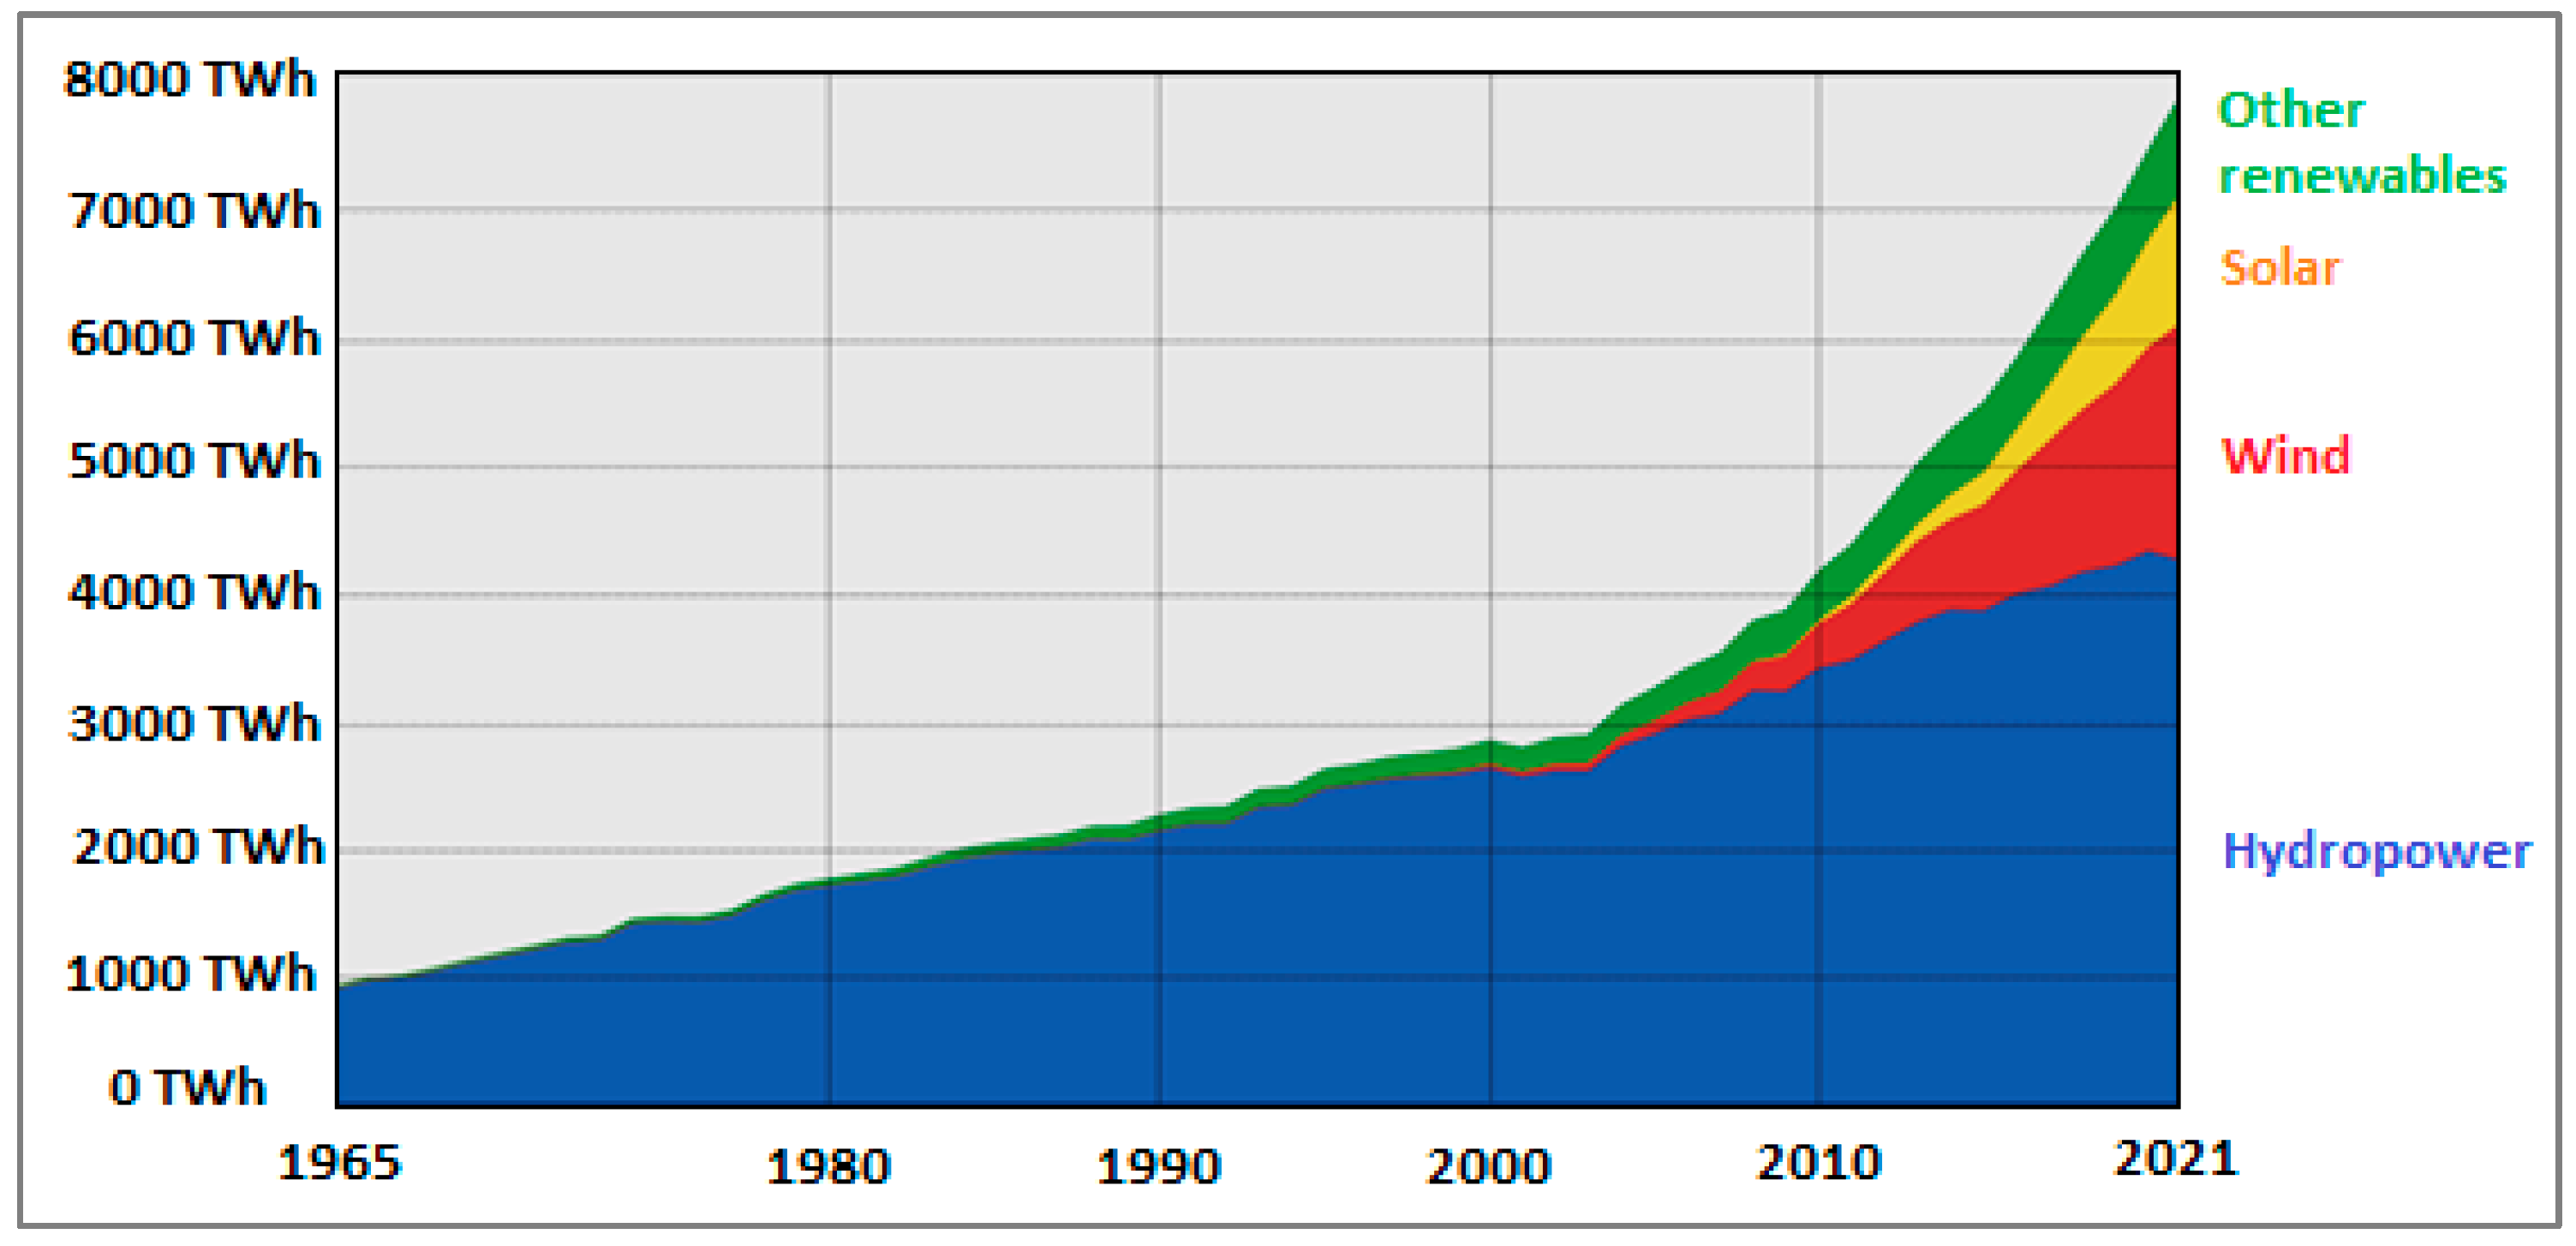
As per the report of ‘Our World in Data’, approximately 11% of the world’s total power demand has been fulfilled by renewable energy sources.
Figure 6 displays the global renewable-energy-generation status from 1965 to 2019 [
37]. From 1965 to date, the maximum power has been generated by hydropower plants. Due to their dependable nature and high production capacity, hydropower plantsare the best energy production option among non-conventional energy sources. Starting with approx. 1000 TWh in 1965, renewable energy generation reached the maximum capacity of 7625 Twh at the end of 2021.
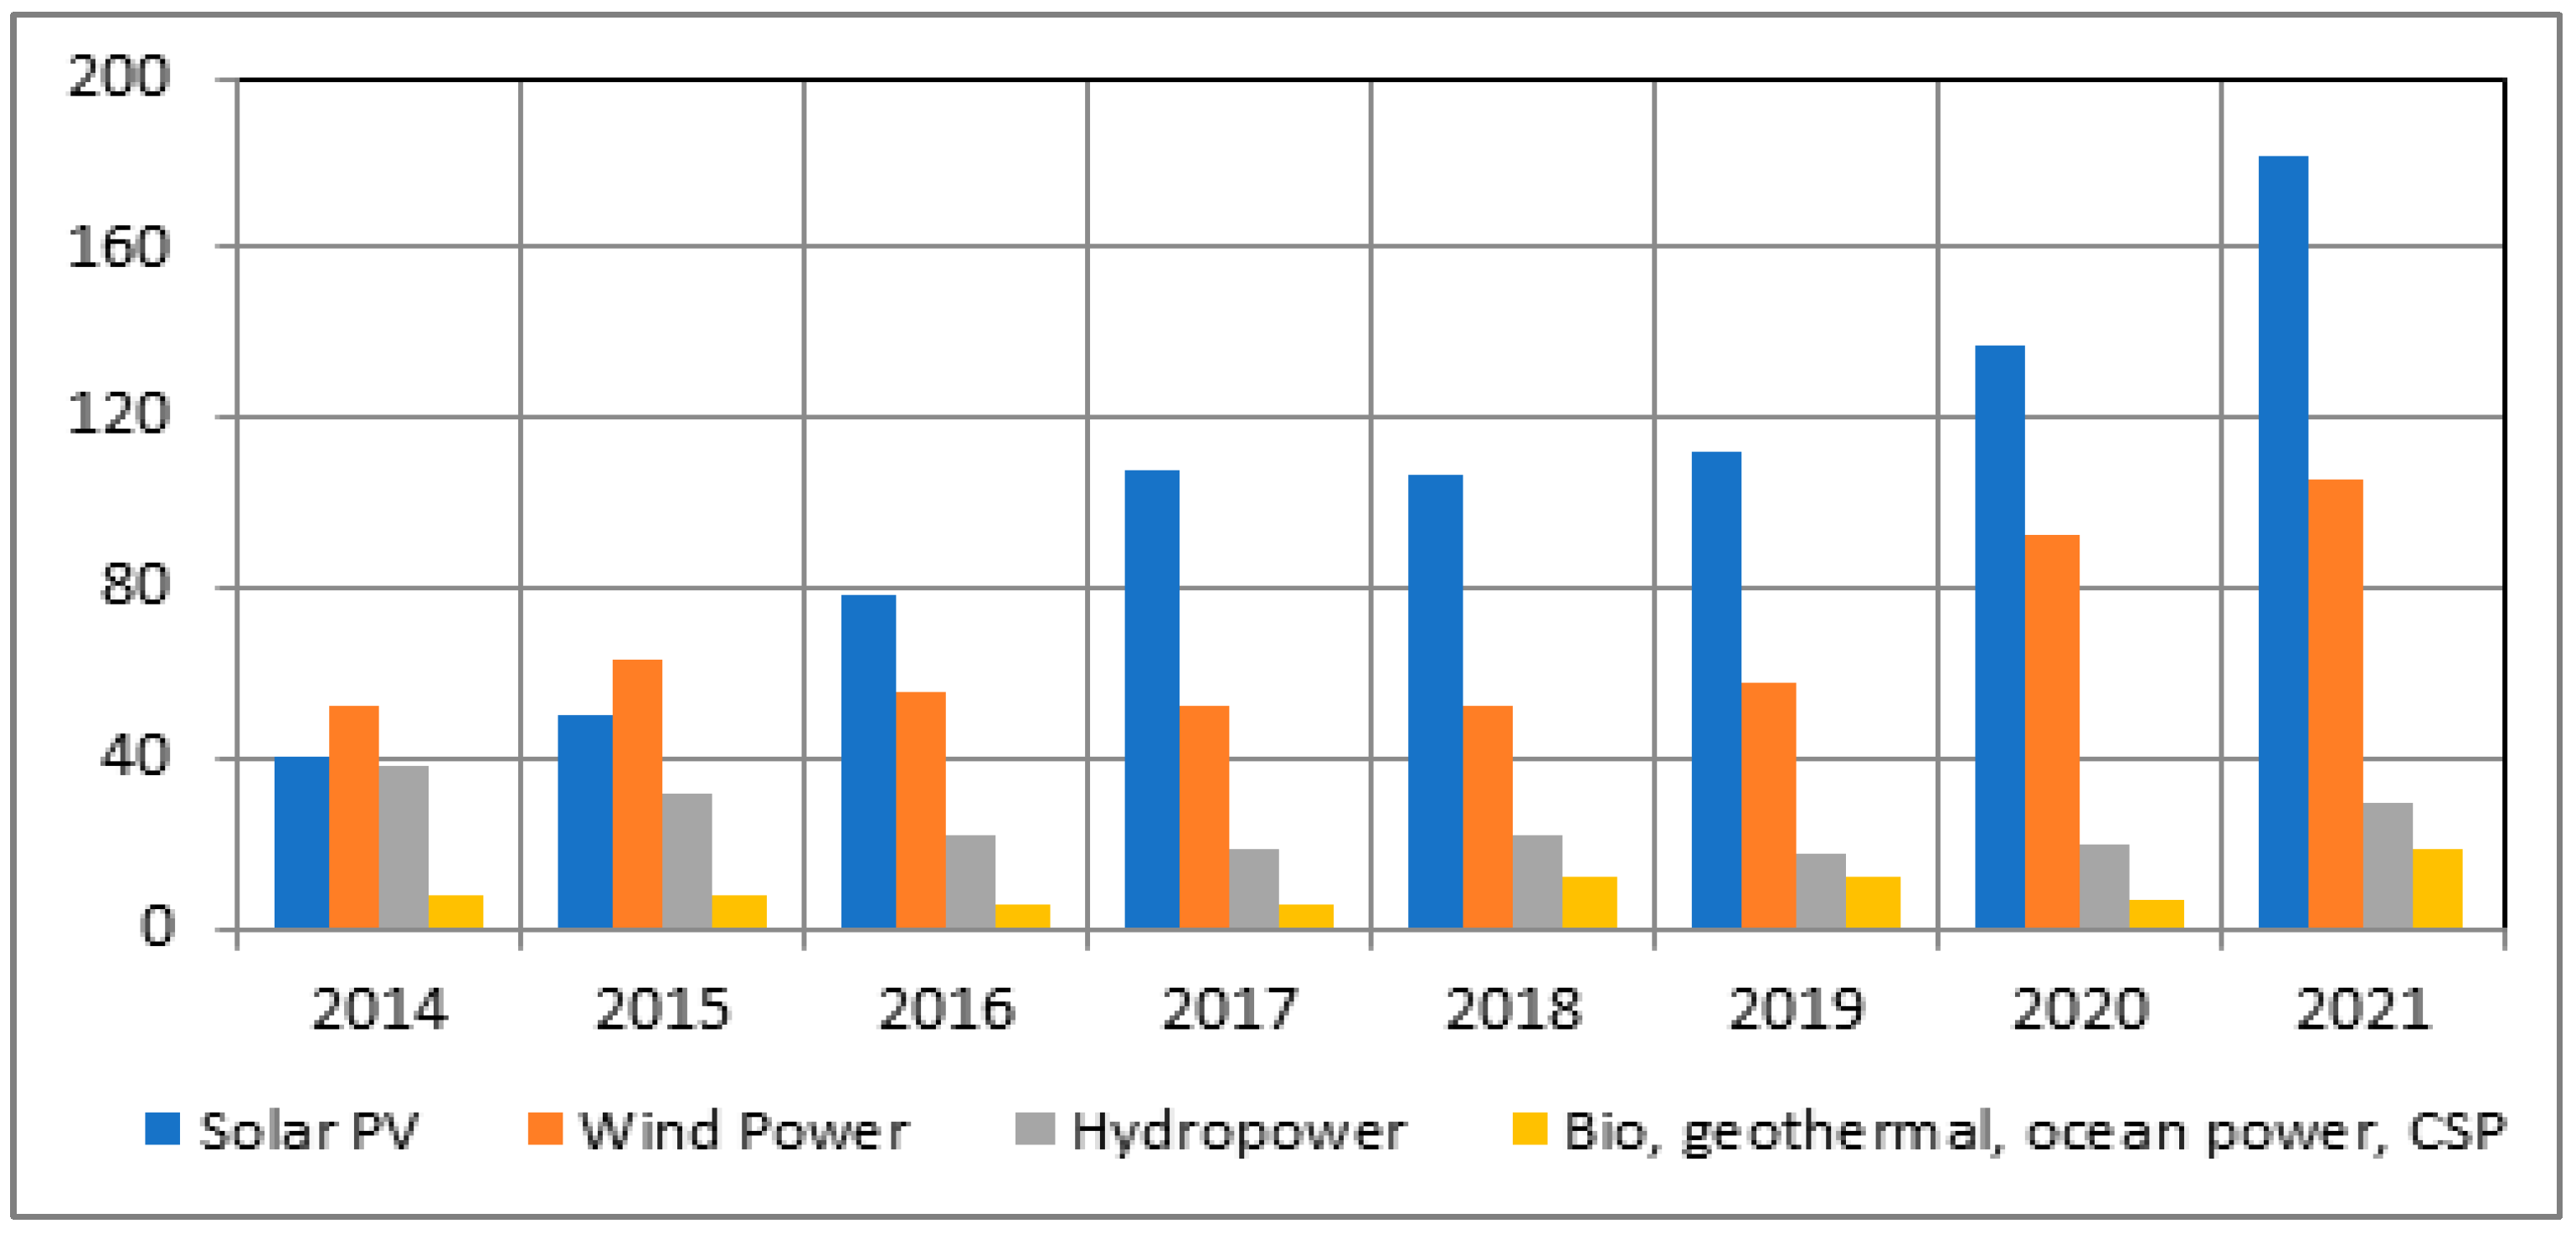
Annual additions of renewable power by technology from 2014 to 2021 are depicted in
Figure 7. There is a clear indication of growing power generation from all renewable sources. In 2020, the addition of power from solar PV sources reached a high point of 138 GW (approx.), whereas this capacity was only 40 GW in 2014 [
36]. Due to the new technological accomplishments in wind power generation and solar PV generation, their production ratesare also very high throughout the world.
The world’s top five countries for renewable power generation in 2021 are shown in
Table 5. In the category of annual investment and total capacity addition, China secured the top position in terms of hydro, solar PV, and wind power generation [
36]. In terms of total capacity addition, India was in the top four ranks in the world for solar PV, hydro, and wind power. The United States also maintained its progress in all respects of renewable energy sources. These leading countries have encouraged other countries to develop renewable power plants.
4. Global Renewable Power Scenario
In recent years, the power requirement has increased at a high rate, whereas the availability of thermal power plants is very limited, which forces power producers to think about power generation from non-conventional energy sources. This section provides the detailed status of the global hydro, wind, and solar power scenario.
4.1. Global Hydropower Scenario
Hydropower is one of the oldest and leading sources of environmentally friendly energy. Carbon production is much lower in hydropower plants.
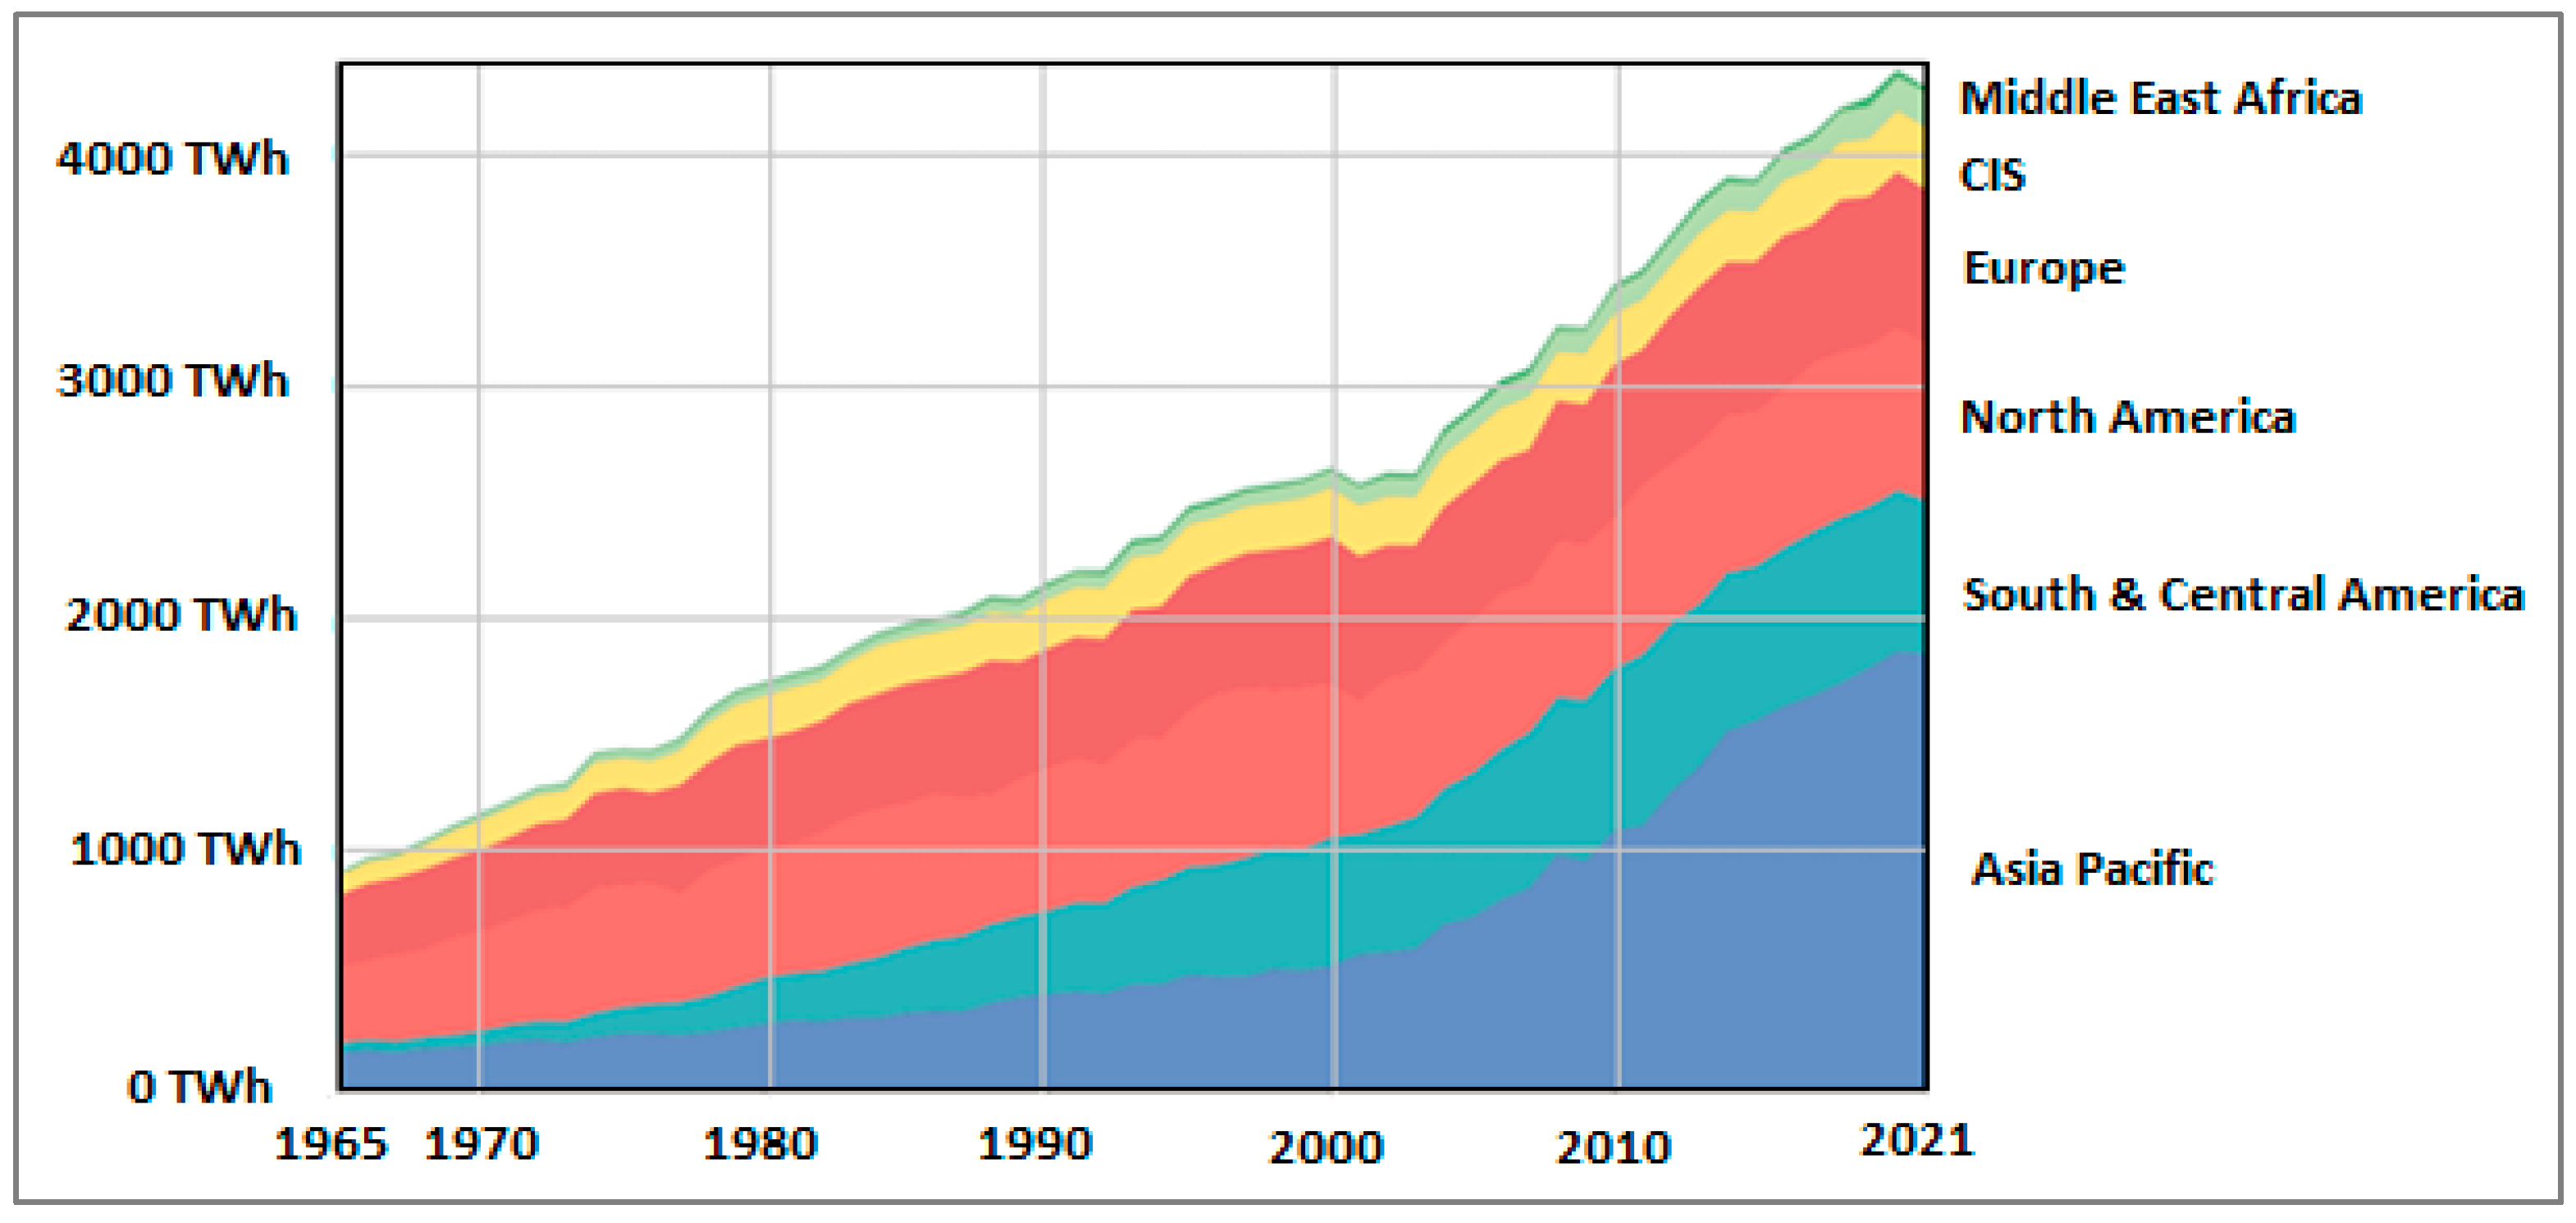
Figure 8 shows the status of hydropower generation by region from 1965 to 2019 [
37]. The entire world is divided into seven regions, i.e.,the Middle East, Africa, CIS, Europe, North America, South and Central America, and Asia-Pacific. In Eastern Africa, the hydropower generation increment rate in 2019 was more than 2.5 times that in 1985. The hydropower generation was 19.68 TWh in 1985, reaching 68.85 TWh in 2019 [
37].
The same tradition has also been followed by other regions. The increment in the electricity generation from hydropower plants increased approximately 1.68 times, 4.57 times, and 1.84 times in 2019 compared to1985 for Africa, Asia Pacific, and Central America, respectively. In Europe, the hydropower-generation capacity was 632.5383 TWh in 2019, and in North America, the capacity was 676.9256 TWh. According to the ‘Our World in Data’ report, the hydropower-generation capacity is still more than 60% of entirely renewable energy sources excluding biomass (traditional).
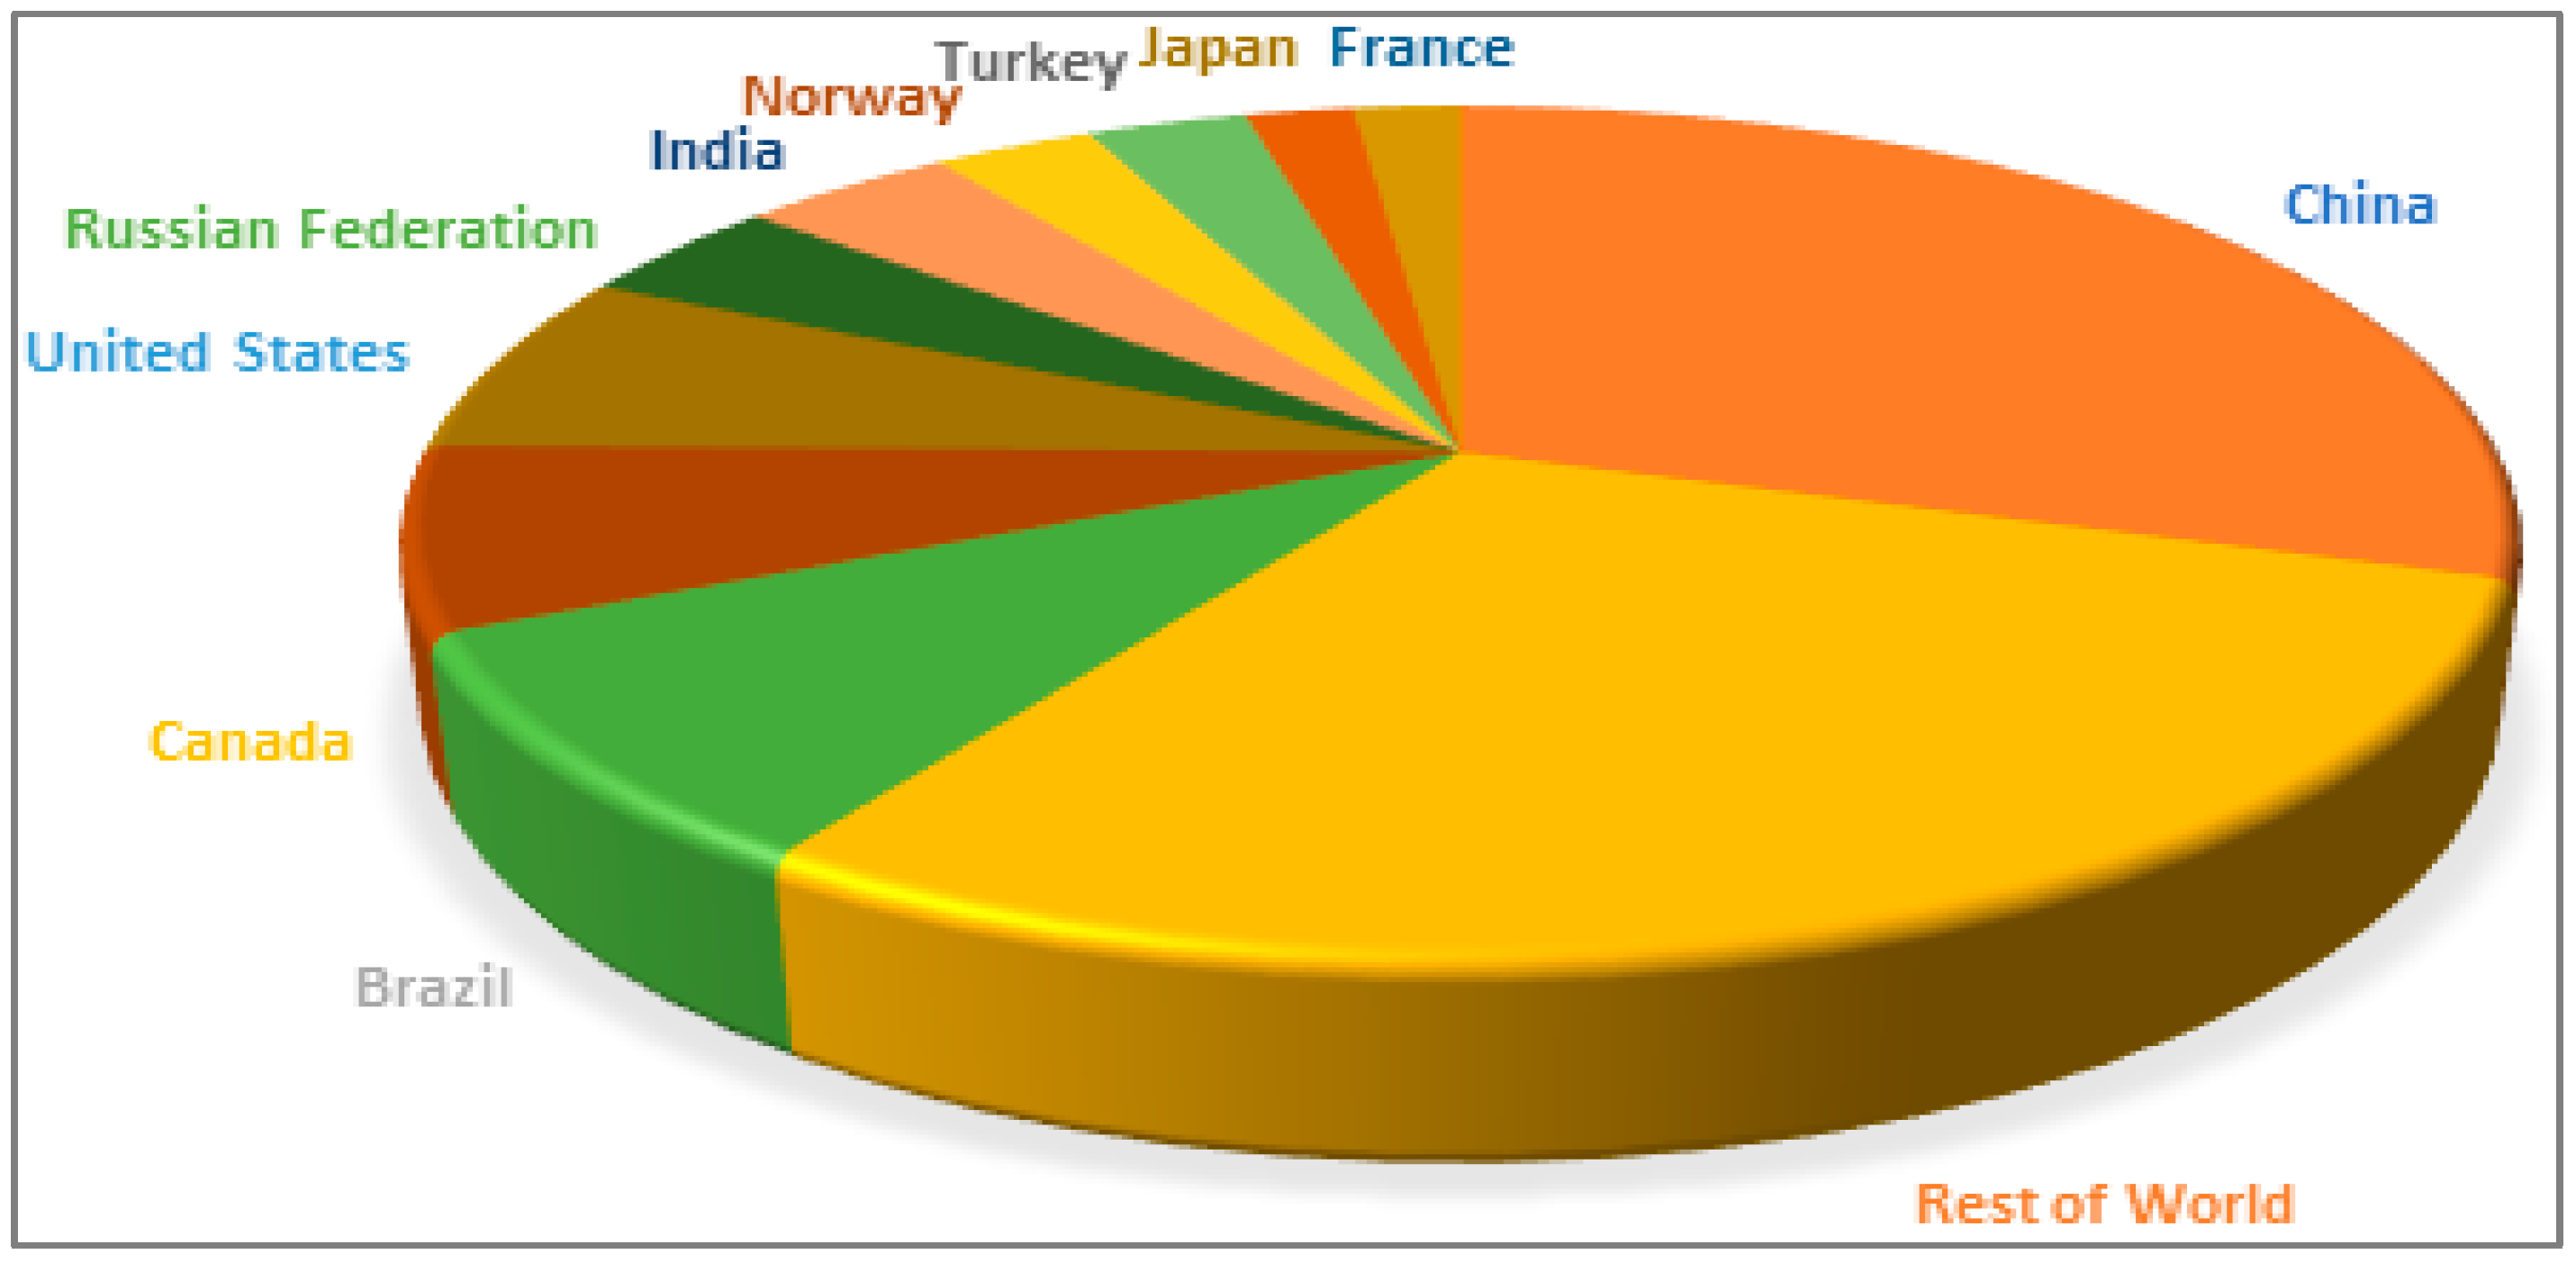
At the end of 2020, China secured the chief position in hydropower generation with 29% of total hydropower generation capacity, followed by Brazil, Canada, the United States, and India with 9%, 7%, 7%, and 4%, respectively.
Figure 9 shows the global hydropower capacity and the shares of the top countries, as well as the rest of the world, in 2020. Other countries in the sixth to tenth position in hydropower generation are the Russian Federation, Norway, Turkey, Japan, and France, respectively [
36].
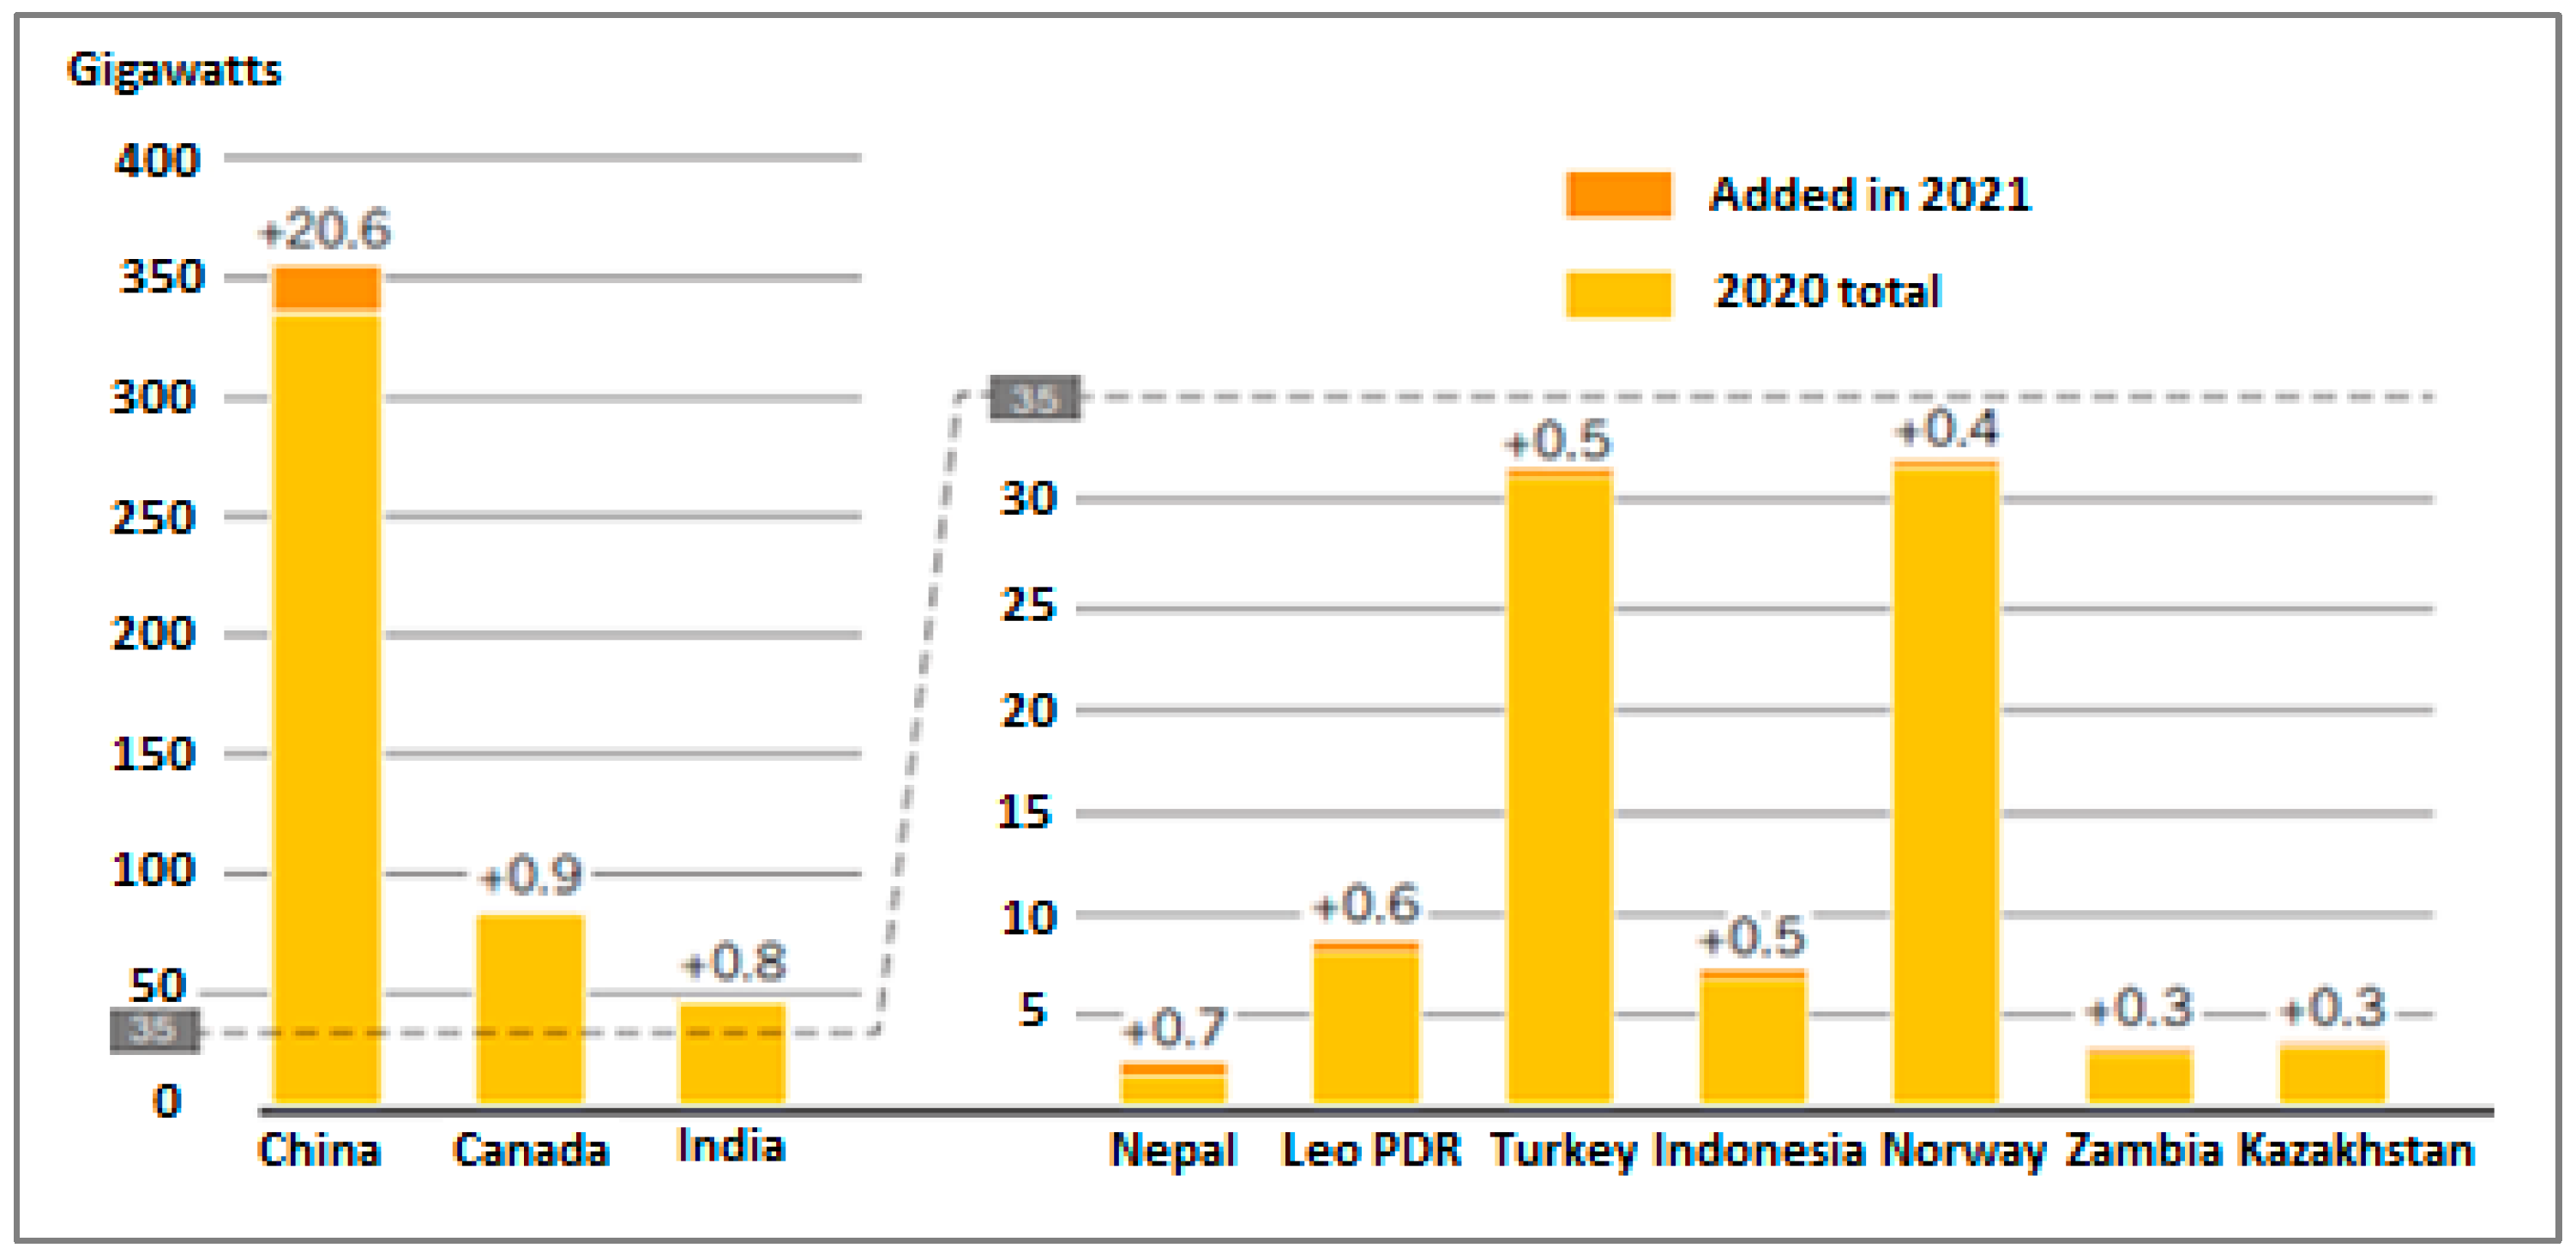
Figure 10 and
Figure 11 display the hydropower capacity and addition of the world’s top countries [
36,
37]. The hydropower-generation capacity is increasing for maximum countries day by day. When looking at the case of China, an increment of 20.6% in hydropower generation was observed in 2021 from2020. This scenario was followed by some other countries, such as Canada, India, Nepal, Lao PDR, Turkey, Indonesia, Norway, Zambia, Kazakhstan, etc.
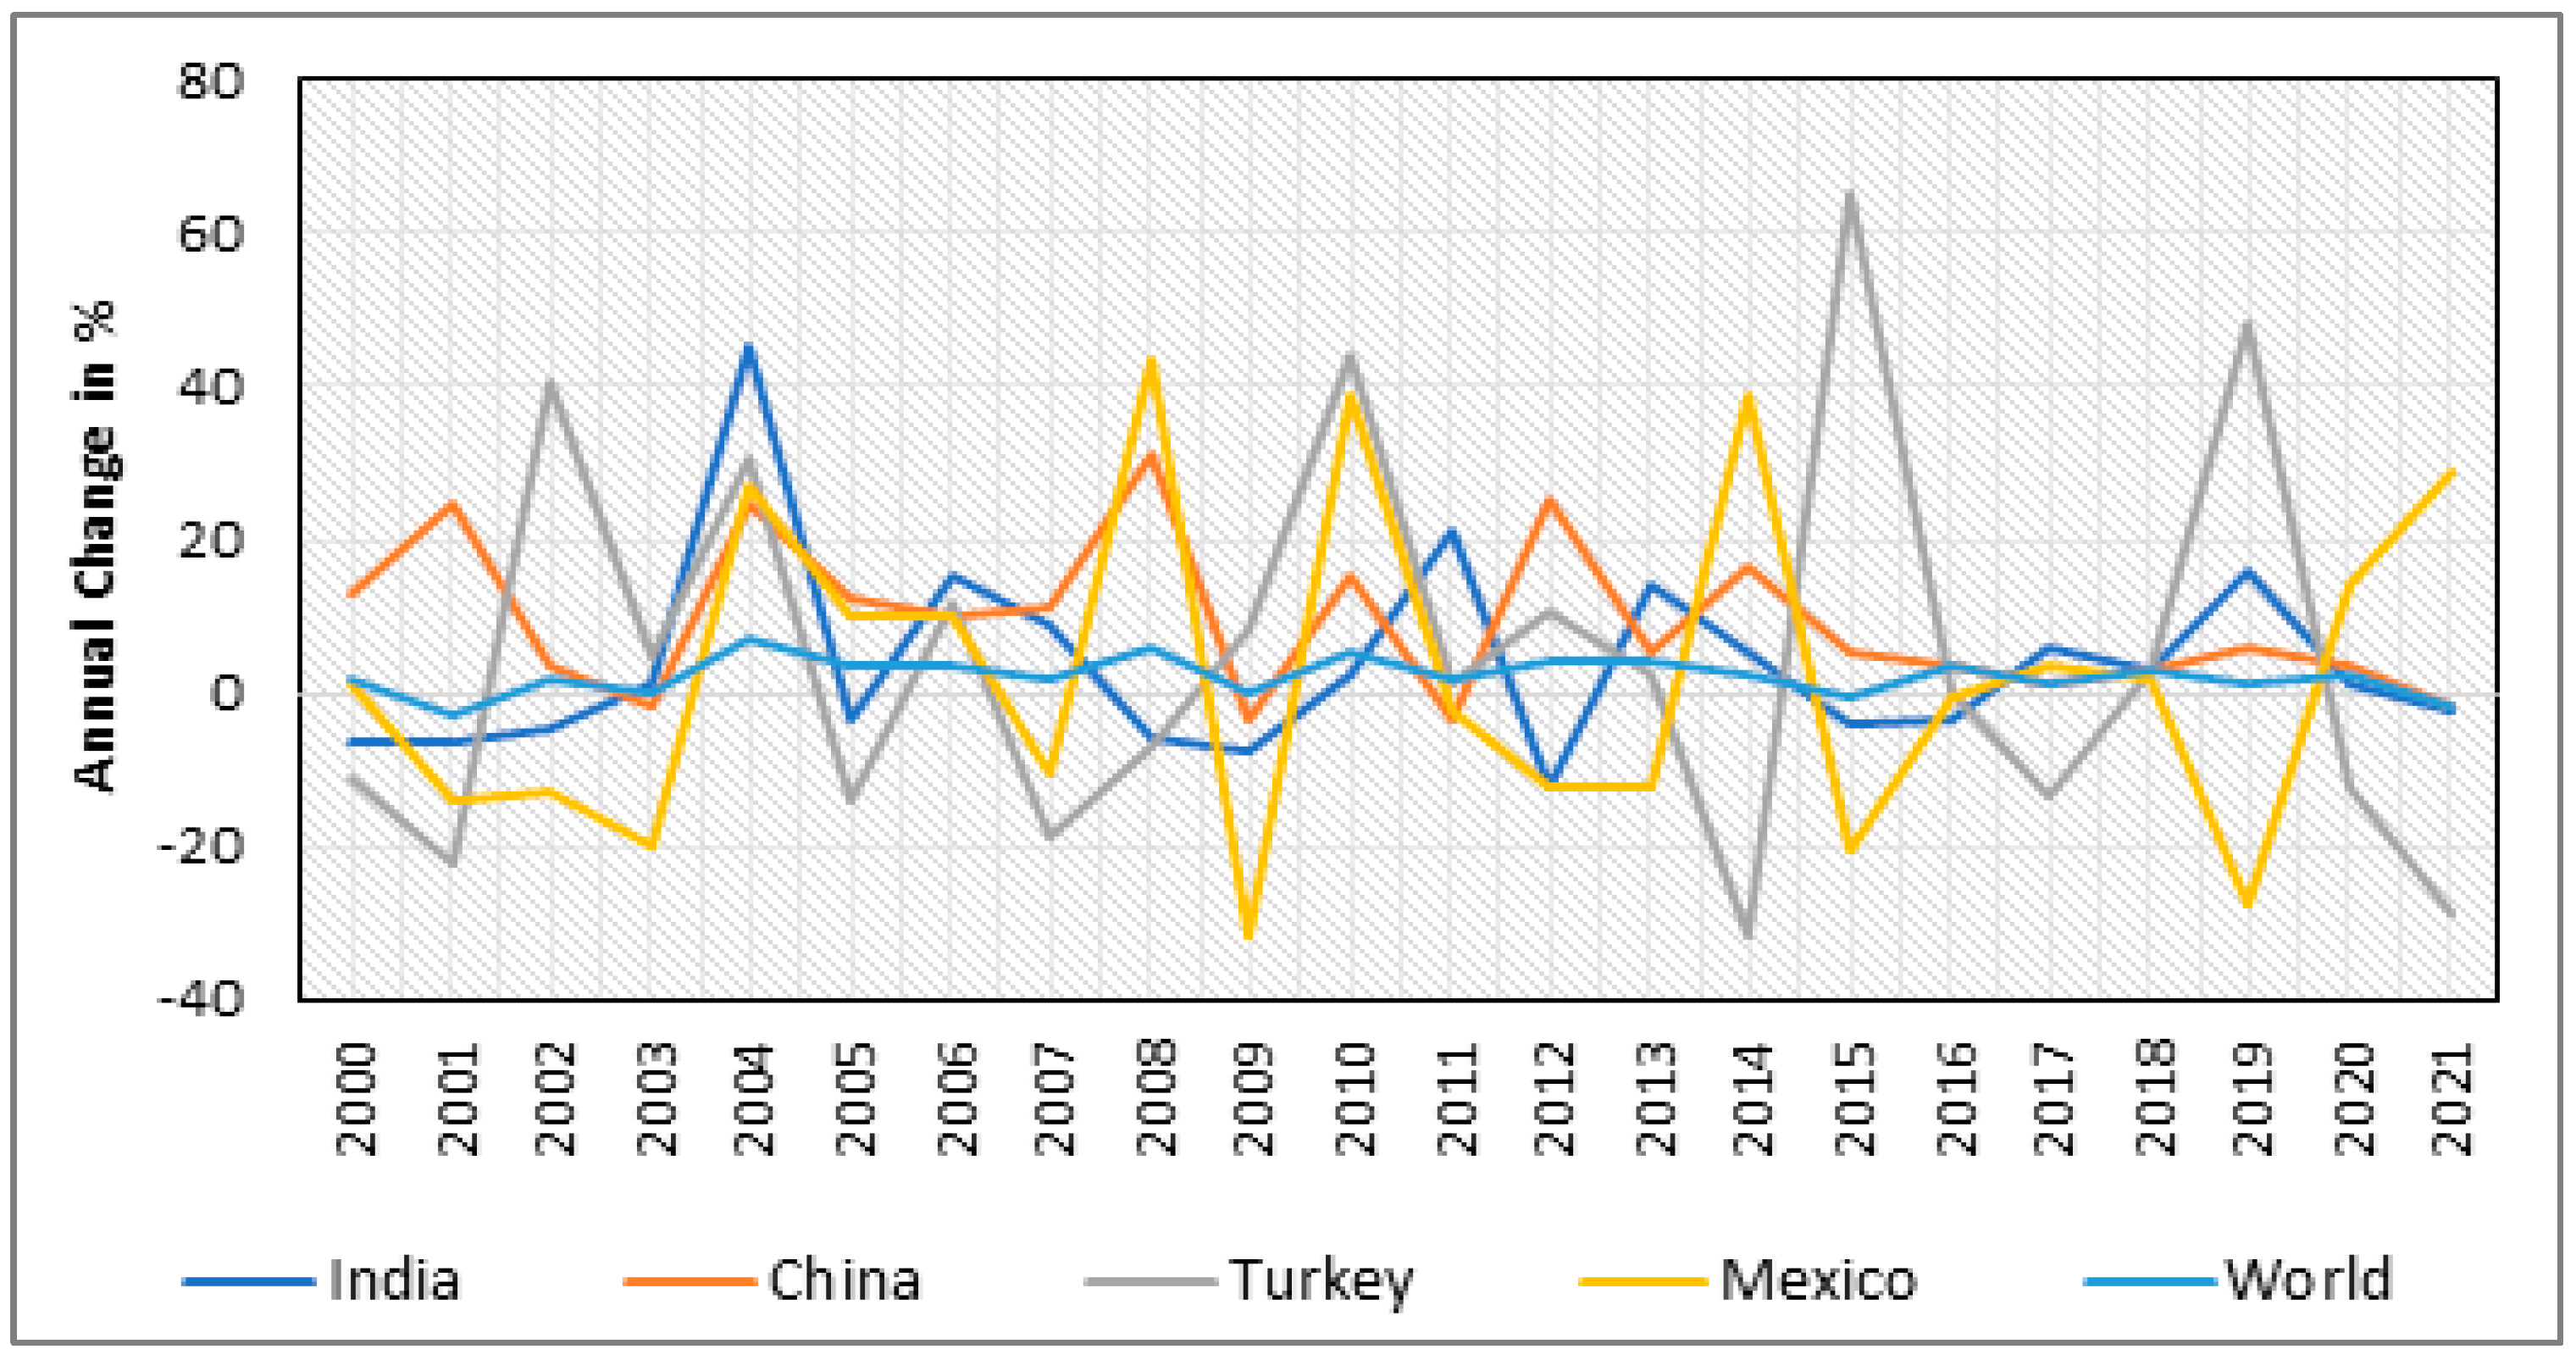
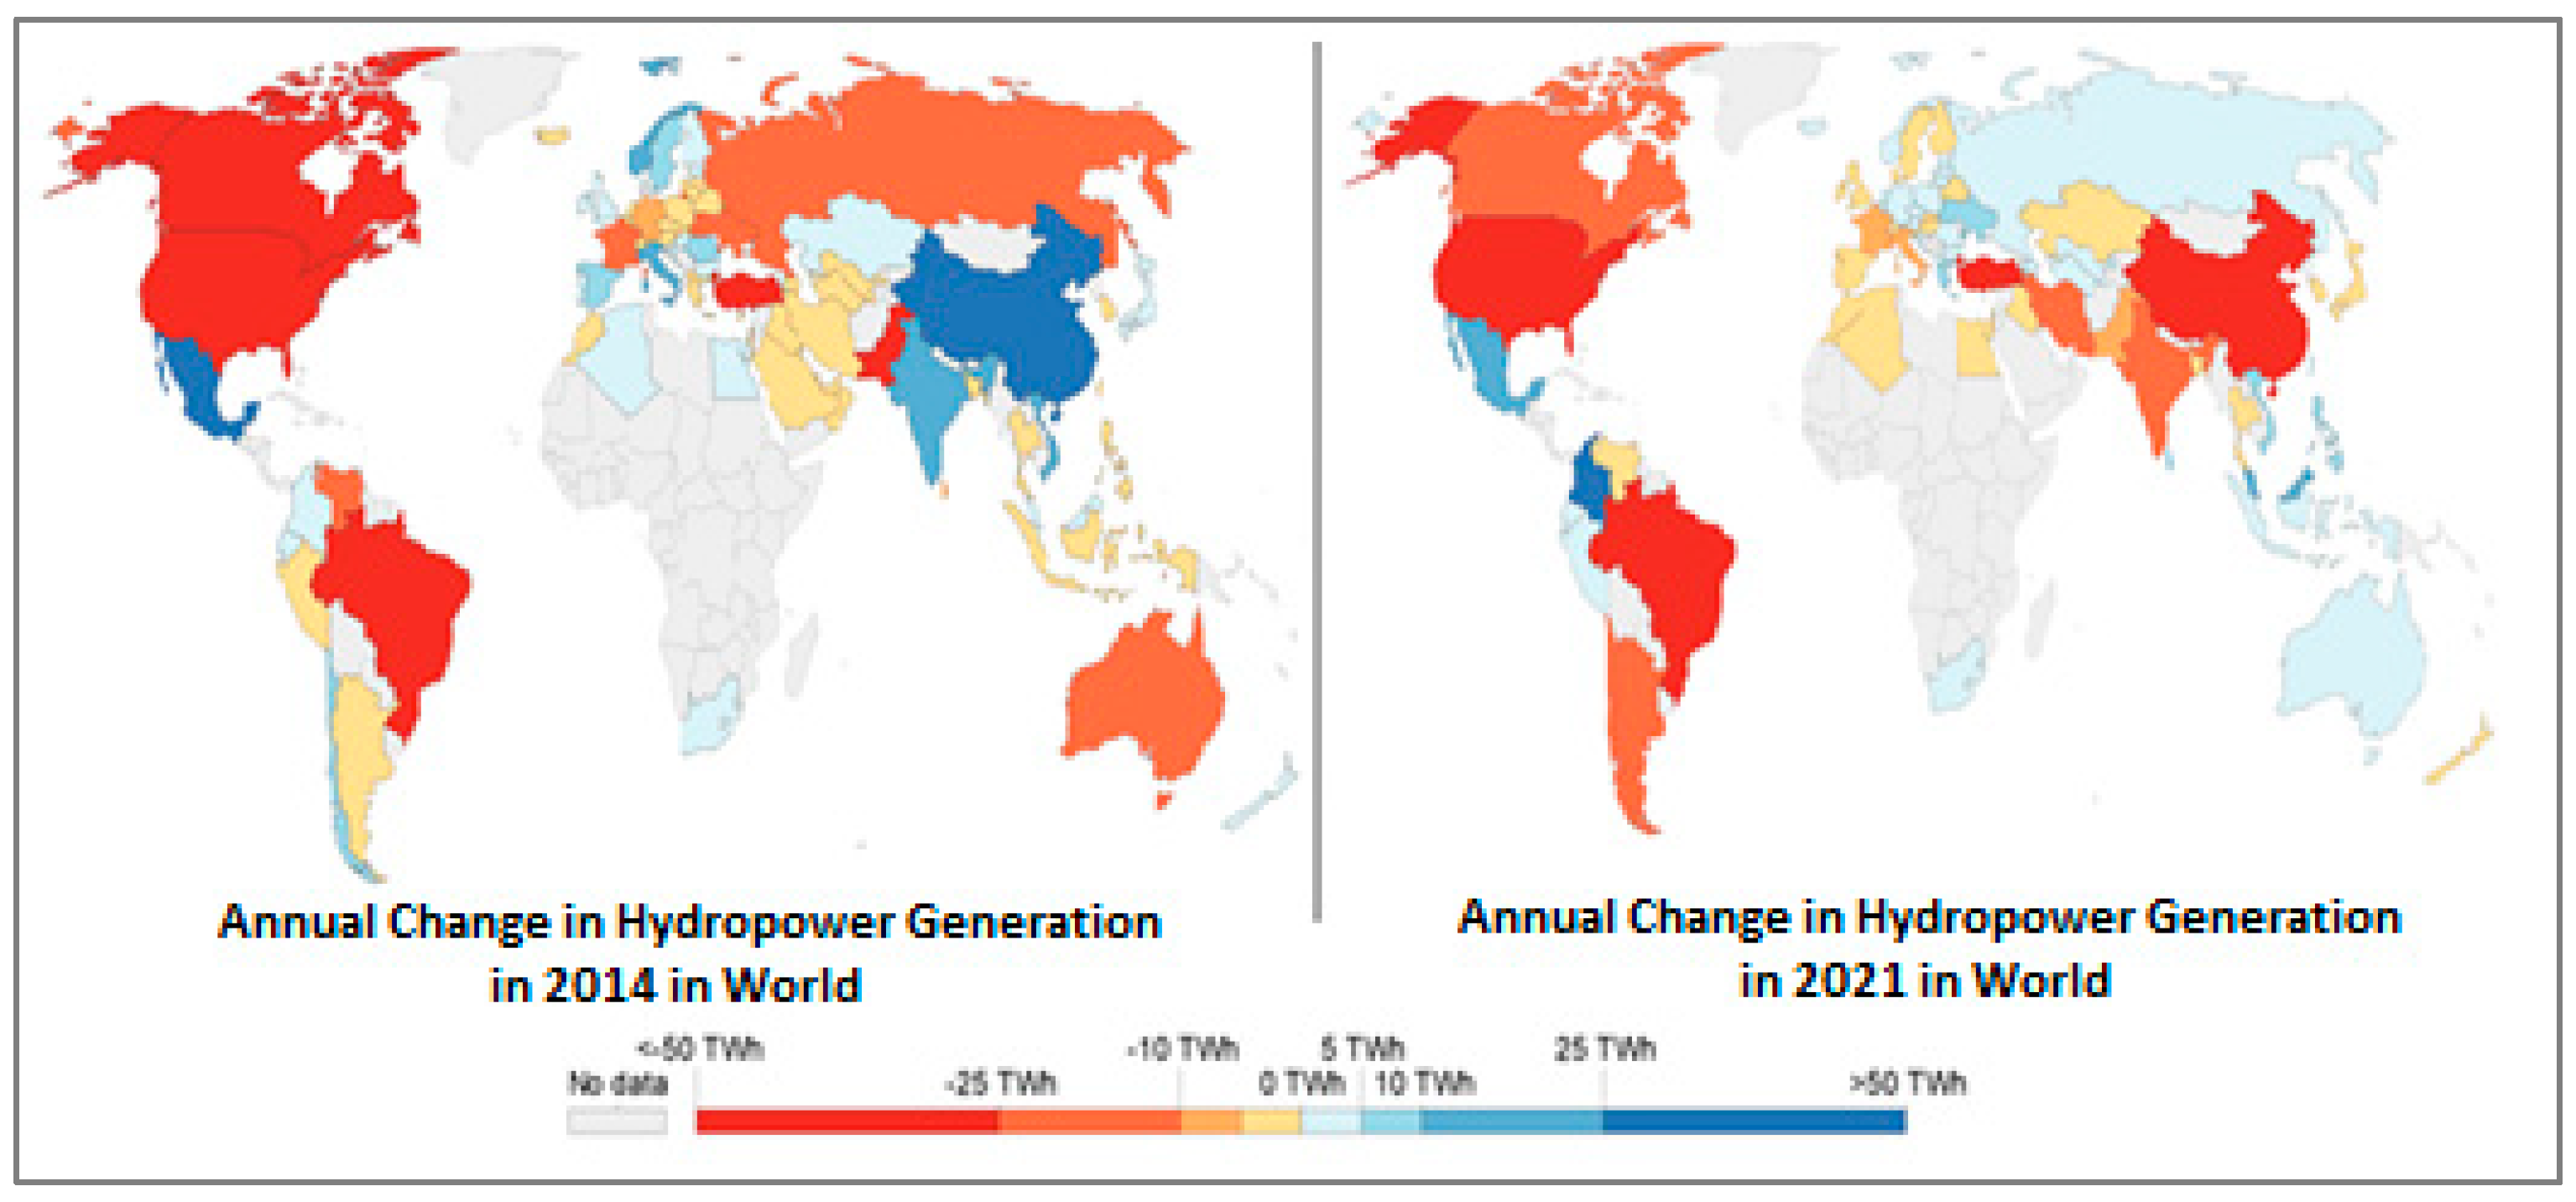
Figure 12 displays the annual change in hydropower generation between 2014 and 2021 [
37]. It can be concluded from the graphs that there is a huge change in the capacity addition in hydropower throughout the world. Hydropower generates electricity at a lesser rate than conventional sources, as well as at a lesser rate than almost all other renewable energy sources. Dams built for hydropower generation also help in checking flood conditions and canals help in irrigation. To sum, hydropower sourcesare not only a source of power generation, but a gold mine in disguise.
4.2. Global Wind Power Scenario
The usage of wind power is rising around the globe as its cost drops. In the past two decades, a spike of 75% has been reported in offshore and onshore wind-generation capacity, rising from 7.5 GW in 1997 to 564 GW in 2018. Wind electricity production has doubled between 2009 and 2013 [
37]. Wind turbines were first introduced a century ago, succeeding the invention of the electric generator in 1830. In 1887 and 1888, wind-power-generation installation took place in the United Kingdom and the United States, respectively. The first modern wind power generatorwas developed in Denmark. The volume of power gathered from the wind depends on the blade’s length and the turbine’s size. Production is directly related to the rotor’s dimensions and the cube of the wind speed. The capacity of wind turbines has increased over this period. Previously, the turbine-rated capacity was 0.5 MW, and the diameter of the rotor was 15 m. Currently, the wind turbine capacity has reached 8 MW, and the rotor diameter is up to 164 m.
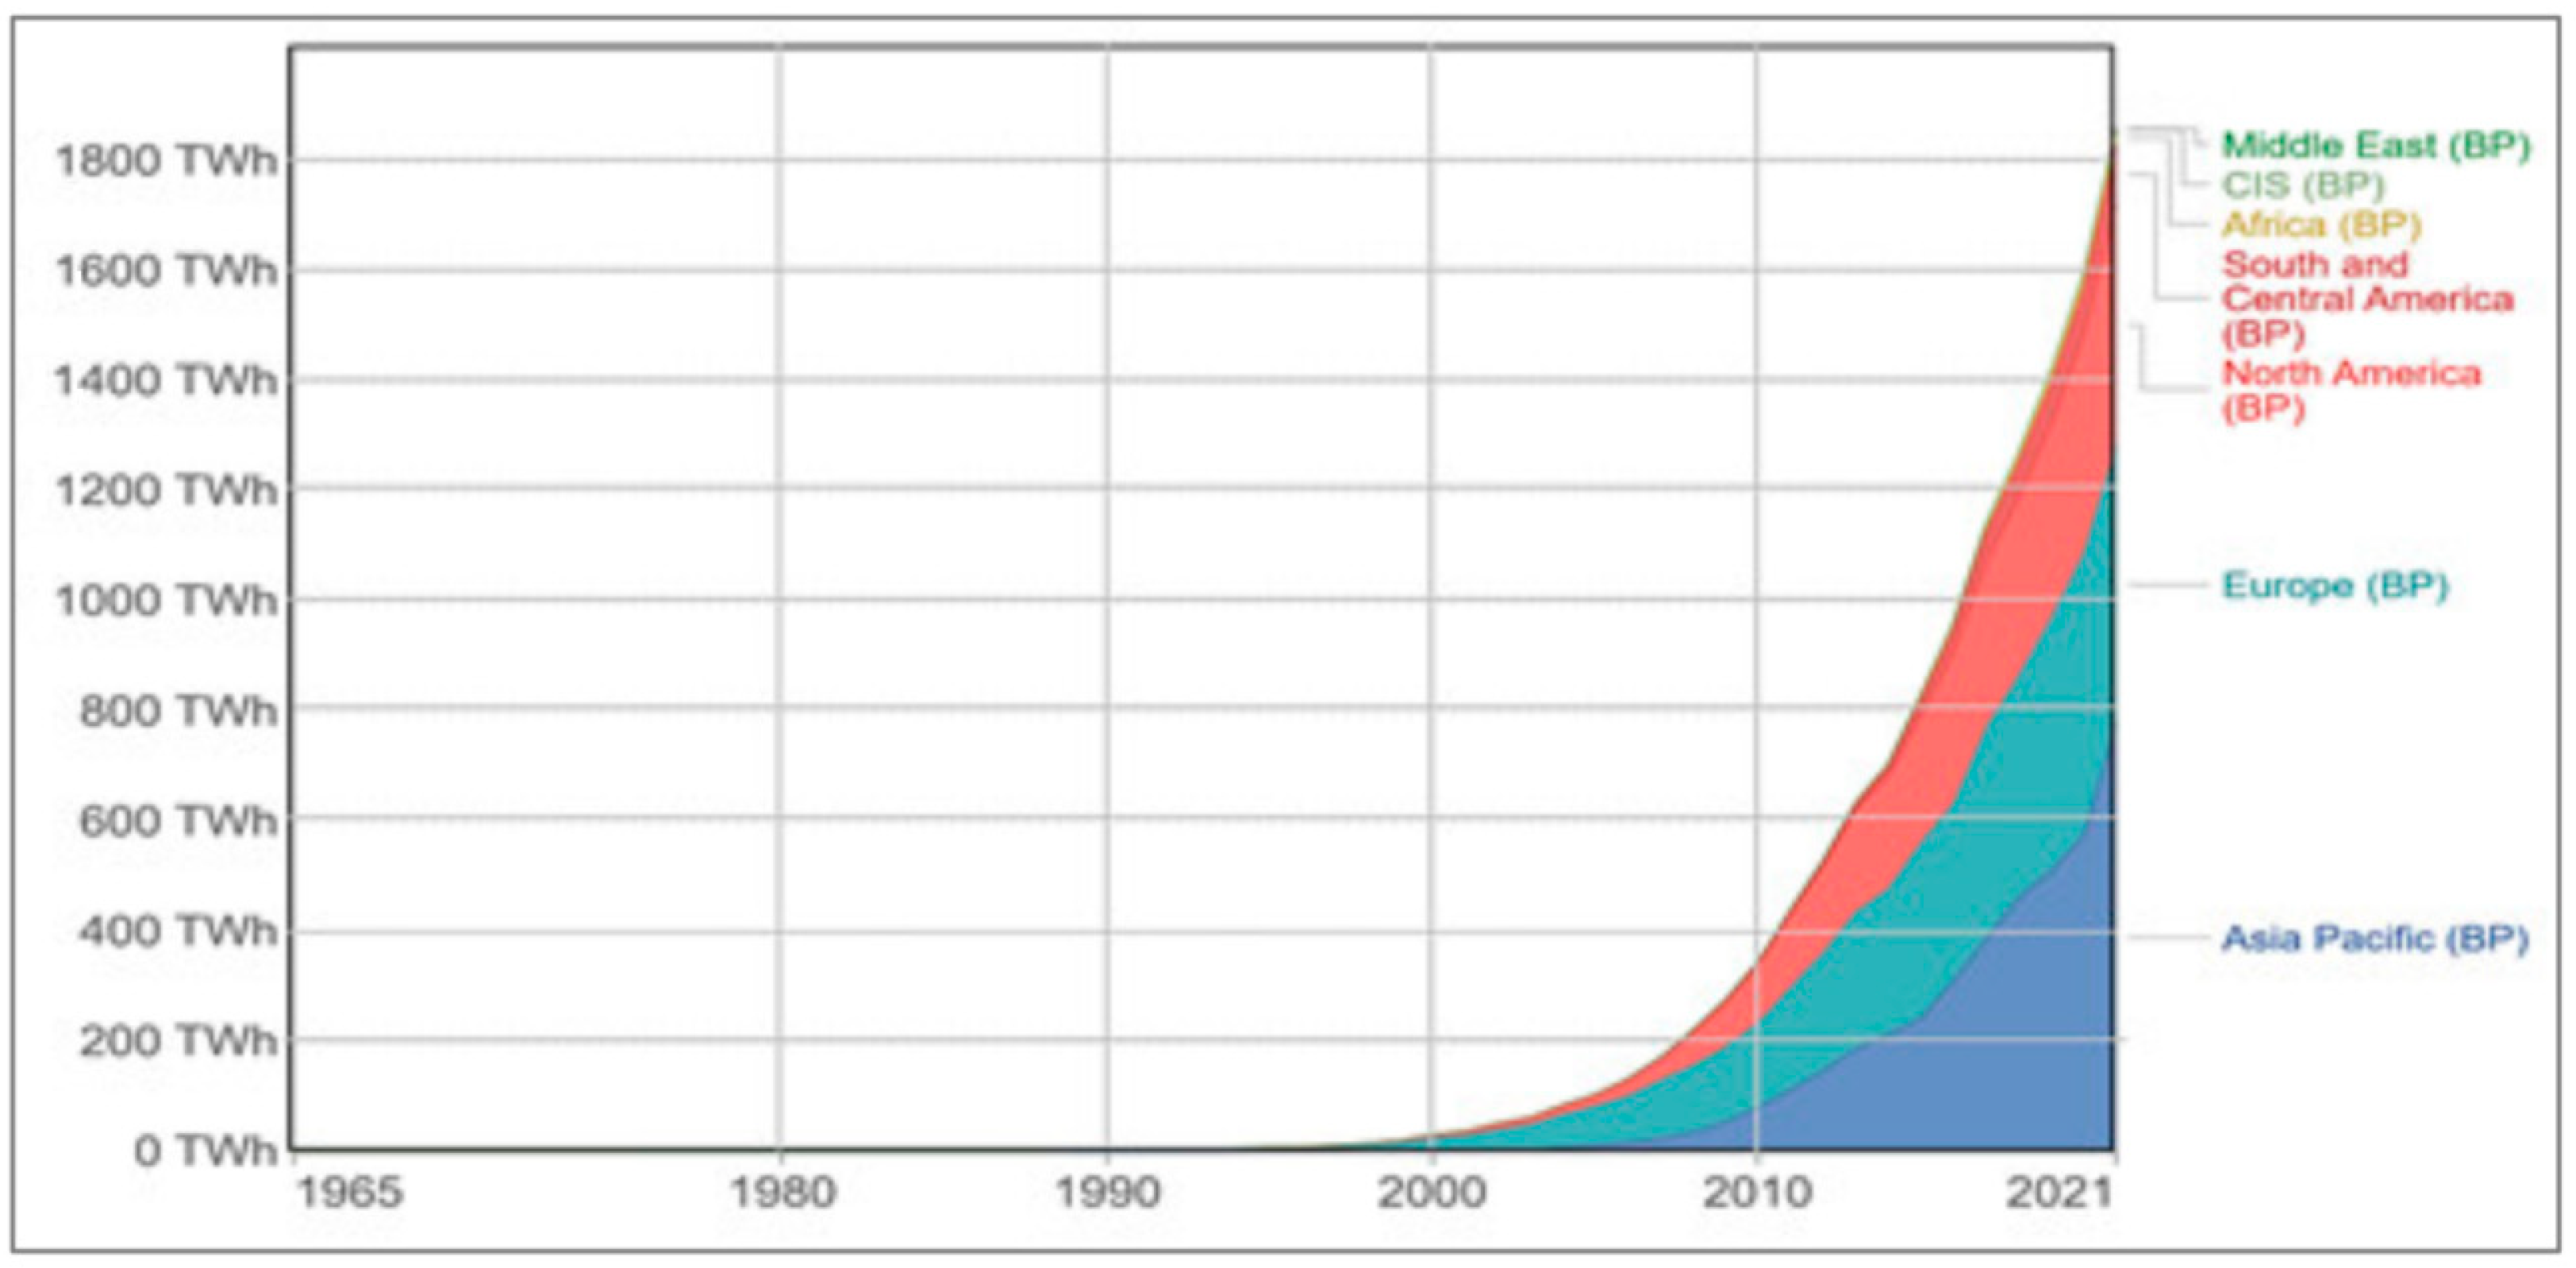
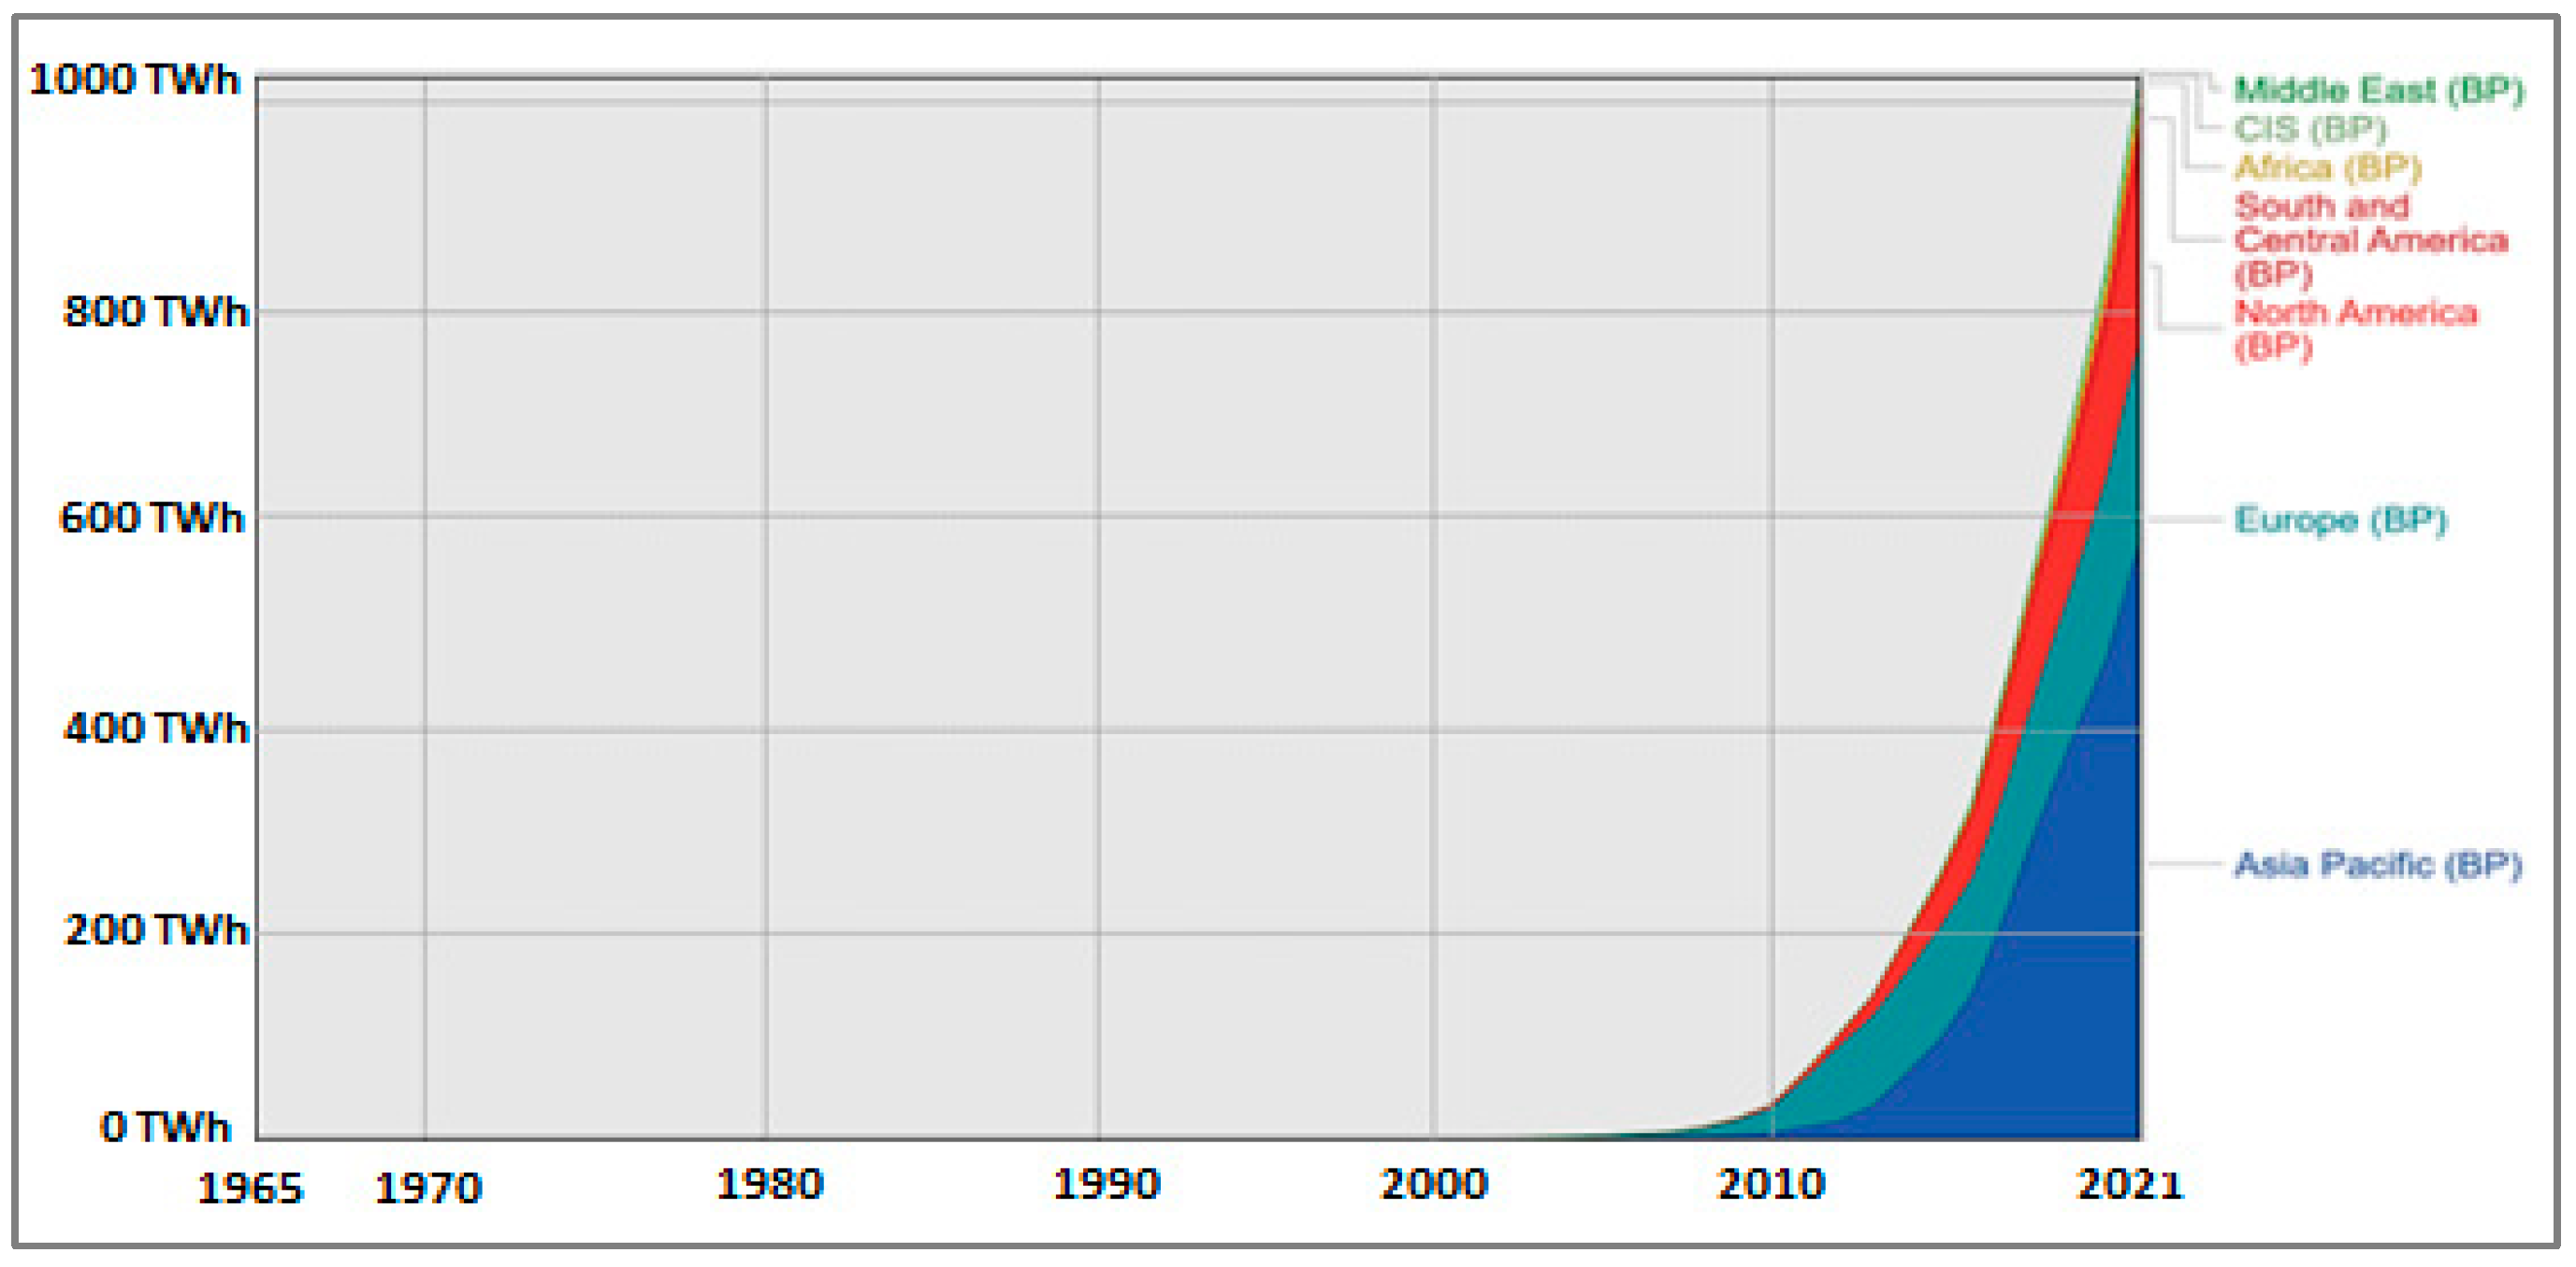
Figure 13 shows the status of wind power generation by region from 1965 to 2021. In 1978, Europe was the first region where wind energy generation was observed. Then in 1989, Europe and North America were the regions that generated around 3 TWh of wind energy. Gradually, in 2000, the Middle East, Africa, Europe, North America, South and Central America, and the Asia Pacific generated around 31 TWh. All of the sevenregions started to generate wind energy in 2010, with a capacity of 346 TWh. In 2021, wind energy generation increased to 1862 TWh [
37].
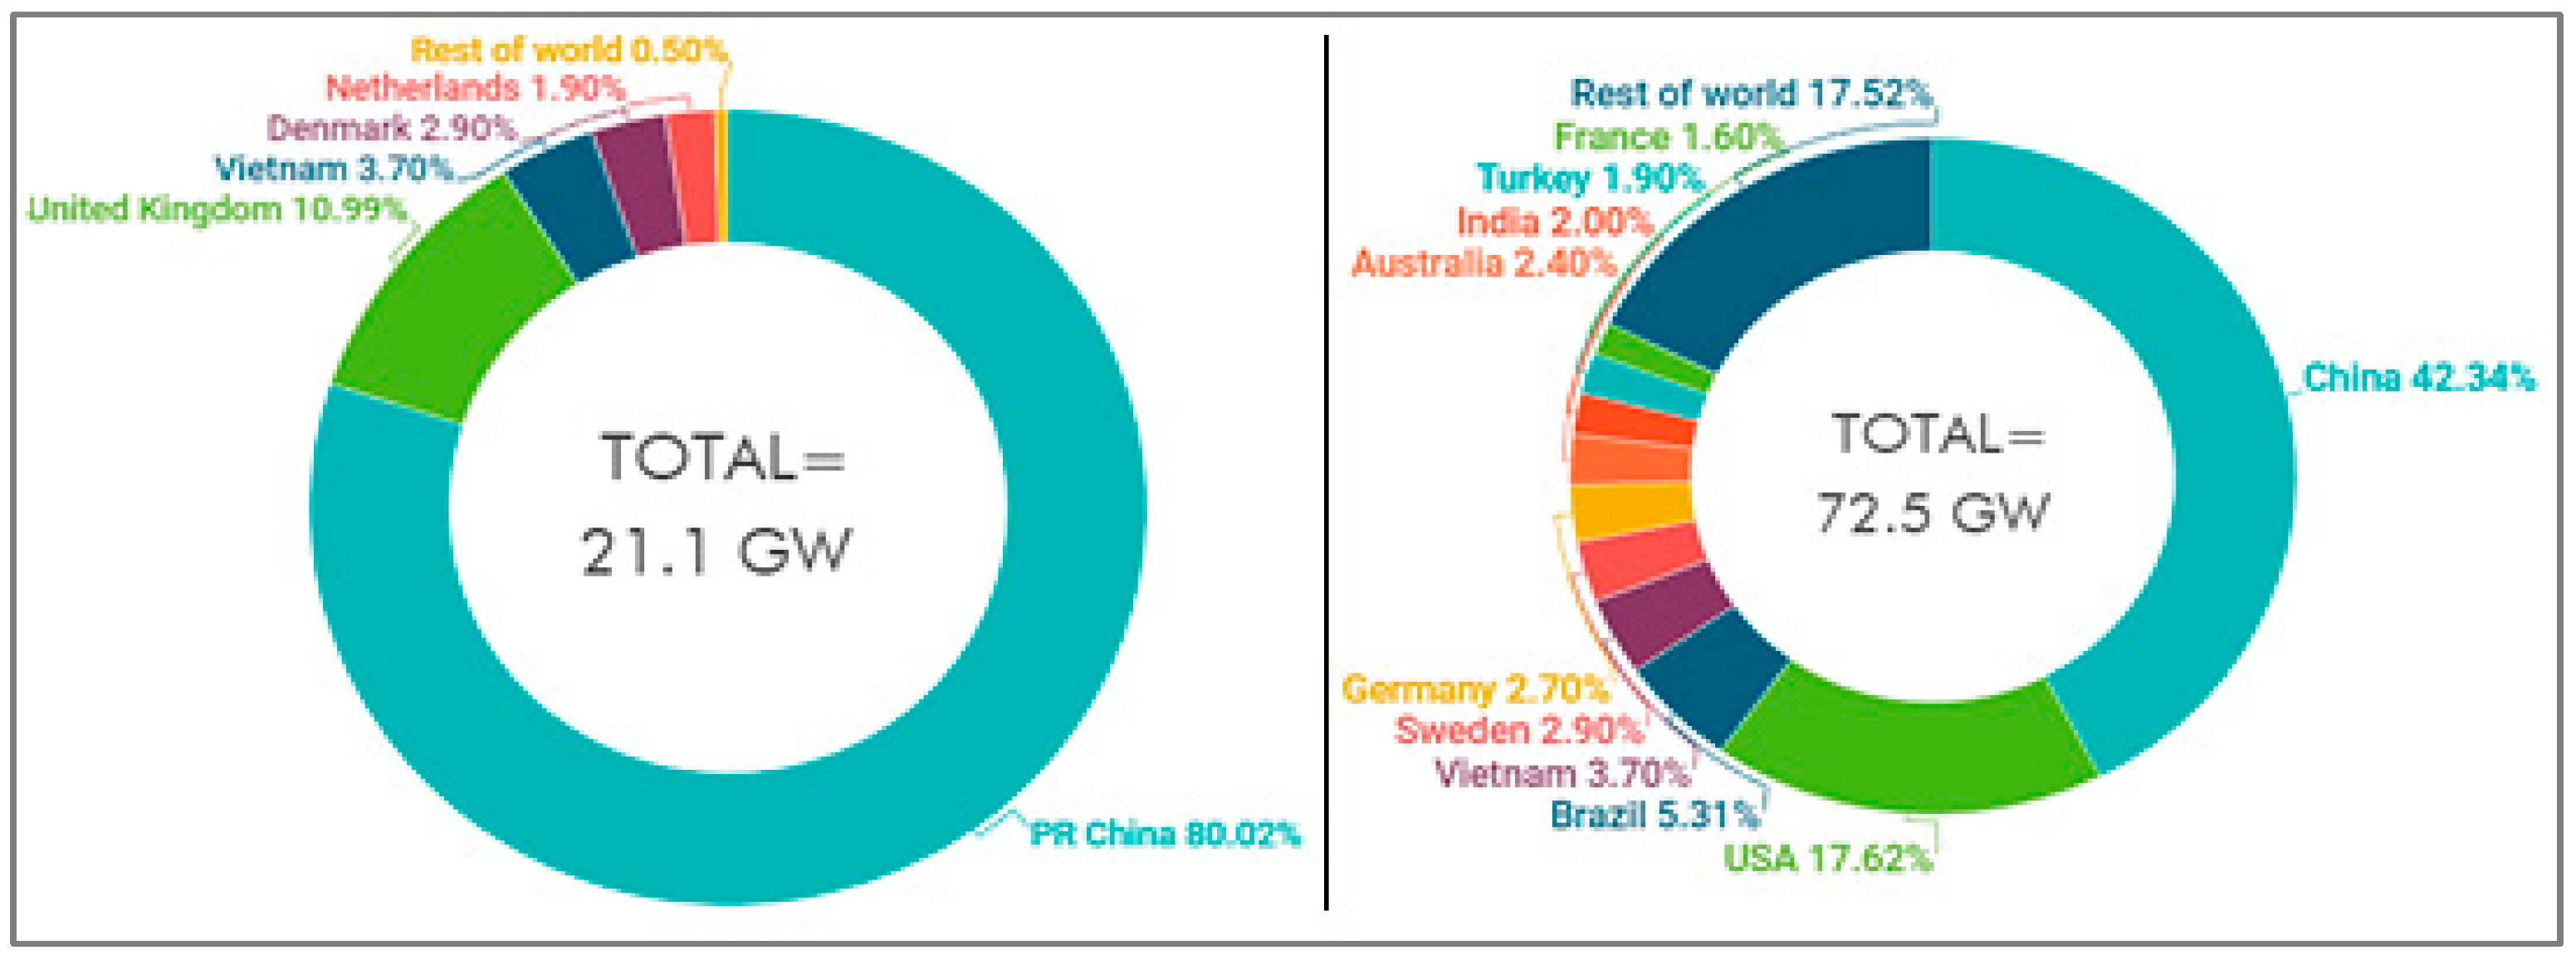
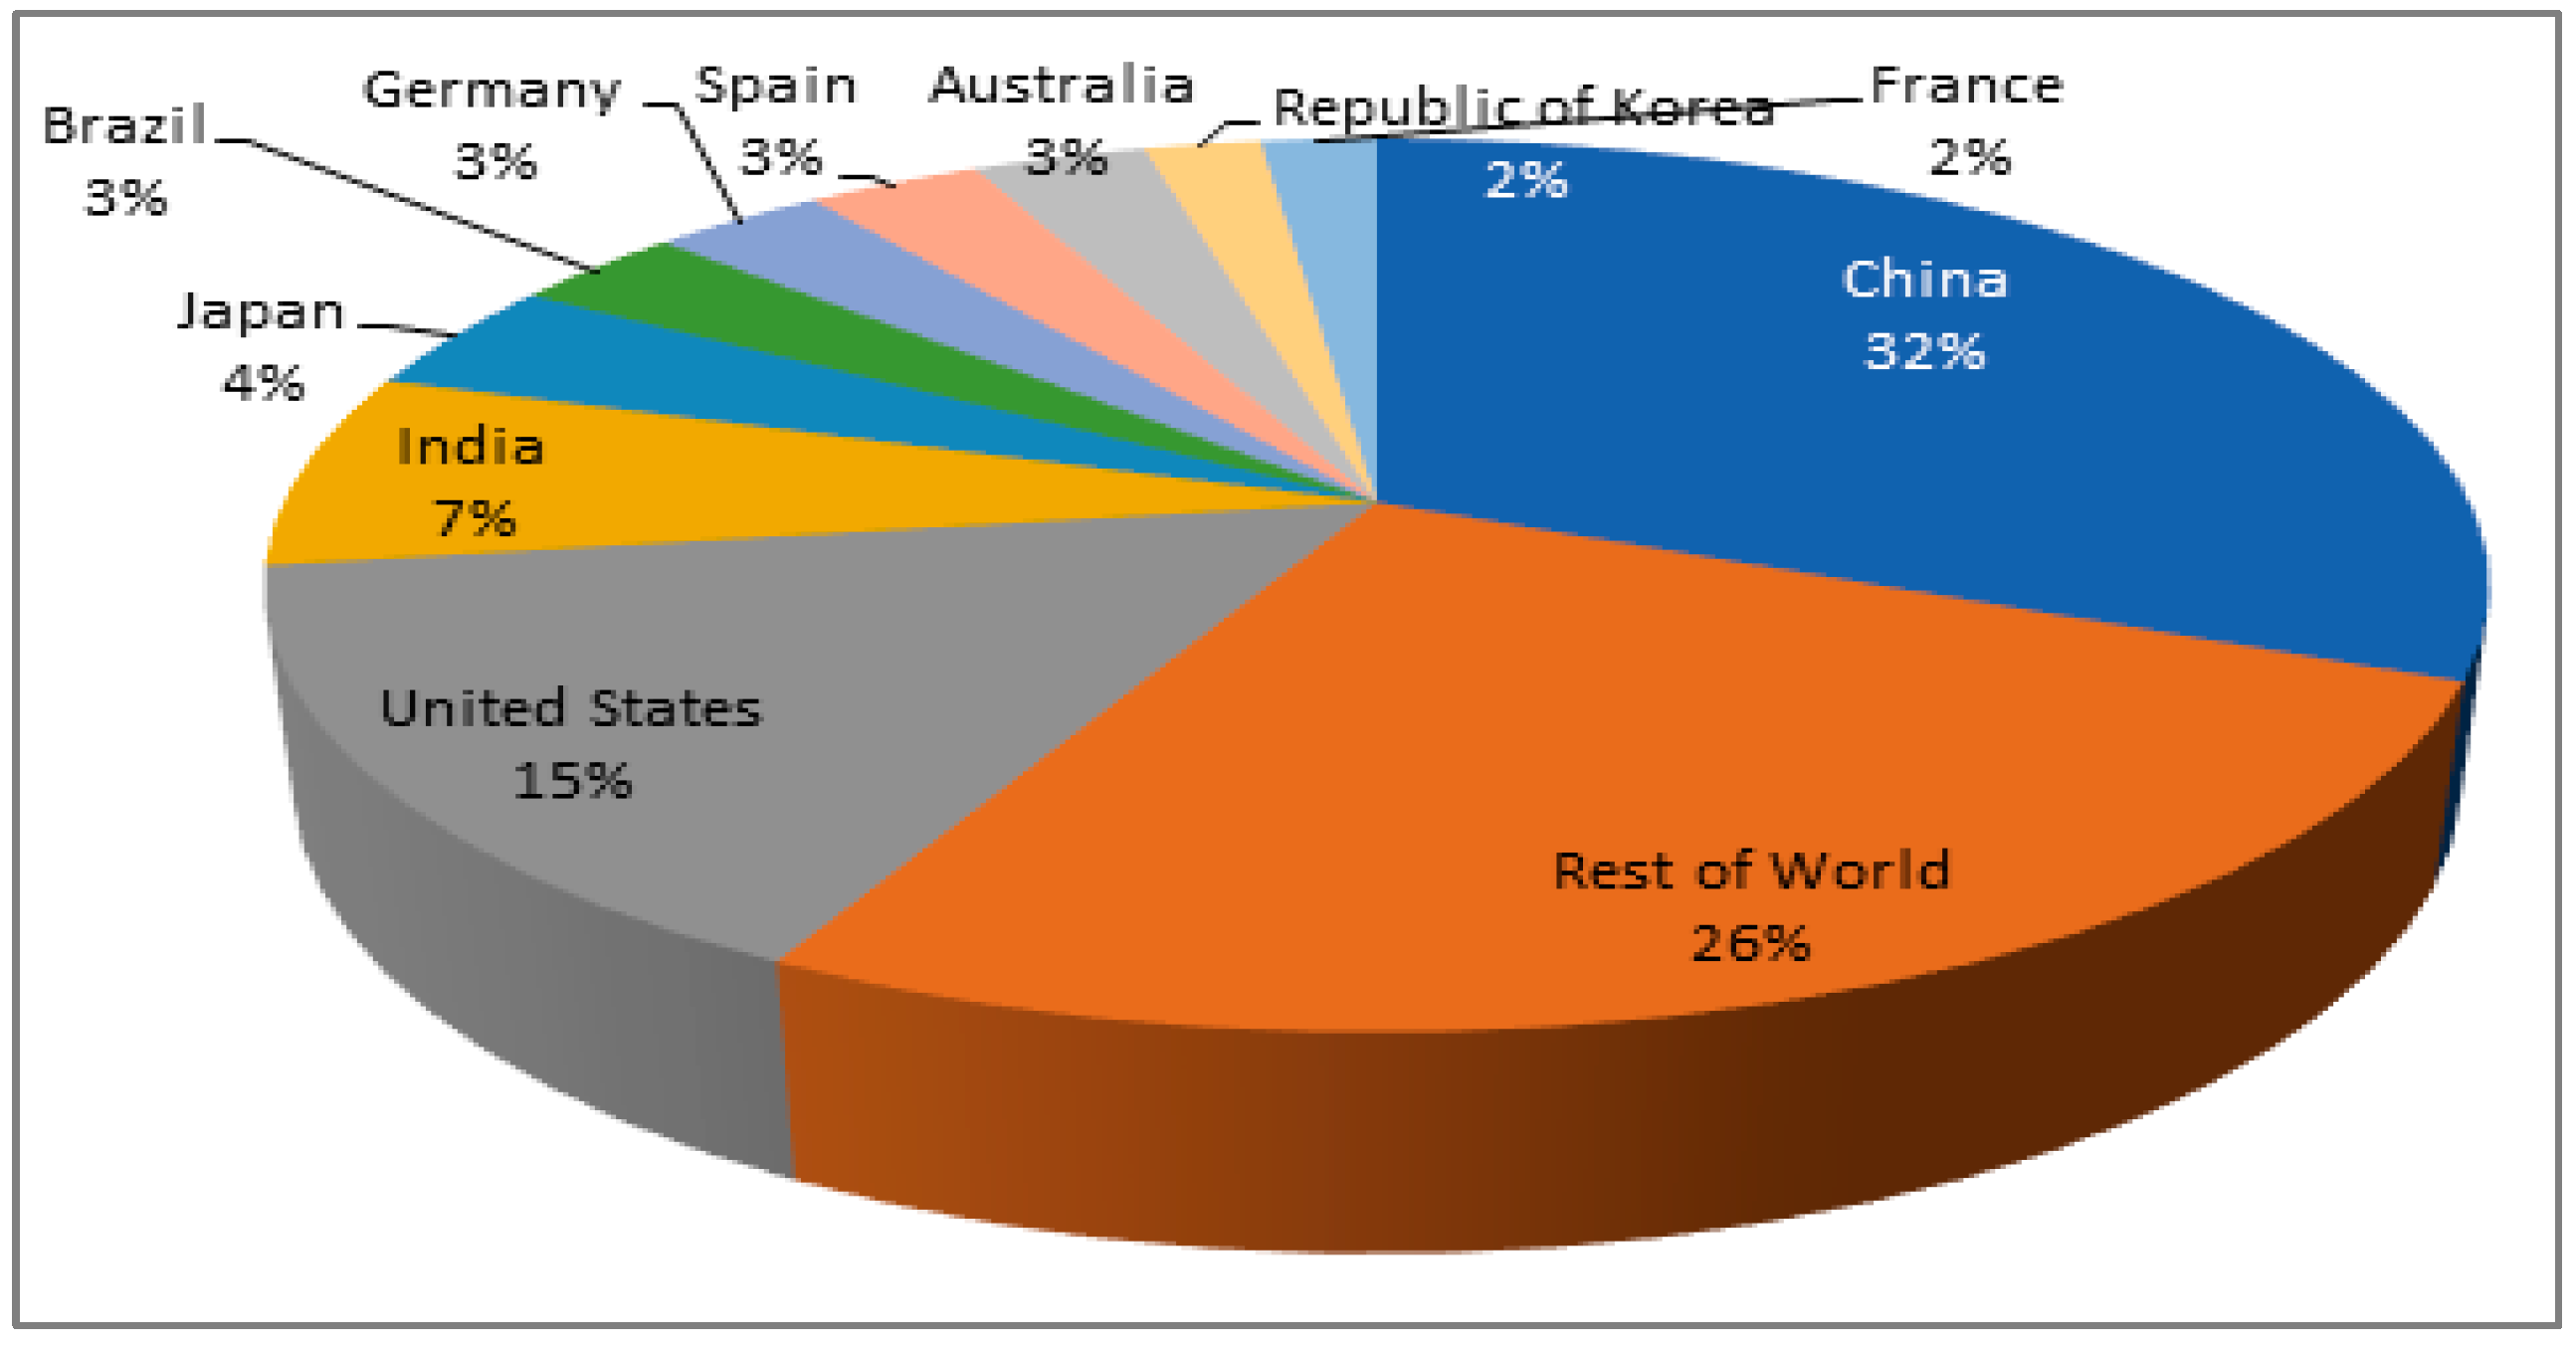
Figure 14 shows the new offshore and onshore wind power installation in 2021. China, the United Kingdom, Vietnam, Denmark, and the Netherlands are the world’s top five countries in terms of offshore wind power markets. Wind power of 21.1 GW was installed in 2021, of which 99.5% was been installed by these five countries. China made up over 80%, the United Kingdom made up around 10.99%, Denmark made up around 2.9%, and the Netherlands made up around 1.9%, while the rest of the world installed 0.5%. The top ten new onshore wind-installed countries are also shown in
Figure 14. Total new onshore wind power of 72.5 GW was installed in 2021. Around 42.34% was installed by China, making it the highest generating country, followed by the USA at around 17.62%. Brazil generated 5.31%, Vietnam made up 3.7%, Sweden installed 2.9%, Germany installed 2.7%, Australia installed about 2.4%, India made up 2%, Turkey installed 1.9%, 1.6% was installed by France, and the rest of world installed 17.52% [
37].
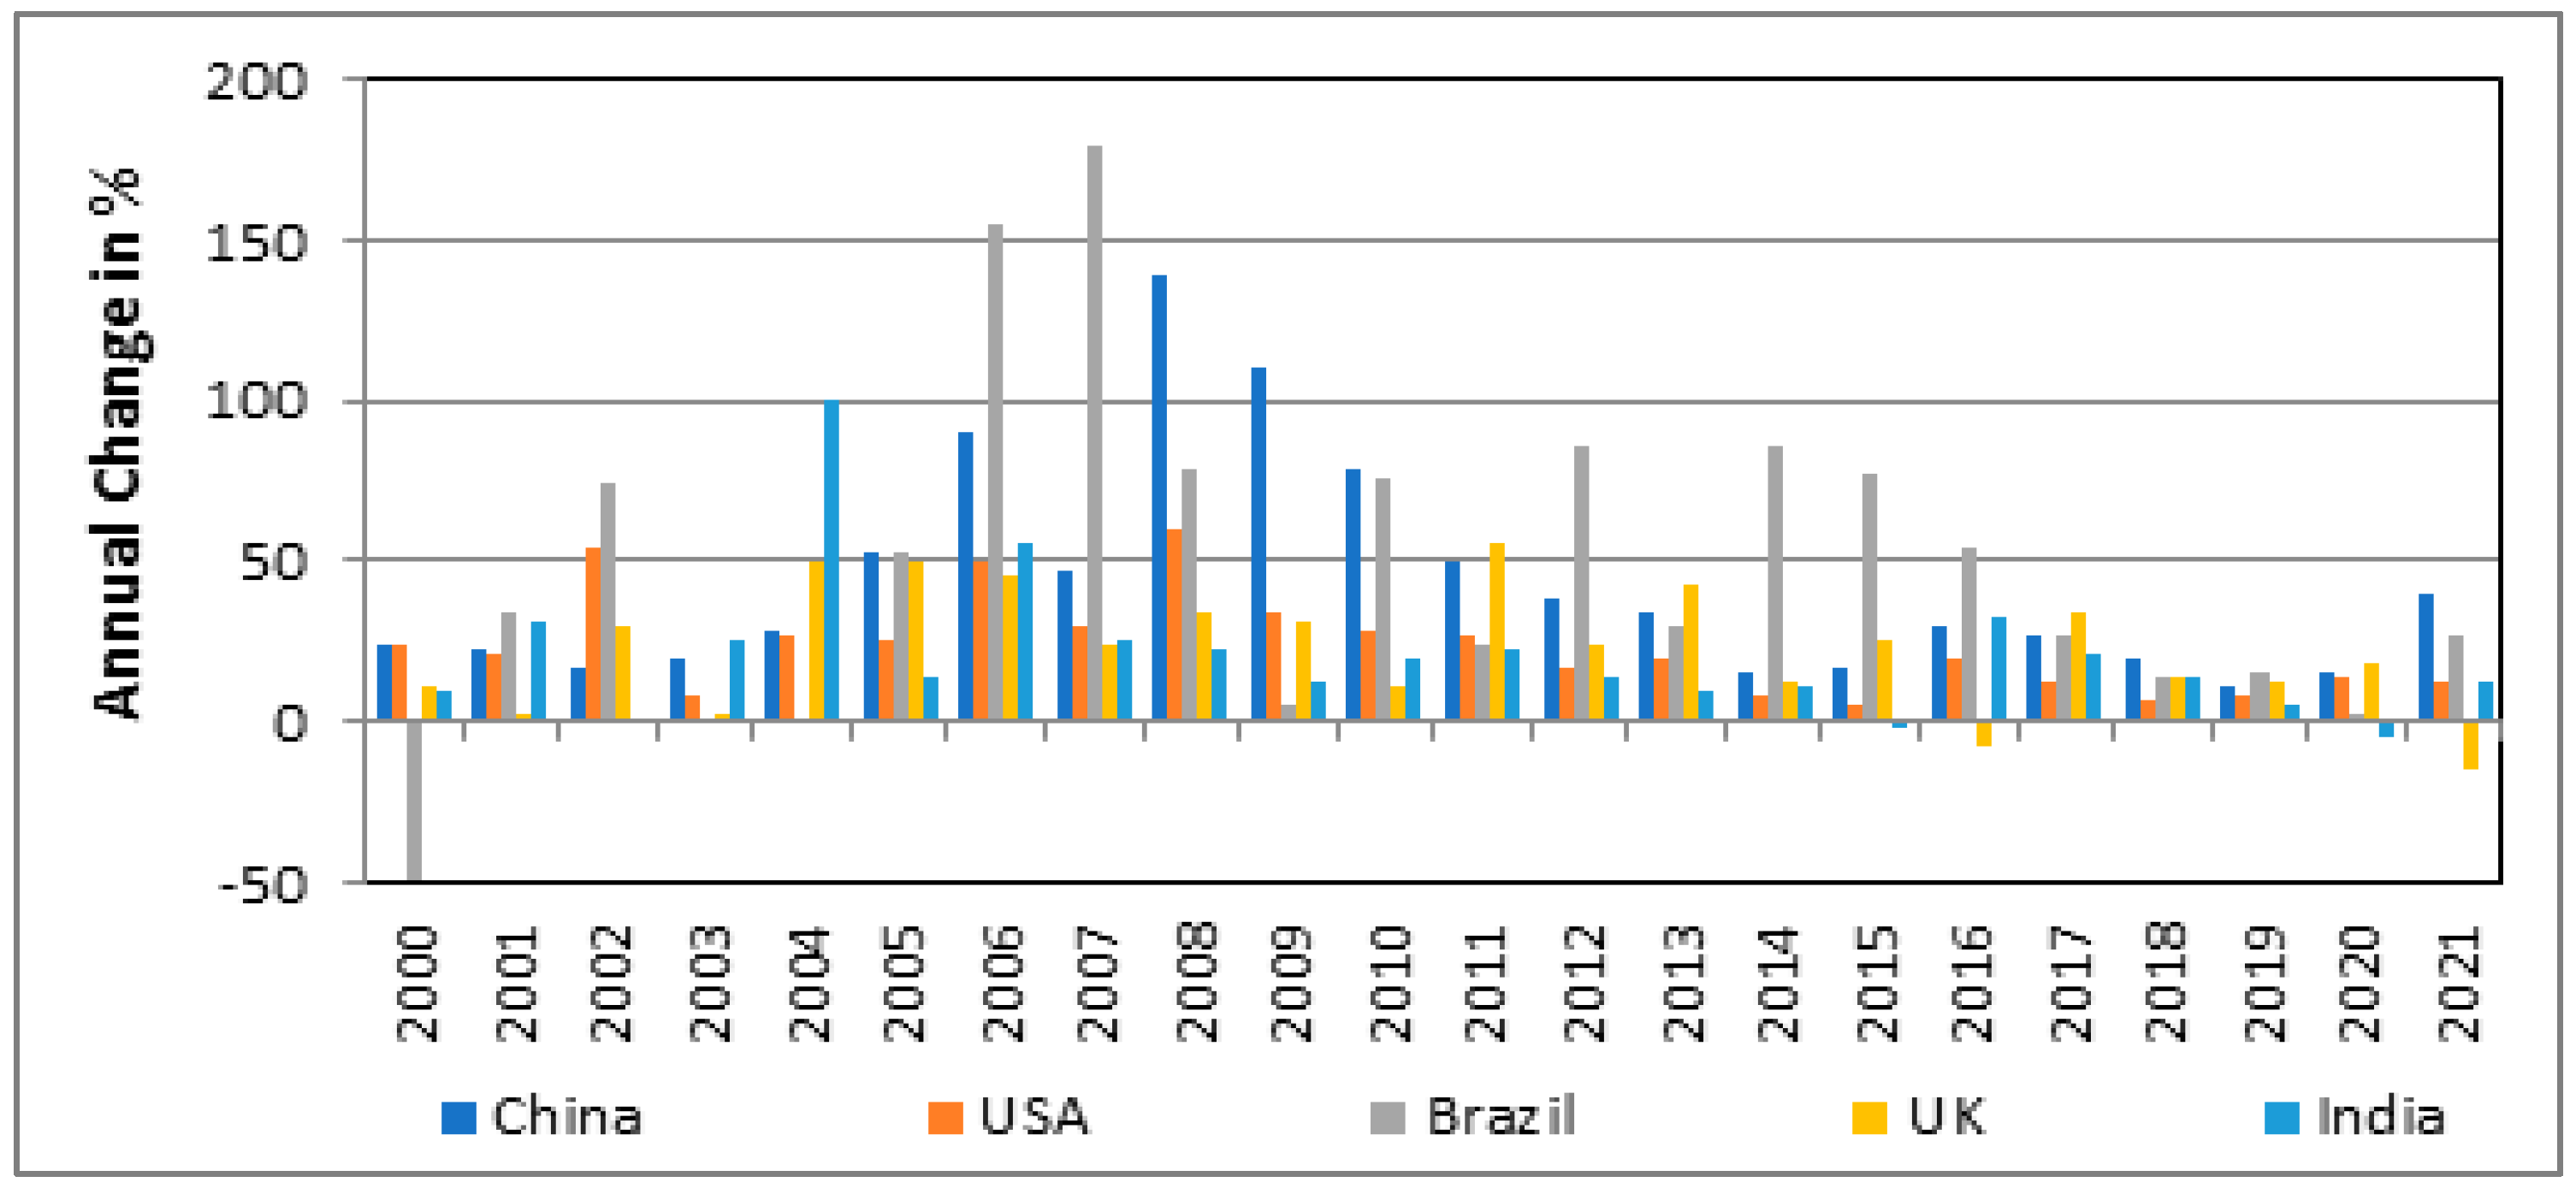
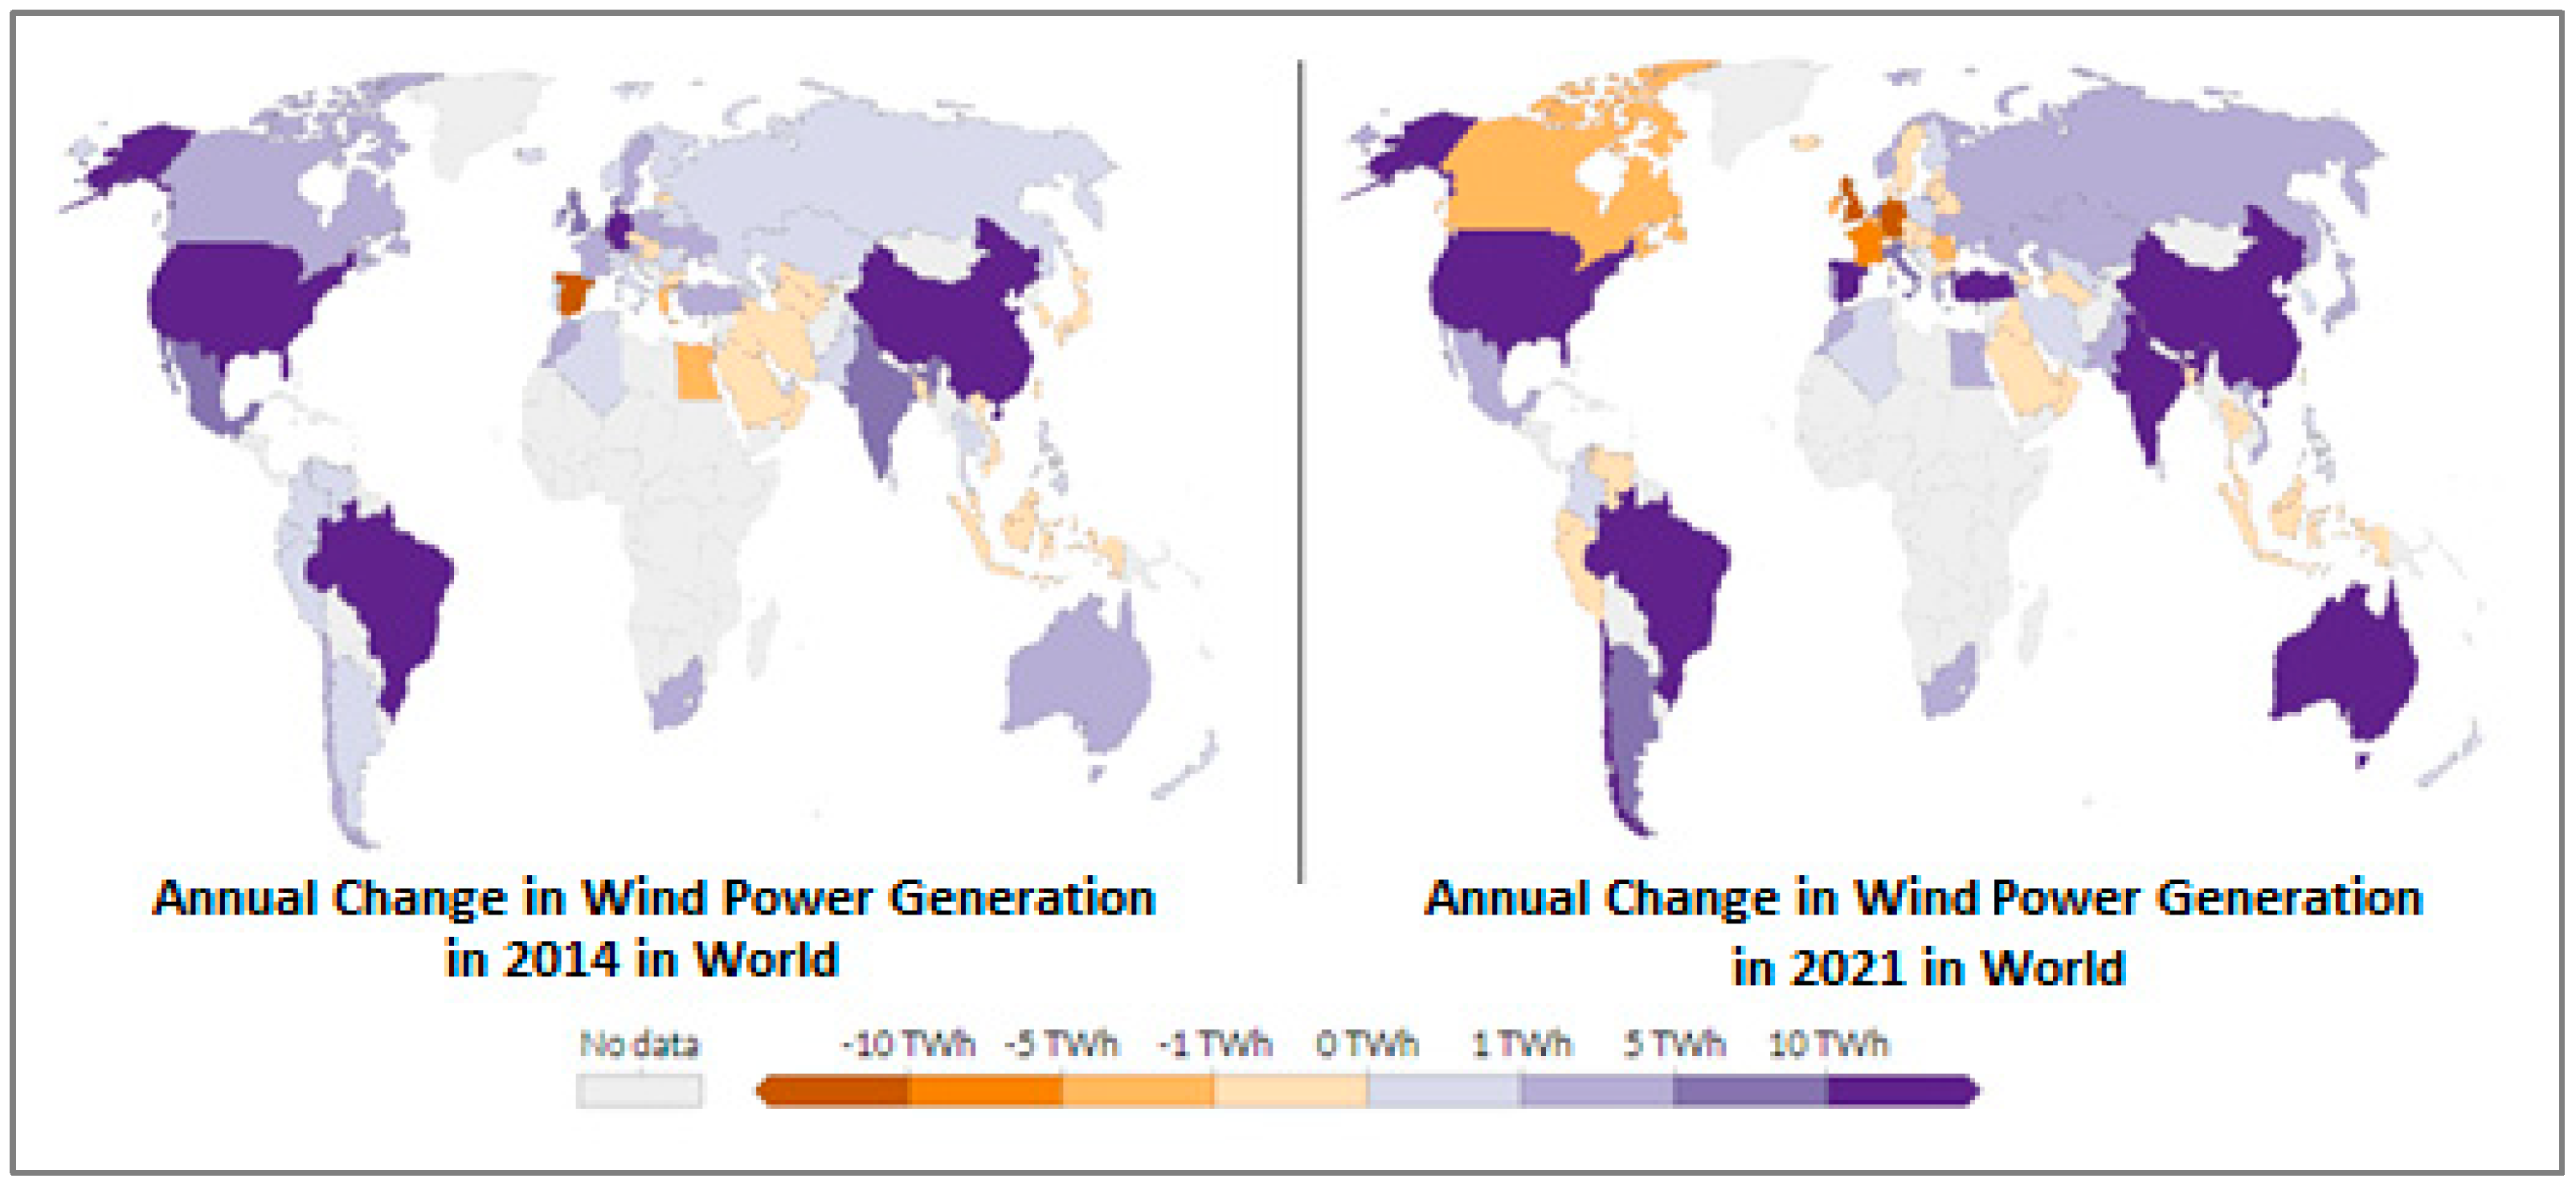
The annual percentage change in wind power generation is demonstrated in
Figure 15. The annual changing status of wind generation in comparison to the previous years is delivered in this figure. China, India, US, Brazil, and UK are the main contributors to the generation of wind power, whereas Sweden’s contribution is adverse, so they cannot achieve the generating demand and are instead lagging behind [
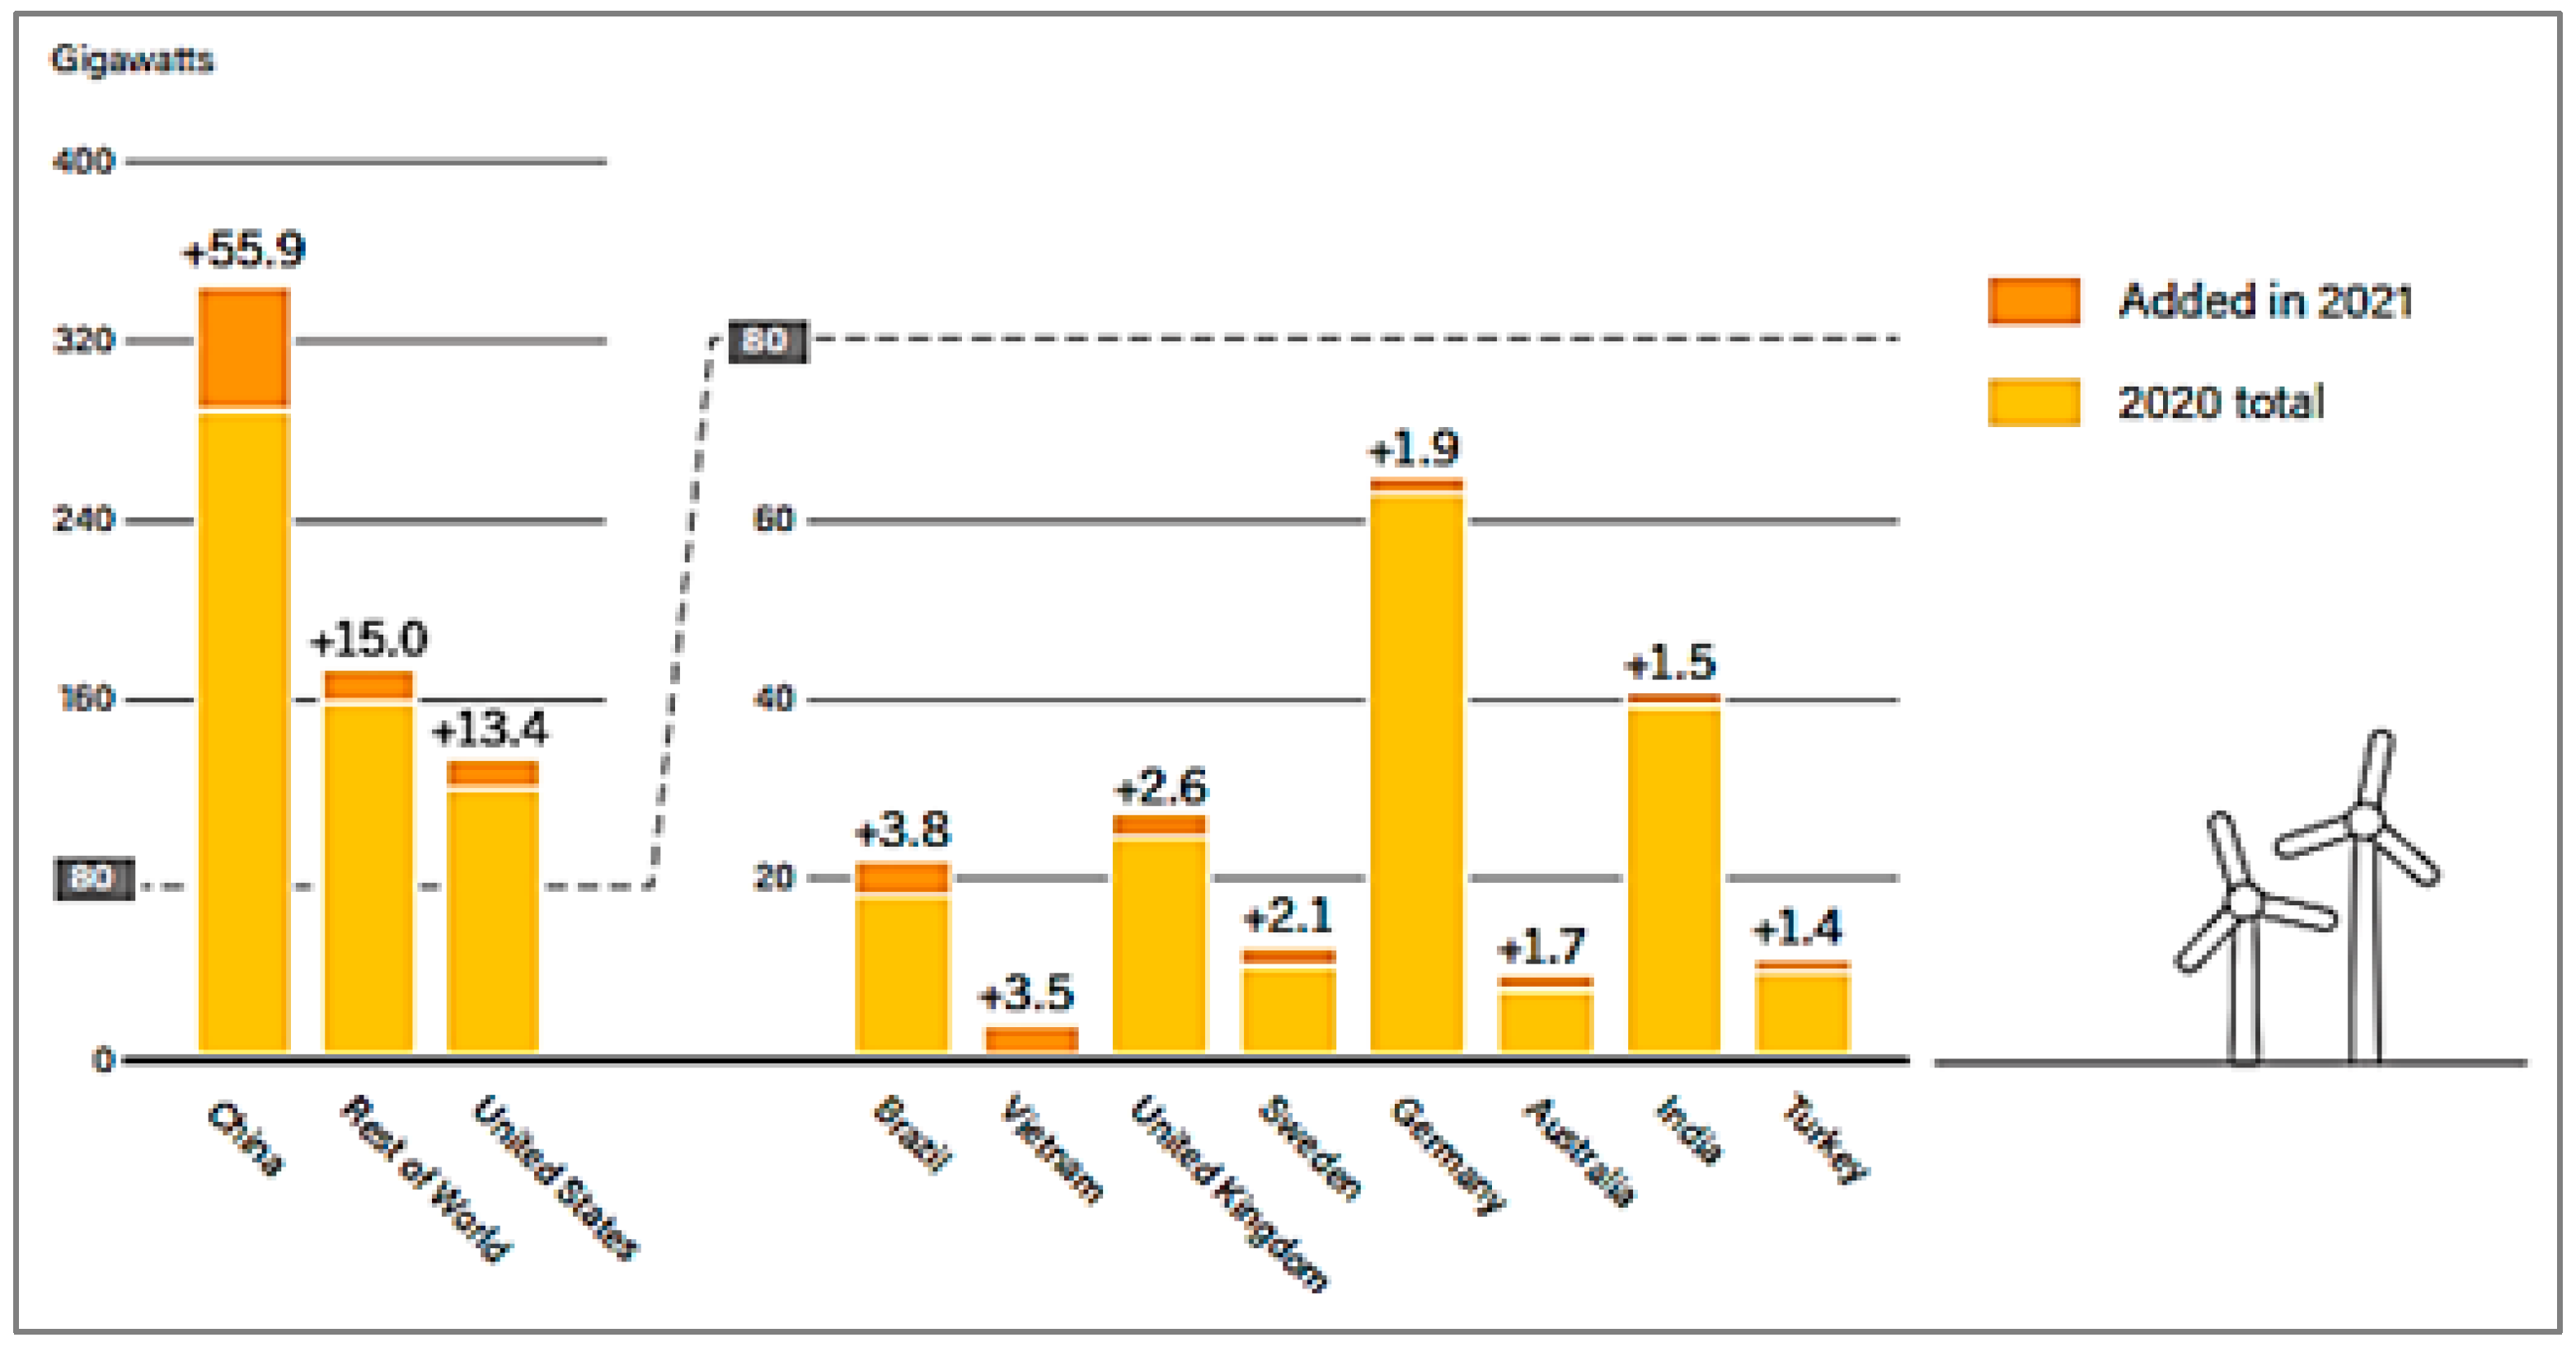
37]. From the last consecutive 13th year, the prime regional market of wind power was in Asia. China added 55.9 GW of wind power capacity in 2021 from the previous year, whereas the rest of the world only added 15 GW of wind power capacity in 2020 (shown in
Figure 16).
Figure 17 demonstrates the annual modification in wind power generation between 2014 and 2021 [
37]. A massive change in the capacity addition of wind power throughout the globe can be noticed.
4.3. Global Solar Power Scenario
Solar energy has been used worldwide to generate electricity, purifywater, or for heating purposes. Solar photovoltaics was invented in 1954 in the United States. They convert direct sunlight into electricity. Presently, they are the fastest-growing renewable technology and are prepared to take a key role in the future comprehensive electricity market. Solar PV materials can be installed to provide configuration for small-scale projects, personal use, mini-grids, or commercial use. This initiative can also help people who cannot easilyaccess power transmission lines. Solar panels have become costeffective in the last few decades, which makes them affordable for the consumer to use and the cheapest form of electricity [
37].
The stature of solar power generation by region from 1965 to 2021 is illustrated in
Figure 18 [
36,
37]. The growth in solar power generation was observed to be than 1 TWh in the year 1983 in North America. In 2005, South and Central America, North America, Europe, Asia Pacific, and Africa had a slight growth of around 4 TWh. An amount of 34 TWh generation was noted in 2010. In 2021, a jump of 1033 TWh of solar generation transformed the scenario of the global solar industry.
Figure 18,
Figure 19 and
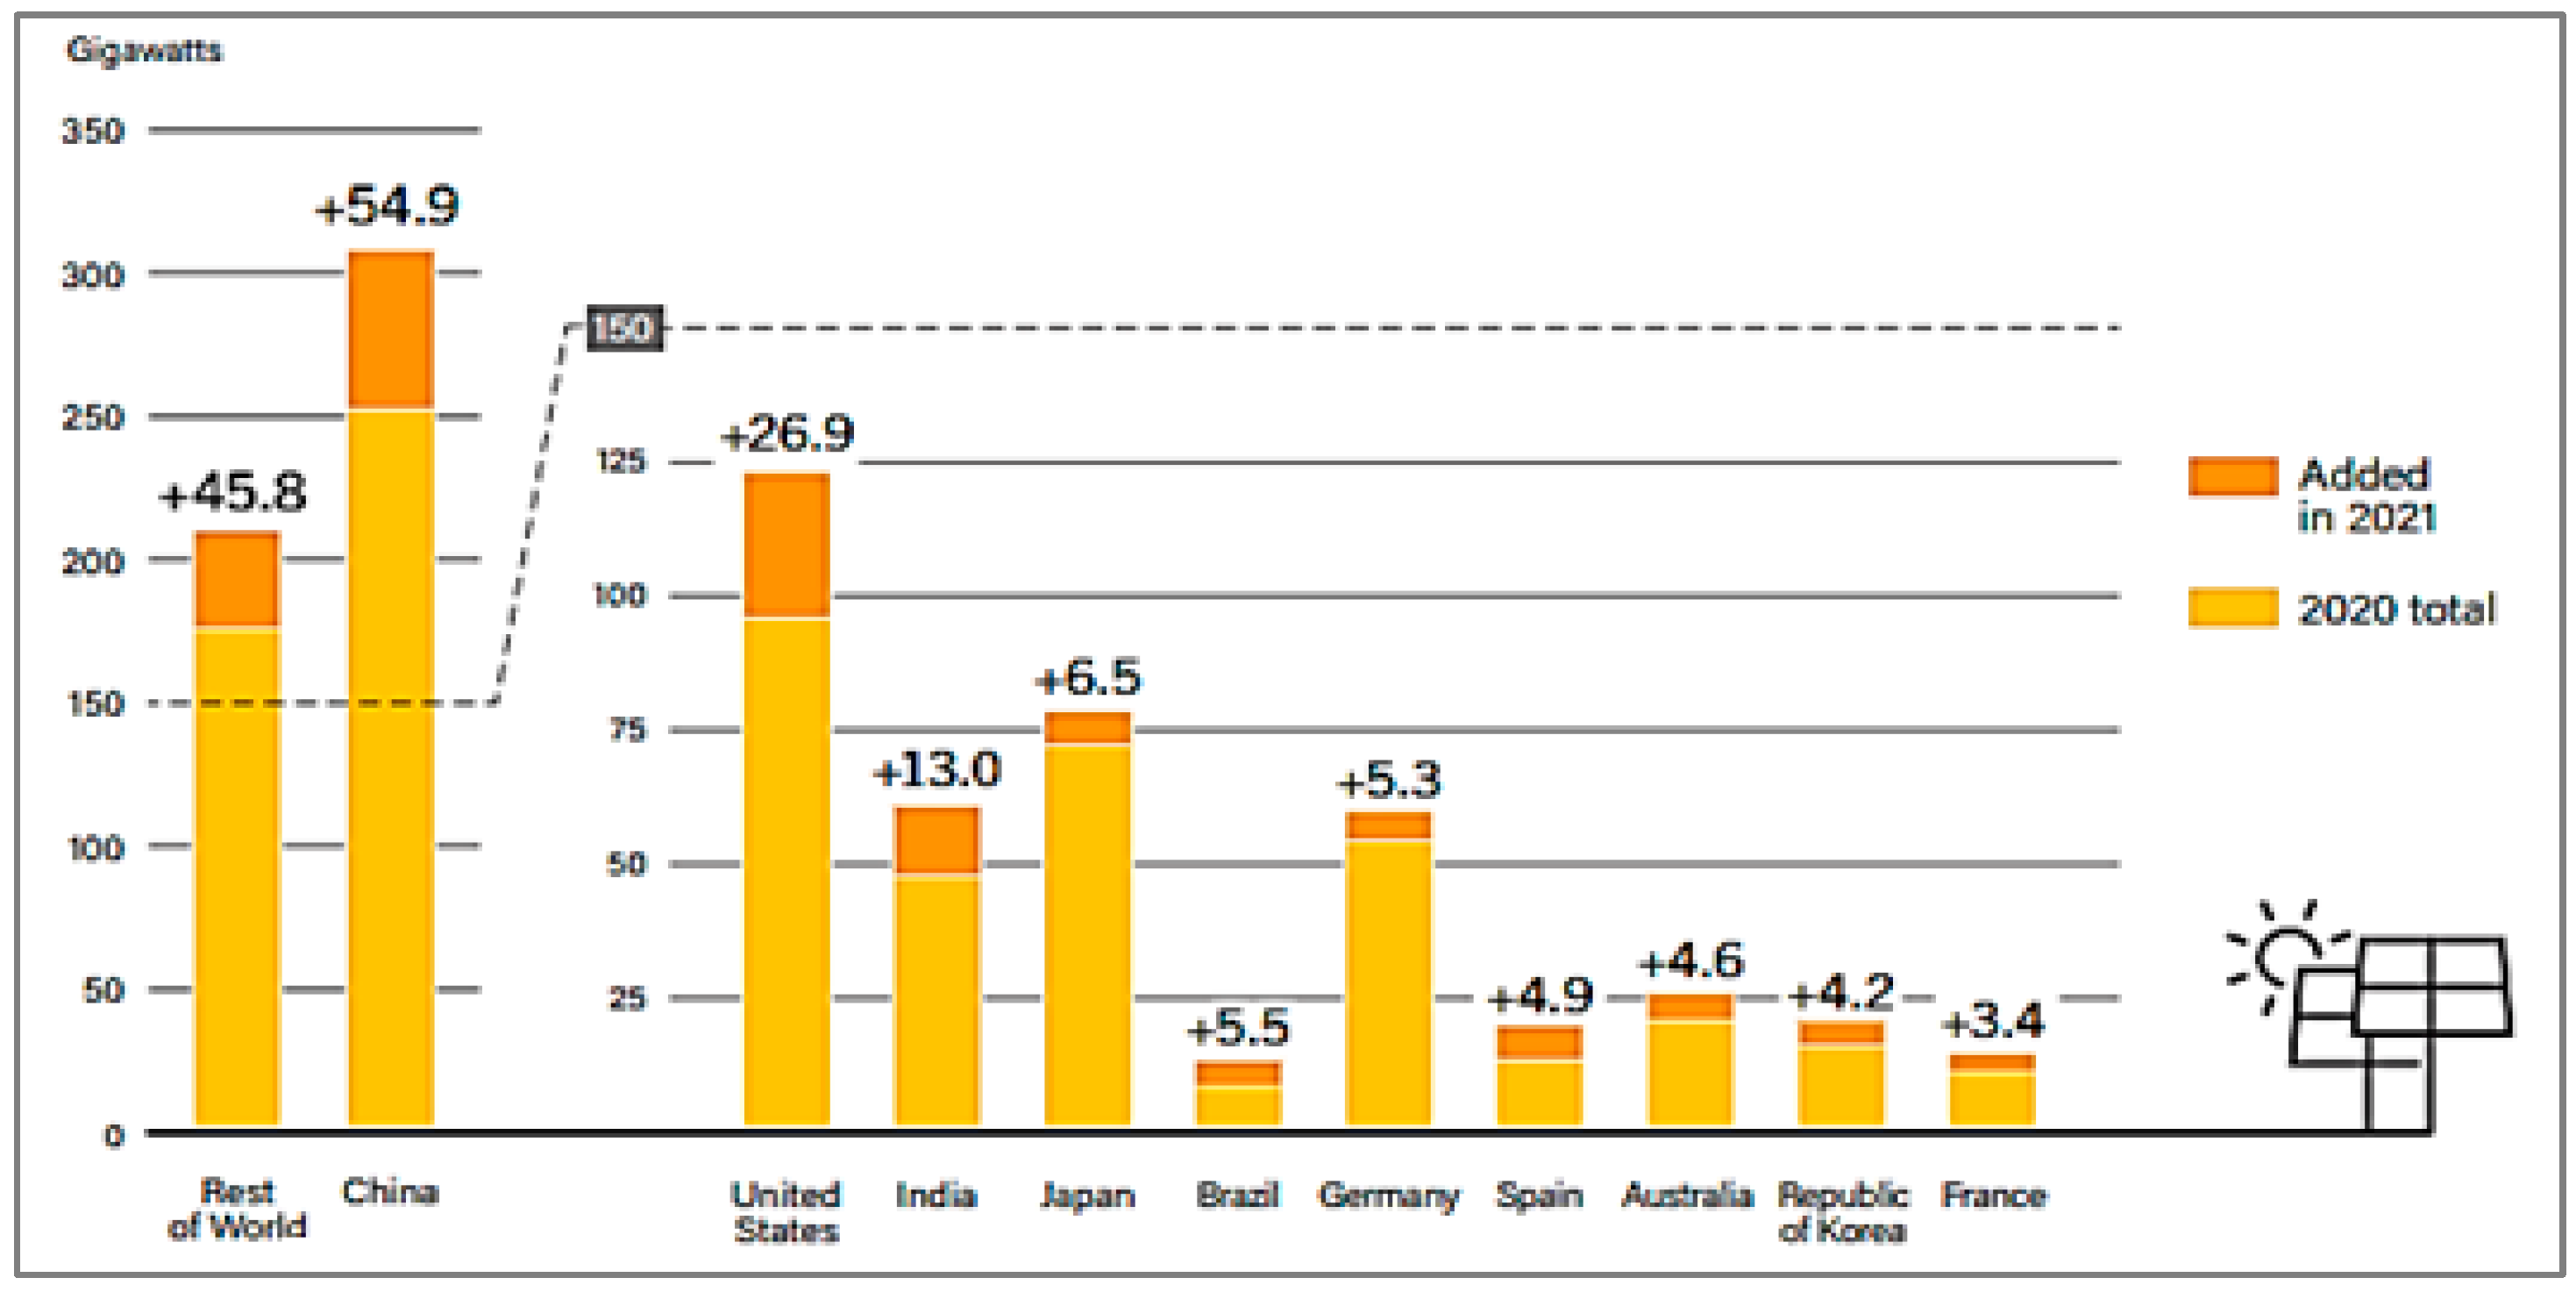
Figure 20 show the performance of the top countries, where the indication is clear regarding the performance reduction in 2021 (61%) compared to 2020 (66%). China, India, Japan, Brazil, and the United States together cover about 61% of recently installed solar power capacity. More players have entered the market in response to the falling operational and capital costs of solar PV materials. France, Germany, Spain, the Republic of Korea, and Australia were the next five countries in 2021. The annual performance of the top ten countries spiked from 3 GW in 2020 to 3.4 GW in 2021.
The top countries according to cumulative solar PV capacity are China, India, United States, Germany, and Japan, whereas Australia, Germany, and the Netherlands are the leading countries per capita capacity in solar power. These figures give a clear view of the solar power capacity; shares of the top ten countries and the rest of the world; annual percentage change in the solar power sector; and capacity and additions in the top ten countries for capacity addition around the globe [
36].
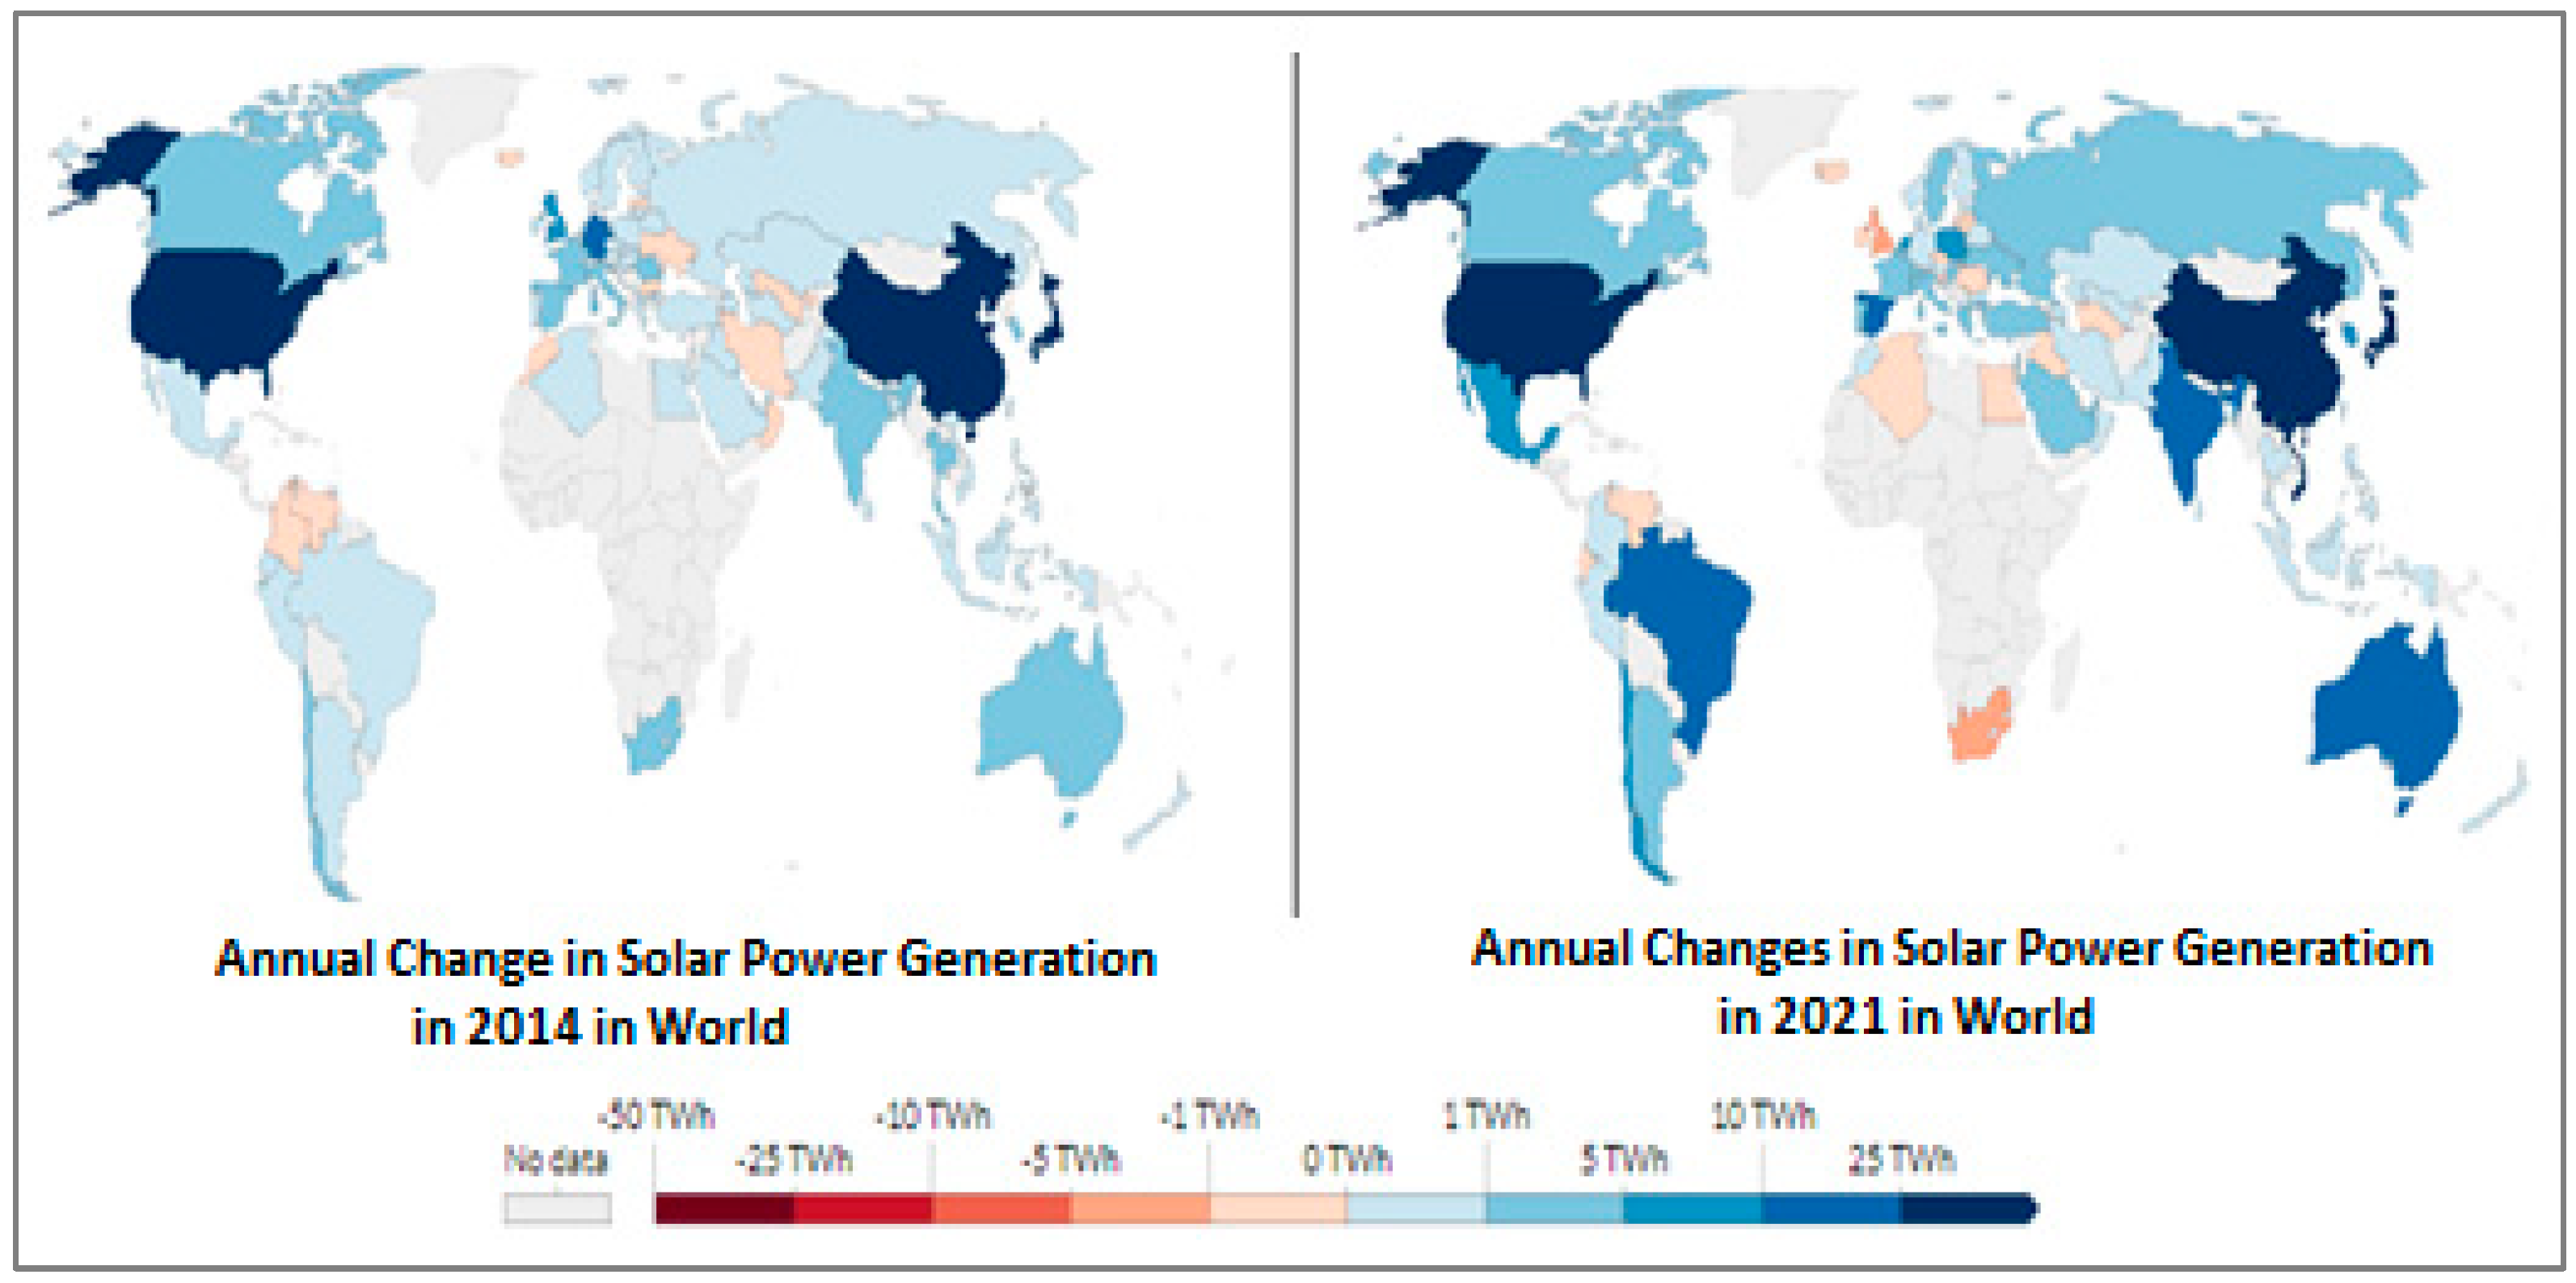
Figure 21 illustrates the annual change in solar power generation in 2014 and 2021 [
37]. The figure shows the vast changes in the addition of solar power. It can be concluded that there has been a huge change in the capacity addition of solar power throughout the globe. Solar energy is limitless. It is a clean source of energy. Its maintenance costs are very minimal as solar panels last for 20–25 years. The technology in this industry is advancing very drastically. As such, power producers can easily attract the installation of new solar power plants.
5. Renewable Power Scenario in India
Energy generation capacity is one of the main elements for the growth of a country’s economy. It is a huge challenge for a country such as India, where the population is about 1.46 billion as of 1 July 2022 [
38]. The urban population is considered to be the major consumer of electricity, and the government is expecting urban growth to contribute to 73% of the total population by 2036 [
39]. As conventional sources are expected to be exhausted shortly, the renewable sector needs to receive more attention. The Indian power sector has begun to set up innovative solutions. India is bounded by a coastline from three edges, which has good projections for harnessing offshore wind energy. India has been gifted with huge solar energy potential, which is being used for the installation of solar panels. According to the speech of the Hon’ble Prime Minister of India at the UN Conference on climate change (2015), the GoI has engaged in numerous initiatives to reduce emission levels by 33% to 35% from the year 2005 to 2030. It has similarly set up the target to generate around 40% of complete power from non-conventional sources by 2030. In India, the maximum utilization of energy per capita is in the northern region. All India region-wise energy and power scenarios are shown in
Table 6 and
Table 7 for July 2021 and July 2022, respectively. As per the Ministry of Power figures, at the end of July 2021, the energy demand was 124,167 MU, while availability remained at 123,720 MU with a shortage rate of 0.4%.
At the end of July 2022, the energy demand increased by 128,237 MU, whereas 127,841 MU was available with a shortage rate of 0.3% [
40,
41]. As per the statistics, it can be determined that there is more or less ascarcity of power in the Indian power sector. Considering this status, many renewable energy projects have been introduced by the GoIto reduce the power deficit rate. Similar to the energy scenarios, power also experiences the same scenario in India. At the end of July 2021, the peak power demand was 203,014 MW, while peak power availability was 200,539 MW with a deficit rate of 1.2%. At the end of July 2022, the peak power demand increased to 200539 MW, while availability was 190,386 MW with a shortage rate of 0.6%.
Indian resource-wise, region-wise, and sector-wise power scenarios are shown in
Table 8 and
Table 9. India has one of the largest power sectors according to number of consumers and geographical area. The overall installed power capacity in India is 404,132.95 MW (as of 31 July 2022).The central government power sector has installed 99,004.93 MW, the state government power sector has installed 104,969.33 MW, and the private power sector has installed 200,158.70 MW [
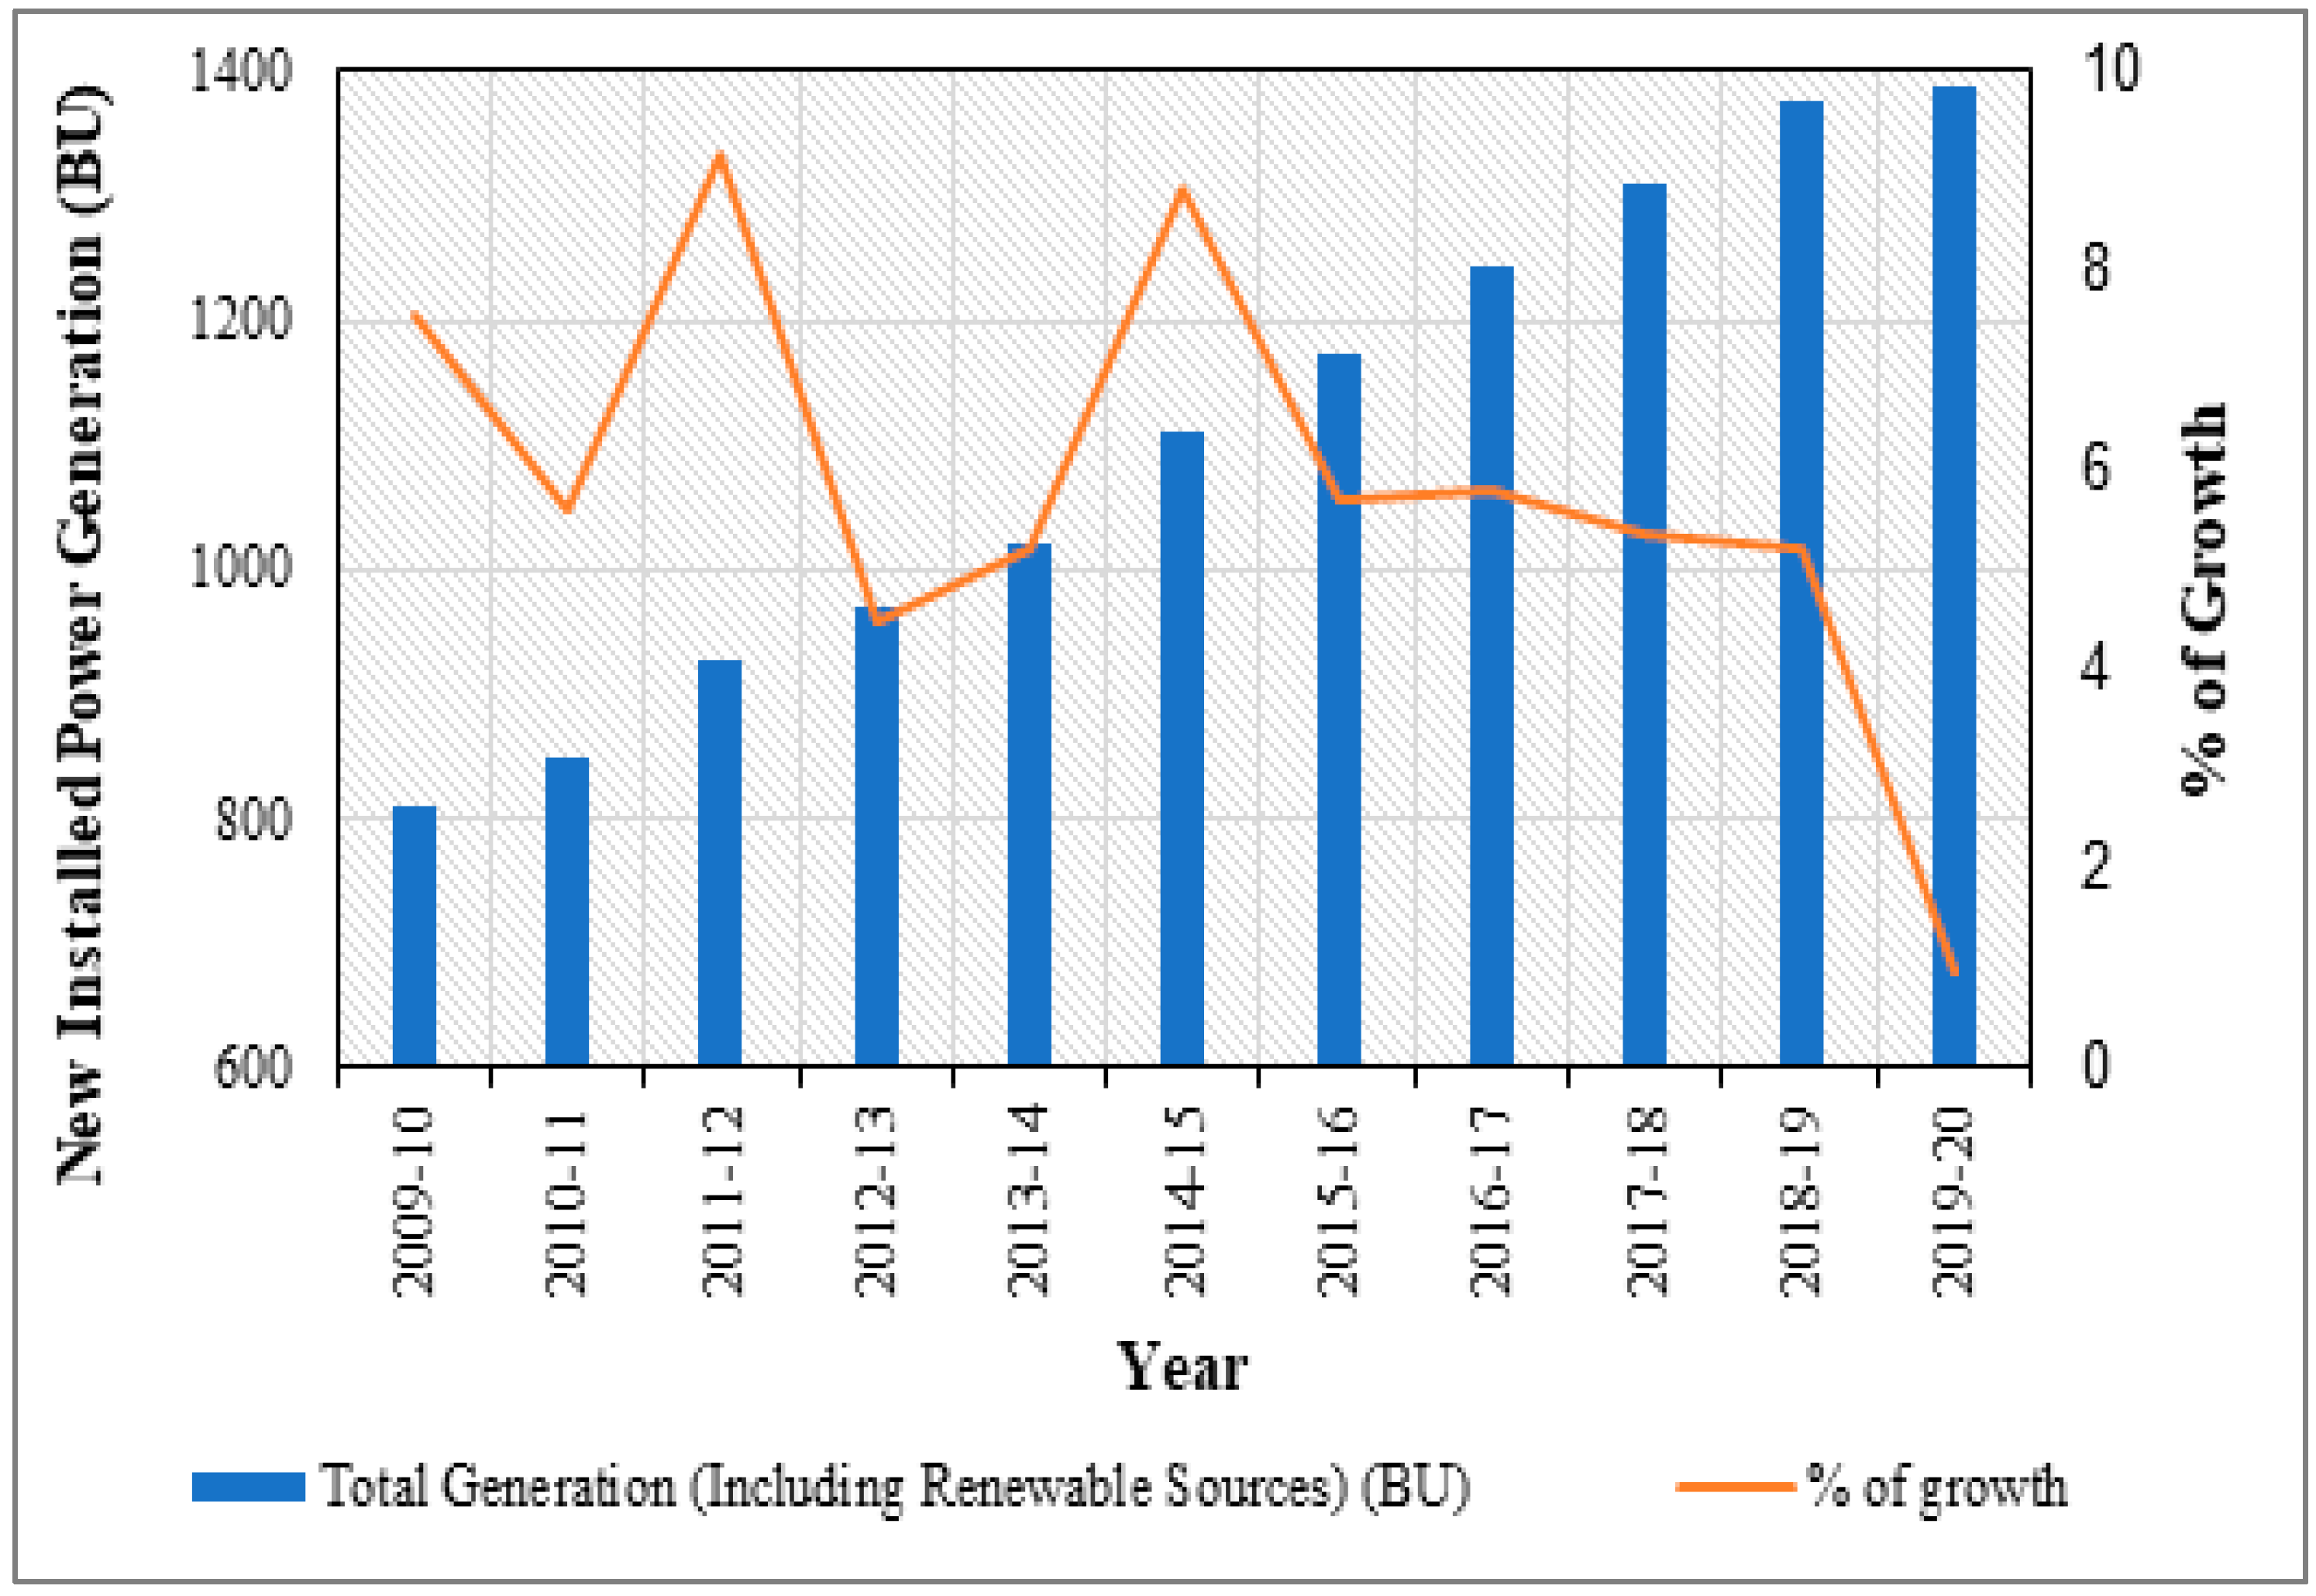
41]. A huge quota of total installed power capacity is fulfilled by the private sector. The central sector generates 24%, the state sector generates 26%, and maximum power is generated by the private sector at 50%. Overall power generation in the Indian power sector and its development is shown in
Figure 22 from 2009 to 2020. As the power demand is increasing continuously, this enlargement has triggered economic development. India is rising as a developing country, and its frequency of power consumption is drastically growing in every area. To satisfy demand, generation is increasing progressively. The percentage of growth differs every year as per the sources. The government of India takes numerous initiatives to move toward renewable power plants quickly to keep the system stable and enhance grid security due to massive power shortages in the Indian power sector. For hydropower plant investors, the state government offers subsidies and make the NOC process considerably easier. The scheme-wise physical growth in power generation in 2020–2021and the cumulative status up to June 2020 are shown in
Table 10 [
42]. Nowadays, people are aware of the importance of renewable power, and they want to shift toward it to reap the benefitsof this kind of power.
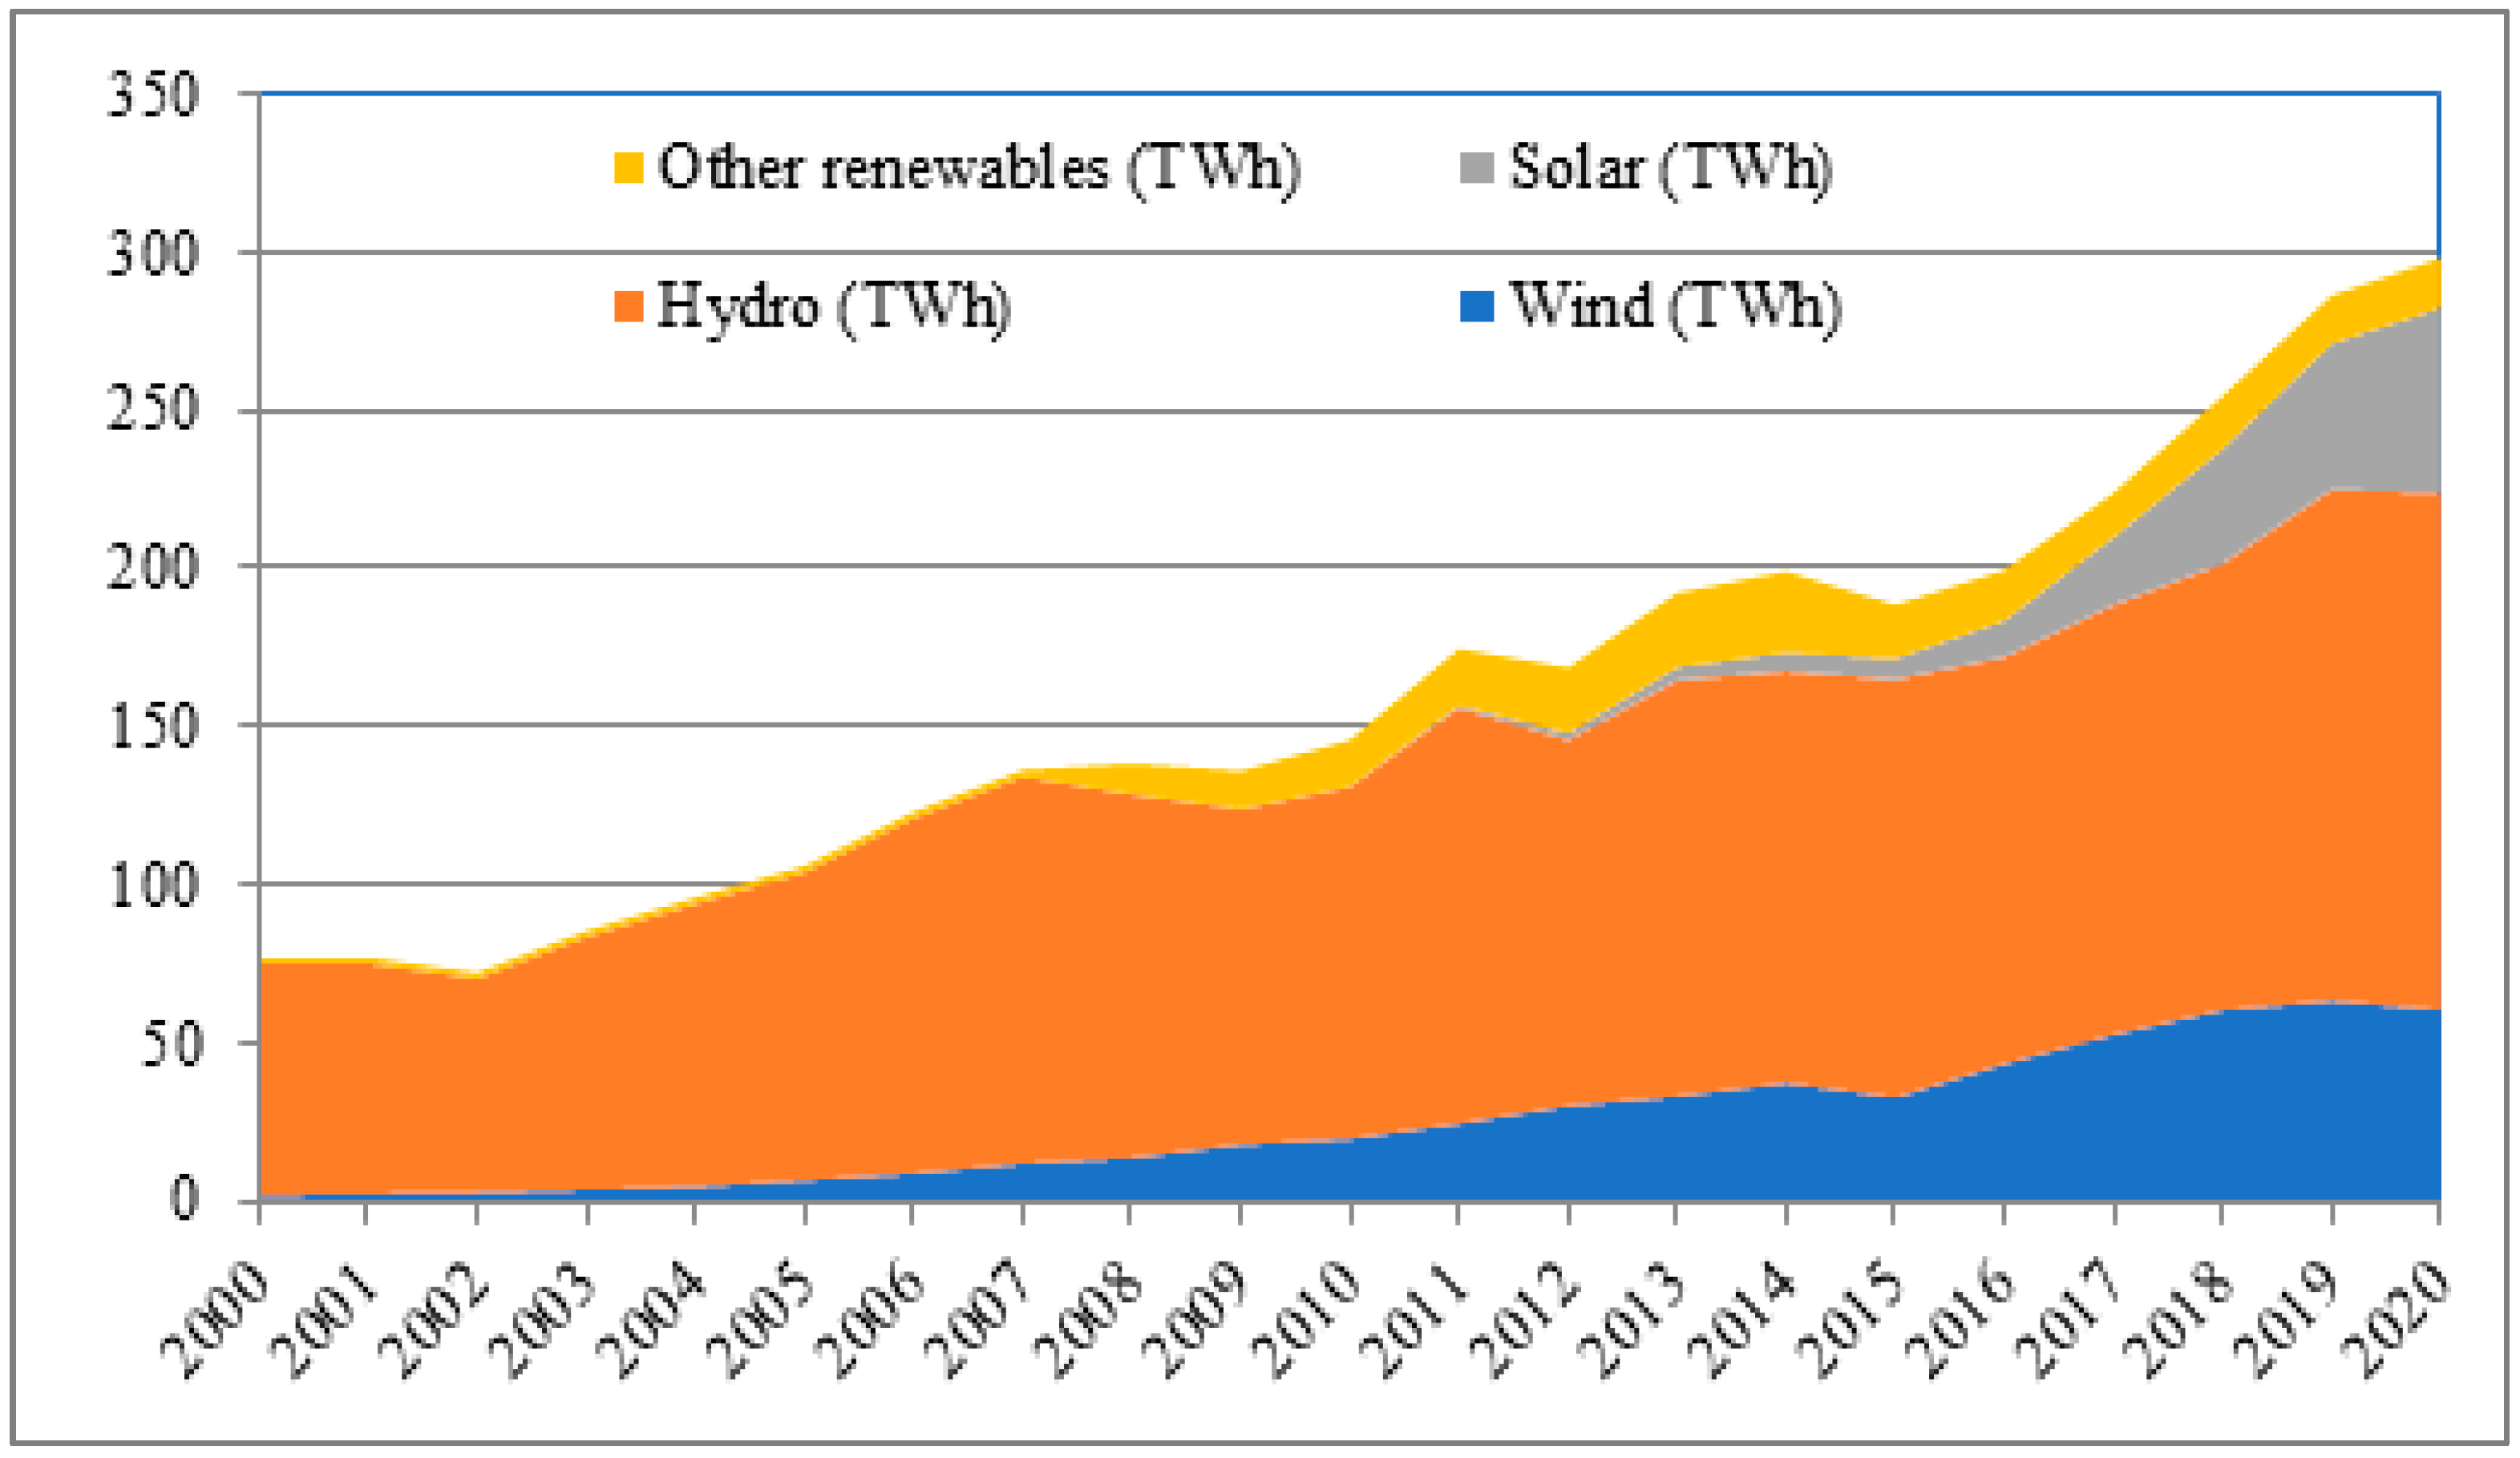
The modern renewable-energy-generation scenario by sources in India is shown in
Figure 23. Hydro, solar, and wind are the leading renewable energy sources that make India a renewable-commanding country. These statistics illustrate simply the increase in renewable generation year by year.
Information regarding the power supply position in India for different regions is deliberated in the presented statistics. In 2020–2021, the southern region faced a huge energy deficit, while the total Indian power sector gained some surplus. This was possible due to the endless promotion activities conducted by the government of India regarding renewable energy usage.
5.1. Hydropower Scenario in India
Depending on size, hydropower plants are mainly classified into two types, i.e., small hydro and large hydro plants. Every country has a different capacity range for the classification of a hydropower plant. In India, a capacity of 25 MW or below is considered for small hydro plants, which is further classified into micro, mini, and small hydro plants. The range of capacity in micro hydropower plants is between 100 kW or below; mini hydropower plants are between 101 kW to 2 MW; and small hydropower plants are between 2–25 MW [
43]. In the beginning, hydropower was looked after by the Ministry of Power with the support of the state electricity boards. India’s oldest hydropower plant was built in 1897 in Darjeeling with an installed capacity of 130 KW [
44]. The GoI is playing an active role in encouraging the development of small hydropower plants in a planned manner and increasing the quality and reliability of the projects. In India, the public sector has produced 92.5% of total hydropower. National Hydroelectric Power Corporation (NHPC), NTPC-Hydro, Northeast Electric Power Company (NEEPCO), THDC, and Satluj Jal Vidyut Nigam (SJVNL) are the leading public sector companies thatgenerate hydropower in India.
The details regarding the ongoing major hydropower plants in India are as follows [
45]:
Tehri Dam (three stages) with a capacity of 2400 MW is located in Uttarakhand and operated by THDC Limited, New Tehri, Uttarakhand, India.
Koyna Hydroelectric Project (four stages) with a capacity of 1960 MW is located inMaharastra and operated by MAHAGENCO, Maharashtra State Power Generation Co., Ltd., Mumbai, India.
Srisailam with a capacity of 1670 MW is located in Andhra Pradesh and operated by APGENCO, Vijayawada, India.
NathpaJhakri with a capacity of 1500 MW is located in Himachal Pradesh and operated by Satluj Jal Vidyut Nigam, Shimla, India.
Sardar Sarovar Dam with a capacity of 1450 MW is located in Gujarat and operated by Sardar Sarovar Narmada Nigam Ltd., Gandhinagar, India.
Bhakra Nangal Dam with a capacity of 1325 MW is located in Himachal Pradesh and operated by Bhakra Beas Management Board, Chandigadh, India.
Indira Sagar Dam with a capacity of 1000 MW is located in Madhya Pradesh and operated by Narmada Valley Development Authority, Bhopal, India.
Some of the other hydropower plants located in several states of India, with a minimum generation capacity of 500 MW, include Belimela Dam, Dehar (Pandoh) Power Project, KarchamWangtoo Hydroelectric Plant, Omkareshwar Dam, Purulia Pass Dam, Nagarjuna Sagar Dam, Ranjit Sagar Dam Salal I and II, Upper Indravati Dam, and Teesta Dam.
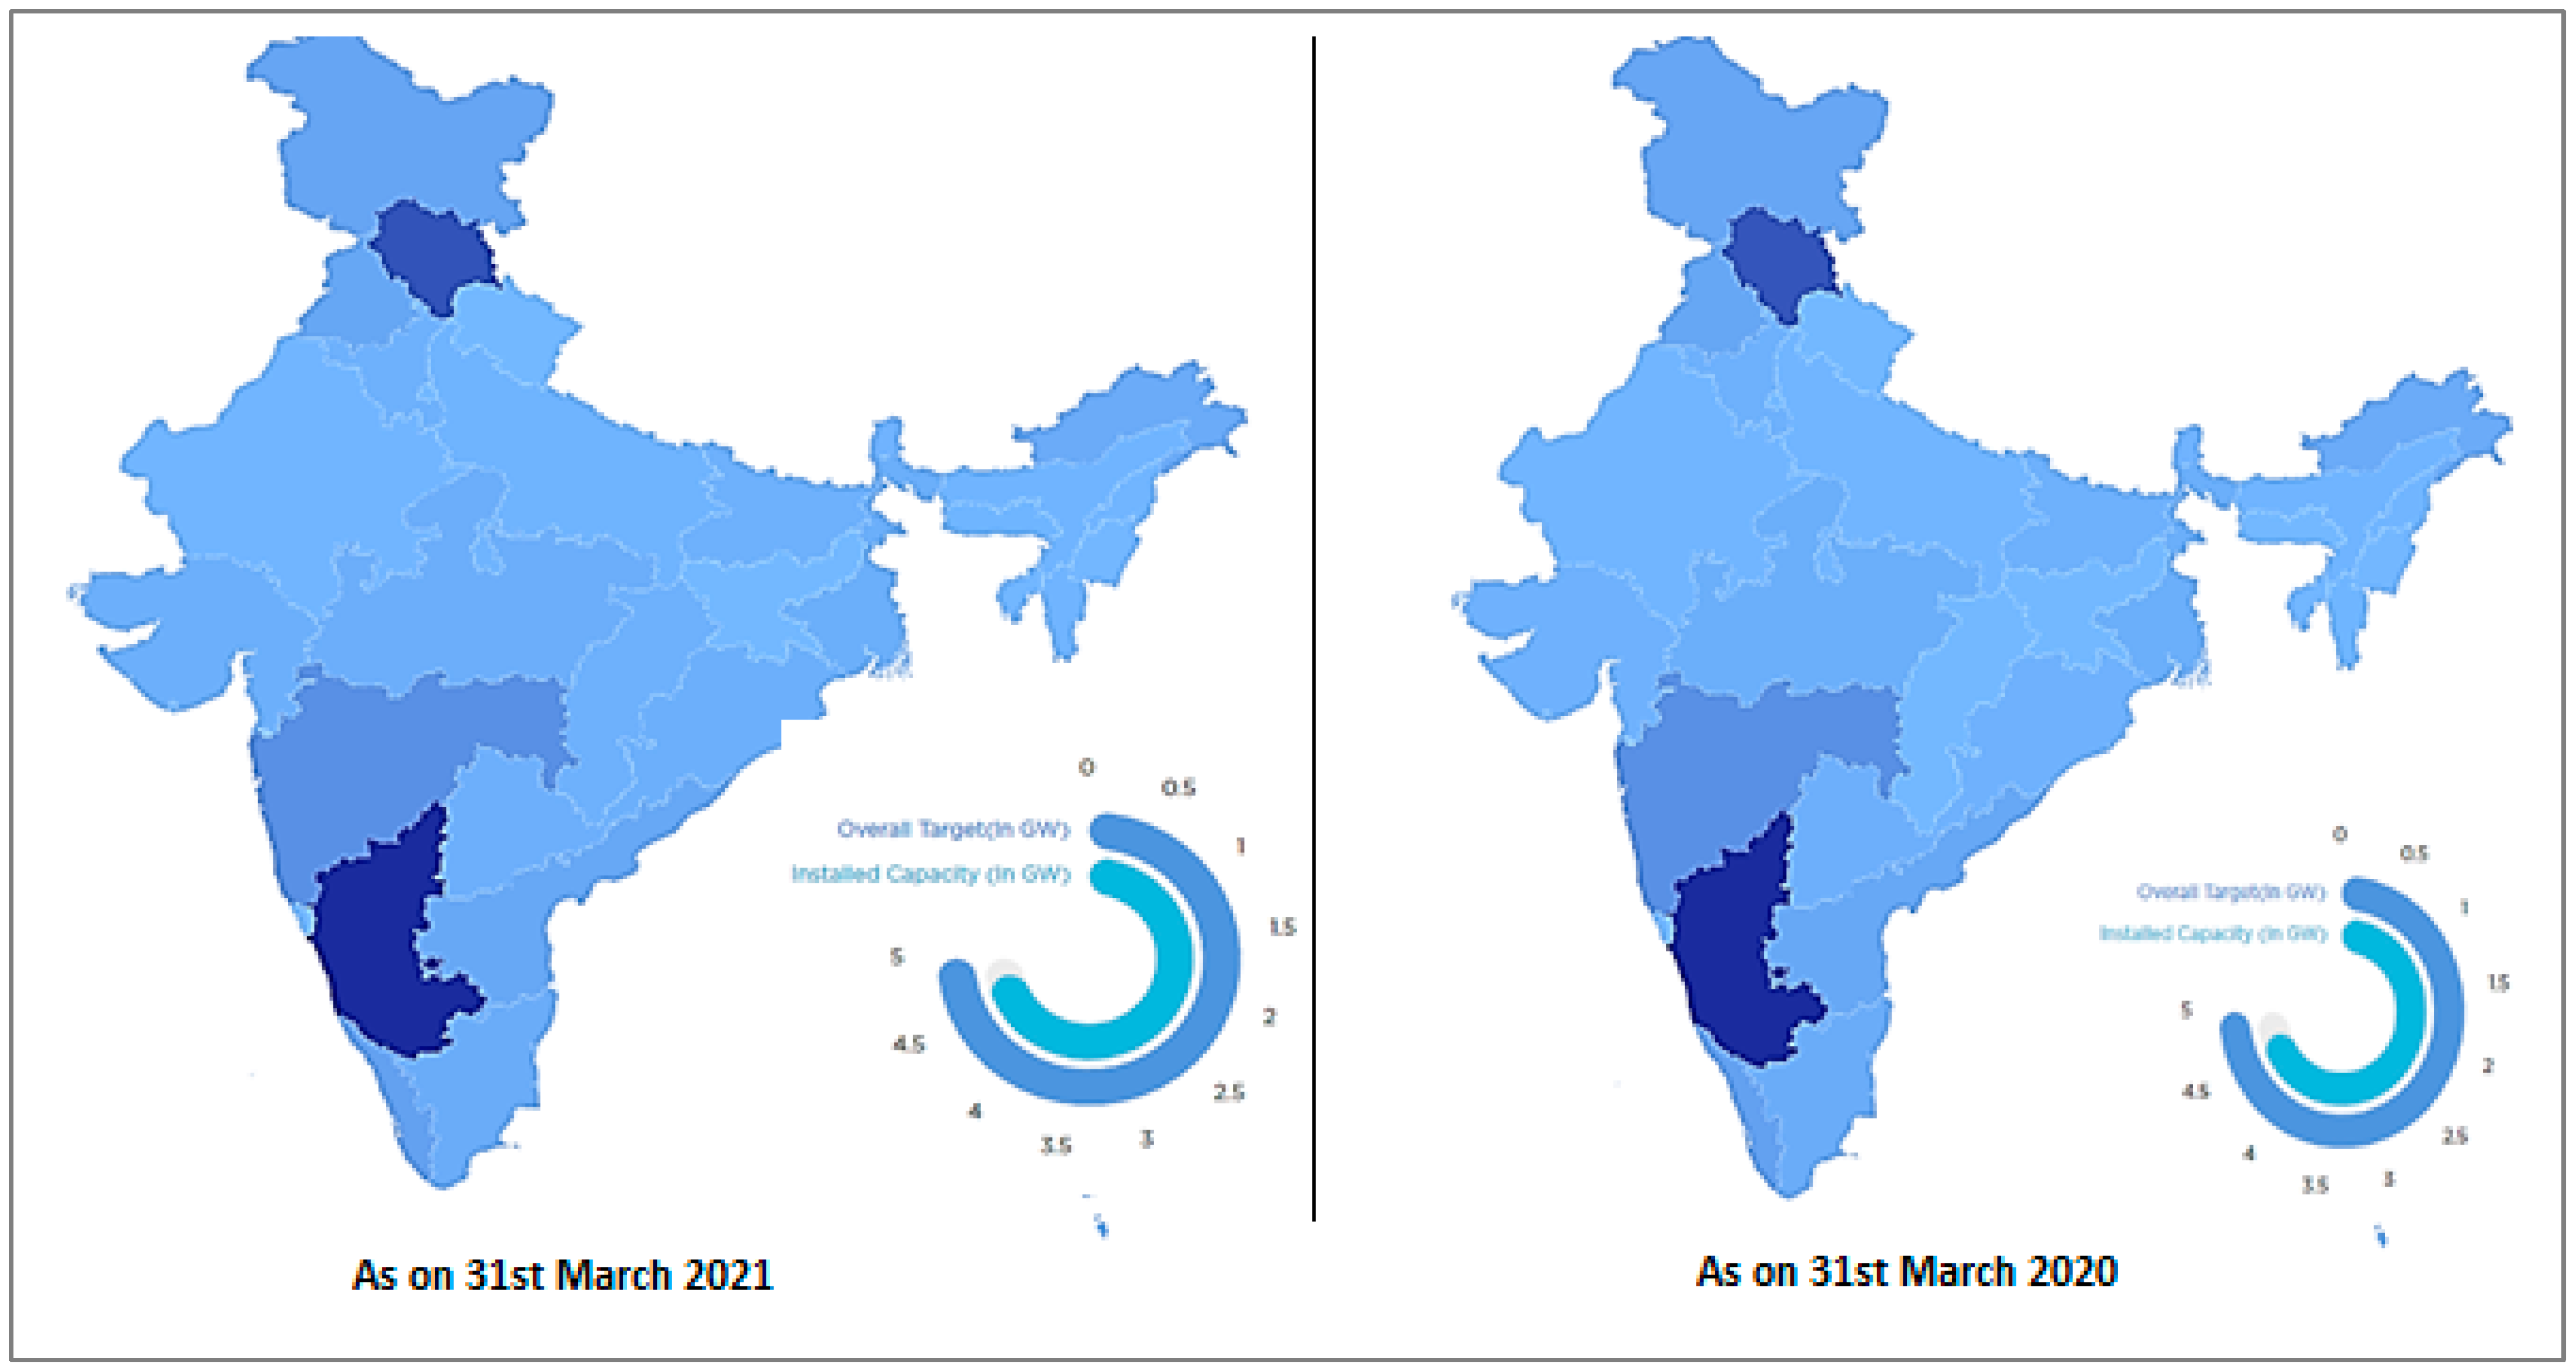
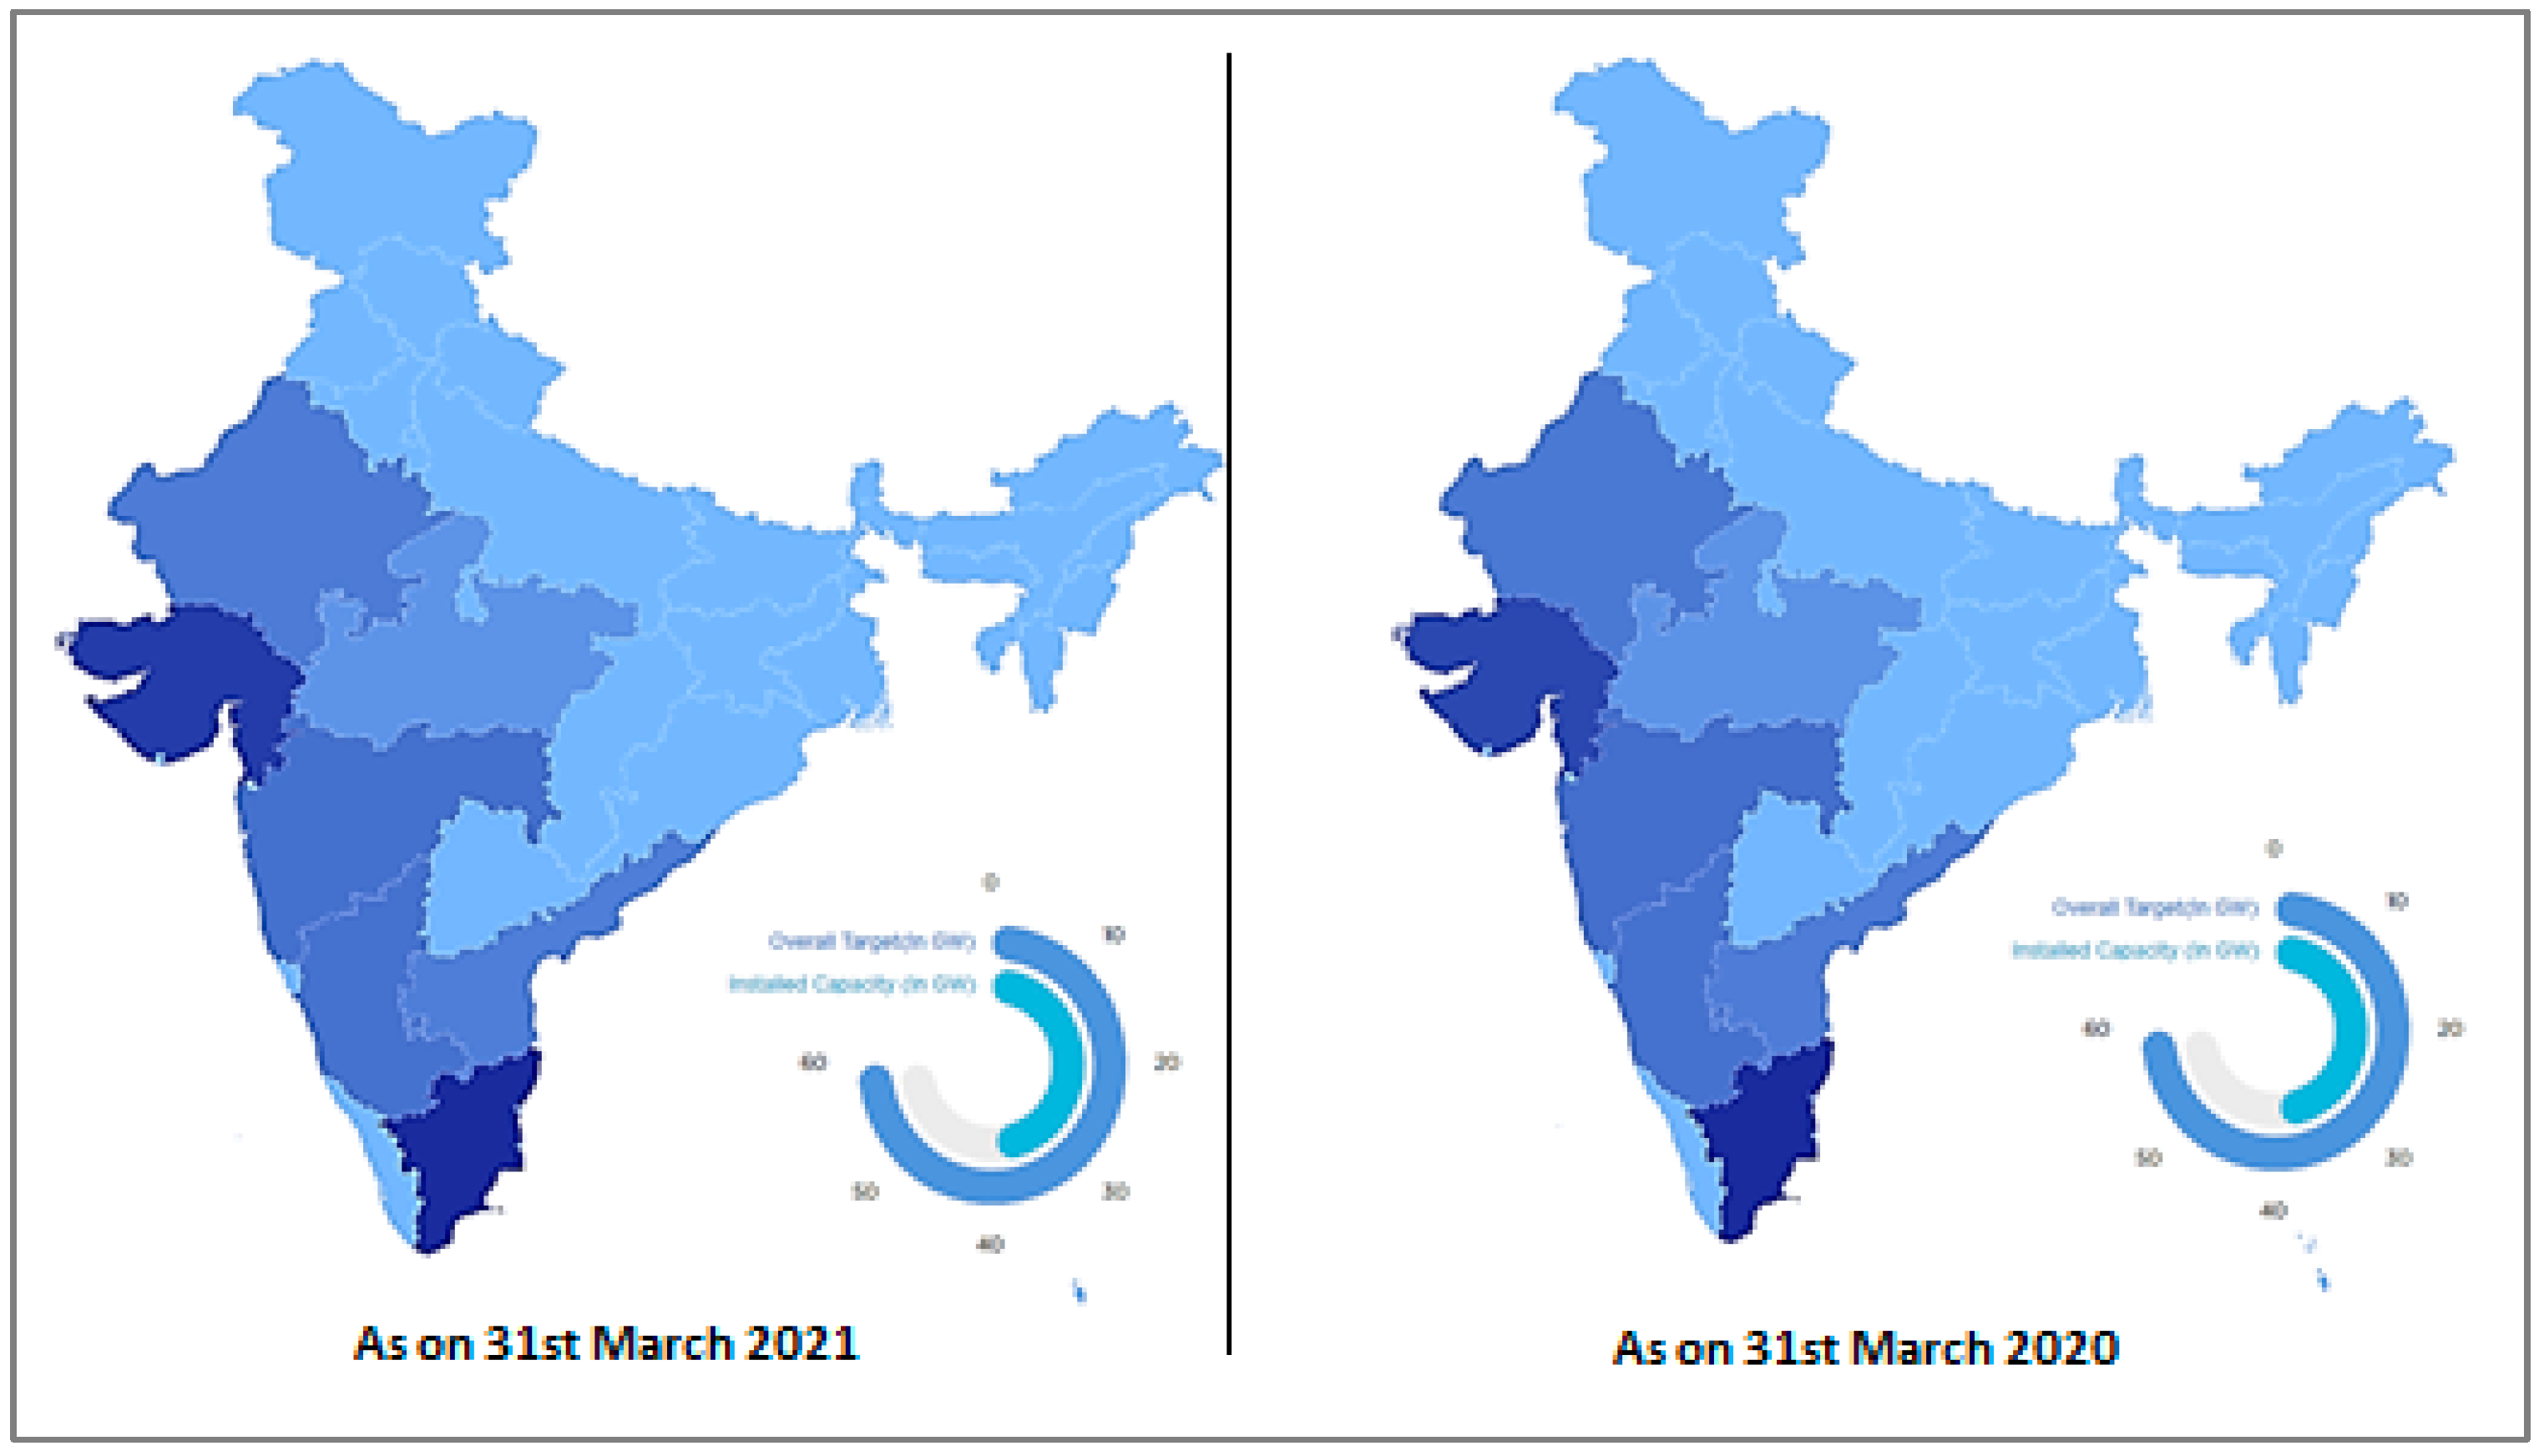
Figure 24 displays the overall target and installed capacity of hydropower in India in the years 2021 and 2020. The installed capacity was 4.8 GW in 2021 and 4.7 GW in 2020, and the overall target was 5 GW [
46]. From the figure, it can be seenthat the installed capacity of the hydropower plant increases year by year and is reaching the target.
5.2. Wind Power Scenario in India
Wind power is considered to be a site-specific and discontinuous type of energy resource. As such, a particular site needs to be selected where extensive wind resource assessment is possible. India has a coastal boundary on its three sides of around 7600 km, which is a great scenario for harnessing wind energy. The Indian wind energy sector has been showing consistent progress as it is led by wind-power-manufacturing industries. Increasing the number of wind power plants has led to a great ecosystem, development procedure abilities, and manufacturing. India is ranked 4th according to its wind installed capacity with a total installed capacity of 39.25 GW. In 2020–2021, India generated around 60.149 billion units [
47].
The government of India is also promoting wind power projects across the country. The private sector is also providing investment for various financial incentives to encourage customers. Some of the incentives introduced to encourage wind projects across the country [
48] are as follows:
A guideline has been introduced to permit distribution licensees to acquire wind power costeffectively.
To ease interstate wind power transmission and distribution, transmission charges and losses have been waived for solar and wind projects.
Proper site-specific identification and technical support are handled bythe National Institute of Wind Energy.
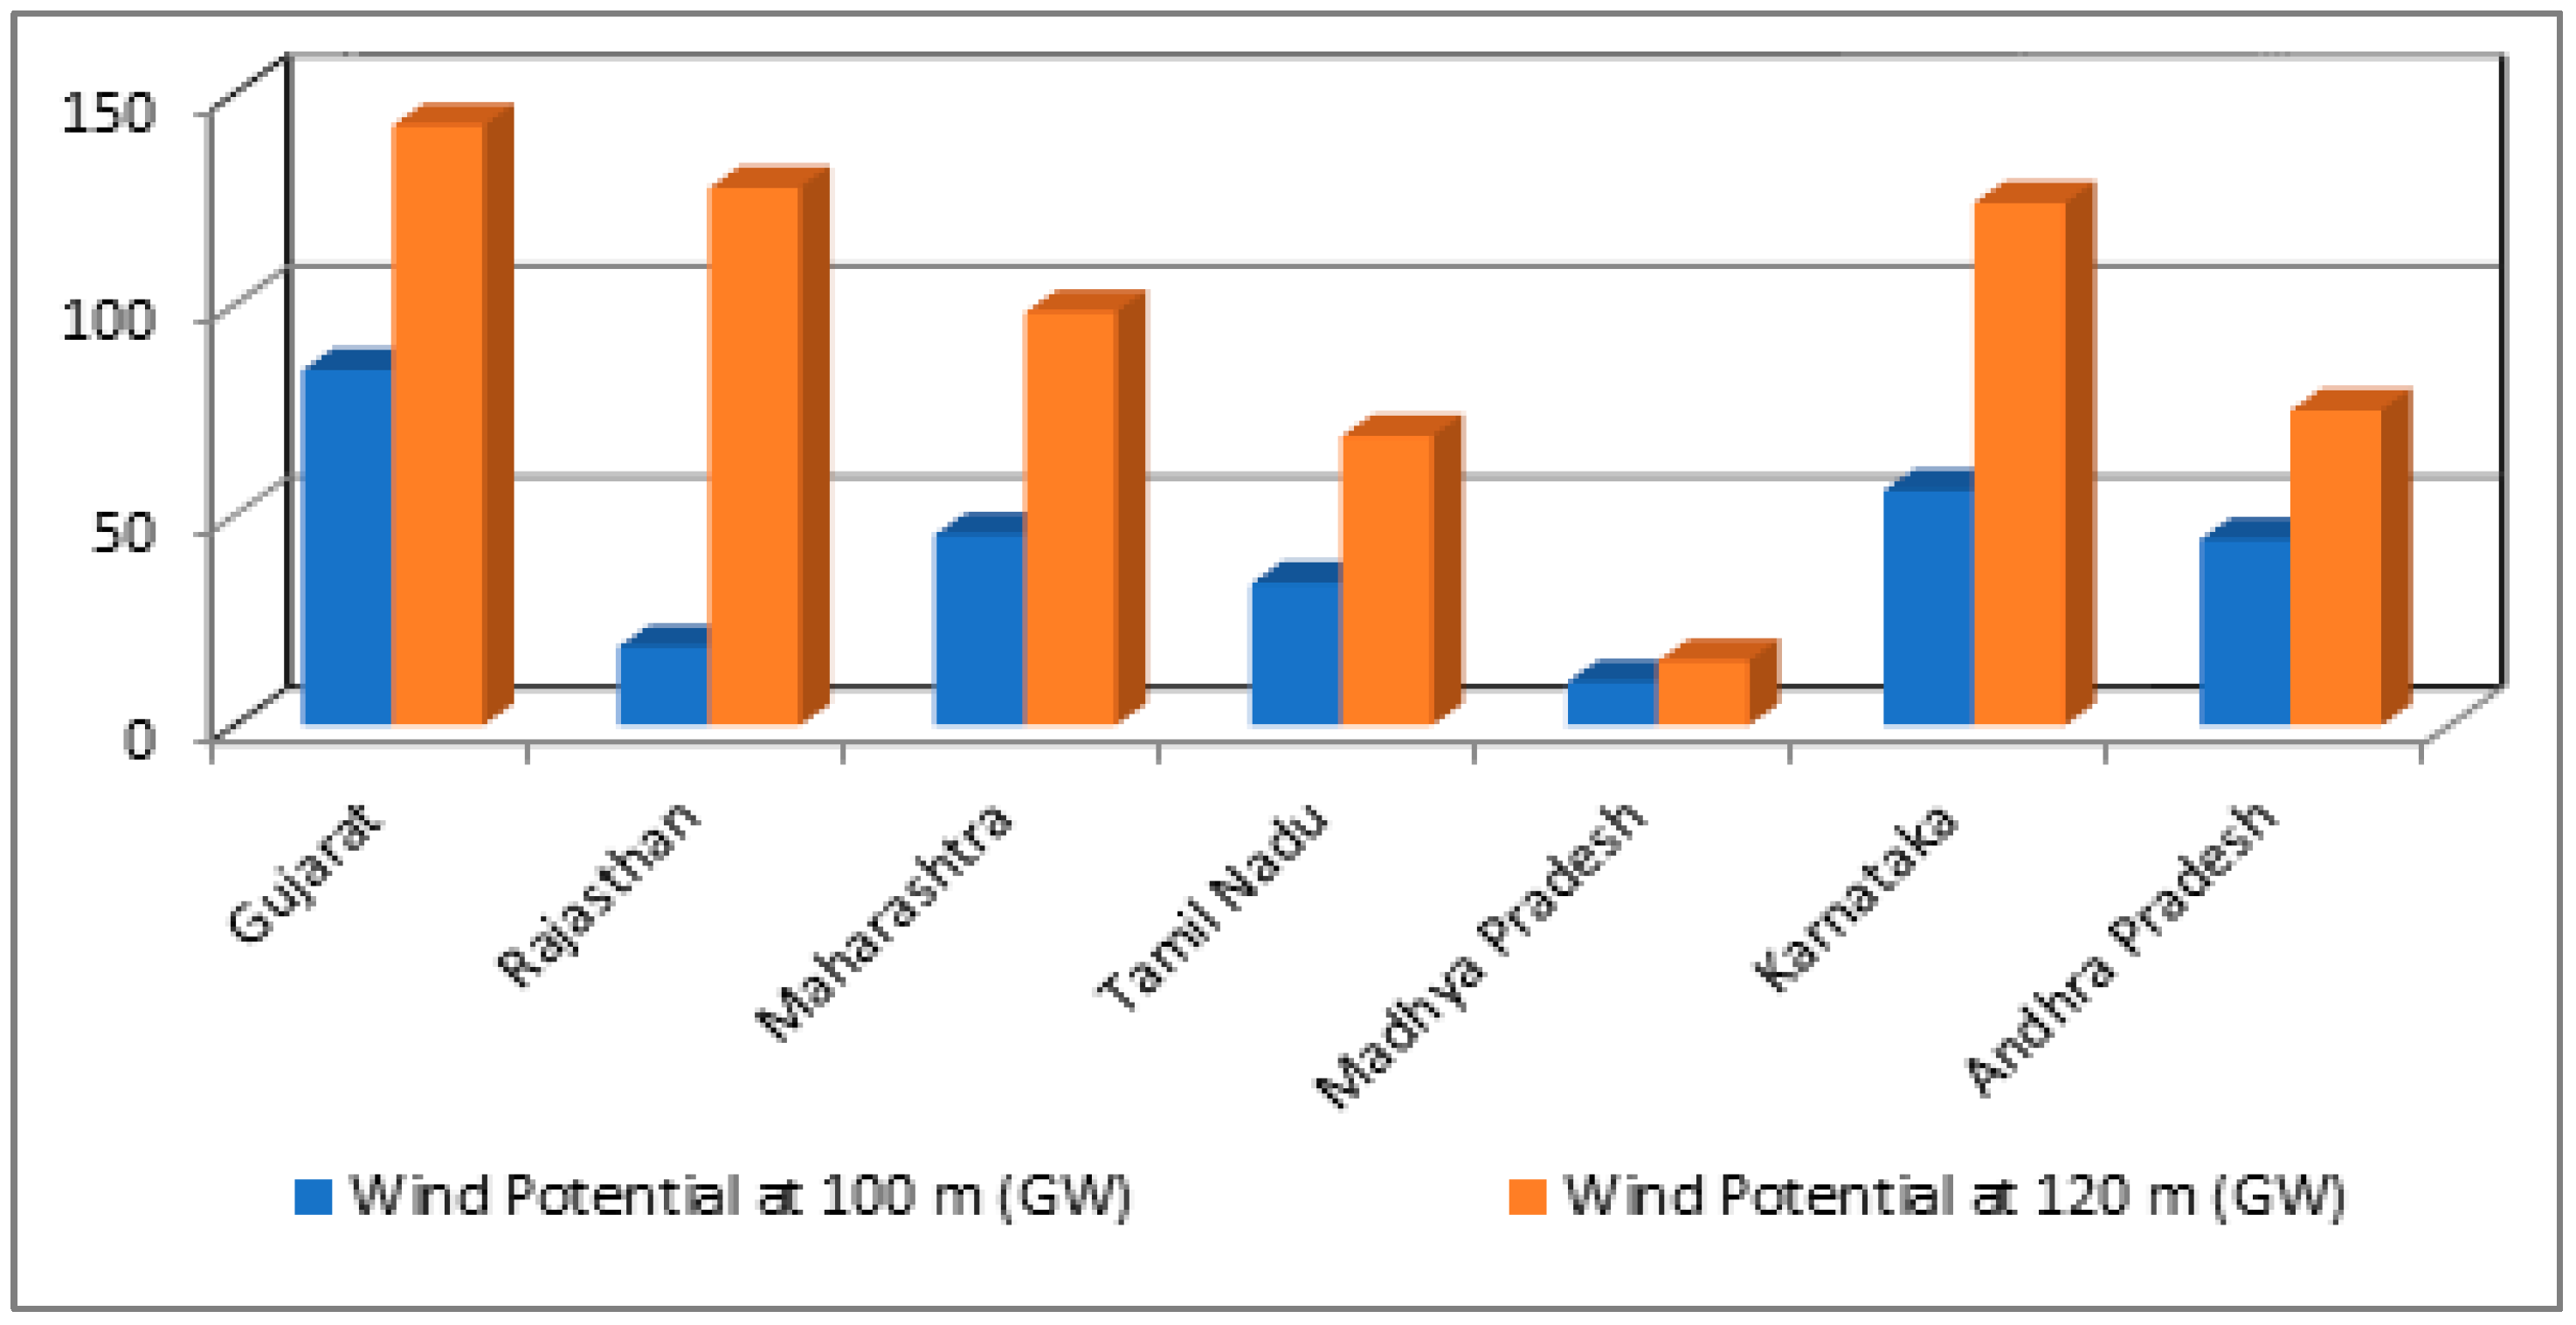
The wind potential for India’s top seven states at heights of 100 m and 120 m is displayed in
Figure 25. India’s first offshore wind power project with a capacity of 1 GW was planned in Gujarat to bring the localization of essential ecology and low-cost scaling for the offshore wind power sector. The details regarding some of the major wind power plants in India are as follows [
49]:
The Muppandal Wind Farm with a capacity of 1500 MW is located in Tamil Nadu.
The JaisalmerWind Park with a capacity of 1064 MW is located in Rajasthan.
The BrahmanvelWind Farm with a capacity of 528 MW is located in Maharashtra.
The Dhalgaon Wind Farm with a capacity of 278 MW is located in Maharashtra.
The VankusawadeWind Park with a capacity of 259 MW is located in Maharashtra.
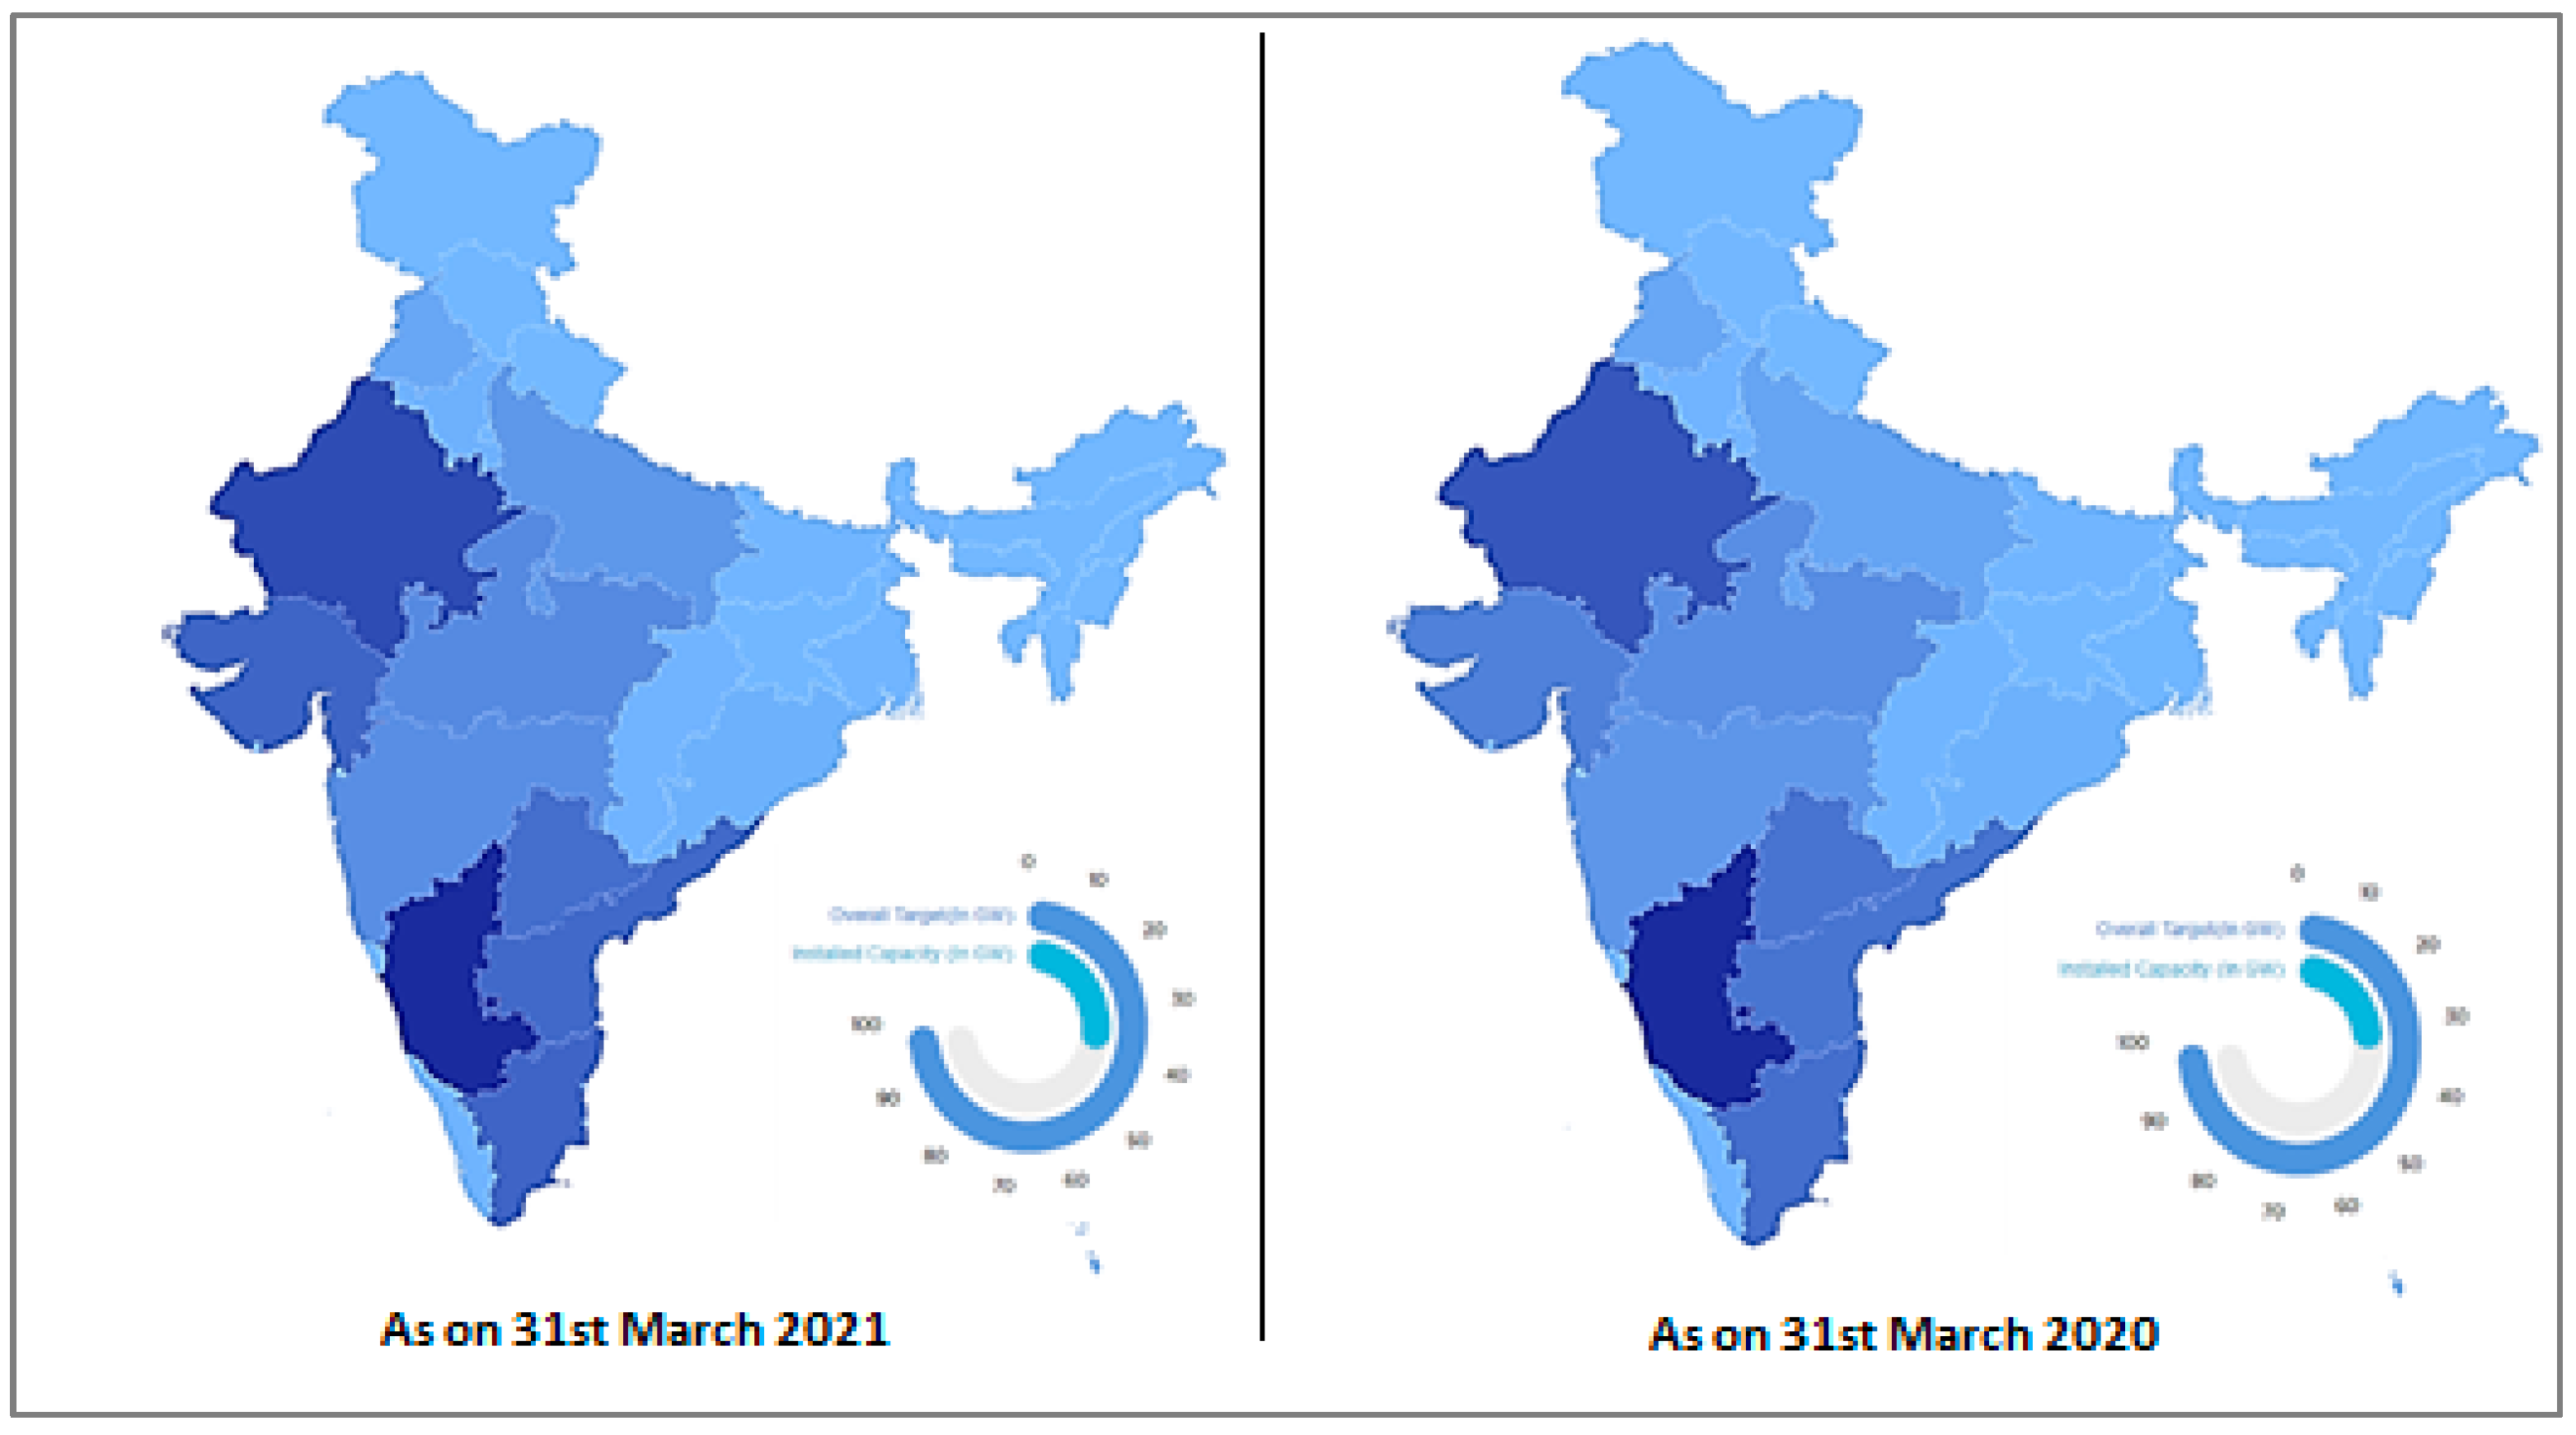
Figure 26 shows the overall target and installed capacity of wind power generation in India in 2021 and 2020. The installed capacity was 39.2 GW in 2021, whereas 37.7 GW found in 2020, and the overall target was 60 GW. The figure shows the improvement in the solar energy sector and display the trend toward reaching its goal.
5.3. Solar Power Scenario in India
Around five thousand trillion kWh per year of energy is directly sent across the country and major parts of it have achieved rates of 4–7 kWh per sq. m per day. Solar photovoltaics have a vast scope in India. It is chosen as the utmost secure source compared to others as it is richly available. Over the last few decades, solar energy has shown a visible rise that is evident in the Indian energy scenario. The distributed and decentralized applications based on solar energy have benefittedmany people in an eco-friendly manner. The solar energy sector in India has developed over the years and become a significant player in generating capacity in the grid-connected system. It has become a vital part that meets the energy needs of the nation, holds up the government schema of sustainable development, and plays an important role in energy safety.
The GoI has introduced several schemes to boost the generation of solar power. Solar rooftop schemes, bundling schemes, canal bank and canal top schemes, grid-connected system, defense schemes, VGF schemes, etc., are a few of them. India’s first commercial solar power plant was inaugurated in the year 2009 with a capacity of 2 MW in Amritsar [
50].
Figure 27 depicts the overall target and installed capacity of solar power generation in India for 2021 and 2020. The installed capacity was 40.1% of the overall target in 2021, whereas it was 34.6% in 2020.
India holds the fifth position globally in solar power deployment. In the past five years, solar power capacity has augmented by more than 11 times from 2.6 GW in 2014 to 30 GW in 2019 [
51]. India’s power sector is currently adopting mixed electricity sources, where the nation can achieve the biggest profit by releasingcarbon emissions. Some of the biggest public sector companies have also dived into a mix of energy source without supporting the nation’sconversion, which is hardhitting. The details regarding the ongoing major solar power plants in India are as follows [
52].
- ▪
Bhadla Solar Park (10,000 acres) with a capacity of 2245 MW is located in Rajasthan.
- ▪
Pavagada Solar Park, covering an area of 13,000 acres and with a capacity of 2050 MW, is located in Karnataka.
- ▪
Kurnool Ultra Mega Solar Park, covering an area of 5932 acres with a capacity of 10,000 MW, is located in Andhra Pradesh.
- ▪
NP Kunta Ultra Mega Solar Park, covering an area of 7924 acres with a capacity of 978 MW, is located in Andhra Pradesh.
- ▪
Rewa Ultra Mega Solar Plant, covering an area of 1590 acres with a capacity of 750 MW, is located in Madhya Pradesh.
6. Application of Renewable Sources in the Power Sector: Glimpses from the Review
In the recent past, several researchers have performed their work in the field of renewable energy sources and their application in the power sector. Ref. [
53] illustrated that the adaptation of huge renewable energy technologies needs vast transmission system extension. The authors compared two market models to observe social welfare while facing in wind variability. In a deregulated power market, it is very crucial to pay special attention to the expansion of renewable energy sources due to socio-economic and environmental issues of conventional sources. An ideal design for handling congestion in a competitive electricity market for both renewable and conventional sources was discussed in [
54]. Rong-Gang Cong [
55] identified and reviewed numerous important aspects influencing the progress of renewable energy generation in the present research. After a detailed investigation, an innovative optimization technique to use renewable energy resources optimally for generation purposes in the future was introduced.
The author of [
56] discussed the current scenario of electricity generation using clean technology with its unpredictable nature and the importance of storage devices in the electricity network. The joint operation of renewable sources and energy-storage devices, such as wind farms, solar photovoltaic materials, pump storage, and energy-storage devices, is deliberated on in terms of ancillary service and the energy market. The uncertain nature of solar photovoltaic materials and wind farms and their adverse effects on the power market was discussed in [
57]. Renewable energy sources and energy-coherent models have numerous benefits, such as mitigating climate change, increasing safety, and increasing sustainability in the power system [
58]. Piyasak [
59] illustrated the benefits of renewable sources with proper storage planning that can decrease instabilities in solar photovoltaic and wind energy generation. The wind energy sector was broadly discussed in [
60]. The author reviewed various facts about designing wind energy systems, i.e., policies, investments, and socio-economic benefits, for merging into the competitive power market.
The advantages of using variable renewable resources, such as solar photovoltaic materials and wind power, were discussedby Simon Sinsel et al. [
61]. These renewable sourcesare considered to be the key techniques to achieve the decarbonization of the electricity market and have significantly different scenarios from conventional sources. Dalia et al. [
62] analyzed several approaches to enriching the performance of power systems with a huge expanse of power generation from renewable sources. They mainly pointed to the methodology applied to improve solar PV and wind power with low-voltage ride-through skills to please grid necessities. The authors of [
63] reviewed the hybrid integration of solar and wind energy systems. The increasing electricity demand is also making the power market switch toward renewable as they are eco-friendly. Many countries are installing renewable energy into their existing projects as they natively exist in their nation. They offer numerous additional benefits compared to other energy resources. The cost of power generated from renewable energy sources is a vital factor as it is very low, which subsidizes the penetration of renewables in the deregulated market [
64]. Because the marginal cost of renewable sources is very low or even zero, they negatively affect the market clearing price by eliminating more expensive generating sources from the dispatch program [
65].
Anuj et al. [
66] displayed the energy and operational reserve procurement from renewable power plants on an actual time basis in a short-term power market with a sequential dispatching technique. A deregulated power market aims to deliver excellent quality power to its consumers, which should be economical and environmentally friendly. Renewable sources are integrated into the distribution system to complete the inconstant load demand, and the decarbonizing effects are covered in depth by B. Murugananthama et al. [
67]. Yin et al. [
68] analyzed the current electricity market by integrating solar power and the global industrial scenario. By using the viable solution model, a detailed investigation was conductedon solar uncertainty in the short-term electricity market.
Hydropower is not only sustainable energy, but it also has great storage capability and flexibility, which make it improve the stability of the grid and help other alternating renewable energy sources, such as wind and solar placement, was further discussed by the author [
69]. The authors of [
70] proposed a framework for the ideal generation approach of a micro grid that integrates solar photovoltaic materials, wind farms, tidal steam turbines, fuel cells, boilers, and energy-storage devices. The uncertain nature of solar photovoltaic radiation, wind speed, and tidal steam generation affects the quality and quantity of power and market pricing. Farzana et al. [
71] deliberated an outline to reschedule power generation with and without integrating renewable energy sources to maintain power flows in transmission lines within specific limits in a deregulated power market. The authors of [
72] presented a novel framework for combining wind–thermal plants for optimal investment strategies. Wind forecasting was evaluated using the data mining technique, and the Monte Carlo technique was used to determine the fuel price and electricity demand in a deregulated power market. The authors of [
73] provided information to researchers, policymakers, and designers regarding renewable energy production through the potential of a biomass, wind, and hybrid system. Dey et al. [
74] elaborated on the relationship between renewable sources and sustainable development with their future scopes. The authors of [
75] described the complete structure, lifecycle, and costing model of wind power from a large-scale point and checked the imbalance cost models and structure between a variety of wind farms using different economic analysis approaches. An ANN-based method was presented in [
76] to study the optimal conditions using the load frequency control method for a distributed power network. A bacterial foraging algorithm was implemented in [
77] to augment learning of the neural network model for automatic generation.Al-Majidi et al. [
78] presented the ANFIS MPPT controller design for a remote PV system.
The technical efficiency of renewable sources is improving with the modernization of energy-harnessing methods, as well as the use of efficient energy collectors. The advancement of the efficiency of renewable energy sources encourages power plant installers, policymakers, and utility services to go towards renewable sources throughout the world. The authors of [
79] presented a process for cleansing the forecasting of renewable sources by its intraday tuning and explored the measures for keeping renewable sources with unbalanced production.
Table 11 displays a comprehensive analysis of the literature in the field of renewable energy sources.
After the comprehensive literature review, it can be concluded that hydropower, wind power, and solar power are now the leading backup energy sources throughout the world. However, the day is very close when these sources must act as the foremost and superlative energy sources. As such, these studies will give a clear-cut idea about the present status and future perspective to industrialists for their new renewable power plants.
7. Technical Advancement in Renewable Energy
In the recent era, renewable energy has developed new and innovative technologies. Some of them are discussed as follows:
The demand for solar energy has increased over the past few years due to its several benefits. The solar photovoltaic effect is the technique of a solar cell that can convert sunlight into electricity. Solar power has acted an important part in the conversion to renewable energy so far and there is no chance of it declining. Here are some technologies related to solar power.
Floating solar panels are panels that are made up of solar cells and are placed upon a floating body, such as ponds, lakes, water reservoirs, oceans, etc. They are mounted with the help of an anchor reaching the bottom of the reservoir bed. The generated power is transferred to the shore with the help of underwater cables. This technology has achieved outstanding grip due to its several benefits. They do not take up much space on land, unlike traditional solar panels. As such, they avoid interrupting the view and densely populated areas where land is scarce. The placement of the floating solar panel helps in the reduction in evaporation from the reservoirs.
Perovskite solar cellsare another innovation in solar power. This solar cell uses a specific material known as perovskite. They have unique crystal structures and are considered to have low cost and high efficiency compared to traditional silicon ones. These cells are very flexible and light in weight, which makes them perfect for transportable and wearable devices.
This unique innovative idea was designed so that the house windows can supply electricity. In this, the solar PV cell is integrated into the glass of the window. These cells can be transparent or semi-transparent, permitting the sun’s rays to pass for generating power. This idea leads the house owner to avail electricity easily and effectively.
Wind energy is a renewable energy source that has the potential to achieve the increasing power demand. It uses the eternal power of the wind to produce electricity without harming the environment. This technology uses wind turbines to convert kinetic energy into mechanical energy and then convert it into electricity.
Vertical-axis wind turbines have a specific structure that helps to catch the wind from any direction and convert it into wind energy. They are compact in design, which allows them to be installed in residential as well as commercial buildings. The blades are placed vertically, and they rotate around the central axis. This makes them convenient to use in cities and areas where the direction of the wind is unpredictable. They create less noise compared to traditional horizontal-axis wind turbines.
Offshore wind turbines are placed in water bodies, such as lakes or oceans, where a consistent flow of wind is available to generate electricity. The primary advantage of them is that they can avail stronger and more consistent wind flow near the shore. They have a unique potential to produce huge amounts of energy.
Airborne wind energy is a unique innovation of renewable energy technology in which electricity is generated using wind turbines thatare placed upon flying devices. This technology uses stronger and more consistent winds thatare found at higher altitudes. They use airborne devices, such as kites, drones, etc., to use wind energy at elevated places with robust and consistent winds. The primary advantage of them is that they can be deployed in such areas where traditional wind turbines are not workable.
Wave energy is a power-generating technology that uses kinetic energy from ocean waves. It uses floating devices that move upward and downward depending on the waves, which are connected to a generator that converts the energy into electricity. It is a predictable source that can be used for large-scale power generation.
8. Energy Efficiency in Renewable Sources
Energy efficiency means minimizing the waste of energy. It states that this occurs by performing the same task by utilizing less amounts of energy. It has a variety of benefits, such as minimizing the emission of greenhouse gas, decreasing the energy import demand, and bringing costs to domestic and economic standards. The technologies thatare related to renewable energy sources help to achieve these objectives, providing efficient energy economically and immediately. Different scopes exist for efficiency enhancements in each economic sector, whether it is buildings, transport, commerce, or power generation.
The designers of buildings focus on optimizing building efficiency. They can integrate renewable-energy-related technologies thatcreate zero-energy buildings. Variations can be made to the present buildings to decrease the usage of energy and make them economical. Small efforts can be considered, such as selecting LED light bulbs and energy-efficient appliances, or huge steps can be taken, such as upgrading the insulation.
The ‘waste’ heat energy available from the power plant can be used for heating /cooling purposes or hot water for nearby facilities. This can increase the energy efficiency of power generation. The smart grid also improves the efficiency of energy generation and distribution.
Societies are designed for both development purposes and safety.Having available choices for hiking, biking, and public transport helps to reduce the requirement for private automobiles for travel. Energy-efficient automobiles need a small amount of fuel to complete a certain distance. This makes the operation comparatively less expensive and causes less pollution.
Freight movement can be more efficient by improving truck and rail communication.
9. Conclusions
In recent years, the power sector has faced huge issues all over the globe. A major reason for this is the use of conventional-based power plants as a primary source, which hurts the environment and causes economic burden due to its scarcity. This inspires the power industries to shift towards renewable-energy-based plants. It is important to move over to renewable energy sources as environmental degradation and the lack of availability of fossil fuels are increasing day by day. In the present scenario, the government has increased its interest in wind, solar, and hydropower plants as they all have their benefits with respect to power generation. Wind power plants are considered to be more efficient when it comes to clean energy. They have the potential to meetincreasing power demands. They do not depend on daylight or the sun to generate power. They are beneficial on a utilityscale. Solar is considered to be the most common residential renewable source. It is a more realistic solution for residential homes looking to tap into greener energy alternatives. It is a sustainable source of energy and has zero carbon footprint, which alleviates climate change. Hydropower plants have huge potential around the world; policymakers are shifting from other energy sources to them. They can be used to produce electricity on a large scale. They are a type of technology that has remained for decades but keeps evolving. In this work, the present status of wind, solar, and hydropower plants with background study has been discussed. The researchers are motivated to discover more by observing the huge potential of renewable power and will perhaps provide an enhanced structure to the renewable power sector. It will inspire researchers to discover more by witnessing the huge potential of wind, solar, and hydropower, possibly giving better shape to renewable power.


