Article

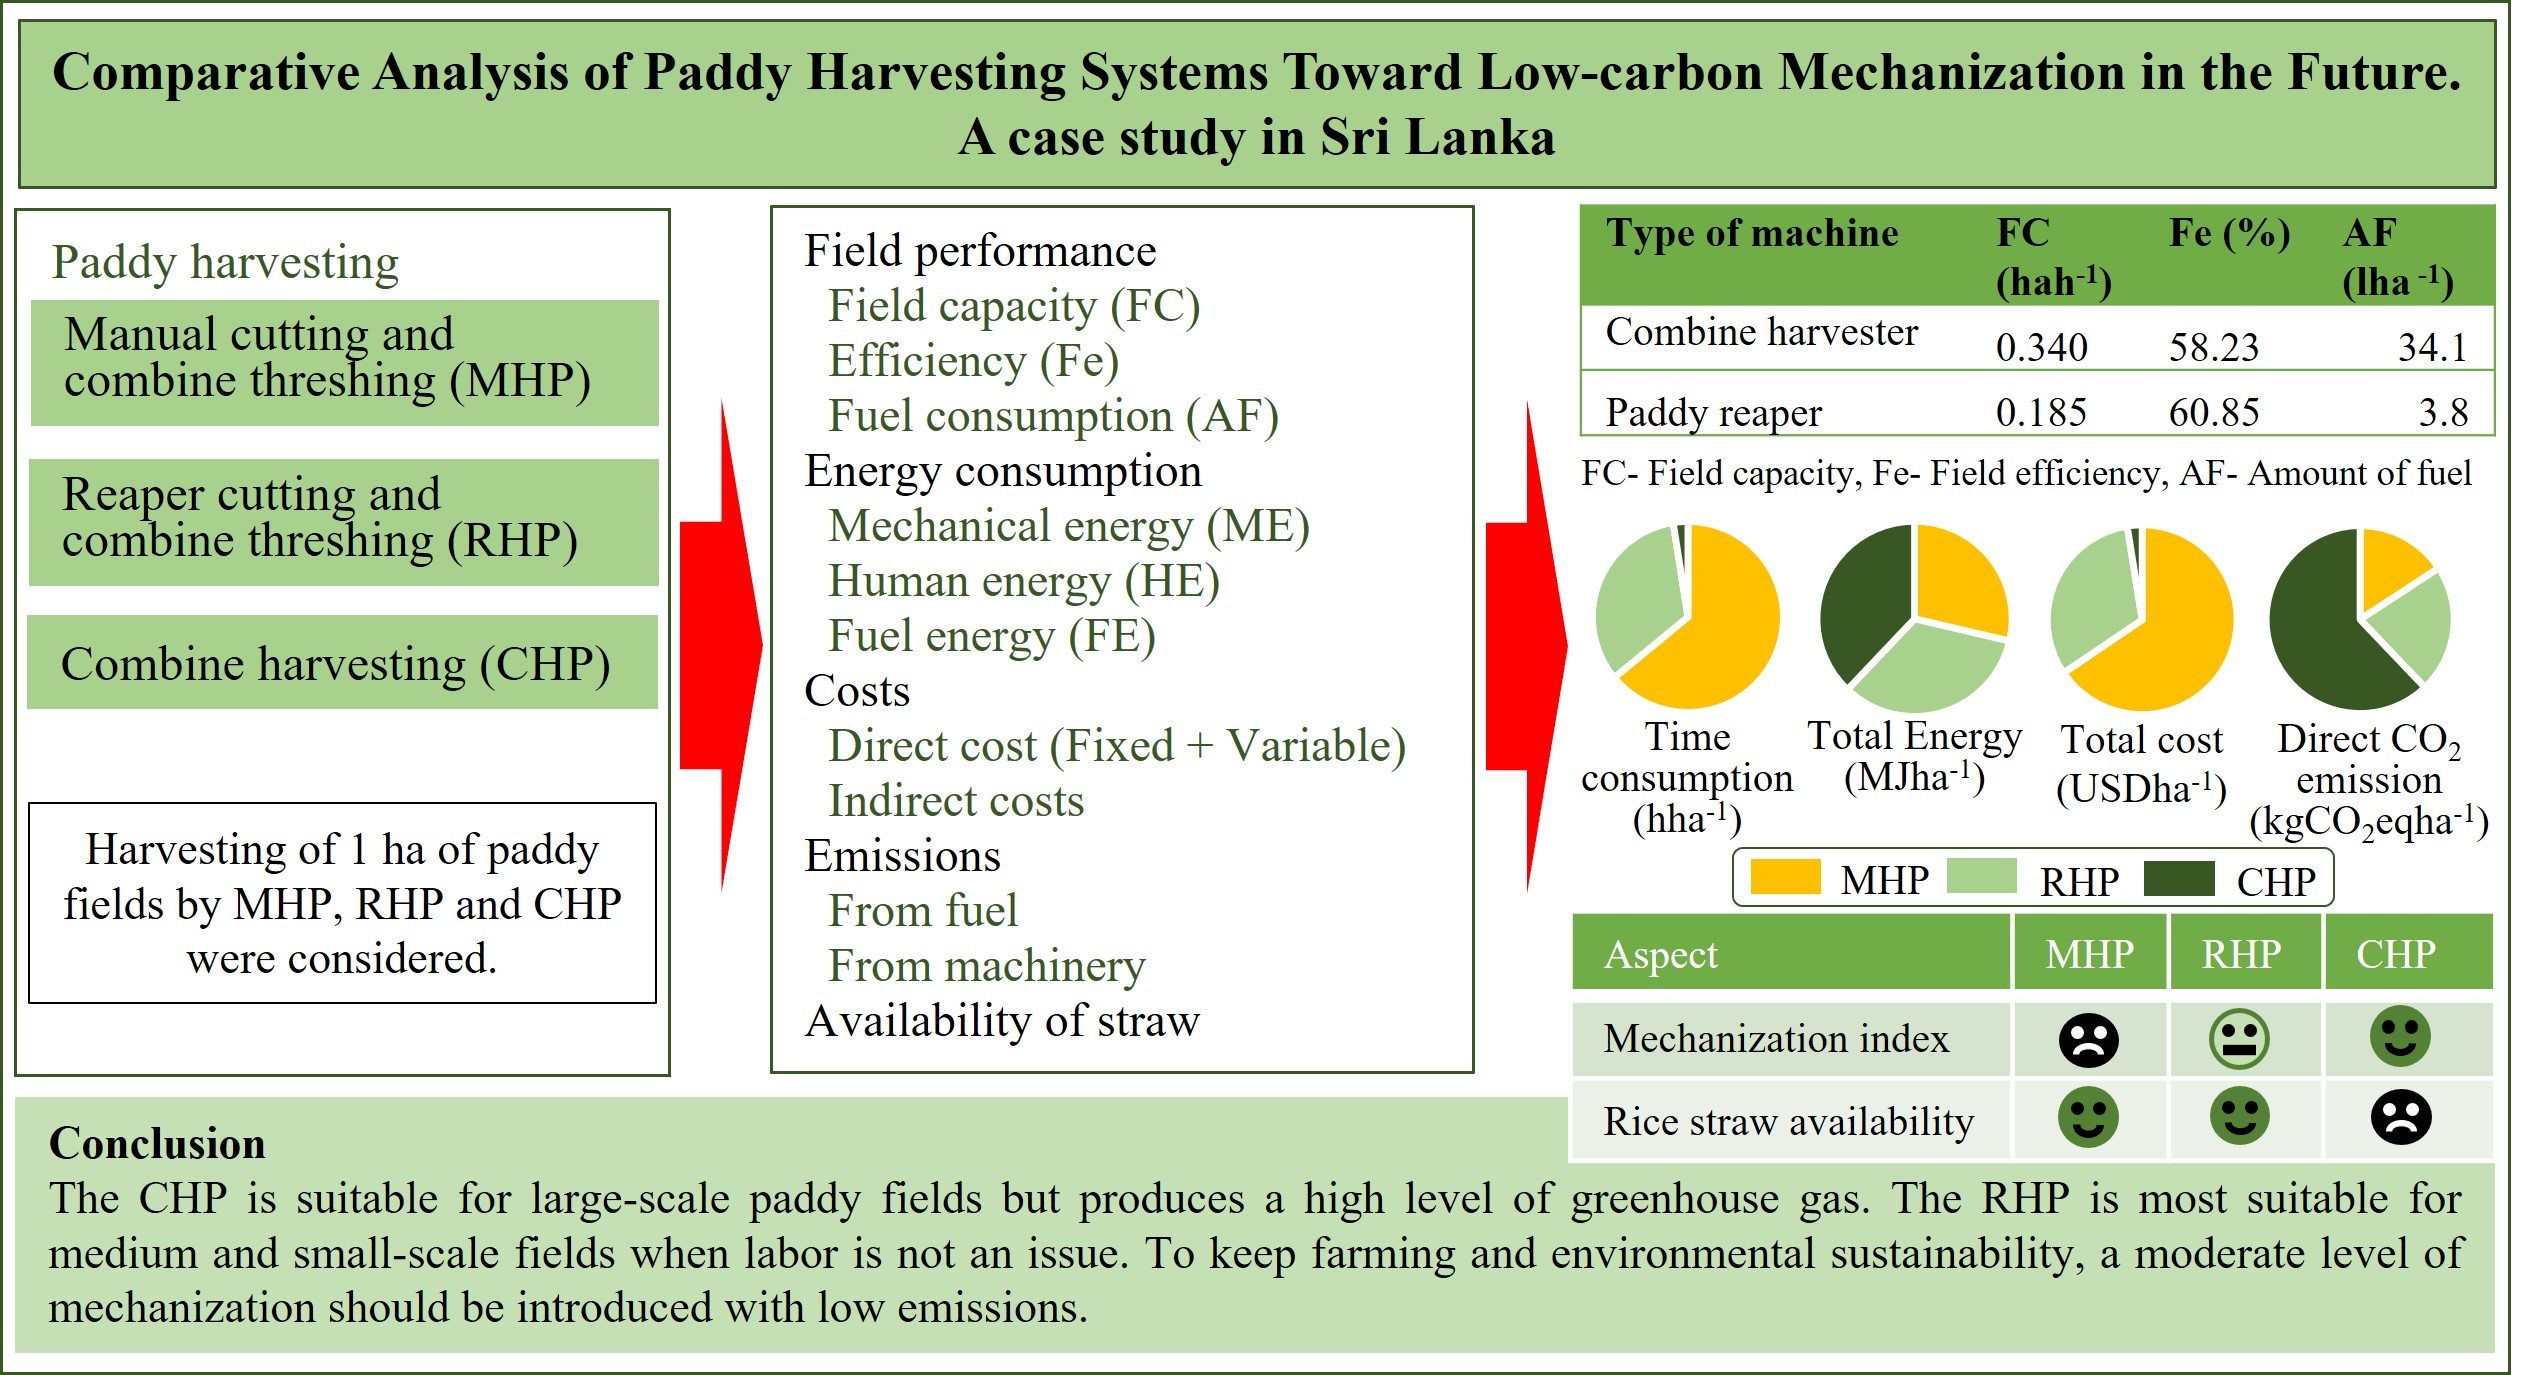
Comparative Analysis of Paddy Harvesting Systems toward Low-Carbon Mechanization in the Future: A Case Study in Sri Lanka

1
Graduate School of Science and Technology, University of Tsukuba, 1-1-1 Tennodai, Tsukuba 305-8577, Japan
2
Department of Agricultural Engineering and Soil Science, Faculty of Agriculture, Rajarata University of Sri Lanka, Mihintale 50300, Sri Lanka
3
Bandosiefu High School, Bando 306-0631, Japan
4
Faculty of Life and Environmental Sciences, University of Tsukuba, 1-1-1 Tennodai, Tsukuba 305-8572, Japan
5
Laboratory of Agricultural Systems Engineering, Division of Environmental Science and Technology, Graduate School of Agriculture, Kyoto University, Kyoto 606-8501, Japan
*
Author to whom correspondence should be addressed.
Processes 2023, 11(6), 1851; https://doi.org/10.3390/pr11061851
Submission received: 17 May 2023 / Revised: 6 June 2023 / Accepted: 17 June 2023 / Published: 19 June 2023

Abstract

:
In this study, three paddy harvesting systems, manual harvesting of paddy (MHP), reaper harvesting of paddy (RHP), and combine harvesting of paddy (CHP), were evaluated considering field capacities, field efficiencies, time and fuel consumption, mechanization indices, greenhouse gas emissions, straw availability, and direct and indirect costs. Field experiments were conducted in the North Central Province of Sri Lanka. The effective field capacity, field efficiency and fuel consumption of the combine harvester were 0.34 hah−1, 60.8%, and 34.1 Lha−1, respectively, and those of the paddy reaper were 0.185 hah−1, 58.2%, and 3.8 Lha−1, respectively. The total time consumed by MHP, RHP, and CHP were 76.05 hha−1, 39.76 hha−1, and 2.94 hha−1, respectively. The highest energy utilization was recorded by the CHP, at 1851.09 MJha−1, while MHP recorded the lowest at 643.20 MJha−1. The direct cost of the MHP was 1.50 and 1.52 times higher than those of the CHP and RHP, respectively. MHP recorded the lowest greenhouse gas emissions (32.94 kgCO2eqha−1), while CHP recorded the highest (176.29 kgCO2eqha−1). The RHP exhibited an intermediate level in all aspects. Although the CHP has higher field performance and direct costs, it has higher GHG emissions and indirect costs. Therefore, an optimum level of mechanization should be introduced for the long-term sustainability of both the environment and farming.

Graphical Abstract

1. Introduction

Paddy production impacts significantly on food security and economic development in many regions worldwide, as rice is the staple food source for over half of the global population [1]. Paddy harvesting is a vital step in rice production and includes activities such as cutting, threshing, and cleaning [2]. It is recognized as the most energy-consuming activity involved in paddy production [3]. Presently available paddy harvesting methods include manual harvesting with sickles, harvesting with self-propelled paddy reapers and harvesting with combine harvesters. A good harvesting method should maximize the grain yield while minimizing the grain damage and quality decline [4]. The amount of available rice straw is heavily dependent on the harvesting method applied, and therefore, the biomass supply chain of paddies as an off-shoot of paddy production is closely related to the harvesting method [5].
As rice is the staple food of billions of people worldwide, realizing an affordable price for everyone while ensuring a sustainable profit for farmers is crucial for long-term food security. To minimize the total cost of production, paying attention to the cost of unit operations in the production process becomes an important step. As a major step of the production process, harvesting should be paid more attention to reduce the total production cost of paddy cultivation.
The characterization of the global warming potential (GWP) of rice production ranges from 1460–5550 kgCO2eq t−1. The consumption of diesel fuel by tractors for land preparation, harvesting, and transportation is the main reason for greenhouse gas (GHG) emissions. The diesel consumption rate in conventional paddy cultivation activities is 101.4 Lha−1 [6]. The use of fossil fuels affects the environment in many ways: changing the climate, polluting fresh water, causing acid rain, and depleting fossil fuels and allied resources. Therefore, the minimum possible use of fossil fuel in paddy harvesting will help to minimize considerable environmental damage. Although the mechanization is vital in the development of the agricultural sector, this practice often results in high levels of greenhouse gas emissions and energy consumption. Numerous scholars worldwide have emphasized the significance of scrutinizing the energy usage and emissions of greenhouse gases by agricultural machinery. Jiang et al. [7] have highlighted the importance of low-carbon agricultural mechanization in the future toward the green development of agriculture. Lampridi et al. [8] have shown that assessment of the total energy consumption of agricultural machinery should be an essential step before introducing alternative technologies.
Recently, several studies have been carried out to assess the performances of paddy harvesting systems, focusing specifically on combine harvesting in terms of field performance, yield loss, economy, and energy. Mokhtor et al. [9] assessed the influence of the field speed of combine harvesters on grain losses. Chandrajith et al. [2] conducted a research study to determine the effects of combine harvesting on the head rice yield and chaff content and found that the type of combine harvester had no significant effect on the head rice yield. Regarding the cost and field performance, one study [10] compared the cost of the combine harvesting process and reaper harvesting process with mechanical threshing, and another [11] performed a comparative cost analysis of engine-operated reapers and tractor-mounted reapers. In a study undertaken in Indonesia to assess the field performance and total energy requirement of combine harvesting and manual harvesting, only two threshing methods, manual threshing and power threshing, were considered, while reaper harvesting was omitted [12]. In Bangladesh, a similar study considering a miniature combine harvester and manual harvesting was conducted [13]. Modern agricultural mechanization is rapidly developing with the applications of artificial intelligence, drone technology, computer vision, and robotics, allowing for autonomous machinery and real-time analysis by digitization to achieve society 5.0 [14,15]. Although modern mechanization has significantly improved productivity and efficiency in agriculture with greater reliability, it remains inaccessible and unaffordable for many farmers worldwide. Therefore, the advancement of the affordable level of mechanization is also important to keep food security and achieve sustainable development goals. Therefore, this study recognizes the relevance of a comprehensive comparison of the major paddy harvesting systems, including their field performances, energy demands, costs of operation, greenhouse gas emissions, and availability of biomass for sustainable paddy production. This study is expected to be useful for paddy producers and policy makers to determine the most appropriate method of harvesting depending on the size of their fields and other aspects, such as time consumption, cost, environmental sustainability, and the ability to reuse residual biomass.

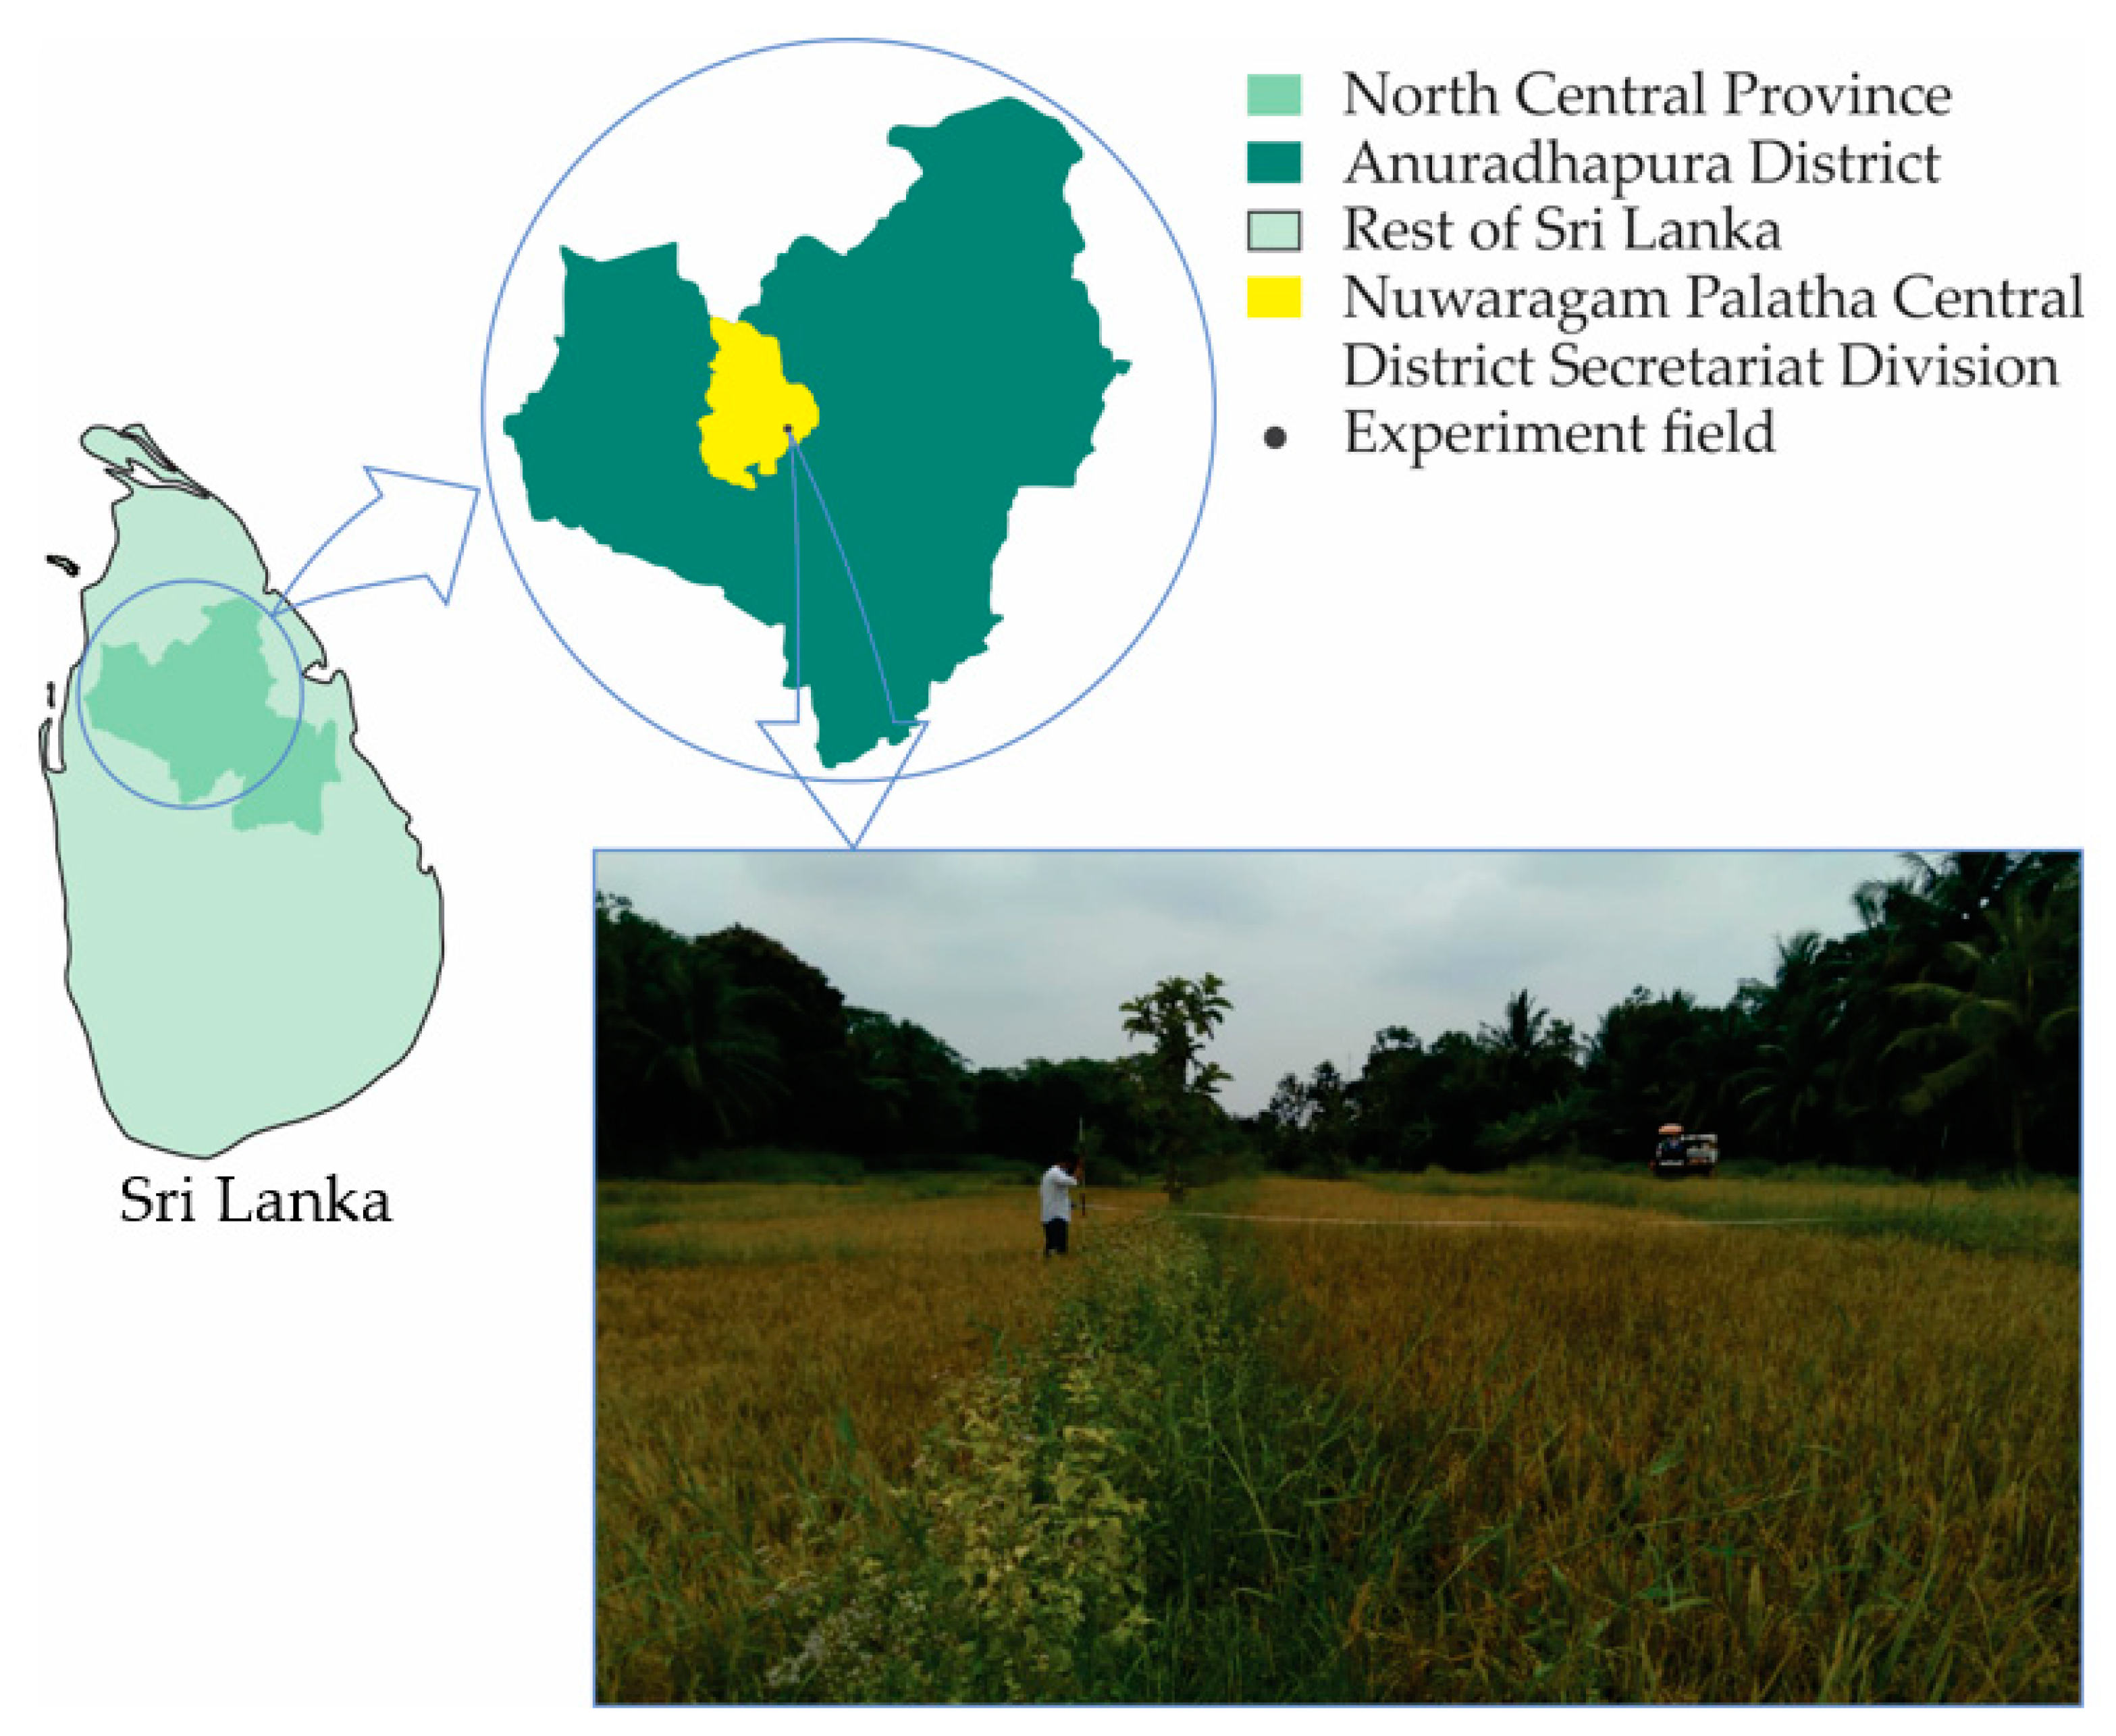
2. Materials and Methods

The harvesting of 1 ha of paddy fields by 3 paddy harvesting systems, (i) manual harvesting of paddy (MHP) (manual cutting and combine threshing), (ii) reaper harvesting of paddy (RHP) (cutting by a paddy reaper and combine threshing), and (iii) combine harvesting of paddy (CHP) was considered. The field experiments were conducted in several paddy fields in the Anuradhapura district of the North Central Province of Sri Lanka during the paddy harvesting period of March 2022.

2.1. Overview of Harvesting Methods

Paddy harvesting methods are characterized by the different units of operation, different machinery, different mechanisms, and different amounts of labor, fuel, time, and energy consumption required. As paddy harvesting consists of several operations, such as cutting, threshing, and cleaning, the units of operation of the harvesting systems may differ from one another according to the machinery and mechanisms. Manual cutting, reaper cutting, and combine harvesting are three cutting methods currently in practice. Despite several threshing methods being available, some of them, namely, manual threshing, animal threshing, and tractor threshing, are currently less popular and are rarely used in practice. A harvesting process in which all operations are handled by machines is categorized as a mechanical process, while a process in which only certain steps are dealt with by machines is categorized as a semi mechanical process [16]. The most popular threshing method for paddies cut manually or by reaper is combine threshing. Therefore, in this study, combine threshing was considered for both manual cutting and reaper cutting.

2.1.1. Manual Cutting and Combine Threshing of Paddy (MHP)

In the manual harvesting of paddy fields, mature plants are cut with a sharp cutting tool called a sickle or knife. The cut paddy, along with straw, is allowed to sun dry in the field for a few hours before being transported to the threshing floor. Once on the threshing floor, the cut material undergoes combine threshing to separate the paddy from the straw. Figure 1 shows the major components of a combine threshing machine along with the material (paddy, straw, and chaff) flowing inside the machine.
The cut paddy is inserted into the threshing machine through the feed table. The rotating threshing cylinder (of the spike type or rasp bar type) separates the grains from the straw. The separated grains with the chaff and some straw pass on to the oscillating screen through the concave area below the threshing cylinder. The oscillating screen further separates the grain from the straw and chaff. Only the separated paddy is collected temporarily in the grain tank, and unthreshed or partially threshed paddy is redirected to the threshing cylinder through the recirculating auger to continue being threshed. The straw and chaff are blown out through the straw discharge chute. The blower located underneath the mechanism creates flowing air to facilitate this separation process. Here, the paddy straw can be collected at the threshing field during the threshing process. The grains can then be taken out through the grain outlet, and the cleaned paddy can be transported to the storehouse for storage until processing.

2.1.2. Reaper Cutting and Combine Threshing of Paddy (RHP)

Figure 2 shows the major components of a paddy reaper.
The dividers help to collect and lead a bundle of paddies toward the cutter bar. The cutter bar follows a reciprocating movement relative to the nonmoving ledger bar, making a shearing action to cut the paddy stems. The reaper transport belts help make rows of harvested paddy on the right side. Generally, cut paddy is allowed to dry in sunlight until being transported to the threshing field, similar to the process followed in the manual harvesting system. The threshing operation and processing steps are also similar to those described for manual harvesting, and paddy straw can be collected at the threshing field.

2.1.3. Combined Harvesting of Paddy (CHP)

A combine harvester is a self-propelled machine that performs most of the operations of harvesting, including cutting, threshing, and cleaning. This system comprises several units, such as the header unit, conveyor unit, threshing unit, winnowing unit, straw-discharging unit, grain-discharging unit, traveling unit with engine, and transmission unit. The major components of a combine harvester, including the flow paths of crop, grain, straw, chaff, and air inside the harvester, are shown in Figure 3.
The header unit, which consists of the reel, cutter, auger, and feeding conveyor, cuts the gathered crop and carries it upward toward the threshing cylinder. The rotating threshing cylinder and static concave plate help extract the grains from the ears. The straw shaker, grain pan, top and bottom sieves, and blower help separate the grain from the straw. Partially separated and unseparated grains are returned to the threshing cylinder by the threshing elevator. After the threshing and cleaning operations are complete, the paddy straw is dispersed on the field through the paddy straw outlet of the machine.

2.2. Determination of Field Performance

2.2.1. Field and Ambient Conditions

As field and ambient conditions affect the performance of both machinery and humans, it is important to measure and mention the field and ambient conditions during the evaluation process, along with the results. The moisture content on the dry weight basis (MC) and bulk density (BD) of the soil were measured at five places in each experimental plot before the experiment. Ambient conditions such as the temperature (T), relative humidity (RH), rainfall (RF), and wind velocity (W) were measured several times at 10 min intervals during the experiment. The performance of a machine is determined by several factors, such as operating conditions, maintenance, age and wear, quality of the design, power, capacity, and skill of the user. Although the operating conditions and maintenance were checked and recorded, other factors that affect the performance were not considered in this study.
The experiments were conducted in a paddy field (8°24′02.8″ N, 80°24′11.3″ E) in the Nuwaragam Palatha Central District Secretariate Division of Anuradhapura District of the North Central Province of Sri Lanka. The elevation of the field was 81 m above mean sea level, and the steepness of the field was negligible. The area of the demarcated square-shaped plot designed for the trial of each harvesting method was 1600 m2 (40 m × 40 m). The study location and a view of the field are shown in Figure 4.

2.2.2. Field Performance

As several brands and models of paddy reapers and combine harvesters are available on the market, one popular model of each machine category was selected for this study. Some of the specifications of the selected combine harvester, paddy reaper, and combine paddy thresher used in this study are given in Table 1.
Skilled laborers were selected for manual paddy harvesting. Square 40 m × 40 m plots were demarcated for five replicates of each harvesting method. During each experiment, the total time consumed to completely harvest the plot, the time consumed only for the harvesting operation, the time loss, grain loss, straw loss, fuel consumption, and human involvement in harvesting, unloading, collecting, transporting and other activities in each plot were accounted for and recorded.

Average Forward Speed (FS)

The forward speed of operations was obtained by recording the time taken to completely harvest one row using a stopwatch and measuring the length of the row with a measuring tape according to Equation (1). The average operation speed of one field was obtained considering several rows.
F S = Distance   of   one   row   ( m ) Time   taken   ( s )

Field Capacity and Efficiency

The theoretical field capacity (TFC) (hah−1), actual/effective field capacity (EFC) (hah−1), and field efficiency (FE) (%) of all the harvesting methods were determined using the following mathematical equations (Equations (2)–(4)) [17]:
T F C = F S × C W × 36 100
E F C = A t
F E = E F C T F C × 100
where FS is the average forward speed (ms−1), CW is the cutting width (m), A is the total area harvested (ha), and t is the total operating time (h). The CW of the reaper and combine harvester was the width of their cutter bars; in this study, they were measured with a measuring tape. In the calculation, the area of the experimental plot (0.16 ha) was taken as the total area (A). The total operating time (t) including all the time losses was measured with a stopwatch.

Fuel Consumption (AF)

The fuel consumption of paddy reapers and combine harvesters was determined by measuring the amount of fuel required to refill the fuel tank back to its full capacity after harvesting each plot using a measuring cylinder.
The field performance indicators, i.e., FS, TFC, EFC, FE, and AF of the combine harvester and paddy reaper were statistically compared by an independent sample t-test at the significance level of p = 0.05.

2.3. Total Energy Input for Paddy Harvesting (TEI)

The total energy consumption required in harvesting operations (MJha−1) was determined as the summation of energy from all sources, such as machinery energy (ME) (MJha−1), fuel energy (FE) (MJha−1), and human energy (HE) (MJha−1), as shown by Equation (5).
T E I = M E + F E + H E

2.3.1. Machinery Energy (ME)

Machinery energy is the indirect energy assumed to be embodied in a piece of equipment during manufacturing. Equation (6) was used to determine the machinery energy of each studied machine [18]:
M E = M E C × W E F C × L
where ME is the machinery energy (MJha−1), MEC is the energy conversion coefficient for a particular machine (MJkg−1), W is the weight of the machine (kg), EFC is the effective field capacity (hah−1), and L is the life of the machine (h).
According to the literature, the useful lives of the self-propelled combine harvester, paddy reaper, and combine thresher were all considered to be 3000 h [19], and the energy conversion factor for the equipment was taken as 138 MJkg−1 [8]. The weight of each machine (W) was taken from the user manual provided by the manufacturer.

2.3.2. Fuel Energy (FE)

The fuel energy per unit area is a function of the type (diesel or petrol) and quantity of fuel consumed by the machinery used to power engines performing the assigned harvesting operations. Equation (7) was used to compute the fuel energy required for the harvesting operation:
F E = A F × F C A
where FE is the fuel energy (MJha−1), AF is the amount of fuel consumed (L), which was measured during the experiment as explained in the methodology, FC is the fuel energy conversion coefficient (MJL−1), and A is the total area harvested (ha). The energy conversion coefficients of gasoline and diesel obtained from the literature are 45 MJL−1 and 44 MJL−1, respectively [20].

2.3.3. Human Energy (HE)

Equation (8) was used to determine the human energy component of the harvesting operation:
H E = n × t × H C A
where HE is the human energy (MJha−1), n is the number of workers engaged in an operation, t is the duration of the operation measured by a stopwatch (h), HC is the energy conversion coefficient for human labor, and A is the total area harvested (ha).
According to the literature, the energy conversion factor for human energy was considered to be 0.89 MJh−1 [21].

2.3.4. Mechanization Index (MI)

The Mechanization Index (MI) is the percentage of machine energy to the sum of human and machine energy together [18]. This value was computed using Equation (9):
M I = M E M E + H E
where ME is the machinery energy (MJha−1) and HE is the human energy (MJha−1) calculated with Equations (6) and (8), respectively.
The dependent variables, i.e., HE, ME, FE, TEI, and MI were statistically analyzed for all three paddy harvesting methods by ANOVA. The experimental design was Completely Randomized Design (CRD) at the significance level p = 0.05. The mean separation was performed by LSD at the significance level p = 0.05.

2.4. Economic Analysis

The total cost of harvesting is obtained by summing the associated fixed and variable costs. The fixed cost components considered in this study were depreciation, the interest or alternative cost, taxes, housing, and the insurance cost. As variable cost components, labor, fuel, lubrication, repair and maintenance costs were considered.
Depreciation of a machine is an expense reflecting the amount of value the machine loses every year. Considering the linear depreciation method of calculating the depreciation value, Equation (10) was used to calculate depreciation for each machine used in the study [11,22]:
D = P S L T
where D is the depreciation value (LKR), P is the value of the machine at the time of purchasing (LKR), S is the salvage value of the machine after its lifespan (10% of the purchased price) (LKR), and LT is the expected life of the machine (years).
Interest is an opportunity cost reflecting the interest obtained if money is kept in a bank instead of being invested in a machine. Equation (11) was used to calculate the interest (I) of each machine [11,22]:
I = P + S L T × i
where P is the value of the machine at the time of purchase (LKR), S is the salvage value after its lifespan (LKR), LT is the expected life of the machine (years), and i is the interest rate (%).
The taxes, housing, and insurance costs were considered 2% of the capital investment of each machine [23]. The labor cost was determined according to the hourly rate of hired labor and the time spent on the job. The fuel cost was based on the amount of fuel consumed by each unit of operation and the market price of fuel. The lubrication cost of the machine was taken as 15% of the fuel cost [11,24]. The annual repair and maintenance cost was taken as 15% of the value of the machine [23]. Table 2 gives the values of the parameters used when calculating these costs (all the prices of machines were market prices in Sri Lanka at the time of purchase, and the fuel prices were the prices at the time of the experiment).

2.5. Determination of Grain Loss in the Field

Quadrants, each with an area of 1 m2, were placed in five random places in each plot, and all the seeds within each quadrant were collected. Before assessing the grain loss of each harvesting method, the natural grain loss was found in the field by marking the area and counting the loss of grains before the machine entered the field. The average grain loss per plot during the cutting operation was calculated using Equation (12):
G L = A L q N L q × 10,000
where GL is the total grain loss in the field (kgha−1), ALq is the average loss within quadrants (kg), NLq is the average natural grain loss within the quadrant (kg), and A is the total area (ha).
The grain loss during collection and transportation was determined for a 100 kg harvest. The grain loss at the combine threshing process was determined separately, as this term was relevant only for the manual harvesting and reaper harvesting systems. The grain loss percentage (GJP) of each harvesting system was calculated using Equation (13):
G L P = T G L A Y × 100
where TGL is the total grain loss (kgha−1) and AY is the average yield of 1 ha (4795 kgha−1).
The grain losses during each unit of operation of the three paddy harvesting methods were analyzed by ANOVA. The experimental design was Completely Randomized Design (CRD) at the significance level p = 0.05. The mean separation was performed by LSD at the significance level p = 0.05.

2.6. Determination of Greenhouse Gas Emissions from Harvesting Operations

The total CO2 emissions resulting from paddy harvesting correspond to the CO2 emissions resulting from fuel and machinery. The following Equations (14) and (15) were used to calculate the amount of CO2 emitted by the fuel and machinery, respectively [25]:
C E F = C C F × A F A
where CEF is the CO2 emission due to fuel combustion (kgCO2eqha−1), CCF is the CO2 conversion coefficient for fuel combustion (kgCO2eqL−1), AF is the amount of fuel consumed (L), and A is the total area harvested (ha).
C E M = C C M × M E A
where CEM is the CO2 emission due to the machinery utilization of the operation (kgCO2eq ha−1), CCM is the CO2 conversion coefficient for machinery (kgCO2eqMJ−1), ME is the machinery energy (MJ), and A is the total area harvested (ha). The CO2 conversion coefficients for diesel, gasoline, and machinery are 3.09 kgCO2eqL−1, 3.01 kgCO2eqL−1, and 0.071 kgCO2eqMJ−1, respectively [26].

3. Results

The results of this study are presented in terms of field performance, human involvement, energy consumption, direct and indirect costs, and greenhouse gas emissions.

3.1. Field Performance of Harvesting Machinery

As the field conditions of the experiment plots are determinant factors affecting the performance of the machines, the average, minimum, and maximum moisture content on dry weight basis (MC), bulk density (BD) of soil, temperature (T), relative humidity (RH), rainfall (RF), and wind velocity (WV) values were measured and are summarized in Table 3.
Table 4 shows the average forward speed (FS), theoretical field capacity (TFC), effective field capacity (EFC), field efficiency (Fe), and fuel consumption (AF) of the selected combine harvester and the paddy reaper during the experiment.

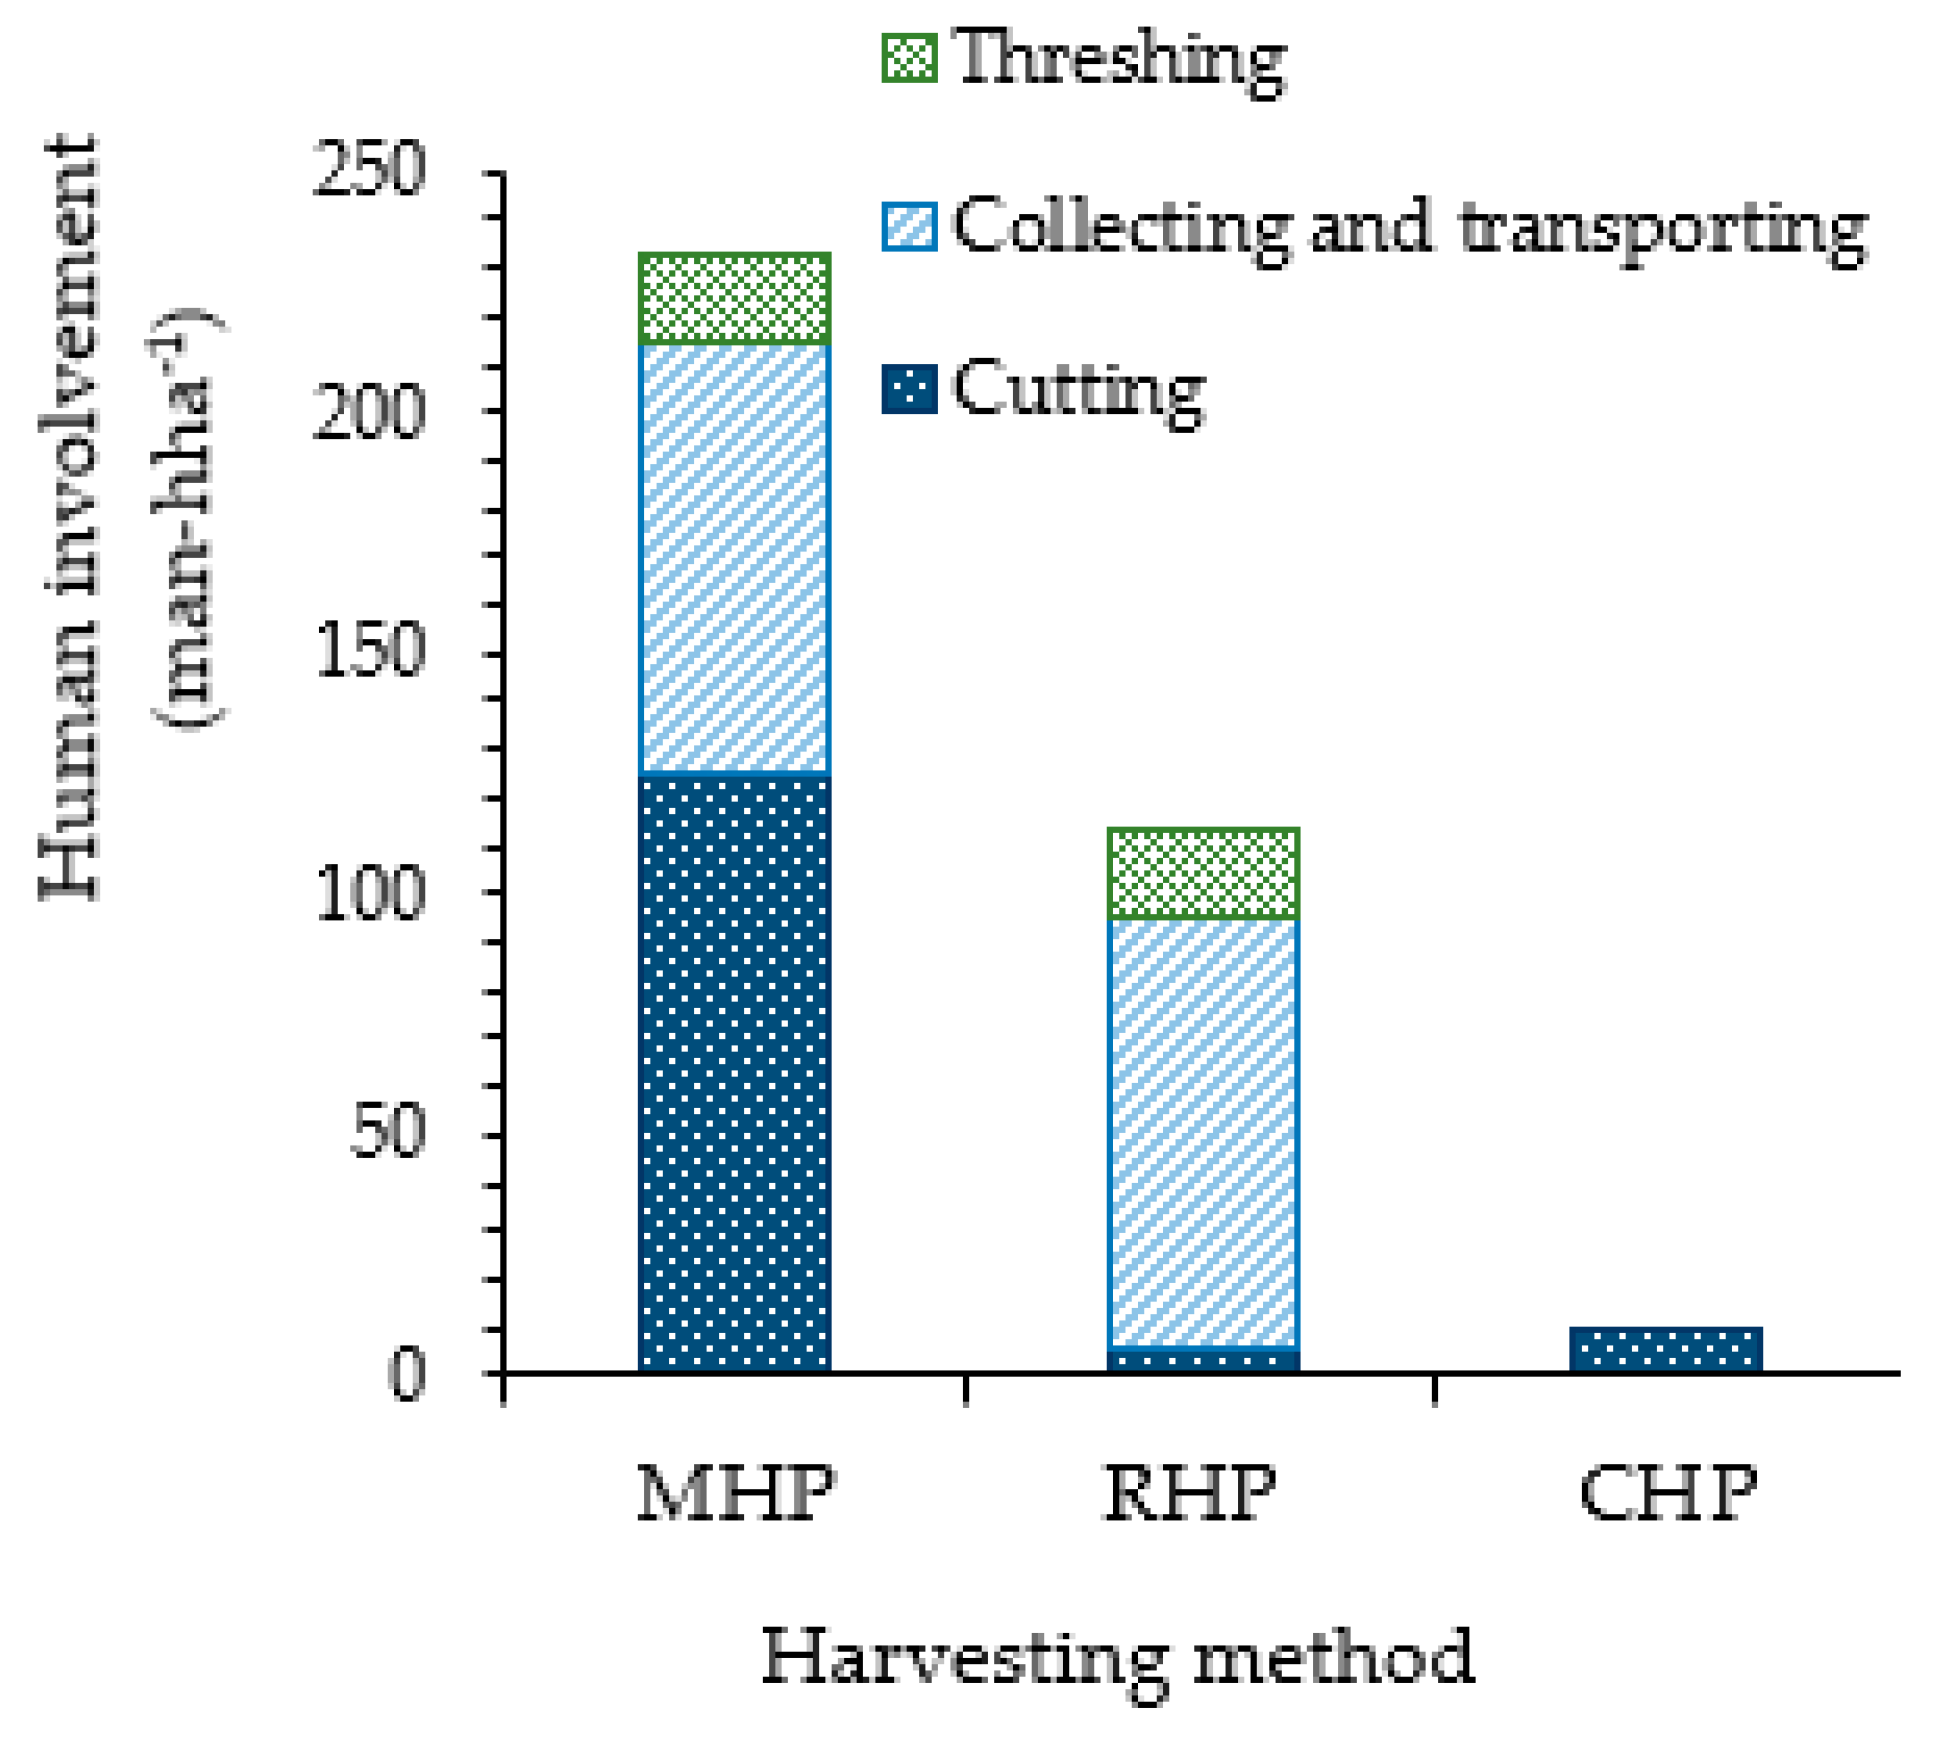
3.2. Human Involvement and Time Consumption of Each Harvesting System

In both reaper and manual harvesting, a considerable amount of human labor is employed, and the total time taken for the completion of the harvesting of 1 ha is determined by the number of laborers, whereas in combine harvesting, only three laborers were needed. Therefore, to negate that variable effect on the comparison, the total time taken by the other two harvesting systems was also computed assuming only three laborers. The labor consumption totals of MHP, RHP, and CHP were recorded as 233, 113.5 and 9 man-hha−1, respectively. The manual harvesting system recorded the highest human labor consumption. The cutting operation of manual harvesting consumed 125 man-h to complete the harvesting of 1 ha of field. Reaper harvesting required only one laborer (5.41 man-h) to operate the paddy reaper during the harvesting of 1 ha, while combine harvesting required three laborers (8.82 man-h): one to operate the machine and two to bag the harvested paddy. In both the manual harvesting and reaper harvesting systems, the cut paddy with straw was transported to the threshing field, which was, on average, 150 m away from the paddy field. This collection and transportation of paddy was performed manually, and 90 man-h were utilized for this task. A combined threshing machine was used in both the manual harvesting and reaper harvesting methods to separate the grains. For the whole threshing process with the combine thresher, to obtain the yield of a 1 ha field, a total of 18 man-h was consumed. The human involvement magnitudes of every unit of operation in all harvesting systems are given in Figure 5.

3.3. Energy Consumption of Harvesting Systems

The energy consumption of the harvesting systems was determined in terms of human energy, fuel energy, and machinery energy. All these energy components were determined separately for all the units of operation of harvesting: cutting, collecting, transporting, and threshing. The human energy, machinery energy, fuel energy consumption, and mechanization indices of all the harvesting systems are given in Table 5. Additional descriptive statistics are reported in Appendix A.

3.4. Machinery and Labor Cost of Harvesting

As the annual working duration of each machine was assumed to be 300 h, the values of all the cost components for 1 h were calculated based on the annual depreciation, interest, housing, taxes and insurance, and repair and maintenance values. Table 6 shows the costs of operation of the studied machines for 1 h, and Table 7 gives the total operational costs of the harvesting systems for 1 ha.

3.5. Grain Loss in the Field

Grain losses in MHP and RHP could be observed during cutting, collecting, and transporting to the threshing field as well as in combine threshing. As all these operations are performed simultaneously in CHP, the grain loss can be calculated during the cutting operation. Table 8 shows the grain loss in the field corresponding to each harvesting system. The descriptive statistics are reported in Appendix B.

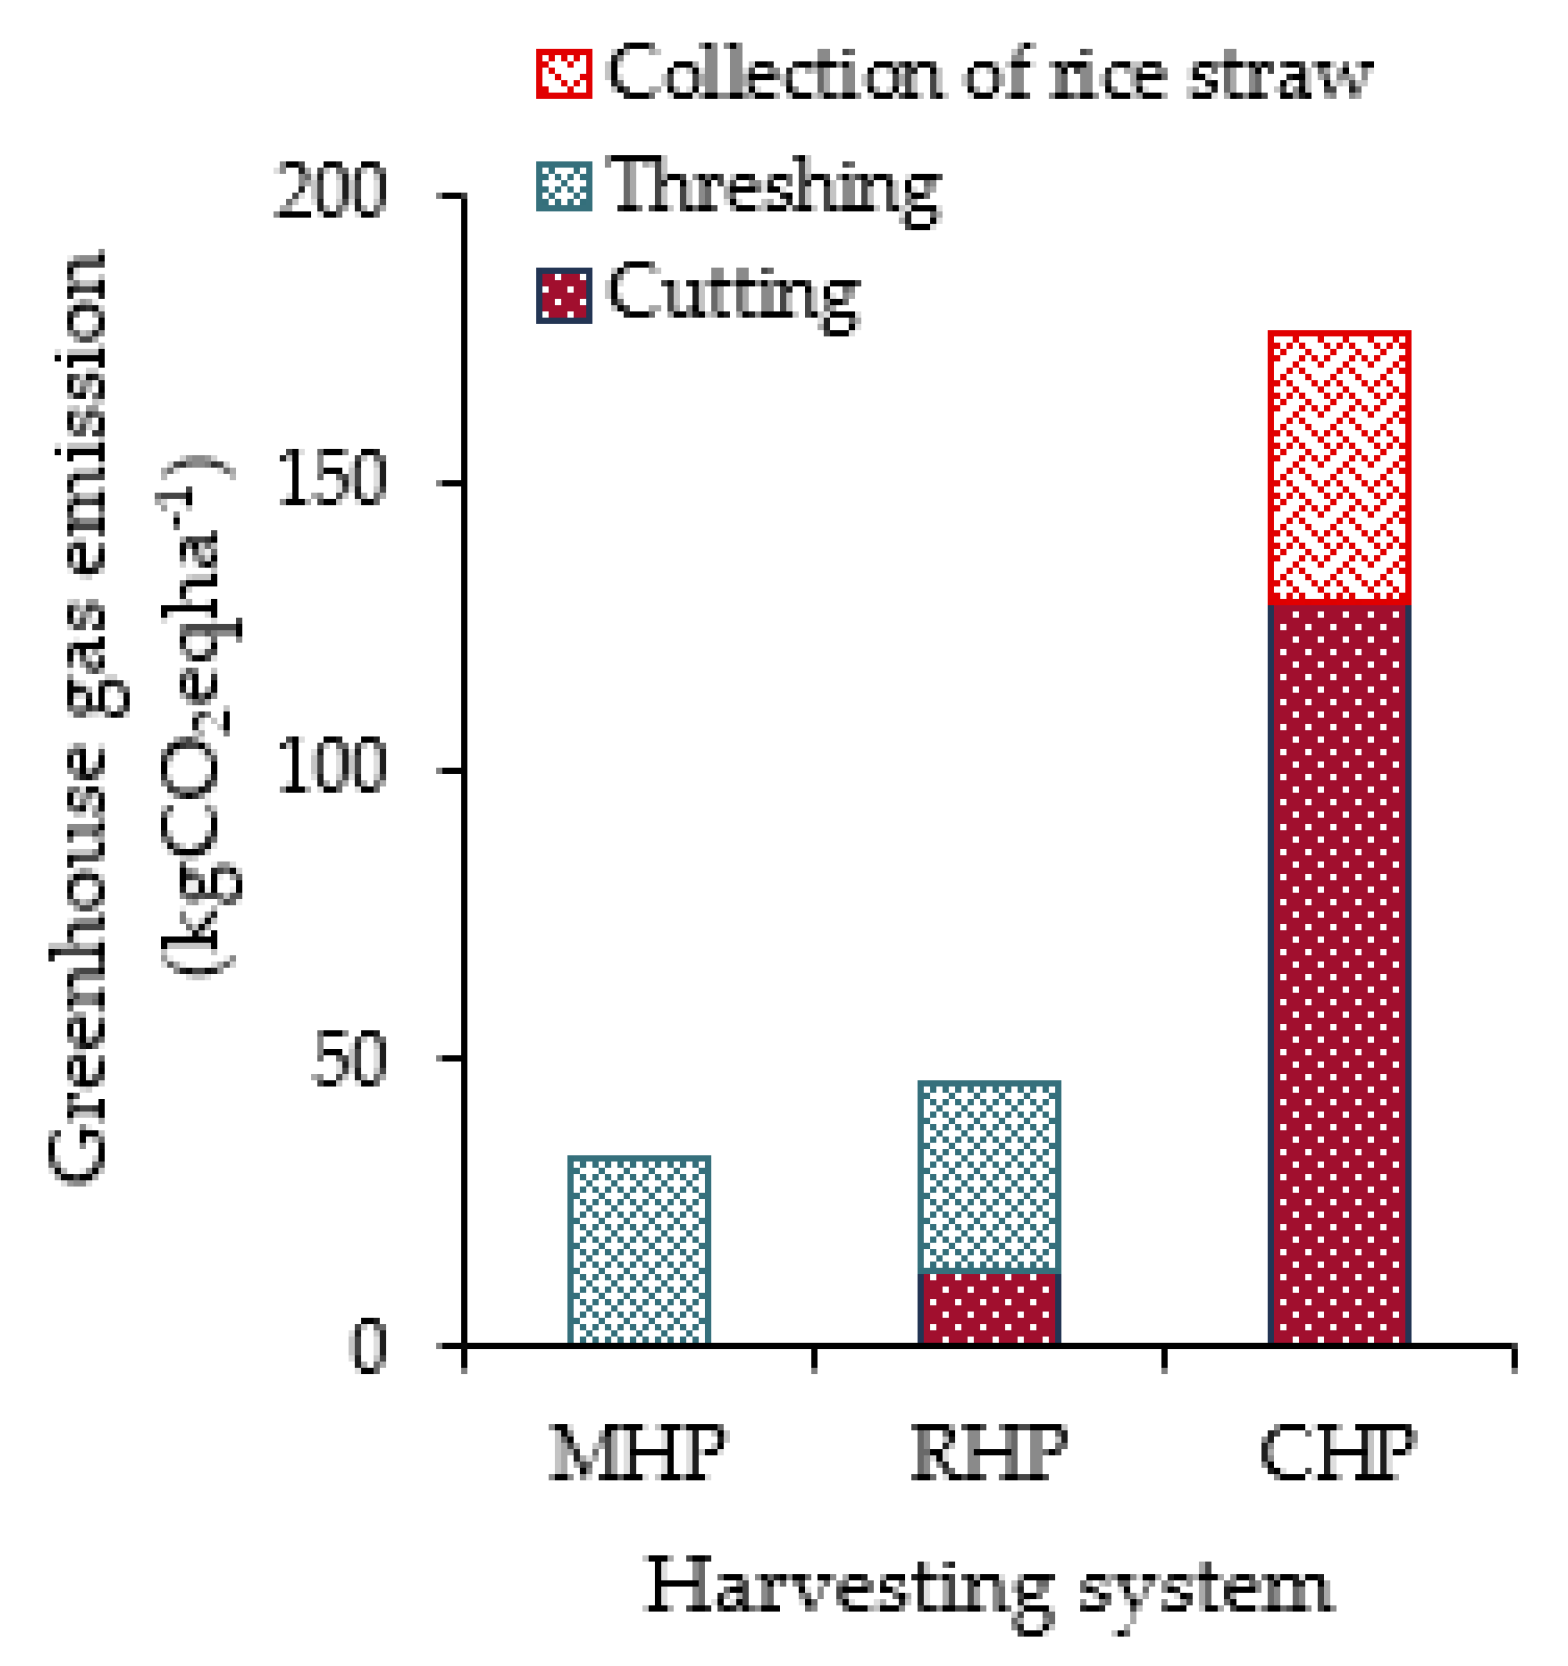
3.6. Contribution to GHG Emissions

Greater attention has been given to reducing the emissions of greenhouse gases (GHGs) from agricultural activities since the agricultural sector is considered a greater contributor to global warming. Figure 6 shows the emission of greenhouse gases from each unit of operation of paddy harvesting systems.

3.7. Indirect Costs of Harvesting Systems

There are several indirect cost components associated with each harvesting system. The social carbon cost (SCC) is the main cost component across all harvesting systems. The SCC is the economic value of the damage caused by emitting 1 t of additional CO2 to the atmosphere [27]. This compensates for the total worldwide consequences caused by CO2 emissions from anywhere in the world. Loss of grain during unit operations is also an indirect cost of each harvesting system. Table 9 summarizes the total costs required for the harvesting systems to harvest a 1 ha of paddy field, considering all the direct and indirect costs.

4. Discussion

4.1. Field Performance

The moisture contents of the plots (dry wt. basis) in which the paddy reaper and combine harvester were used were similar, but those in the manual harvesting plots were slightly higher, as shown in Table 3. The possible reason for this was the stoppage of the water supply to the fields a few days before harvesting with the reaper and combine harvester to provide favorable conditions for the efficient operation of the machines. All the other conditions checked during the experiment were similar among all the demarcated plots.
The field performance of the combine harvester and the paddy reaper of this study are shown in Table 4. The mean values of each performance category of combine harvester and paddy reaper were significantly different under the p < 0.05 significance level. The combine harvester has demonstrated a relatively higher field performance. The recommended operational speed for a self-propelled combine harvester is 3.0–6.5 kmh−1, and the field efficiency ranges from 60–75% [19]. A study conducted on the actual field speed of rice combine harvesters in Malaysia showed that the field speed of combine harvesters ranged from 3.87 kmh−1 to 6.11 kmh−1 [9]. Although the operational speed (0.82 ms−1/2.95 kmh−1) and the field efficiency (58.25%) of the combine harvester used in this study were below the acceptable ranges, they were still very close to the lower limits of the ranges. The operational speed of harvesting machinery is highly influenced by field conditions, such as the size and shape of the plot, density of the crop, conditions of the soil, and skill of the operator [17,22]. The effective field capacity of a combine harvester mainly depends on the width of the cutter bar, operational speed, and field conditions [28]. Wagiman et al. [29] has reported that effective field capacities of combine harvesters with 4.57 m and 2.48 m cutter bars were 1.3 hah−1 and 0.91 hah−1, respectively. According to the operational speed and the width of the cutter bar (1.98 m), the effective field capacity recorded by this study is acceptable. The smaller plot size may have affected the comparatively low efficiency of the combine harvester used in this study.
In this study, the effective field capacity recorded by the paddy reaper was 0.185 hah−1. It is acceptable as many previous studies have recorded approximately similar values. A study conducted in Bangladesh on the performance of paddy reapers revealed that the effective capacities of three types of paddy reapers varied from 0.15 hah−1 to 0.18 hah−1 [22]. Another study on paddy harvesting systems in Bangladesh showed that the effective capacities of two selected paddy reapers were 0.21 hah−1 and 0.24 hah−1 [13]. The effective field capacity is very important for determining the actual time required for the completion of a task in the field.
In the present study, the fuel consumption of the combine harvester and paddy reaper were recorded as 34.1 Lha−1 and 3.8 Lha−1, respectively. Islam et al. [17] showed that the fuel consumption of a Zoomlion combine harvester was 32 Lha−1. Several studies have shown highly variable fuel consumption of paddy reapers at 2.61 Lha−1, 3.19 Lha−1, 4.11 Lha−1, and 8.39 Lha−1 because fuel consumption is dependent on several factors, such as the engine power, crop density, and skill of the operator [13,22]. Therefore, the fuel consumption of the paddy reaper used in this study can be considered an average value. The output of the selected combine thresher was recorded as 1100 kgh−1. As the average paddy yield of Sri Lanka is 4795 kgha−1, the capacity of the combine thresher can be expressed as 0.23 hah−1. The fuel consumption of the diesel engine of the combine paddy thresher was recorded as 9.2 Lha−1. Therefore, the total fuel consumptions of CHP, RHP, and MHP were 34.1 Lha−1, 13 Lha−1, and 3.8 Lha−1, respectively. Higher fuel consumption has a negative impact on both the economy and the environment.
The field performance of any agricultural machinery is highly related to the durability and reliability of the technology used in the machine. Reliability is a measurable parameter, which represents the likelihood of failure not occurring during the designated period [30]. Since harvesting must be completed in due time, the reliability of machines is very important in harvesting. Following the recommended maintenance is one of the ways to improve the reliability of a machine, preventing unexpected downtime and failures [31]. During this study, no breakdown of any machinery was recorded.

4.2. Human Involvement, Mechanization Index (MI), and Time Consumption

The human labor involved in the harvesting systems is shown in Figure 5. The higher human involvement can increase the risk in agriculture and, if not managed properly, potentially result in higher time consumption and higher cost in agriculture. The performance of human labor may be different with their skillfulness. But in this study, performance was not checked with different skill levels. The highest labor consumption (233 man-hha−1) was recorded by the MHP while the lowest (9 man-hha−1) was recorded by the CHP. That is reflected by the highest mechanization index exhibited by the CHP. In the CHP, the three operations, cutting, threshing, and cleaning, are combined into a single machine, and therefore, it recorded the highest MI value. In the MHP, all the operations except threshing of the paddy were performed manually. Therefore, MHP recorded the lowest index (0.28) compared to the other systems. The mechanization index shown by the RHP was 0.52. In Malaysia, paddy farmers use self-propelled combine harvesters to harvest paddy, with a resultant mechanization index of 99.11% [3].
The total time consumption of a system is also related to the mechanization index. The total time consumption of manual and reaper harvesting systems were 76.05 hha−1 and 39.76 hha−1, respectively. According to the effective field capacity of the combine harvester, the total time needed to complete 1 ha of paddy field by the CHP was 2.94 h. Less time consumption for harvesting is important to prepare the field for the next season on time to avoid the unpredicted effects of adverse climatic conditions such as heavy rainfall and wind. In addition, the saved time can be allocated to other farming activities. According to the total time consumption of each harvesting system, by replacing the MHP and RHP with CHP, the total time consumed can be saved by 96.1% and 92.6%, respectively. A study conducted in Bangladesh revealed that the time-saving percentage of combine harvesters over manual harvesting was 97.5% [28]. By replacing manual cutting with the paddy reaper, 47.7% of the time can be saved. The time consumption of MHP and RHP can be reduced by deploying more laborers. However, labor shortages due to rapid industrialization and higher wages during peak demand periods are some of the challenges faced when attempting to increase the number of laborers in harvesting operations. Therefore, considering the availability of labor is very important when deciding on a semimechanical process for harvesting paddy. In some countries, farmers in rural areas practice labor exchange systems in which people in the village mutually help one another in manual operations such as harvesting [32].

4.3. Energy Consumption

According to Table 5 and Appendix A, although the CHP consumes the lowest human energy, it is the highest mechanical and fuel energy consumer. The total energy consumption of the CHP used herein was 1939.18 MJha−1, which is 2.46 times higher than that of RHP and 2.80 times higher than that of MHP. The MHP was the lowest energy consumer. Out of the total energy consumption of RHP, which was 787.73 MJha-1, 73% was derived from fuel energy. A study in Indonesia carried out to compare the total energy consumption of various harvesting techniques, showed that combine harvesting had a total energy consumption of 1552.16 MJha−1, while manual harvesting consumed 960.86 MJha−1 [12]. The reason for the different values is the different fuel consumption of machinery used in the studies.
The highest fuel energy consumption was reported in the CHP, and it was 77% of the total energy of the CHP. Fuel energy consumption brings many negative effects on the environment such as air pollution, water pollution, global warming, and resource depletion [33]. The highest human energy consumption was recorded by the MHP, and it was 207.28 MJha−1. The weight of the combine harvester in this study was nearly 25 times higher than the weight of the paddy reaper, and this higher weight accounted for the higher machinery energy in CHP.

4.4. Direct Costs of Harvesting

The total operational cost of harvesting in each system is the sum of the machinery and labor costs. The labor costs were calculated separately and added to each harvesting system according to the input of labor for each of the unit operations of the systems. The durations of machinery utilization were calculated according to their effective capacities (combine harvester—2.94 h, paddy reaper—5.41 h, and combine thresher—4.35 h). In this calculation, the mechanical straw collection process in the combine harvesting system was not considered.
According to Table 8, the highest cost can be observed in the MHP, and this cost is 1.64 times higher than that of the CHP and 1.59 times higher than that of the RHP. The higher human labor involvement in MHP is the reason for the high cost. Although the initial cost of purchasing a combine harvester is very high, its lower human involvement leads to a comparatively lower cost. Therefore, CHP can reduce the costs by 38.98% and 2.7% compared to the MHP and RHP, respectively. The reaper harvesting affords a 37.28% cost savings over manual harvesting. One study conducted in Bangladesh, with a minicombine harvester showed that the harvesting costs can be reduced by 52% compared to manual harvesting [34]. Another study [13] showed that minicombine harvesters and paddy reapers resulted in cost savings of 52% and 37%, respectively, over manual harvesting. In the current study, the labor charges, and the transportation distance of the paddy to the threshing field were considered to be 0.57 USDh−1 and 150 m, respectively, and the labor involvement and costs were computed accordingly. Therefore, the total cost and cost reduction percentages may vary from one study to another.

4.5. Availability of Rice Straw, GHG Emissions, and Indirect Costs

The availability of rice straw after harvesting is determined according to the threshing method, including stationary and mobile threshing, associated with the harvesting system. The stationary threshing operation associated with MHP and RHP gives a higher straw availability in these systems. During the CHP process, the mobile threshing mode results in the dispersion of the straw in the field. This gives several options for straw, such as collection, burning, or natural decomposition. Therefore, rice straw is not readily available in one place, and some additional energy is required to collect it. Although large-scale hay balers facilitate rice straw collection in the field, the cost of operation is approximately 88.13 USDha−1 (26,439 LKRha−1), as the energy requirement varies between 2.16 and 3.60 MJt−1 and the fuel consumption varies between 8.5 and 11.0 Lha−1 [35].
The CHP is the highest contributor to GHG among the harvesting systems considered here. The total amount of GHG emitted by the CHP, including the emissions from both fuel and machinery used for the collection of straw, was 176.29 kgCO2eqha−1. The mechanical collection of straw in CHP accounts for 36% of the total amount of GHG. However, mechanical straw collection provides an option to compress rice straw, facilitating its transportation, storage, and other management practices [36]. Since CHP consumes more fuel than the other harvesting systems, it accounts for higher GHG emissions. The lowest GHG emissions (32.94 kgCO2eqha−1) were seen in the MHP, as most of the operations in the MHP are performed manually. The total emission of the RHP was 46.2 kgCO2eqha−1 and the contribution of the threshing operation was 71.3%. According to US federal estimations, the SCC value is 51 USDt−1 of carbon dioxide. However, a recent comprehensive study revealed that the actual SCC value is three times higher than the US federal estimated value, and it could be as high as 185 USDt−1 of carbon dioxide [37]. When considering an average SCC value (118 USDt−1 of carbon dioxide), the CHP with mechanical collection of rice straw accounted for 20.8 USDha−1 of social carbon costs, while the MHP and RHP accounted for USD 3.89 and USD 5.45, respectively.
Considering the price of raw paddy is 0.2 USDkg−1, the costs due to the grain loss per hectare of field of MHP, RHP, and CHP are 25.40 USDha−1, 23.96 USDha−1, and 6.80 USDha−1, respectively. According to Table 8 and Appendix B, the lowest grain loss was recorded by CHP while MHP recorded the highest.
The cost of the mechanical collection of rice straw when using CHP is an additional indirect cost. It is estimated at 88.31 USDha−1 [35]. This cost component is not relevant to MHP and RHP, as all the rice straw is collected at the threshing field in one place. However, mechanical straw collection provides an option to compress rice straw, facilitating its transportation, storage, and other management practices. Even though the CHP recorded the lowest direct cost, it resulted in the highest total cost due to the indirect cost component.

5. Conclusions

This study evaluated three paddy harvesting systems, manual harvesting (MHP), reaper harvesting (RHP), and combine harvesting (CHP), considering their field performance, energy consumption, direct and indirect costs, greenhouse gas (GHG) emissions, and availability of residual biomass. The following conclusions are outlined to compare the three paddy harvesting systems:
(1)
CHP showed the highest field performance, lowest direct cost, lowest time consumption, lowest human input, and highest mechanization index (MI), making it the most suitable option for large-scale fields. Higher field performance and lower time consumption of CHP are mainly due to its higher MI. Integrating a rice straw compression mechanism is an alternative to reduce the indirect costs of combine harvesting to obtain maximum advantages of residual biomass while minimizing GHG emissions.
(2)
MHP was the most environment-friendly option with the highest availability of rice straw and lowest indirect cost, but the direct cost and time consumption were very high due to its lowest mechanization index and higher human involvement. RHP showed intermediate performance in all the considered aspects, providing equal availability of rice straw as MHP.
(3)
RHP exhibited a lower indirect cost showing good environmental friendliness and it is close to that of the MHP, which recorded the lowest indirect cost.
Excessive mechanization of agriculture in regions where farmlands are not well developed can ultimately result in negative economic and environmental consequences. Therefore, when the field size is relatively small and the available human labor is relatively high, RHP is the best option to have long-term environmental sustainability along with intermediate field performance. However, higher field performance is very important to reduce time consumption and operational costs. Therefore, attention should be given to introducing an intermediate level of mechanization with satisfactory field performance while keeping costs and environmental impact at a reasonable level.

Author Contributions

Conceptualization, P.D.K. and R.N.; methodology, P.D.K., R.I. and R.N.; software, P.D.K., N., S.D.S.P. and R.A.; validation, P.D.K. and R.N.; formal analysis, P.D.K., N., S.D.S.P. and R.A.; investigation, P.D.K., S.D.S.P., E.J.K. and G.V.T.V.W.; resources, P.D.K., E.J.K. and G.V.T.V.W.; data curation, P.D.K. and R.N.; writing—original draft preparation, P.D.K.; writing—review and editing, R.N., T.A. and R.I.; visualization, P.D.K., S.D.S.P. and N.; supervision, R.N. and T.A. All authors have read and agreed to the published version of the manuscript.

Funding

This research received no external funding.

Data Availability Statement

Not applicable.

Acknowledgments

The authors would like to thank NG Sriyani, MF Sadika, EC Mahesika, LSB Dhanapala, S Karthigayini, and MDP Naynaragani regarding support for field experiments.

Conflicts of Interest

The authors declare no conflict of interest.

Abbreviations

AArea
AFAmount of fuel
ALqAverage loss within quadrant
BDBulk density
CEFCarbon dioxide emission from fuel
CEMCarbon dioxide emission from machine
CHPCombine harvesting of paddy
CO2eqCarbon dioxide equivalent
CWCutting width
DDepreciation
EFCEffective field capacity
FCFuel energy conversion coefficient
FeField efficiency
FEFuel energy
FSForward speed
GHGGreenhouse gas
GLGrain loss
GWPGlobal warming potential
hHour
haHectare
HCEnergy conversion coefficient for human labor
HEHuman energy
IInterest
iInterest rate
LLiter
LTLifetime
MCMoisture content
MEMechanical energy
MECEnergy conversion coefficient
MHPManual Harvesting of paddy
MIMechanical index
NLqNatural loss of grain within quadrant
PValue at purchasing
RFRainfall
RHRelative humidity
RHPReaper harvesting of paddy
SSalvage value
TTemperature
tTime
TEITotal energy input
TFCTheoretical field capacity
USDUnited states dollar
WWeight
WVWind velocity

Appendix A

Appendix A.1. Statistical Analysis of Energy Consumption of Harvesting Systems

1-MHP, 2-RHP, 3-CHP.

Appendix A.1.1. Human Energy—HE

Table A1. Tests of Between-Subjects Effects (ANOVA_Dependent Variable: HE).
SourceType III Sum of SquaresdfMean SquareFSig.
Corrected Model99,401.726 a249,700.86324,473.8200.000
Intercept167,174.3181167,174.31882,320.3850.000
MH99,401.726249,700.86324,473.8200.000
Error24.369122.031
Total266,600.41315
Corrected Total99,426.09514
a R Squared = 1.000 (Adjusted R Squared = 1.000).
Table A2. Multiple comparisons (LSD—Dependent Variable: HE).
(I) MH(J) MHMean Difference (I-J)Std. ErrorSig.95% Confidence Interval
Lower BoundUpper Bound
1.002.00105.8660 *0.901280.000103.9023107.8297
3.00199.2710 *0.901280.000197.3073201.2347
2.001.00−105.8660 *0.901280.000−107.8297−103.9023
3.0093.4050 *0.901280.00091.441395.3687
3.001.00−199.2710 *0.901280.000−201.2347−197.3073
2.00−93.4050 *0.901280.000−95.3687−91.4413
The error term is Mean Square (Error) = 2.031. * The mean difference is significant at the 0.05 level.

Appendix A.1.2. Machinery Energy—ME

Table A3. Tests of Between-Subjects Effects (ANOVA_Dependent Variable: ME).
SourceType III Sum of SquaresdfMean SquareFSig.
Corrected Model382,034.616 a2191,017.3082151.4530.000
Intercept651,758.5311651,758.5317340.8400.000
MH382,034.6162191,017.3082151.4530.000
Error1065.4231288.785
Total1,034,858.56915
Corrected Total383,100.03914
a R Squared = 0.997 (Adjusted R Squared = 0.997).
Table A4. Multiple comparisons (LSD—Dependent Variable: HE).
(I) MH(J) MHMean Difference
(I-J)
Std. ErrorSig.95% Confidence Interval
Lower BoundUpper Bound
1.002.00−32.6040 *5.959370.000−45.5884−19.6196
3.00−353.6640 *5.959370.000−366.6484−340.6796
2.001.0032.6040 *5.959370.00019.619645.5884
3.00−321.0600 *5.959370.000−334.0444−308.0756
3.001.00353.6640 *5.959370.000340.6796366.6484
2.00321.0600 *5.959370.000308.0756334.0444
Based on observed means. The error term is Mean Square (Error) = 88.785. * The mean difference is significant at the 0.05 level.

Appendix A.1.3. Fuel Energy—FE

Table A5. Tests of Between-Subjects Effects (ANOVA_Dependent Variable: FE).
SourceType III Sum of SquaresdfMean SquareFSig.
Corrected Model3.465 × 10621,732,464.71711,232.9700.000
Intercept1.022 × 10711.022 × 10766,236.2960.000
MH3,464,929.43321,732,464.71711,232.9700.000
Error1850.76412154.230
Total1.368 × 10715
Corrected Total3,466,780.19714
R Squared = 0.999 (Adjusted R Squared = 0.999).
Table A6. Multiple comparisons (LSD—Dependent Variable: FE).
(I) MH(J) MHMean Difference (I-J)Std. ErrorSig.95% Confidence Interval
Lower BoundUpper Bound
1.002.00−170.1000 *7.854430.000−187.2133−152.9867
3.00−1093.9000 *7.854430.000−1111.0133−1076.7867
2.001.00170.1000 *7.854430.000152.9867187.2133
3.00−923.8000 *7.854430.000−940.9133−906.6867
3.001.001093.9000 *7.854430.0001076.78671111.0133
2.00923.8000 *7.854430.000906.6867940.9133
The error term is Mean Square (Error) = 154.230. * The mean difference is significant at the 0.05 level.

Appendix A.1.4. Total Energy—TE

Table A7. Tests of Between-Subjects Effects (ANOVA_Dependent Variable: TE).
SourceType III Sum of SquaresdfMean SquareFSig.
Corrected Model4.822 × 10622,411,218.0247725.9410.000
Intercept1.947 × 10711.947 × 10762,382.1360.000
MH4,822,436.04922,411,218.0247725.9410.000
Error3745.12512312.094
Total2.430 × 10715
Corrected Total4,826,181.17414
R Squared = 0.999 (Adjusted R Squared = 0.999).
Table A8. Multiple comparisons (LSD—Dependent Variable: TE).
(I) MH(J) MHMean Difference
(I-J)
Std. ErrorSig.95% Confidence Interval
Lower BoundUpper Bound
1.002.00−96.8380 *11.173070.000−121.1820−72.4940
3.00−1248.2930 *11.173070.000−1272.6370−1223.9490
2.001.0096.8380 *11.173070.00072.4940121.1820
3.00−1151.4550 *11.173070.000−1175.7990−1127.1110
3.001.001248.2930 *11.173070.0001223.94901272.6370
2.001151.4550 *11.173070.0001127.11101175.7990
The error term is Mean Square (Error) = 312.094. * The mean difference is significant at the 0.05 level.

Appendix A.1.5. Mechanization Index—MI

Table A9. Tests of Between-Subjects Effects (ANOVA_Dependent Variable: MI).
SourceType III Sum of SquaresdfMean SquareFSig.
Corrected Model1.277 a20.6387975.4410.000
Intercept5.30915.30966,332.4270.000
MH1.27720.6387975.4410.000
Error0.001128.003 × 10−5
Total6.58615
Corrected Total1.27814
a R Squared = 0.999 (Adjusted R Squared = 0.999).
Table A10. Multiple comparisons (LSD—Dependent Variable: MI).
(I) MH(J) MHMean Difference (I-J)Std. ErrorSig.95% Confidence Interval
Lower BoundUpper Bound
1.002.00−0.2481 *0.005660.000−0.2604−0.2357
3.00−0.7044 *0.005660.000−0.7167−0.6921
2.001.000.2481 * 0.005660.0000.23570.2604
3.00−0.4563 *0.005660.000−0.4687−0.4440
3.001.000.7044 *0.005660.0000.69210.7167
2.000.4563 *0.005660.0000.44400.4687
The error term is Mean Square (Error) = 8.00 × 10⁻⁵. * The mean difference is significant at the 0.05 level.

Appendix B

Appendix B.1. Statistical Analysis of Grain Losses of Harvesting Systems

1-MHP, 2-RHP, 3-CHP.

Appendix B.1.1. Grain Losses at Cutting Operation—CUT GL

Table A11. Tests of Between-Subjects Effects (ANOVA_Dependent Variable: CUT GL).
SourceType III Sum of SquaresdfMean SquareFSig.
Corrected Model606.060 a2303.0303178.6360.000
Intercept4846.94414846.94450,842.0740.000
PHM606.0602303.0303178.6360.000
Error0.57260.095
Total5453.5769
Corrected Total606.6328
a R Squared = 0.999 (Adjusted R Squared = 0.999).
Table A12. Multiple comparisons (LSD—Dependent Variable: CUT GL).
(I) PHM(J) PHMMean Difference (I-J)Std. ErrorSig.95% Confidence Interval
Lower BoundUpper Bound
126.9000 *0.252100.0006.28317.5169
3−12.9000 *0.252100.000−13.5169−12.2831
21−6.9000 *0.252100.000−7.5169−6.2831
3−19.8000 *0.252100.000−20.4169−19.1831
3112.9000 *0.252100.00012.283113.5169
219.8000 *0.252100.00019.183120.4169
The error term is Mean Square (Error) = 0.095. * The mean difference is significant at the 0.05 level.

Appendix B.1.2. Grain Loss Percentage—Perce GL

Table A13. Tests of Between-Subjects Effects (ANOVA_Dependent Variable: Perce GL).
SourceType III Sum of SquaresdfMean SquareFSig.
Corrected Model6.990 a 23.495606.0870.000
Intercept34.340134.3405954.8440.000
PHM6.99023.495606.0870.000
Error0.03560.006
Total41.3649
Corrected Total7.0258
a R Squared = 0.995 (Adjusted R Squared = 0.993).
Table A14. Multiple comparisons (LSD—Dependent Variable: Perce GL).
(I) PHM(J) PHMMean Difference (I-J)Std. ErrorSig.95% Confidence Interval
Lower BoundUpper Bound
120.15000.062000.052−0.00170.3017
31.9400 *0.062000.0001.78832.0917
21−0.15000.062000.052−0.30170.0017
31.7900 *0.062000.0001.63831.9417
31−1.9400 *0.062000.000−2.0917−1.7883
2−1.7900 *0.062000.000−1.9417−1.6383
The error term is Mean Square (Error) = 0.006. * The mean difference is significant at the 0.05 level.

References

  1. Mohidem, N.A.; Hashim, N.; Shamsudin, R.; Man, H.C. Rice for Food Security: Revisiting Its Production, Diversity, Rice Milling Process and Nutrient Content. Agriculture 2022, 12, 741. [Google Scholar] [CrossRef]
  2. Chandrajith, U.G.; Gunathilake, D.M.C.C.; Bandara, B.D.M.P.; Swarnasiri, D.P.C. Effects of Combine Harvesting on Head Rice Yield and Chaff Content of Long and Short Grain Paddy Harvest in Sri Lanka. Procedia Food Sci. 2016, 6, 242–245. [Google Scholar] [CrossRef] [Green Version]
  3. Muazu, A.; Yahya, A.; Ishak, W.I.W.; Khairunniza-Bejo, S. Machinery Utilization and Production Cost of Wetland, Direct Seeding Paddy Cultivation in Malaysia. Agric. Agric. Sci. Procedia 2014, 2, 361–369. [Google Scholar] [CrossRef] [Green Version]
  4. Gummert, M. When to Harvest—IRRI Rice Knowledge Bank. Available online: http://www.knowledgebank.irri.org/training/fact-sheets/item/when-to-harvest-fact-sheet (accessed on 14 August 2022).
  5. Mafakheri, F.; Nasiri, F. Modeling of biomass-to-energy supply chain operations: Applications, challenges and research directions. Energy Policy 2014, 67, 116–126. [Google Scholar] [CrossRef]
  6. Harun, S.N.; Hanafiah, M.M.; Aziz, N.I.H.A. An LCA-Based Environmental Performance of Rice Production for Developing a Sustainable Agri-Food System in Malaysia. Environ. Manag. 2021, 67, 146–161. [Google Scholar] [CrossRef]
  7. Jiang, M.; Hu, X.; Chunga, J.; Lin, Z.; Fei, R. Does the popularization of agricultural mechanization improve energy-environment performance in China’s agricultural sector? J. Clean. Prod. 2020, 276, 124210. [Google Scholar] [CrossRef]
  8. Lampridi, M.; Kateris, D.; Sørensen, C.G.; Bochtis, D. Energy footprint of mechanized agricultural operations. Energies 2020, 13, 769. [Google Scholar] [CrossRef] [Green Version]
  9. Mokhtor, S.A.; El Pebrian, D.; Johari, N.A.A. Actual field speed of rice combine harvester and its influence on grain loss in Malaysian paddy field. J. Saudi Soc. Agric. Sci. 2020, 19, 422–425. [Google Scholar] [CrossRef]
  10. Alam, S.; Rashedujjaman, M.; Hossain, M.; Hossain, K. Comparative Harvesting and Threshing Cost of Paddy by Combine Harvester and Self-propelled Reaper and Thresher. J. Environ. Sci. Nat. Resour. 2017, 10, 133–136. [Google Scholar] [CrossRef] [Green Version]
  11. Nadeem, M.; Ghani, M.U. Cost Analysis of Engine Operated Reaper and Its Comparison. J. Glob. Agric. Soc. Sci. 2018, 6, 2312–5225. [Google Scholar]
  12. Putri, R.E.; Santosa; Cahyani, G.A.; Fahmy, K.; Arlius, F.; Hasan, A. Comparison of Performance and Total Energy Requirement for Several Harvesting Method of Indonesian Farmers. IOP Conf. Ser. Earth Environ. Sci. 2020, 515, 012004. [Google Scholar] [CrossRef]
  13. Hasan, M.; Ali, M.; Saha, C.; Alam, M.; Hossain, M. Assessment of paddy harvesting practices of Southern Delta Region in Bangladesh. Progress. Agric. 2019, 30, 57–64. [Google Scholar] [CrossRef] [Green Version]
  14. Abeyrathna, R.M.R.D.; Nakaguchi, V.M.; Minn, A.; Ahamed, T. Recognition and Counting of Apples in a Dynamic State Using a 3D Camera and Deep Learning Algorithms for Robotic Harvesting Systems. Sensors 2023, 23, 3810. [Google Scholar] [CrossRef]
  15. Huang, Y.; Fu, J.; Xu, S.; Han, T.; Liu, Y. Research on Integrated Navigation System of Agricultural Machinery Based on RTK-BDS/INS. Agriculture 2022, 12, 1169. [Google Scholar] [CrossRef]
  16. Hasan, M.K.; Tanaka, T.S.T.; Alam, M.M.; Ali, M.R.; Saha, C.K. Impact of modern rice harvesting practices over traditional ones. Rev. Agric. Sci. 2020, 8, 89–108. [Google Scholar] [CrossRef] [PubMed]
  17. Islam, A.K.M.S.; Alam, M.A.; Ashik-E-Rabbani, M.; Bashir, M.S.; Rahman, M.M. Techno-Economic Feasibility of Zoomlion Combine Harvester in Haor Areas of Bangladesh. Agric. Sci. 2020, 11, 1170–1185. [Google Scholar] [CrossRef]
  18. Elsoragaby, S.; Yahya, A.; Mahadi, M.R.; Nawi, N.M.; Mairghany, M. Comparative field performances between conventional combine and mid-size combine in wetland rice cultivation. Heliyon 2019, 5, 1427. [Google Scholar] [CrossRef] [Green Version]
  19. ASAE Standards. ASAE D497.4 Agricultural Machinery Management Data; American Society of Agricultural Engineers: St. Joseph, MI, USA, 2000; Volume 85. [Google Scholar]
  20. Eurostat. Energy Balance Guide Methodology Guide for the Construction of Energy Balances & Operational Guide for the Energy Balance Builder Tool; European Commission: Ljubljana, Slovenia, 2019.
  21. Quilty, J.R.; McKinley, J.; Pede, V.O.; Buresh, R.J.; Correa, T.Q.; Sandro, J.M. Energy efficiency of rice production in farmers’ fields and intensively cropped research fields in the Philippines. Field Crop. Res. 2014, 168, 8–18. [Google Scholar] [CrossRef]
  22. Alam, M.A.; Hossen, A.; Islam, A.S.; Alam, M. Performance evaluation of power-operated reapers for harvesting rice at farmers’ field. J. Bangladesh Agric. Univ. 2018, 16, 144–150. [Google Scholar] [CrossRef] [Green Version]
  23. Edwards, W. Estimating Farm Machinery Costs. Available online: https://www.extension.iastate.edu/agdm/crops/html/a3-29.html (accessed on 18 August 2022).
  24. Schuler, R.T.; Frank, G.G. Estimating Agricultural Field Machinery Costs. Agric. Bull. Rm. 2010, 30, 1–12. [Google Scholar]
  25. Nabavi-Pelesaraei, A.; Abdi, R.; Rafiee, S. Neural network modeling of energy use and greenhouse gas emissions of watermelon production systems. J. Saudi Soc. Agric. Sci. 2016, 15, 38–47. [Google Scholar] [CrossRef] [Green Version]
  26. EIA Carbon Dioxide Emissions Coefficients. Available online: https://www.eia.gov/environment/emissions/co2_vol_mass.php (accessed on 22 August 2022).
  27. Bergh, J.V.D.; Botzen, W. Monetary valuation of the social cost of CO2 emissions: A critical survey. Ecol. Econ. 2015, 114, 33–46. [Google Scholar] [CrossRef]
  28. Hossain, M.; Hoque, M.; Wohab, M.; Miah, M.M.; Hassan, M. Technical and economic performance of combined harvester in farmers’ field. Bangladesh J. Agric. Res. 2015, 40, 291–304. [Google Scholar] [CrossRef]
  29. Wagiman, N.A.; Nawi, N.M.; Yahya, A.; Su, A.S.M.; Nasir, R.M. Field performance comparison of the combine harvesters utilized for rice harvesting in Malaysia. Food Res. 2019, 3, 177–181. [Google Scholar] [CrossRef] [PubMed]
  30. Durczak, K.; Rybacki, P.; Sujak, A. Application of a Selected Pseudorandom Number Generator for the Reliability of Farm Tractors. Appl. Sci. 2022, 12, 12452. [Google Scholar] [CrossRef]
  31. Kutelia, G.; Abuladze, I.; Beridze, G. Improving the Reliability of Agricultural Machinery, Using the Method of Restoration of Parts Under Submerged Arc Welding, and Its Technical and Economic Evaluation. Int. Sci. J. Sci. Tech. Union Mech. Eng. 2017, 310, 307–310. [Google Scholar]
  32. Tshotsho; Lippert, C.; Feuerbacher, A. Organic agriculture, labour exchange, and social networks: A case study of smallholder farming in Bhutan. Org. Agric. 2023, 13, 83–98. [Google Scholar] [CrossRef]
  33. Martins, F.; Felgueiras, C.; Smitkova, M.; Caetano, N. Analysis of fossil fuel energy consumption and environmental impacts in european countries. Energies 2019, 12, 964. [Google Scholar] [CrossRef] [Green Version]
  34. Rostom, A.; Hasan, K.; Saha, C.K.; Alam, M.; Kalita, P.K.; Hansen, A.C. Mechanized rice harvesting opportunity in Southern delta of Bangladesh. In Proceedings of the 2017 ASABE Annual International Meeting, St. Joseph, MI, USA, 15–19 July 2017. [Google Scholar]
  35. Lohan, S.K.; Jat, H.S.; Yadav, A.K.; Sidhu, H.S.; Jat, M.L.; Choudhary, M.; Peter, J.K.; Sharma, P.C. Burning issues of paddy residue management in north-west states of India. Renew. Sustain. Energy Rev. 2018, 81, 693–706. [Google Scholar] [CrossRef]
  36. Awad, M.; Fouda, O.; Fathy, W.; El Balkemy, W.; Egela, M.; El-Fakhrany, W.; Okasha, M. A combined machine for collecting and chopping rice straw. Heliyon 2022, 8, e10412. [Google Scholar] [CrossRef]
  37. Rennert, K.; Errickson, F.; Prest, B.C.; Rennels, L.; Newell, R.G.; Pizer, W.; Kingdon, C.; Wingenroth, J.; Cooke, R.; Parthum, B.; et al. Comprehensive evidence implies a higher social cost of CO2. Nature 2022, 610, 687–692. [Google Scholar] [CrossRef] [PubMed]
Figure 1. Major components and the material flow of a typical combine thresher.
Processes 11 01851 g001
Figure 2. Major components of a typical paddy reaper.
Processes 11 01851 g002
Figure 3. Major components and material flow of a typical combine harvester.
Processes 11 01851 g003
Figure 4. The study location and a view of the experimental field.
Processes 11 01851 g004
Figure 5. Human involvement in all the units of operation of the three harvesting systems.
Processes 11 01851 g005
Figure 6. Greenhouse gas emissions of harvesting systems including the straw collection operation.
Processes 11 01851 g006
Table 1. Specifications of the selected combine harvester, paddy reaper, and combine thresher.
Type of MachineSpecifications
Power Output (hp)Cutting Width/Threshing Drum Width (m)Weight (kg)Fuel TypeCapacity of Grain Tank (L)
Combine harvester681.983200Diesel1250
Paddy reaper2.71.2130Gasoline-
Combine thresher100.9400Diesel-
Table 2. Parameters and values considered in the calculation of costs.
ParameterUnitPaddy ReaperCombine HarvesterCombine Thresher
Purchase priceUSD1142.8614,257.141000
Salvage valueUSD114.281425.71100
Expected lifeYears101010
Annual working timeh300300300
Interest rate%121212
Labor chargesUSDh−10.570.570.57
Fuel priceUSDL−11.54 (Gasoline)1.23 (Diesel)1.23 (Diesel)
Table 3. Field conditions of the experimental plots.
ParameterMHPRHPCHP
Avg.Max.Min.Avg.Max.Min.Avg.Max.Min.
MC (%)15.9620.4713.3113.3814.1612.313.3915.8411.73
BD (gcm−3)1.191.221.151.131.21.031.121.160.95
T (°C)353634343433353633
RH (%)555753555753596156
RF (mm)000000000
WV (kmh−1)24.6526.8122.3124.1526.5621.2526.427.3724.31
Avg.—Average, Max.—Maximum, Min.—Minimum, MHP—Plot of manual harvesting, RHP—Plot of reaper harvesting, CHP—Plot of combine harvesting.
Table 4. Average forward speed, theoretical field capacity, effective field capacity, field efficiency, and fuel consumption of the combine harvester and paddy reaper.
Type of MachineFS (ms−1)TFC (hah−1)EFC (hah−1)Fe (%)AF (lha −1)
Combine harvester0.82 a0.584 a0.340 a58.23 a34.1 a
(0.009)(0.006)(0.005)(1.056)(0.172)
Paddy reaper0.70 b0.304 b0.185 b60.85 b3.8 b
(0.01)(0.004)(0.001)(0.456)(0.096)
(Means in the same columns followed by different letters are significantly different at p ≤ 0.05, Parenthesis indicates Standard Error of the Mean, SEM).
Table 5. Energy consumption and mechanization indices of harvesting systems.
Harvesting MethodHE
(MJha−1)
ME
(MJha−1)
FE
(MJha−1)
Total Energy (MJha−1)Mechanization Index (MI)
MHP207.28 a79.69 a403.92 a690.89 a0.28 a
(0.77)(2.76)(3.23)(6.07)(0.0006)
RHP 101.41 b112.29 b574.02 b787.73 b0.52 b
(0.44)(0.23)(5.01)(4.75)(0.0015)
CHP8.01 c433.35 c1497.82 c1939.18 c0.98 c
(0.19)(6.75)(7.54)(11.30)(0.0006)
(Means in the same columns followed by different letters are significantly different at p ≤ 0.05, Parenthesis indicates Standard Error of the Mean, SEM).
Table 6. Cost of machinery operation for 1 h.
Cost ComponentUnitPaddy ReaperCombine HarvesterCombine Thresher
DepreciationUSDh−10.344.280.30
InterestUSDh−10.050.630.04
Housing, taxes, and insuranceUSDh−10.080.950.07
Fuel costUSDh−11.0814.262.60
Lubrication costUSDh−10.162.140.39
Repair and maintenance USDh−10.577.130.50
Total costUSDh−12.2929.383.90
Table 7. Total operational cost of harvesting systems.
Harvesting MethodCost of Machinery (USDha−1)Labor Cost (USDha−1)Total Cost (USDha−1)
MHP16.97133.00149.97
RHP 29.3664.7094.06
CHP86.385.1391.51
Table 8. Loss of grain during each unit of operation and loss percentage of harvesting systems.
Harvesting SystemGrain Loss at the Field (kgha−1)Grain Loss Percentage (%)
CuttingCollecting and TransportingCombine Threshing
MHP21.2 a22.4 a83.4 a2.65 a
(0.25)(0.02)(0.24)(0.03)
RHP14.3 b22.4 a83.4 a2.50 a
(0.06)(0.04)(0.17)(0.04)
CHP34.1 c--0.71 b
(0.16)(0.04)
(Means in the same columns followed by different letters are significantly different at p ≤ 0.05, Parenthesis indicate Standard Error of the Mean, SEM).
Table 9. Total cost (direct + indirect) of harvesting systems.
Cost ComponentMHPRHPCHP
Direct cost (USD)
Machinery cost16.9729.3686.38
Labor cost133.0064.705.13
Indirect cost (USD)
SCC3.895.4520.80
Grain loss25.4023.966.80
Straw collection--88.31
Total179.26123.47207.42
Disclaimer/Publisher’s Note: The statements, opinions and data contained in all publications are solely those of the individual author(s) and contributor(s) and not of MDPI and/or the editor(s). MDPI and/or the editor(s) disclaim responsibility for any injury to people or property resulting from any ideas, methods, instructions or products referred to in the content.

