Article

LC-ESI-QTOF-MS/MS Characterization of Phenolic Compounds in Common Commercial Mushrooms and Their Potential Antioxidant Activities

1
School of Agriculture, Food and Ecosystem Sciences, Faculty of Science, The University of Melbourne, Melbourne, VIC 3010, Australia
2
Department of Pharmacognosy, Faculty of Pharmacy, Suleyman Demirel University, Isparta 32000, Türkiye
3
Centre for Chemistry and Biotechnology, School of Life and Environmental Sciences, Deakin University, Waurn Ponds, Geelong, VIC 3217, Australia
4
Faculty of Biological Sciences, The University of Leeds, Leeds LS2 9JT, UK
*
Author to whom correspondence should be addressed.
Processes 2023, 11(6), 1711; https://doi.org/10.3390/pr11061711
Submission received: 8 May 2023 / Revised: 26 May 2023 / Accepted: 1 June 2023 / Published: 3 June 2023
(This article belongs to the Special Issue Extraction and Purification of Bioactive Compounds)

Abstract

:
Mushrooms have a long history of use as food and medicine. They are rich in various nutrients and bioactive compounds, particularly phenolic compounds. In this study, ten mushroom species were selected, and solvent extraction using 80% ethanol was used to extract phenolic compounds. Total phenolic content (TPC), total flavonoid content (TFC) and total condensed tannin content (TCT) were measured to evaluate phenolic content in different mushroom varieties. In the mushroom varieties tested, brown portobello mushroom had the highest TPC (396.78 ± 3.12 µg GAE/g), white cup mushroom exhibited the highest TFC (275.17 ± 9.40 μg CE/g), and shiitake mushroom presented the highest TCT (13.80 ± 0.21 µg QE/g). Antioxidant capacity was evaluated using 2,2-diphenyl-1-picrylhydrazyl (DPPH), ferric reducing antioxidant power (FRAP), 2,2′-azino-bis-3ethylbenzothiazoline-6-sulfonic acid (ABTS) and total antioxidant capacity (TAC) assays. The highest DPPH free radical scavenging ability was found in white cup mushroom (730.14 ± 55.06 µg AAE/g), while the greatest iron-reducing ability (FRAP) was recorded for shiitake mushroom (165.32 ± 10.21 μg AAE/g). Additionally, Swiss brown mushroom showed the highest ABTS antioxidant capacity (321.31 ± 5.7 μg AAE/g), and the maximum TAC value was found in shiitake mushroom (24.52 ± 1.2 μg AAE/g). These results highlight that most of the mushroom varieties studied showed high phenolic contents and demonstrated strong antioxidant activity, with shiitake mushrooms standing out due to their high TCT and FRAP values, and the highest TAC value among the varieties studied. In addition, LC-ESI-QTOF-MS/MS was used to characterize the mushroom samples, and tentatively identified a total of 22 phenolic compounds, including 11 flavonoids, 4 lignans, 3 phenolic acids, 2 stilbenes and 2 other phenolic compounds in all mushroom samples. The research results of this study showed that mushrooms are a good source of phenolic compounds with strong antioxidant potential. The results can provide a scientific basis for the development of mushroom extracts in functional food, health products, and other industries.

1. Introduction

Mushrooms are a common type of fungi found in nature and are one of the most widely consumed foods worldwide. They are popular for their unique flavor, rich nutritional value, and extensive commercial cultivation. According to a report by Expert Market Research (2023), the global mushroom market reached USD 54 billion in 2020. The market is expected to grow at a Compound Annual Growth Rate (CAGR) of 8%, in the forecast period of 2023–2028, to reach a value of USD 86 billion by 2026 [1].
The nutritional value of mushrooms has been extensively studied. In recent years, evidence has shown that mushrooms can reduce the risk of certain chronic diseases, including cancer, cognitive impairment, inflammatory bowel disease, and metabolic-related diseases [2]. The benefit of mushrooms is that they are rich in bioactive compounds, such as vitamins (vitamin B and vitamin D), minerals (selenium, phosphorus, and copper), and polysaccharides (β-glucans) [3]. Moreover, Kalaras et al. showed that mushrooms rich in endogenous ergosterol, which is converted to vitamin D2 (ergocalciferol) under sunlight or ultraviolet radiation, are a good source of vitamin D2 [4]. In recent years, researchers have become increasingly interested in studying the antioxidant properties of mushrooms. Some studies have shown that mushrooms are capable of accumulating secondary metabolites, such as phenolic compounds, carotenoids, and steroids, which give them potent antioxidant properties [5,6]. For instance, Barros et al. detected a variety of phenolic acids, such as protocatechuic acid, p-hydroxybenzoic acid, p-coumaric acid, and vanillic acid, in 16 different wild mushrooms from Portugal [7].
Polyphenols are important secondary metabolites in the plant kingdom. They can be classified into the following four categories based on their structure: flavonoids, phenolic acids, stilbenes, and lignans [8]. Polyphenols are known for their strong antioxidant properties. They have the capacity to inhibit lipoxygenase, chelate metals, and scavenge free radicals [9,10]. In addition, polyphenols play a defensive role in plants and are important substances with antibacterial, antiviral, and antifungal activities [11]. There are many methods for extracting polyphenols from food, with the most common being the traditional solvent extraction method. In addition, new extraction technologies, including pressurized liquid extraction, ultrasound-assisted extraction, microwave extraction, and supercritical fluid extraction, have also been gradually applied to polyphenol extraction [12]. To evaluate the amount of polyphenolic compounds in food, it is useful to measure the contents of total phenols, total flavonoids, and total tannins concurrently. Assays used to identify the potential antioxidant activity of polyphenol compounds in food typically involve free radical scavenging assays, such as ABTS (2,2′-azinobis-(3-ethylbenzothiazoline-6-sulfonic acid)) and DPPH (2,2-diphenyl-1-picrylhydrazyl), as well as TAC (total antioxidant capacity) and FRAP (ferric reducing antioxidant power) assays. Due to the wide variety and complex structures of polyphenol compounds, the liquid chromatography–electrospray ionization quadrupole time-of-flight mass spectrometry (LC-ESI-QTOF-MS/MS) method is commonly used to tentatively characterize extracts [13].
While some studies have explored the antioxidant properties of mushrooms, the majority have focused on the antioxidant properties of multiple wild mushroom species or a single species of cultivated mushrooms. As a result, there is still a significant research gap in the comprehensive analysis and comparative discussion of phenolic compounds across a variety of commercially cultivated mushrooms. This article explores the diverse phytochemicals found in mushrooms, including nutrients, phenolic compounds, and their biological activities, as well as the potential commercial applications of mushroom polyphenols. To this end, the study selected 10 common commercial mushrooms in the Australian market to extract phenolic compounds. Various methods were used to determine the phenolic compound content in mushroom samples and evaluate their antioxidant capacity. The study also tentatively characterized the phenolic compounds in mushrooms using LC-ESI-QTOF-MS/MS, a powerful analytical technique used to identify and characterize phenolic compounds in food samples [14]. It can detect a wide variety of phenolic compounds, including phenolic acids, flavonoids, lignans, stilbenes, and other polyphenols [15]. The goal of this study was to comprehensively compare the phenolic compound content and potential antioxidant capacity of common commercial mushroom varieties in the Australian market. The findings can help optimize their utilization and development for commercial applications.

2. Materials and Methods

2.1. Chemical and Reagents

Almost all of the chemicals used for sample extraction and characterization were of analytical grade and obtained from Sigma Aldrich (Castle Hill, NSW, Australia). Quercetin, catechin, gallic acid, and L-ascorbic acid used for the standard curve were purchased from Sigma Aldrich (St. Louis, MO, USA). In addition, 2,2-diphenyl-1-picrylhydrazyl (DPPH), aluminium chloride, Folin–Ciocalteu’s phenol reagent, 2,4,6-tripyridyl-s-triazine (TPTZ), ferric (III) chloride anhydrous, and 2,2′-azino-bis(3-ethylbenz-thiazoline-6-sulphonate) (ABTS) were obtained from Sigma-Aldrich (St. Louis, MO, USA). Sodium carbonate anhydrous was purchased from Gillman, SA, Australia, and sulfuric acid 98% was obtained from RCI Labscan Limited (Bangkok, Thailand). Sodium acetate hydrate was obtained from Ajax Finechem, Scoreby, VIC, Australia. Vanillin was obtained from Glentham Life Science (Wiltshire, United Kingdom), and analytical grade methanol was from Fisher Chemical Company (San Jose, CA, USA). For the mobile phases of LC-ESI-QTOF-MS/MS, LiChrosolv (Darmstadt, Germany) and Sigma-Aldrich (St. Louis, MO, USA) provided acetonitrile and acetic acid, respectively. Standards of phenolic acids and flavonoids used for characterization, including gallic acid, syringic acid, chlorogenic acid, caffeic acid, p-hydroxybenzoic acid, coumaric acid, quercetin, catechin, protocatechuic acid, quercetin-3-O-glucuronide, kaempferol-3-O-glucoside, epicatechin gallate, and kaempferol, were supplied by Sigma-Aldrich (St. Louis, MO, USA).

2.2. Sample Preparation and Extraction of Phenolic Compounds

In this study, a diverse selection of mushrooms was procured from the Australian sales market. These types, including brown portobello, shiitake, white button, organic white, white flat, white cup, portobello flat, Swiss brown, oyster, and needle, were specifically chosen due to their widespread consumption, commercial availability, and to ensure a broad representation of common mushrooms. Fresh mushroom samples were washed and weighed at 500 g. Each mushroom sample was then ground to a slurry using a blender and stored at −20 °C for further study. The polyphenol compounds of the mushroom samples were extracted using a method referenced from Buruleanu et al. with slight modifications [16]. First, the samples were mixed with 80% ethanol and homogenized using an Ultra-Turrax T25 homogenizer (IKA, Staufen, Germany) at 10,000 rpm for 30 s. The mixtures were then incubated in the ZWYR-240 incubator shaker (Labwit, Ashwood, Vic, Australia) at 150 rpm at 4 °C for 16 h. Next, all the samples were centrifuged twice using the Hettich Refrigerated Centrifuge (ROTINA 380R, Tuttlingen, Baden-Württemberg, Germany) at 5000× g for 15 min. The supernatant was collected and stored at 4 °C for further antioxidant analysis.

2.3. Polyphenol Estimation

All polyphenol evaluations were performed using the Multiskan® Go microplate photometer (Thermo Fisher Scientific, Waltham, MA, USA) with triplicate measurements. In addition, the standard curves were established with R2 > 0.995.

2.3.1. Determination of Total Phenolic Content (TPC)

The TPC was measured using a modified version of the method outlined by Stojanova, et al. [17]. In a 96-well plate (Costar, Corning, NY, USA), 25 µL of the extract was mixed with 25 µL of 25% (v/v) Folin–Ciocalteu reagent and 200 µL of Milli-Q water. The mixture was incubated for 5 min at 25 °C, after which 25 µL of 10% (w/w) sodium carbonate was added. The mixture was then incubated in the darkroom for 1 h at room temperature. The absorbance of the reaction mixture was measured at 765 nm and the results were converted to total polyphenol content using a gallic acid standard calibration curve (ranging from 0 to 200 µg/mL). The results were presented as µg equivalents of gallic acid per gram of the sample (µg GAE/g of raw material) based on fresh weight (FW).

2.3.2. Determination of Total Flavonoids Content (TFC)

The TFC was measured using a modification of the aluminum chloride method developed by Ali, et al. [18]. To perform the assay, 80 µL of the extract, 80 µL of a 2% (w/v) ethanolic solution of aluminum chloride, and 120 µL of a 50 g/L aqueous solution of sodium acetate were mixed in a 96-well plate. The plate was then incubated for 1 h at 25 °C in a dark room. The reaction mixture was subjected to an absorbance measurement at 440 nm, and the TFC value was determined by converting the absorbance to TFC using the calibration curve prepared with the quercetin standard in a concentration range of 0 to 50 µg/mL. The TPC value was expressed as µg equivalents of quercetin per gram of fresh weight (µg QE/g FW).

2.3.3. Determination of Total Condensed Tannin Content (TCT)

TCT was performed by modifying the method of Ma, et al. [19]. First, 25 µL of the extract and 150 µL of a methanolic vanillin solution (4% w/v) were mixed in a 96-well plate. Then, 25 µL of 32% sulfuric acid (diluted with methanol) was added. The reaction mixture was incubated in the dark at room temperature for 15 min. The absorbance was measured at 500 nm, and the results were converted to a concentration of tannins (µg CE/g FW) using the calibration curve. The calibration curve was plotted with different concentrations of catechin standards ranging from 0 to 1000 µg/mL.

2.4. Antioxidant Assays

2.4.1. 2,2-Diphenyl-1-picrylhydrazyl (DPPH) Antioxidant Assay

The DPPH free radical scavenging capacity was determined by using the method of Wan Mahmood, et al. [20] with some modifications. A concentration of 0.1 mM DPPH methanol solution was used. In addition, 40 µL of the extracts and 260 µL of the DPPH methanol solution were mixed in a 96-well plate. The reaction mixture was incubated for 30 min at room temperature in the dark. The absorbance of the reaction mixture was measured at 517 nm. The results were given as µg of ascorbic acid equivalent per gram of dry weight (mg AAE/g FW) based on the standard curve, which was prepared using ascorbic acid standards with concentrations ranging from 0 to 50 µg/mL.

2.4.2. Ferric Reducing Antioxidant Power (FRAP) Assay

The FRAP of samples was measured by modifying the method of Sogi, et al. [21]. The FRAP reagent was freshly prepared by mixing 300 mM of sodium acetate solution, 10 mM of TPTZ solution (in 40 mM of HCl solution), and 20 mM of FeCl3·6H2O solution at a ratio of 10:1:1 (v:v:v). To measure the FRAP, 20 µL of the extract was mixed with 280 µL of FRAP reagent and incubated at 37 °C for 10 min. The absorbance of the reaction mixture was then measured at 593 nm. The results were expressed as µg ascorbic acid equivalents per gram of fresh sample weight (µg AAE/g FW) based on the standard curve, which was prepared using the ascorbic acid standard with concentrations ranging from 0 to 50 µg/mL.

2.4.3. 2,2′-Azino-bis-3-ethylbenzothiazoline-6-sulfonic Acid (ABTS) Radical Scavenging Assay

The ABTS radical scavenging capacity was measured according to Queiroz, et al. [22] with some modifications. First, 5 mL of 7 mM ABTS solution and 88 µL of 140 mM potassium persulfate solution were mixed and then the mixture becomes the ABTS+ solution after incubating for 16 h in the dark. The stock ABTS+ solution was further diluted by ethanol until the absorbance of the ABTS cation solution was measured as 0.70 ± 0.02 at 734 nm. In addition, 10 µL of the extract and 290 µL of the ABTS cation solution were mixed in a 96-well plate. After the reaction mixture was incubated at room temperature for 6 min, at the absorbance was measured as 734 nm. The results were expressed as µg equivalents of ascorbic acid per gram of the sample (µg AAE/g FW) based on the standard curve, prepared by the ascorbic acid standard with concentrations ranging from 0 to 200 µg/mL.

2.4.4. Total Antioxidant Capacity (TAC) Assay

The TAC assay has been modified from the method used by Suleria, et al. [23]. First, 260 μL of phosphomolybdate reagent (0.6 M H2SO4, 0.028 M sodium phosphate, and 0.004 M ammonium molybdate) was added to each 40 μL sample extract. The mixture was then incubated at 95 °C for 10 min and cooled to 25 °C. The absorbance of the sample solution at 695 nm was measured using a spectrophotometer. Each measurement was repeated three times for each sample. Ascorbic acid (0–200 µg/mL) was used as the standard curve. The TAC of the mushroom samples was expressed as µg equivalents of ascorbic acid per gram of the sample (µg AAE/g FW).

2.5. LC-ESI-QTOF-MS/MS Characterization of Phenolic Compounds

The LC-ESI-QTOF-MS/MS assay was carried out by modifying the method of Tang, et al. [24]. The samples were tentatively characterized with an Agilent 1200 HPLC (Agilent Technologies, Santa Clara, CA, USA) equipped with an Agilent 6520 Accurate-Mass Q-TOF LC-MS/MS (Agilent Technologies, CA, USA). Each compound was separated using a Synergi Hydro-RP 80 Å reverse phase column (250 mm × 4.6 mm, 4 µm particle size) with a protected C18ODS (4.0 × 2.0 mm) guard column (Phenomenex, Lane Cove, NSW, Australia). The column was operated at 25 °C and the sample temperature was set at 10 °C. The mobile phase consisted of eluent A (water/acetic acid, 99.5:0.5, v:v) and eluent B (acetonitrile/acetic acid/water, 50:49.8:0.2, v:v:v). The gradient profile was as follows: 0–10% B (0–5 min), 10–25% B (5–25 min), 25–35% B (25–35 min), 35–40% B (35–45 min), 40–55% B (45–75 min), 55–80% B (75–80 min), 80–90% B (80–82 min), 90–100% B (82–85 min) and isocratic 0% B (85–90 min). Each sample extraction was injected into 6 µL of liquid, and the mobile phase flow rate was 0.8 mL/min. Nitrogen gas atomization was set at 300 °C with a flow rate of 5 L/min at 45 psi, while the sheath gas was set at 11 L/min at 250 °C. The nozzle and capillary voltages were set at 500 V and 3.5 kV, respectively. A complete mass scan ranging from m/z 50 to 1300 was used. Material peaks were identified in positive and negative mode, and processing was performed using LC-ESI-QTOF-MS/MS. MassHunter workstation software (Qualitative Analysis, 152 version B.06.01, Agilent Technologies, Santa Clara, CA, USA) was used for data processing.

2.6. Statistical Analysis

All analyses were performed in triplicate. The results of the antioxidant assays and phenolic contents are presented as an average ± standard error (n = 3). One-way analysis of variance (ANOVA) with Tukey’s post-hoc test, as provided by Minitab® 19 for Windows (Minitab, NSW, Australia), was used to analyze data and a p-value less than 0.05 indicates a significant difference between samples. Graphs were generated using GraphPad Prism® software (version 9).

3. Results

3.1. Phenolic Content Estimation (TPC, TFC, TCT)

Mushrooms are rich in phenolic compounds, such as gallic acid, protocatechuic acid, and cinnamic acid, which have been widely studied as antioxidants [25,26]. Figure 1 shows the results of determining the total polyphenols, total flavonoids, and total tannins in ten different types of mushroom samples.
Ten types of mushrooms were analyzed for their total phenol content, and significant differences were observed. Brown portobello mushroom had the highest content (396.78 ± 3.12 µg GAE/g), followed by shiitake (389.16 ± 5.35 µg GAE/g), Swiss brown mushroom (371.43 ± 3.47 µg GAE/g), and white cup mushroom (370.60 ± 7.14 µg GAE/g). The lowest content was found in organic white mushroom and white flat mushroom (234.57 ± 4.58 and 242.14 ± 5.18 µg GAE/g, respectively). Our results demonstrate that brown portobello and shiitake mushrooms have relatively higher TPC, which aligns with previous studies [27,28]. In the study by Bernaś [27], the TPC for brown portobello mushrooms was reported as 417 mg/100 g DM, which aligns closely with our results. Similarly, the high TPC in shiitake mushrooms is in agreement with the findings by Boonsong et al. [28], who reported a TPC of 24.25 mg GAE/g DW for shiitake mushrooms. However, it should be acknowledged that there are differences in the extraction methods and units of measurement across studies. For instance, the TPC in the cited study was calculated based on dry weight and employed a 50% (v/v) ethanol ratio for extraction. Despite these methodological differences, our results reinforce the idea that brown portobello and shiitake mushrooms are notably rich in phenolic compounds. Indeed, some studies have also shown that the use of different extraction solvents can significantly affect the extraction of polyphenols from mushrooms [29]. On the other hand, the result of the lowest TPC of organic white mushrooms was opposite to the results reported by Popa, et al. [30], who pointed out that organically cultivated foods have higher nutritional value than traditional crops, especially in terms of phenolic compounds, vitamins and minerals. However, there seems to be a lack of research on organic mushrooms in terms of phenolic compounds. Cheung et al. suggested that the total phenol content is closely related to the antioxidant activity [31]. Therefore, the total phenol content plays an important role in the antioxidant properties of mushrooms.
Flavonoids are an important class of secondary metabolites of plant polyphenols. They possess anti-oxidation, anti-inflammatory and anti-cancer properties, and regulate the function of key cell enzymes [32]. As shown in Figure 1, the white cup mushroom had the highest TFC (275.17 ± 9.40 μg CE/g), which was significantly higher than the other nine mushrooms. The portobello flat mushroom (223.88 ± 9.56 µg CE/g), brown portobello mushroom (218.34 ± 6.74 µg CE/g), and organic white mushroom (210.47 ± 3.15 µg CE/g) followed closely behind. In contrast, shiitake mushroom had the lowest total flavonoid content (102.93 ± 13.69 μg CE/g). In a separate study, Buruleanu et al. found that white cap mushroom had the highest TFC with 7.83 ± 4.18 mg QE/g [16]. They also noted that the total flavonoid content varies according to the type of mushroom. Contrastingly, a study by Palacios et al. revealed that Agaricus bisporus (white button mushroom) and Pleurotus ostreatus (oyster mushroom) had relatively lower flavonoid contents, approximately around 1 mg/g of catechin equivalents [33]. They also observed that the concentration of total flavonoids varies with mushroom species, but the content of total flavonoids does not correlate with the content of phenols. It is speculated that the phenolic compounds contained in mushrooms may vary due to different cultivation substrates and environments.
Tannins are a type of polyphenol compound found widely in plants. They have the ability to bind to and precipitate proteins and other compounds, such as certain amino acids, alkaloids, nucleic acids, and polysaccharides [34]. This study found significant differences in TCT among various mushroom samples. Contrary to the TFC results, shiitake mushrooms had the highest TCT (13.80 ± 0.21 µg QE/g), while white cup mushrooms had the lowest (4.95 ± 0.14 µg QE/g). Following shiitake mushrooms were oyster mushrooms (11.15 ± 0.47 µg QE/g) and needle mushrooms (10.18 ± 0.31 µg QE/g). Organic white mushrooms, Swiss brown mushrooms, and portobello flat mushrooms had no significant differences in their tannin content, which were 9.53 ± 0.31, 9.14 ± 0.17, and 9.01 ± 0.16 µg QE/g, respectively. The TCT of mushrooms has been measured in many studies. For example, the study by Sifat, et al. [35] found that the TCT of oyster mushrooms was 36–40 mg TAE/g. Additionally, a new mushroom species called Rubroboletus himalayensis sp. nov. (Boletaceae, Boletales, Basidiomycota), found in the Himalayas of Pakistan, showed high TCT in methanol extraction with 441.0 mg TAE/g [36]. However, no additional research data have been found for the mushroom species studied in this study. Further research is needed to obtain more data on the TCT of mushrooms.

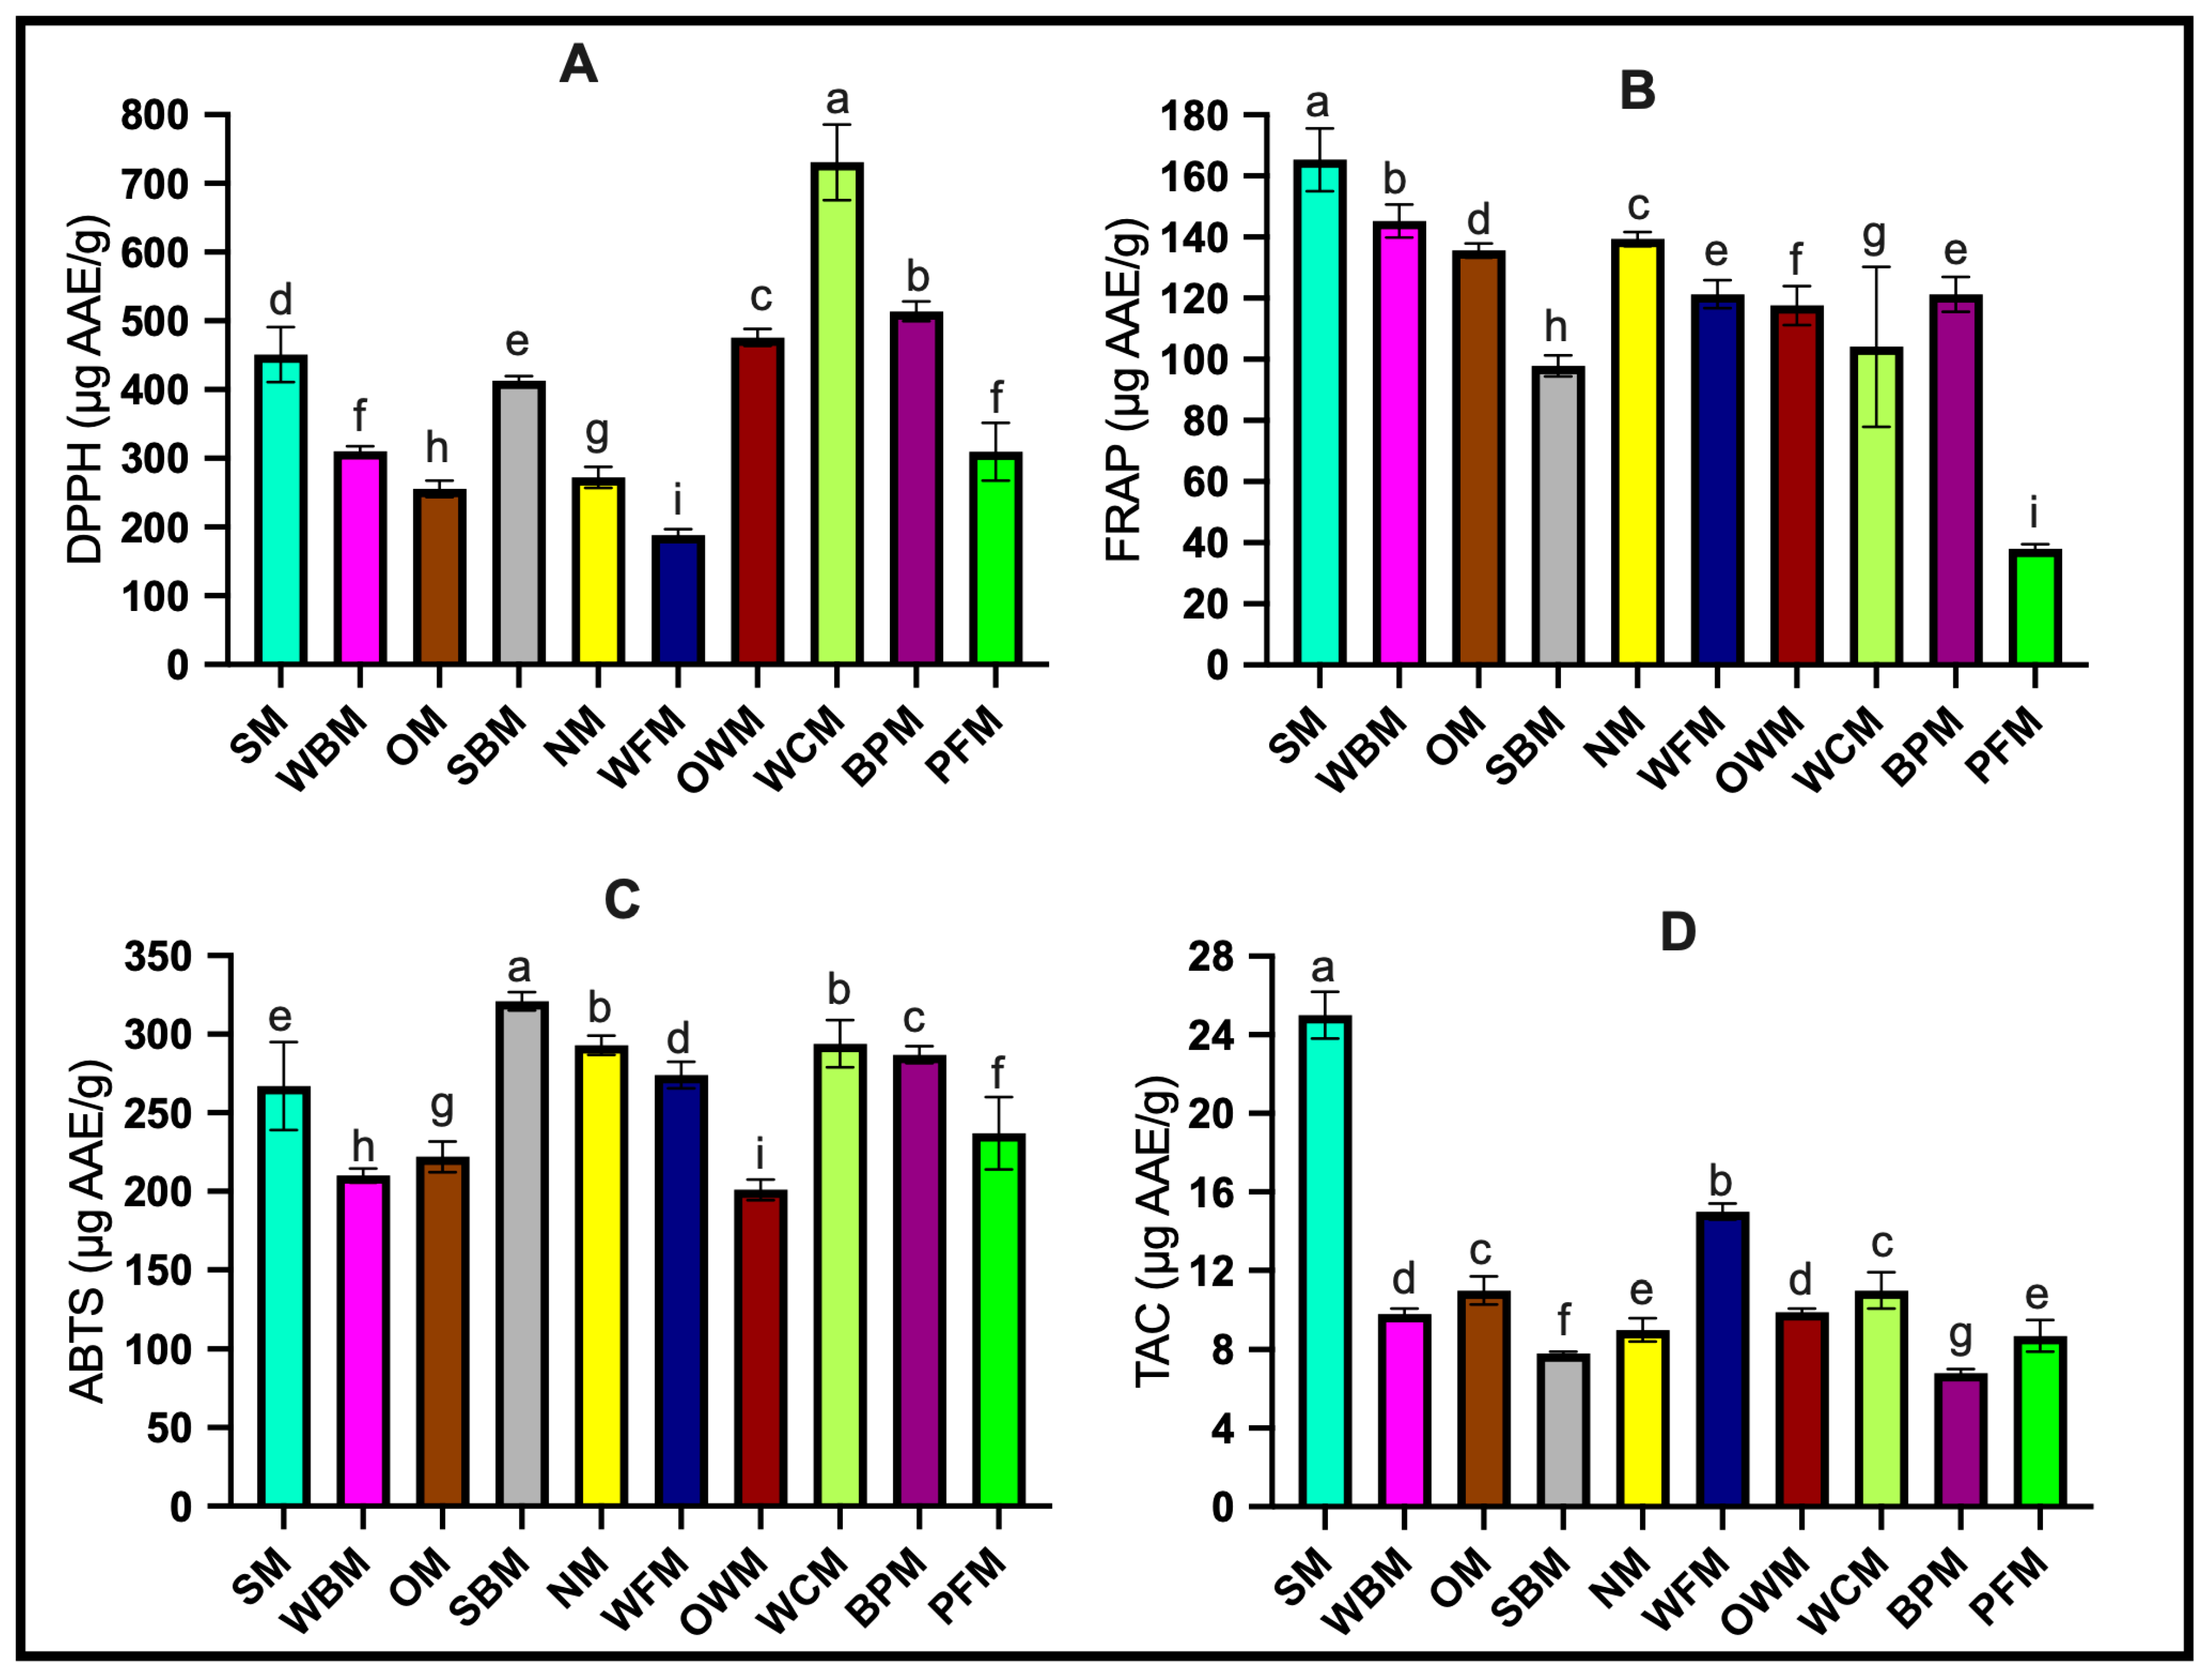
3.2. Antioxidant Activity (DPPH, FRAP, ABTS and TAC)

Based on the estimated results above, it can be concluded that mushrooms are an important source of phenolic active substances. To evaluate the antioxidant capacity of the mushroom samples, this study used DPPH, FRAP, ABTS, and TAC assay methods. The results are shown in Figure 2 and are expressed as µg ascorbic acid/g FW (µg AAE/g FW).
One of the most important functions of antioxidants is to scavenge free radicals. In the current study, the potential radical scavenging activity of the studied mushroom samples was determined using the DPPH method. The research results showed that the white cup mushroom sample had a significantly higher free radical scavenging ability than the other mushroom samples (p < 0.05), with a value as high as 730.14 ± 55.06 µg AAE/g. The white button mushroom and portobello flat mushroom had similar results, with values of 309.68 ± 7.48 µg AAE/g and 309.04 ± 42.15 μg AAE/g, respectively. These findings contrast with those of previous studies conducted by Buruleanu et al. [16] and Bach et al. [37]. Both studies indicated that brown Agaricus bisporus, especially portobello mushrooms, have a greater ability to scavenge free radicals than white species. Additionally, the DPPH scavenging levels of other mushrooms such as shiitake mushrooms were lower than those of Agaricus bisporus. Considering various factors, such as the choice of extraction solvent and the different growth environments of mushroom samples, the reason for these differences may vary. However, in general, white cup mushrooms demonstrate strong DPPH free radical scavenging activity.
The results of FRAP indicate that shiitake mushrooms exhibited the strongest iron-reducing ability (165.32 ± 10.21 μg AAE/g), while the reducing ability of white cup mushrooms was significantly lower than that of other mushroom samples (97.84 ± 3.45 μg AAE/g). These results differed markedly from those of other studies. Sharpe, et al. [38] found that the FRAP value of shiitake mushrooms was lower than that of the other mushroom varieties they examined. Islam, et al. [39] confirmed this point as well. They noted that among the 43 selected Chinese mushrooms, shiitake mushrooms did not demonstrate the strongest antioxidant properties. The FRAP assay measures the ability of an antioxidant in a sample to reduce the Fe3+ complex to the Fe2+ complex, thus determining the sample’s antioxidant capacity. In general, researchers believe that in most cases, the results of antioxidant capacity determination are consistent with the value of TPC [40]. In our study, we found that the portobello flat mushroom has a TPC value of 276.98 ± 10.17 μg AAE/g, but it has the lowest reducibility. On the other hand, the FRAP results of white flat mushrooms, brown portobello mushrooms, and organic white mushrooms are consistent with the TPC value. Further research is needed to understand the causes of these and similar conditions.
ABTS free radical scavenging is a sensitive test method used to evaluate the free radical scavenging ability of phenolic compounds [39]. Antioxidants donate electrons or hydrogen atoms to inactivate ABTS+ ions, causing a color change. According to the ABTS test results, the strongest antioxidant capacity is demonstrated by the Swiss brown mushroom (321.31 ± 5.7 μg AAE/g), followed by white cup mushroom (293.88 ± 14.61 μg AAE/g) and needle mushroom (292.90 ± 6.08 μg AAE/g), and the weakest is the organic white mushroom (201.47 ± 6.57 μg AAE/g). Bach et al. [37] found a strong correlation between the ABTS free radical scavenging activity and the TPC in mushrooms, confirming that the TPC has a direct impact on the antioxidant activity of mushroom samples.
The total antioxidant capacity (TAC) in mushroom samples is a comprehensive parameter that measures the cumulative effect of all antioxidants in the sample, rather than the simple sum of various antioxidants [41]. The results of the TAC assay in this study indicate that shiitake mushrooms have a significantly higher TAC value (24.52 ± 1.2 μg AAE/g) compared to other mushroom varieties. The TAC values of portobello flat mushroom, Swiss brown mushroom, and brown portobello mushroom were found to be similar, at 8.70 ± 0.78, 7.84 ± 0.1, and 6.78 ± 0.17 μg AAE/g, respectively. Some studies suggest that this may be due to the fact that the stems of shiitake mushrooms are rich in true chitosan, which is the source of potential antioxidant properties of shiitake mushrooms [42].

3.3. Tentative Phenolic Characterization by LC-ESI-QTOF-MS/MS

This study used LC-ESI-QTOF-MS/MS to tentatively characterize phenolic compounds in ten mushroom samples. The isolated compounds were tentatively identified using Agilent LC-ESI-QTOF-MS/MS Mass Hunter Qualitative Software and the Personal Compound Database and Library (PCDL), by considering the MS spectra of m/z in the positive and negative ion mode, and retention time (RT). Compounds with screening scores greater than 80 (PCDL scores) and mass errors of ±5 ppm were listed in Table 1 for tentative characterization and m/z validation. Overall, 22 phenolic compounds were identified in all mushroom samples, including 11 flavonoids, 3 phenolic acids, 4 lignans, 2 stilbenes, and 2 other phenolic compounds.

3.3.1. Phenolic Acids

In the studied mushroom samples, three different phenolic acids were tentatively characterized, belonging to two subclasses of phenolic acids, hydroxycinnamic acids and hydroxyphenylpropanoic acids, respectively. Two compounds, cinnamic acid and p-coumaroyl malic acid, were tentatively identified in the hydroxycinnamic acids subclass. Cinnamic acid was detected in a variety of mushroom samples, including shiitake mushroom, needle mushroom, white flat mushroom, brown portobello mushroom, portobello flat mushroom, organic white mushroom and oyster mushroom, under the following conditions: retention time RT = 4.53 min, and negative ion mode m/z = 147.0463. In a study to identify phenolic compounds in 26 mushroom species, cinnamic acid was detected in the majority of mushroom samples [43]. However, p-coumaroyl malic acid, with its unique retention time of 3.65 min and negative ion mode ([M-H] m/z = 279.0511), was mainly identified in white flat mushroom, organic white mushroom, portobello flat mushroom, and shiitake mushroom. This discovery is particularly innovative, as p-coumaroyl malic acid has not been previously reported in mushroom studies, but was noted in the North American herb, Echinacea purpurea (L.) Moench [44]. Compound 1 has a negative ion mode at m/z = 357.0837 and was tentatively identified as dihydrocaffeic acid 3-O-glucuronide, which was previously detected in hops and juniper berries [24].

3.3.2. Flavonoids

Flavonoids are the main class of phenolic compounds. In this study, six flavonoid subclasses were tentatively characterized, including anthocyanins, dihydrochalcones, flavanols, flavones, isoflavonoids. Of these, isoflavonoids detected three compounds, flavonols and dihydrochalcones each detected two, and the remaining subclasses each detected one.

Isoflavonoids

Dalbergin was preliminarily characterized in the extracts of shiitake mushroom, portobello flat mushroom and needle mushroom. The compound showed [M-H] at an m/z of 267.0666 and the chemical formula was C16H12O4. Dalbergin is a natural flavonoid isolated from Dalbergia sissoo, Machaerium spp., Oxytrops falcate, Dalbergia odorifera and some other plants [45]. Compound 5 was tentatively characterized as 2′,7-dihydroxy-4′,5′-dimethoxyisoflavone under the condition of m/z of 315.0860 in the positive ion mode and a retention time of 3.833 min. The compound was detected in brown portobello mushrooms, needle mushrooms and white button mushrooms. It has also been detected in Lepidium sativum, as reported by Kadam, et al. [46]. In addition, compound 6 with [M-H] at m/z = 457.1151 was identified as 6″-O-acetyldaidzin, which was only detected in shiitake mushroom. 6″-O-acetyldaidzin is an ortho-glycosylated derivative of isoflavonoids, which was detected in some soybeans and their products by LC-MS [47].

Flavanones and Flavonols

In the [M-H] mode, flavonols (kaempferol 7-O-glucoside) was tentatively detected in white button mushroom, and flavanones (eriocitrin) were detected om white flat mushroom and oyster mushroom. Kaempferol 7-O-glucoside and eriocitrin were characterized at m/z = 446.0858 and 595.1638, with retention times of 3.35 min and 54.24 min, respectively. Research has shown that kaempferol 7-O-glucosinolates, which can be isolated from herbaceous plants, have effective anti-HSV-1 activity [48]. Eriocitrin is a disaccharide derivative of eriodictyol. It was previously isolated and identified in lemon peel and pulp vesicles using HPLC, 1H-NMR and 13C-NMR analyses [49].

Flavanols and Dihydroflavonols

Catechin is a flavanol commonly found in fruits and vegetables. Two catechin derivatives were identified in mushroom samples. Compound 9 was initially characterized as (+)-catechin 3-O-gallate with a retention time of 3.72 min and [M-H] mode at m/z = 441.0783, which was found in white button mushroom, organic white mushroom, and portobello flat mushroom. Compound 10 was tentatively characterized as 4′-O-methyl-(-)-epigallocatechin 7-O-glucuronide with a retention time of 54.71 min and [M-H] mode at m/z = 495.1164. It was detected in white cup mushroom and white flat mushroom. These two compounds were also identified by Peng, et al. [50] in their study of phenolic compounds in Australian mangoes (Mangifera indica L.). In addition, two compounds, dihydroquercetin 3-O-rhamnoside and 3-hydroxyphloretin 2′-O-xylosyl-glucoside, were preliminarily characterized in mushroom samples. Dihydroquercetin 3-O-rhamnoside was present in shiitake mushroom and white flat mushroom, while 3-hydroxyphloretin 2′-O-xylosyl-glucoside was only detected in brown portobello mushroom. Both compounds showed a negative ion mode at m/z of 449.1069 and 583.1692, respectively. Suprun, et al. [51] reported that dihydroquercetin 3-O-rhamnoside is the main dihydroflavonol in white wine, while Ramirez-Ambrosi et al. [5] identified 3-hydroxyphloretin 2′-O-xylosyl-glucoside in apple products.

Anthocyanins

Two anthocyanins were tentatively identified in ten mushroom samples, both belonging to anthocyanin cations (compounds 13 and 14). Compound 13, cyanidin 3-O-(6″-acetyl-glucoside), exhibits the [M-H] mode at m/z of 490.1102 and is detected in almost all mushroom samples, except brown portobello mushroom. Previous research has shown that it is found in multiple species of Zinnia elegans [52]. Remarkably, compound 14, identified as petunidin 3-O-(6″-acetyl-glucoside), was uniquely characterized in the portobello flat mushroom, displaying an [M-H]+ mode at an m/z of 522.1396. This is an innovative discovery, as this specific compound has not been previously reported in mushrooms according to the existing literature. Therefore, our study contributes novel insights to the field, augmenting the knowledge of phenolic compounds present in different varieties of mushrooms.

3.3.3. Lignans

In this study, four lignans (compounds 15–18) from ten mushroom samples were tentatively characterized, and compounds 16–18 were detected in both [M-H] and [M-H]+ modes. Schisandrin C was detected in oyster mushroom as compound 16 with [M-H] at m/z 383.1501 and [M+H]+ at m/z 385.1607. Compound 17 was detected in the [M+H]+ mode at m/z 417.2290 and 417.2282, and [M-H] at m/z 415.2133. It was preliminarily characterized as deoxyschisandrin and detected in brown portobello mushroom, shiitake mushroom and white cup mushroom, while compound 18 was detected in the [M-H]+ mode at m/z 433.2222 and [M+H] at m/z 431.2046 and 431.2100. It was preliminarily characterized as schisandrin and detected in shiitake mushroom and needle mushroom. Schisandrin, schisandrin C and deoxyschisandrin are anti-inflammatory active compounds isolated from the fruit of Schisandra chinensis Baill. [53,54]. Compound 15 with [M-H] at m/z 375.1435 was detected in needle mushroom samples and preliminarily characterized as todolactol A. This compound has been previously identified in Norway spruce by Piispanen et al. [55].

3.3.4. Stilbenes and Other Polyphenols

The stilbenes composition identified only two compounds in negative ionization mode, trans-resveratrol (m/z = 227.0706) and resveratrol 5-O-glucoside (m/z = 389.1240). Resveratrol is a phenolic compound with various biological activities. Kang, et al. [56] reported that they had cultivated transgenic enoki mushrooms with resveratrol-producing ability. Beekwilder, et al. [57] used transgenic Saccharomyces cerevisiae to produce trans-resveratrol in culture. In addition, phenolics were characterized by using UHPLC-ESI/QTOF-MS on Calligonum azel Maire, a Tunisian desert plant, and resveratrol 5-O-glucoside was detected in this plant [58]. On the other hand, polyphenolic compound 21 exhibited [M-H] at m/z 319.1195 and was preliminarily characterized as 3,4-DHPEA-EDA. Compound 22 also exhibited [M-H] at m/z 331.1923 and was initially identified as carnosic acid. The mushroom samples containing 3,4-DHPEA-EDA were portobello flat mushroom and white flat mushroom, while the mushroom samples containing carnosic acid were shiitake mushroom, needle mushroom, and white cup mushroom. According to Akazawa, et al. [59], 3,4-DHPEA-EDA, the main phenolic compound of olive leaves was detected in cold-water extracts of the leaves, in the form of an aglycone derivative. Carnosic acid is a diterpene compound commonly found in sage and rosemary [60], which has not been previously reported in mushroom species.

4. Conclusions

This study provides a comprehensive analysis of the antioxidant activities, phenolic content, and LC-ESI-QTOF-MS/MS-based characterization of phenolic compounds in ten distinct mushroom varieties. The analysis revealed significant differences in the total polyphenols, flavonoids, and tannins among the tested mushroom varieties, as well as their antioxidant activities. The strength of this study lies in its comprehensive assessment of the phenolic compounds and antioxidant activities in various mushroom samples, contributing to the robustness of the findings and expanding our knowledge of the phenolic content in mushrooms. In addition, 22 phenolic compounds, including flavonoids, phenolic acids, lignans, stilbenes, and other phenolic compounds, some of which have not been previously reported in the literature, have been tentatively identified. Particularly noteworthy in underlining the innovative aspect of this research is the discovery of previously unreported compounds, including p-coumaroyl malic acid and petunidin 3-O-(6″-acetyl-glucoside), in a diverse selection of mushroom varieties such as organic white mushrooms, thereby filling a significant gap in the existing literature. The findings of this study not only inform consumers, researchers, and industry professionals about the potential health benefits of mushrooms but also pave the way for future research on their potential therapeutic applications or as functional ingredients in food products. However, it is essential to consider the influence of various factors, such as extraction solvents, growth environments, and cultivation substrates, on the phenolic content and antioxidant activities of mushrooms. Further research on mushrooms in terms of phenolic compounds is needed to better understand these effects. Overall, this study highlights the importance of mushrooms as a source of health-promoting phenolic compounds and antioxidants, which can contribute to the development of functional foods and nutraceuticals.

Author Contributions

Conceptualization, methodology, formal analysis, validation and investigation, M.C., Y.Z., R.D.K., O.T.A. and H.A.R.S.; resources, H.A.R.S., C.J.B. and F.R.D.; writing—original draft preparation, M.C., Y.Z., R.D.K., O.T.A. and H.A.R.S.; writing—review and editing, M.C., Y.Z., O.T.A. and H.A.R.S.; supervision, H.A.R.S., O.T.A., C.J.B. and F.R.D.; funding acquisition, H.A.R.S. All authors have read and agreed to the published version of the manuscript.

Funding

Hafiz Suleria is the recipient of an Australian Research Council—Discovery Early Career Award (ARC-DECRA—DE220100055) funded by the Australian Government. This research was funded by the University of Melbourne under the McKenzie Fellowship Scheme (grant no. UoM-18/21), the Future Food Hallmark Research Initiative Funds (grant no. UoM-21/23) and Collaborative Research Development Grant (grant no. UoM-21/23) funded by the Faculty of Veterinary and Agricultural Sciences, the University of Melbourne, Australia.

Data Availability Statement

Data are available from the corresponding authors upon request.

Acknowledgments

We would like to thank researchers of the Hafiz Suleria group from the School of Agriculture, Food and Ecosystem Sciences, Faculty of Science, the University of Melbourne for their incredible supports.

Conflicts of Interest

The authors declare no conflict of interest.

References

  1. Expert Market Research. Global Mushroom Market Report and Forecast 2023–2028. 2023. Available online: https://www.expertmarketresearch.com/reports/mushroom-market (accessed on 27 May 2023).
  2. Rizzo, G.; Goggi, S.; Giampieri, F.; Baroni, L. A review of mushrooms in human nutrition and health. Trends Food Sci. Technol. 2021, 117, 60–73. [Google Scholar] [CrossRef]
  3. Ba, D.M.; Gao, X.; Al-Shaar, L.; Muscat, J.; Chinchilli, V.M.; Ssentongo, P.; Zhang, X.; Liu, G.; Beelman, R.B.; Richie, J.P. Prospective study of dietary mushroom intake and risk of mortality: Results from continuous National Health and Nutrition Examination Survey (NHANES) 2003–2014 and a meta-analysis. Nutr. J. 2021, 20, 80. [Google Scholar] [CrossRef]
  4. Kalaras, M.D.; Beelman, R.B.; Elias, R.J. Effects of Postharvest Pulsed UV Light Treatment of White Button Mushrooms (Agaricus bisporus) on Vitamin D2 Content and Quality Attributes. J. Agric. Food Chem. 2012, 60, 220–225. [Google Scholar] [CrossRef]
  5. Ramirez-Ambrosi, M.; Abad-Garcia, B.; Viloria-Bernal, M.; Garmon-Lobato, S.; Berrueta, L.A.; Gallo, B. A new ultrahigh performance liquid chromatography with diode array detection coupled to electrospray ionization and quadrupole time-of-flight mass spectrometry analytical strategy for fast analysis and improved characterization of phenolic compounds in apple products. J. Chromatogr. A 2013, 1316, 78–91. [Google Scholar] [CrossRef] [PubMed]
  6. Xiaokang, W.; Brunton, N.P.; Lyng, J.G.; Harrison, S.M.; Carpes, S.T.; Papoutsis, K. Volatile and non-volatile compounds of shiitake mushrooms treated with pulsed light after twenty-four hour storage at different conditions. Food Biosci. 2020, 36, 100619. [Google Scholar] [CrossRef]
  7. Barros, L.; Duenas, M.; Ferreira, I.C.F.R.; Baptista, P.; Santos-Buelga, C. Phenolic acids determination by HPLC-DAD-ESI/MS in sixteen different Portuguese wild mushrooms species. Food Chem. Toxicol. 2009, 47, 1076–1079. [Google Scholar] [CrossRef]
  8. Manach, C.; Scalbert, A.; Morand, C.; Rémésy, C.; Jiménez, L. Polyphenols: Food sources and bioavailability. Am. J. Clin. Nutr. 2004, 79, 727–747. [Google Scholar] [CrossRef] [Green Version]
  9. Ziaullah; Rupasinghe, H.P.V. Chapter 1—Application of NMR Spectroscopy in Plant Polyphenols Associated with Human Health. In Applications of NMR Spectroscopy; ur-Rahman, A., Choudhary, M.I., Eds.; Bentham Science Publishers: Sharjah, United Arab Emirates, 2015; pp. 3–92. [Google Scholar]
  10. Decker, E.A. Phenolics: Prooxidants or Antioxidants? Nutr. Rev. 1997, 55, 396–398. [Google Scholar] [CrossRef] [PubMed]
  11. Wojtunik-Kulesza, K.; Oniszczuk, A.; Oniszczuk, T.; Combrzyński, M.; Nowakowska, D.; Matwijczuk, A. Influence of In Vitro Digestion on Composition, Bioaccessibility and Antioxidant Activity of Food Polyphenols—A Non-Systematic Review. Nutrients 2020, 12, 1401. [Google Scholar] [CrossRef] [PubMed]
  12. Gogoi, P.; Chutia, P.; Singh, P.; Mahanta, C.L. Effect of optimized ultrasound-assisted aqueous and ethanolic extraction of Pleurotus citrinopileatus mushroom on total phenol, flavonoids and antioxidant properties. J. Food Process Eng. 2019, 42, e13172. [Google Scholar] [CrossRef]
  13. Hamill, L.L.; McRoberts, W.C.; Floyd, S.D.; McKinley, M.C.; Young, I.S.; Woodside, J.V. Analyses of a polyphenol aglycone profile in broccoli and carrots by LC-MS QToF. Proc. Nutr. Soc. 2012, 71, E93. [Google Scholar] [CrossRef] [Green Version]
  14. Fang, N.; Yu, S.; Prior, R.L. LC/MS/MS Characterization of Phenolic Constituents in Dried Plums. J. Agric. Food Chem. 2002, 50, 3579–3585. [Google Scholar] [CrossRef] [PubMed]
  15. Rahimi Khoigani, S.; Rajaei, A.; Goli, S.A.H. Evaluation of antioxidant activity, total phenolics, total flavonoids and LC–MS/MS characterisation of phenolic constituents in Stachys lavandulifolia. Nat. Prod. Res. 2017, 31, 355–358. [Google Scholar] [CrossRef] [PubMed]
  16. Buruleanu, L.C.; Radulescu, C.; Georgescu, A.A.; Danet, F.A.; Olteanu, R.L.; Nicolescu, C.M.; Dulama, I.D. Statistical Characterization of the Phytochemical Characteristics of Edible Mushroom Extracts. Anal. Lett. 2018, 51, 1039–1059. [Google Scholar] [CrossRef]
  17. Stojanova, M.; Pantić, M.; Karadelev, M.; Čuleva, B.; Nikšić, M. Antioxidant potential of extracts of three mushroom species collected from the Republic of North Macedonia. J. Food Process. Preserv. 2021, 45, e15155. [Google Scholar] [CrossRef]
  18. Ali, A.; Wu, H.; Ponnampalam, E.N.; Cottrell, J.J.; Dunshea, F.R.; Suleria, H.A.R. Comprehensive Profiling of Most Widely Used Spices for Their Phenolic Compounds through LC-ESI-QTOF-MS2 and Their Antioxidant Potential. Antioxidants 2021, 10, 721. [Google Scholar] [CrossRef]
  19. Ma, C.; Dunshea, F.R.; Suleria, H.A.R. LC-ESI-QTOF/MS Characterization of Phenolic Compounds in Palm Fruits (Jelly and Fishtail Palm) and Their Potential Antioxidant Activities. Antioxidants 2019, 8, 483. [Google Scholar] [CrossRef] [Green Version]
  20. Wan Mahmood, W.M.A.; Lorwirachsutee, A.; Theodoropoulos, C.; Gonzalez-Miquel, M. Polyol-Based Deep Eutectic Solvents for Extraction of Natural Polyphenolic Antioxidants from Chlorella vulgaris. ACS Sustain. Chem. Eng. 2019, 7, 5018–5026. [Google Scholar] [CrossRef]
  21. Sogi, D.S.; Siddiq, M.; Greiby, I.; Dolan, K.D. Total phenolics, antioxidant activity, and functional properties of ‘Tommy Atkins’ mango peel and kernel as affected by drying methods. Food Chem. 2013, 141, 2649–2655. [Google Scholar] [CrossRef]
  22. Queiroz, M.; Oppolzer, D.; Gouvinhas, I.; Silva, A.M.; Barros, A.I.R.N.A.; Domínguez-Perles, R. New grape stems’ isolated phenolic compounds modulate reactive oxygen species, glutathione, and lipid peroxidation in vitro: Combined formulations with vitamins C and E. Fitoterapia 2017, 120, 146–157. [Google Scholar] [CrossRef]
  23. Suleria, H.A.R.; Barrow, C.J.; Dunshea, F.R. Screening and Characterization of Phenolic Compounds and Their Antioxidant Capacity in Different Fruit Peels. Foods 2020, 9, 1209. [Google Scholar] [CrossRef]
  24. Tang, J.; Dunshea, F.R.; Suleria, H.A.R. LC-ESI-QTOF/MS Characterization of Phenolic Compounds from Medicinal Plants (Hops and Juniper Berries) and Their Antioxidant Activity. Foods 2020, 9, 7. [Google Scholar] [CrossRef] [Green Version]
  25. Barros, L.; Ferreira, M.-J.; Queirós, B.; Ferreira, I.C.F.R.; Baptista, P. Total phenols, ascorbic acid, β-carotene and lycopene in Portuguese wild edible mushrooms and their antioxidant activities. Food Chem. 2007, 103, 413–419. [Google Scholar] [CrossRef]
  26. Selli, S.; Guclu, G.; Sevindik, O.; Kelebek, H. Variations in the key aroma and phenolic compounds of champignon (Agaricus bisporus) and oyster (Pleurotus ostreatus) mushrooms after two cooking treatments as elucidated by GC–MS-O and LC-DAD-ESI-MS/MS. Food Chem. 2021, 354, 129576. [Google Scholar] [CrossRef]
  27. Bernaś, E. Comparison of the mechanism of enzymatic browning in frozen white and brown A. bisporus. Eur. Food Res. Technol. 2018, 244, 1239–1248. [Google Scholar] [CrossRef]
  28. Boonsong, S.; Klaypradit, W.; Wilaipun, P. Antioxidant activities of extracts from five edible mushrooms using different extractants. Agric. Nat. Resour. 2016, 50, 89–97. [Google Scholar] [CrossRef] [Green Version]
  29. Xiaokang, W.; Lyng, J.G.; Brunton, N.P.; Cody, L.; Jacquier, J.-C.; Harrison, S.M.; Papoutsis, K. Monitoring the effect of different microwave extraction parameters on the recovery of polyphenols from shiitake mushrooms: Comparison with hot-water and organic-solvent extractions. Biotechnol. Rep. 2020, 27, e00504. [Google Scholar] [CrossRef]
  30. Popa, M.E.; Mitelut, A.C.; Popa, E.E.; Stan, A.; Popa, V.I. Organic foods contribution to nutritional quality and value. Trends Food Sci. Technol. 2019, 84, 15–18. [Google Scholar] [CrossRef]
  31. Cheung, L.M.; Cheung, P.C.K.; Ooi, V.E.C. Antioxidant activity and total phenolics of edible mushroom extracts. Food Chem. 2003, 81, 249–255. [Google Scholar] [CrossRef]
  32. Panche, A.N.; Diwan, A.D.; Chandra, S.R. Flavonoids: An overview. J. Nutr. Sci. 2016, 5, e47. [Google Scholar] [CrossRef] [Green Version]
  33. Palacios, I.; Lozano, M.; Moro, C.; D’Arrigo, M.; Rostagno, M.A.; Martínez, J.A.; García-Lafuente, A.; Guillamón, E.; Villares, A. Antioxidant properties of phenolic compounds occurring in edible mushrooms. Food Chem. 2011, 128, 674–678. [Google Scholar] [CrossRef]
  34. Abdelshafy, A.M.; Belwal, T.; Liang, Z.; Wang, L.; Li, D.; Luo, Z.; Li, L. A comprehensive review on phenolic compounds from edible mushrooms: Occurrence, biological activity, application and future prospective. Crit. Rev. Food Sci. Nutr. 2021, 62, 6204–6224. [Google Scholar] [CrossRef]
  35. Sifat, N.; Lovely, F.; Zihad, S.M.N.K.; Hossain, M.G.; Shilpi, J.A.; Grice, I.D.; Mubarak, M.S.; Uddin, S.J. Investigation of the nutritional value and antioxidant activities of common Bangladeshi edible mushrooms. Clin. Phytosci. 2020, 6, 88. [Google Scholar] [CrossRef]
  36. Sarwar, S.; Siddique, Z.E.B.; Bashir, A.; Khalid, A.N. Rubroboletus himalayensis sarwar & khalid—A new mushroom from Pakistan. Bangladesh J. Plant Taxon. 2021, 28, 17–26. [Google Scholar] [CrossRef]
  37. Bach, F.; Zielinski, A.A.F.; Helm, C.V.; Maciel, G.M.; Pedro, A.C.; Stafussa, A.P.; Ávila, S.; Haminiuk, C.W.I. Bio compounds of edible mushrooms: In vitro antioxidant and antimicrobial activities. LWT—Food Sci. Technol. 2019, 107, 214–220. [Google Scholar] [CrossRef]
  38. Sharpe, E.; Farragher-Gnadt, A.P.; Igbanugo, M.; Huber, T.; Michelotti, J.C.; Milenkowic, A.; Ludlam, S.; Walker, M.; Hanes, D.; Bradley, R.; et al. Comparison of antioxidant activity and extraction techniques for commercially and laboratory prepared extracts from six mushroom species. J. Agric. Food Res. 2021, 4, 100130. [Google Scholar] [CrossRef]
  39. Islam, T.; Yu, X.; Xu, B. Phenolic profiles, antioxidant capacities and metal chelating ability of edible mushrooms commonly consumed in China. LWT—Food Sci. Technol. 2016, 72, 423–431. [Google Scholar] [CrossRef]
  40. Smolskaitė, L.; Venskutonis, P.R.; Talou, T. Comprehensive evaluation of antioxidant and antimicrobial properties of different mushroom species. LWT—Food Sci. Technol. 2015, 60, 462–471. [Google Scholar] [CrossRef] [Green Version]
  41. Ghiselli, A.; Serafini, M.; Natella, F.; Scaccini, C. Total antioxidant capacity as a tool to assess redox status: Critical view and experimental data. Free Radic. Biol. Med. 2000, 29, 1106–1114. [Google Scholar] [CrossRef]
  42. Ming-Tsung, Y.; Yu-Hsiu, T.; Ruei-Chian, L.; Jeng-Leun, M. Antioxidant properties of fungal chitosan from shiitake stipes. LWT—Food Sci. Technol. 2007, 40, 255–261. [Google Scholar] [CrossRef]
  43. Cayan, F.; Deveci, E.; Tel-Cayan, G.; Duru, M.E. Identification and quantification of phenolic acid compounds of twenty-six mushrooms by HPLC-DAD. J. Food Meas. Charact. 2020, 14, 1690–1698. [Google Scholar] [CrossRef]
  44. Fu, R.; Zhang, P.; Jin, G.; Wei, S.; Chen, J.; Pei, J.; Zhang, Y. Substrate promiscuity of acyltransferases contributes to the diversity of hydroxycinnamic acid derivatives in purple coneflower. Plant J. 2022, 110, 802–813. [Google Scholar] [CrossRef]
  45. Wang, X.-Q.; Huang, C.-S.; Liu, H.-X.; He, Y.-Q. Distribution, Synthesis and Biological Activity of Dalbergin. Nat. Prod. Res. Dev. 2009, 21, 900–904. [Google Scholar]
  46. Kadam, D.; Palamthodi, S.; Lele, S.S. LC–ESI-Q-TOF–MS/MS profiling and antioxidant activity of phenolics from L. sativum seedcake. J. Food Sci. Technol. 2018, 55, 1154–1163. [Google Scholar] [CrossRef]
  47. Wiseman, H.; Casey, K.; Clarke, D.B.; Barnes, K.A.; Bowey, E. Isoflavone Aglycon and Glucoconjugate Content of High- and Low-Soy U.K. Foods Used in Nutritional Studies. J. Agric. Food Chem. 2002, 50, 1404–1410. [Google Scholar] [CrossRef] [PubMed]
  48. Behbahani, M.; Sayedipour, S.; Pourazar, A.; Shanehsazzadeh, M. In vitro anti-HIV-1 activities of kaempferol and kaempferol-7-O-glucoside isolated from Securigera securidaca. Res. Pharm. Sci. 2014, 9, 463–469. [Google Scholar]
  49. Miyake, Y.; Yamamoto, K.; Osawa, T. Isolation of Eriocitrin (Eriodictyol 7-rutinoside) from Lemon Fruit (Citrus limon BURM. f.) and Its Antioxidative Activity. Food Sci. Technol. Int. Tokyo 1997, 3, 84–89. [Google Scholar] [CrossRef] [Green Version]
  50. Peng, D.; Zahid, H.F.; Ajlouni, S.; Dunshea, F.R.; Suleria, H.A.R. LC-ESI-QTOF/MS Profiling of Australian Mango Peel By-Product Polyphenols and Their Potential Antioxidant Activities. Processes 2019, 7, 764. [Google Scholar] [CrossRef] [Green Version]
  51. Suprun, A.R.; Dubrovina, A.S.; Tyunin, A.P.; Kiselev, K.V. Profile of Stilbenes and Other Phenolics in Fanagoria White and Red Russian Wines. Metabolites 2021, 11, 231. [Google Scholar] [CrossRef]
  52. Qian, J.; Lai, W.; Jiang, L.; Zhan, H.; Zhai, M.; Fu, J.; Zhang, C. Association between differential gene expression and anthocyanin biosynthesis underlying the diverse array of petal colors in Zinnia elegans. Sci. Hortic. 2021, 277, 109809. [Google Scholar] [CrossRef]
  53. Oh, S.-Y.; Kim, Y.H.; Bae, D.S.; Um, B.H.; Pan, C.-H.; Kim, C.Y.; Lee, H.J.; Lee, J.K. Anti-Inflammatory Effects of Gomisin N, Gomisin J, and Schisandrin C Isolated from the Fruit of Schisandra chinensis. Biosci. Biotechnol. Biochem. 2010, 74, 285–291. [Google Scholar] [CrossRef] [PubMed] [Green Version]
  54. Guo, L.Y.; Hung, T.M.; Bae, K.H.; Shin, E.M.; Zhou, H.Y.; Hong, Y.N.; Kang, S.S.; Kim, H.P.; Kim, Y.S. Anti-inflammatory effects of schisandrin isolated from the fruit of Schisandra chinensis Baill. Eur. J. Pharmacol. 2008, 591, 293–299. [Google Scholar] [CrossRef] [PubMed]
  55. Piispanen, R.; Willför, S.; Saranpää, P.; Holmbom, B. Variation of lignans in Norway spruce (Picea abies [L.] Karst.) knotwood: Within-stem variation and the effect of fertilisation at two experimental sites in Finland. Trees 2008, 22, 317–328. [Google Scholar] [CrossRef]
  56. Kang, L.-Z.; Zeng, X.-L.; Ye, Z.-W.; Lin, J.-F.; Guo, L.-Q. Compositional analysis of the fruiting body of transgenic Flammulina velutipes producing resveratrol. Food Chem. 2014, 164, 211–218. [Google Scholar] [CrossRef]
  57. Beekwilder, J.; Wolswinkel, R.; Jonker, H.; Hall, R.; de Vos, C.H.R.; Bovy, A. Production of resveratrol in recombinant microorganisms. Appl. Environ. Microbiol. 2006, 72, 5670–5672. [Google Scholar] [CrossRef] [Green Version]
  58. Bannour, M.; Fellah, B.; Rocchetti, G.; Ashi-Smiti, S.; Lachenmeier, D.W.; Lucini, L.; Khadhri, A. Phenolic profiling and antioxidant capacity of Calligonum azel Maire, a Tunisian desert plant. Food Res. Int. 2017, 101, 148–154. [Google Scholar] [CrossRef]
  59. Akazawa, T.; Itami, H.; Furumoto, T.; Nozaki, C.; Koike, H.; Iritani, S.; Amimoto, N.; Ogawa, M. Impact of an Olive Leaf Polyphenol 3,4-DHPEA-EDA on Physical Properties of Food Protein Gels. J. Agric. Food Chem. 2021, 69, 14250–14258. [Google Scholar] [CrossRef]
  60. Birtić, S.; Dussort, P.; Pierre, F.-X.; Bily, A.C.; Roller, M. Carnosic acid. Phytochemistry 2015, 115, 9–19. [Google Scholar] [CrossRef] [Green Version]
Figure 1. The estimation of phenolic content of ten kinds of mushrooms. (A) Total phenolic content (TPC). (B) Total flavonoids content (TFC). (C) Total condensed tannin content (TCT). The data presented represent the mean ± standard deviation of three replicates from accession. ANOVA and Tukey’s test were used to determine the statistically significant difference at p < 0.05 as identified by different letters. The codes for the mushroom samples are as follows: SM: shiitake mushroom; WBM: white button mushroom; OM: oyster mushroom; SBM: Swiss brown mushroom; NM: needle mushroom; WFM: white flat mushroom; OWM: organic white mushroom; WCM: white cup mushroom; BPM: brown portobello mushroom; PFM: portobello flat mushroom.
Processes 11 01711 g001
Figure 2. The estimation of antioxidant potential of ten kinds of mushrooms. (A) 2,2-diphenyl-1-picrylhydrazyl (DPPH). (B) Ferric reducing antioxidant power (FRAP). (C) 2,2′-azino-bis-3-ethylbenzothiazoline-6-sulfonic acid (ABTS). (D) Total antioxidant capacity (TAC). The data presented represent the mean ± standard deviation of three replicates from accession. ANOVA and Tukey’s test were used to determine the statistically significant difference at p < 0.05 as identified by different letters. The codes for the mushroom samples are as follows: SM: shiitake mushroom; WBM: white button mushroom; OM: oyster mushroom; SBM: Swiss brown mushroom; NM: needle mushroom; WFM: white flat mushroom; OWM: organic white mushroom; WCM: white cup mushroom; BPM: brown portobello mushroom; PFM: portobello flat mushroom.
Processes 11 01711 g002
Table 1. Liquid chromatography–electrospray ionization quadrupole time-of-flight mass spectrometry (LC-ESI-QTOF-MS/MS) and tentative characterization of mushroom polyphenolic compounds.
No.Proposed CompoundMolecular FormulaRT
(min)
Ionization ModeMolecular WeightTheoretical (m/z)Observed (m/z)Mass ErrorSample
Phenolic acids
Hydroxyphenylpropanoic acids
1Dihydrocaffeic acid 3-O-glucuronideC15H18O104.16** [M-H]358.0910357.0837357.08370 * WBM, SM, WFM
Hydroxycinnamic acids
2 ***p-Coumaroyl malic acidC13H12O73.65[M-H]280.0586279.0513279.0511−0.7 * WFM, OWM, PFM, SM
3Cinnamic acidC9H8O24.53[M-H]148.0538147.0465147.0463−1.4 * SM, NM, WFM, BPM, PFM, OWM, OM
Flavonoids
Isoflavonoids
4DalberginC16H12O43.88[M-H]268.0734267.0661267.06661.9 * SM, PFM, NM
52′,7-Dihydroxy-4′,5′-dimethoxyisoflavoneC17H14O63.83** [M+H]+314.0787315.0860315.08600 * BPM, NM, WBM
66″-O-AcetyldaidzinC23H22O103.96[M-H]458.1202457.1129457.11514.8 SM
Flavonols
7Kaempferol 7-O-glucosideC21H19O113.35 [M-H]447.0910446.0837446.08584.7 WBM
Flavanones
8EriocitrinC27H32O1554.24 [M-H]596.1713595.1640595.1638−0.3 * WFM, OM
Flavanols
9(+)-Catechin 3-O-gallateC22H18O103.72 [M-H]442.0857441.0784441.0783−0.2 * WBM, OWM, PFM
104′-O-Methyl-(-)-epigallocatechin 7-O-glucuronideC22H24O1354.71 [M-H]496.1233495.1160495.11640.8 * WCM, WFM
Dihydroflavonols
11Dihydroquercetin 3-O-rhamnosideC21H22O113.61[M-H]450.1144449.1071449.1069−0.4 * SM, WFM
123-Hydroxyphloretin 2′-O-xylosyl-glucosideC26H32O1559.78[M-H]584.1766583.1693583.1692−0.2 BPM
Anthocyanins
13Cyanidin 3-O-(6″-acetyl-glucoside)C23H23O123.06[M-H]−491.1176490.1103490.1102−0.2 * SBM, NM, SM, PFM, WCM, WBM, WFM, OWM, OM
14 ***Petunidin 3-O-(6″-acetyl-glucoside)C24H25O133.80[M+H]+521.1297522.1370522.13965.0 PFM
Lignans
15Todolactol AC20H24O74.43[M-H]376.1519375.1446375.1435−2.9 NM
16Schisandrin CC22H24O641.09** [M+H]+384.1540385.1613385.1607−1.6 * OM
17DeoxyschisandrinC24H32O63.11** [M-H]416.2196415.2123415.21332.4 * BPM, SM, WCM
18SchisandrinC24H32O74.84** [M+H]+432.2154433.2227433.2222−1.2 * SM, NM
Stilbenes
19Trans-ResveratrolC14H12O34.58[M-H]228.0780227.0707227.0706−0.4 * WCM, WBM, OWM, NM, WFM
20Resveratrol 5-O-glucosideC20H22O83.81[M-H]390.1311389.1238389.12400.5 NM
Other polyphenols
Tyrosols
213,4-DHPEA-EDAC17H20O64.87[M-H]320.1276319.1203319.1195−2.5 * PFM, WFM
Phenolic terpenes
22Carnosic acidC20H28O457.83** [M-H]332.1997331.1924331.1923−0.3 * SM, NM, WCM
* The same phenolic compound was detected in more than one mushroom sample and the data shown in this table are from the asterisked samples. ** Compounds were detected in both negative [M-H] and positive ion [M+H]+ modes and only single mode data are provided in this table. *** Compounds identified for the first time in this study. As shown in the last column of the table, the codes for the mushroom samples are as follows: BPM: brown portobello mushroom; SM: shiitake mushroom; WBM: white button mushroom; OWM: organic white mushroom; WFM: white flat mushroom; WCM: white cup mushroom; PFM: portobello flat mushroom; SBM: Swiss brown mushroom; OM: oyster mushroom; NM: needle mushroom.
Disclaimer/Publisher’s Note: The statements, opinions and data contained in all publications are solely those of the individual author(s) and contributor(s) and not of MDPI and/or the editor(s). MDPI and/or the editor(s) disclaim responsibility for any injury to people or property resulting from any ideas, methods, instructions or products referred to in the content.

