Article

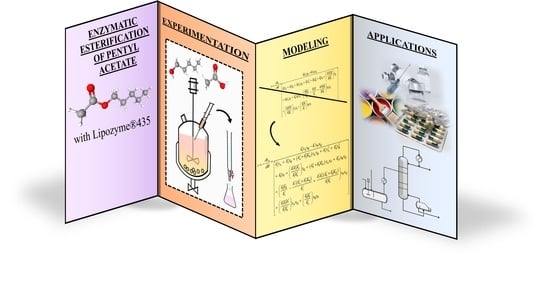
Improvements in the Modeling and Kinetics Processes of the Enzymatic Synthesis of Pentyl Acetate

Division of Thermal Engineering & Instrumentation (IDeTIC), University of Las Palmas de Gran Canaria, 35017 Las Palmas de Gran Canaria, Spain
*
Author to whom correspondence should be addressed.
Processes 2023, 11(6), 1640; https://doi.org/10.3390/pr11061640
Submission received: 18 April 2023 / Revised: 17 May 2023 / Accepted: 23 May 2023 / Published: 26 May 2023
(This article belongs to the Special Issue Recent Advances in Green Synthesis Catalysis)

Abstract

:
In this work, the enzymatic synthesis of pentyl acetate obtained from acetic acid and pentan-1-ol using the commercial immobilized lipase Lipozyme®435 was studied. Specifically, the effects of several variables of the process on the kinetics were shown, such as the initial concentration of the acetic acid, the alcohol/acid molar ratio, and the possible reuse of the enzyme, while other variables, such as temperature, agitation, and the enzyme/acid ratio were held constant. The kinetics were determined by assessing the acetic acid concentration throughout the reactive process. Experimental data were correlated with the rate equation consisting of a modified version of the Bi–Bi Ping-Pong mechanism. The results showed that when no hydrophobic solvents were used with the reagents in stoichiometric proportion, a high molar fraction of acetic acid (x0,acid ≈ 0.50) caused the loss of enzymatic activity, achieving a conversion of only 5%. However, when there was an excess of pentan-1-ol, the reaction occurred successfully. Under optimal conditions (solvent-free conditions, x0,alcohol/x0,acid = 2, and x0,acid = 0.33), it was found that the enzyme could be reused up to 10 times without a loss of activity, reaching conversions higher than 80% after 8 h. Therefore, those conditions are advantageous in terms of productivity.

Graphical Abstract

1. Introduction

Short-chain esters are used in the chemical and pharmaceutical industry [1,2,3,4], especially in the production of substances for different sectors, solvents and polymers, cosmetics and creams, and also in the food sector as flavoring agents. In nature, esters are mainly found in plants and fruits but at low concentrations, and the cost of their extraction is high. The classical reaction to produce esters is the Fischer esterification method, which requires acid catalysts, but its development has advantages and disadvantages. Therefore, investigations are carried out to improve that synthesis process, not only from a scientific and technical point of view, but also to make it more sustainable. One option is to use immobilized lipases as a catalyst for the esterification reaction with the final formation of ester and water. Lipases are selective in the esterification process as they avoid unwanted secondary reactions and have a high catalytic activity at moderate temperatures (30–70 °C), not requiring high energetic consumption for the reaction. Moreover, in heterogeneous catalysis, the simple separation of the catalyst from the reaction medium and its reuse [5] are simple. In this sense, the use of enzymes immobilized on porous solid supports offers advantages over heterogeneous and enzymatic catalysis, as it combines the advantageous capabilities of both processes. European [6] and American [7] standards classify as “natural” those products obtained by enzymatic synthesis, which is currently attractive in the field of sustainable processes. Despite this, few industrial processes (only 5%) use enzymatic catalysis since less than 200 enzymes are used, whereas about 3000 are known [8]. What is the reason for this? In the case of the esterification with immobilized lipases, there are several important factors that influence the behavior of the reactive system: the nature of the acid, that of the alcohol and that of the enzyme, as well as the concentration of each of them in the medium in addition to the temperature and the solvent used to dilute the medium if necessary [2].
In this work, the influence of some of these variables on the kinetics of enzymatic esterification to produce pentyl acetate is analyzed. This compound, in addition to its use in some of the different industrial sectors indicated above, is specifically used in the pharmaceutical sector as an entrainer in the production of penicillin [9] and other antibiotics [10,11]. The synthesis process with acetic acid and pentan-1-ol is not sufficiently described in the literature [4,12], as the authors did not consider the optimal conditions for this reaction. However, there is published information showing improvements in the operating conditions for other esters, i.e., for isopentyl acetate [3,4,13,14,15,16,17], butyl acetate [3,4,18,19,20,21,22] or hexyl acetate [4,23]. In those references and in the patents reporting the development of some enzymatic processes for the production of short-chain esters [24,25], it is usual to perform the esterification with a very low concentration of reagents using hydrophobic solvents to dilute the medium. These conditions have proven to be optimal for achieving maximum conversion in the shortest possible time. However, the current industry requires optimizing the process using other criteria, such as (i) achieving higher productivity, (ii) minimizing the use of solvents, (iii) minimizing the mass-enzyme/mass-product ratio, and other more specific criteria, and even considering the possible reuse of the catalyst. Taking into account the purpose of this work, we have analyzed the influence of the following variables on the reaction process: (a) the initial concentration of acetic acid, (b) the molar ratio x0,alcohol/x0,acid, and (c) the reuse cycles of the catalyst used, the Lipozyme®435 immobilized lipase. Regarding this last variable, there is no information on the reuse of that enzyme in the production of short-chain esters, but there are some publications on the reuse of its predecessor, Novozym®435 [18,20,22]. The joint assessment of the different variables mentioned will reveal whether the esterification will be carried out adequately without the use of solvents in order to achieve the criterion (ii) already mentioned, one of the most relevant from the point of view of sustainability. To achieve the aforementioned objectives, the work tasks focus on the experimentation and modeling of the esterification kinetics.
The efficiency of the proposed modeling on the well-known Bi–Bi Ping-Pong mechanism was analyzed, checking its adaptation to the reactive process to obtain pentyl acetate. In addition, the model was also modified considering the deactivation of the enzyme by acid substrate [26,27] to improve the correlation of all kinetic data.

2. Materials and Methods

2.1. Materials

In the kinetics, acetic acid and pentan-1-ol were used as reagents with hexane as the solvent when necessary; all compounds were obtained from Merck (Rahway, NJ, USA) and were of the highest commercial purity. Before use, they were degassed by ultrasound and stored in the dark for several days with a molecular sieve, 3 Å from Fluka, to reduce the moisture content. After these operations, their purity was checked by gas chromatography (GC), improving slightly in relation to the initial value set by the manufacturer. In addition, some characteristic properties of the substances, such as the density ρ and the refractive index nD, were measured at a temperature of 298.15 K, and the values obtained were in agreement with those reported in the literature [28,29,30,31,32], as shown in Table S1. The moisture content of the products was less than 200 ppm based on the Karl–Fisher method. A commercial enzyme, Lipozyme®435, obtained by immobilizing lipase B from Candida antarctica on Lewatit VP OC 1600 resin, supplied by Novozymes Spain, S.A. (Madrid, Spain) was used as a catalyst. Information on the characterization of the enzyme is presented in literature [33], supplied by the same manufacturer.

2.2. Equipment and Methods

A GC Varian-450 with an Flame Ionization Detector (FID) and He as carrier gas was used to determine the purity of the compounds. Densities were measured in an Anton-Paar DMA 60/602 densimeter (ρ ± 0.02) kg⋅m−3 calibrated with bidistilled water obtained in our laboratory (with conductance <1 μS) and nonane puriss from Merck, according to our proposal [34]. The nD’s were measured in a Zuzi-320 refractometer, type Abbe (nD ± 0.0005) calibrated with water. Both devices were thermostatted at T = (298.15 ± 0.01) K using water from a Polyscience 1166D thermostatic bath at (T ± 0.02) K. The reactions were carried out in a 50 mL glass reactor equipped with a double wall, with inlets for sampling and other accessories; see the scheme of the experimental methodology in Figure 1. The reactor has a paddle stirrer with adjustable velocity u; the temperature is controlled by means of thermostatized water circulating through the outer jacket of the reactor, at (t ± 0.1) °C, from a Heto GB7 bath that maintains the system at the selected temperature during the reaction process.

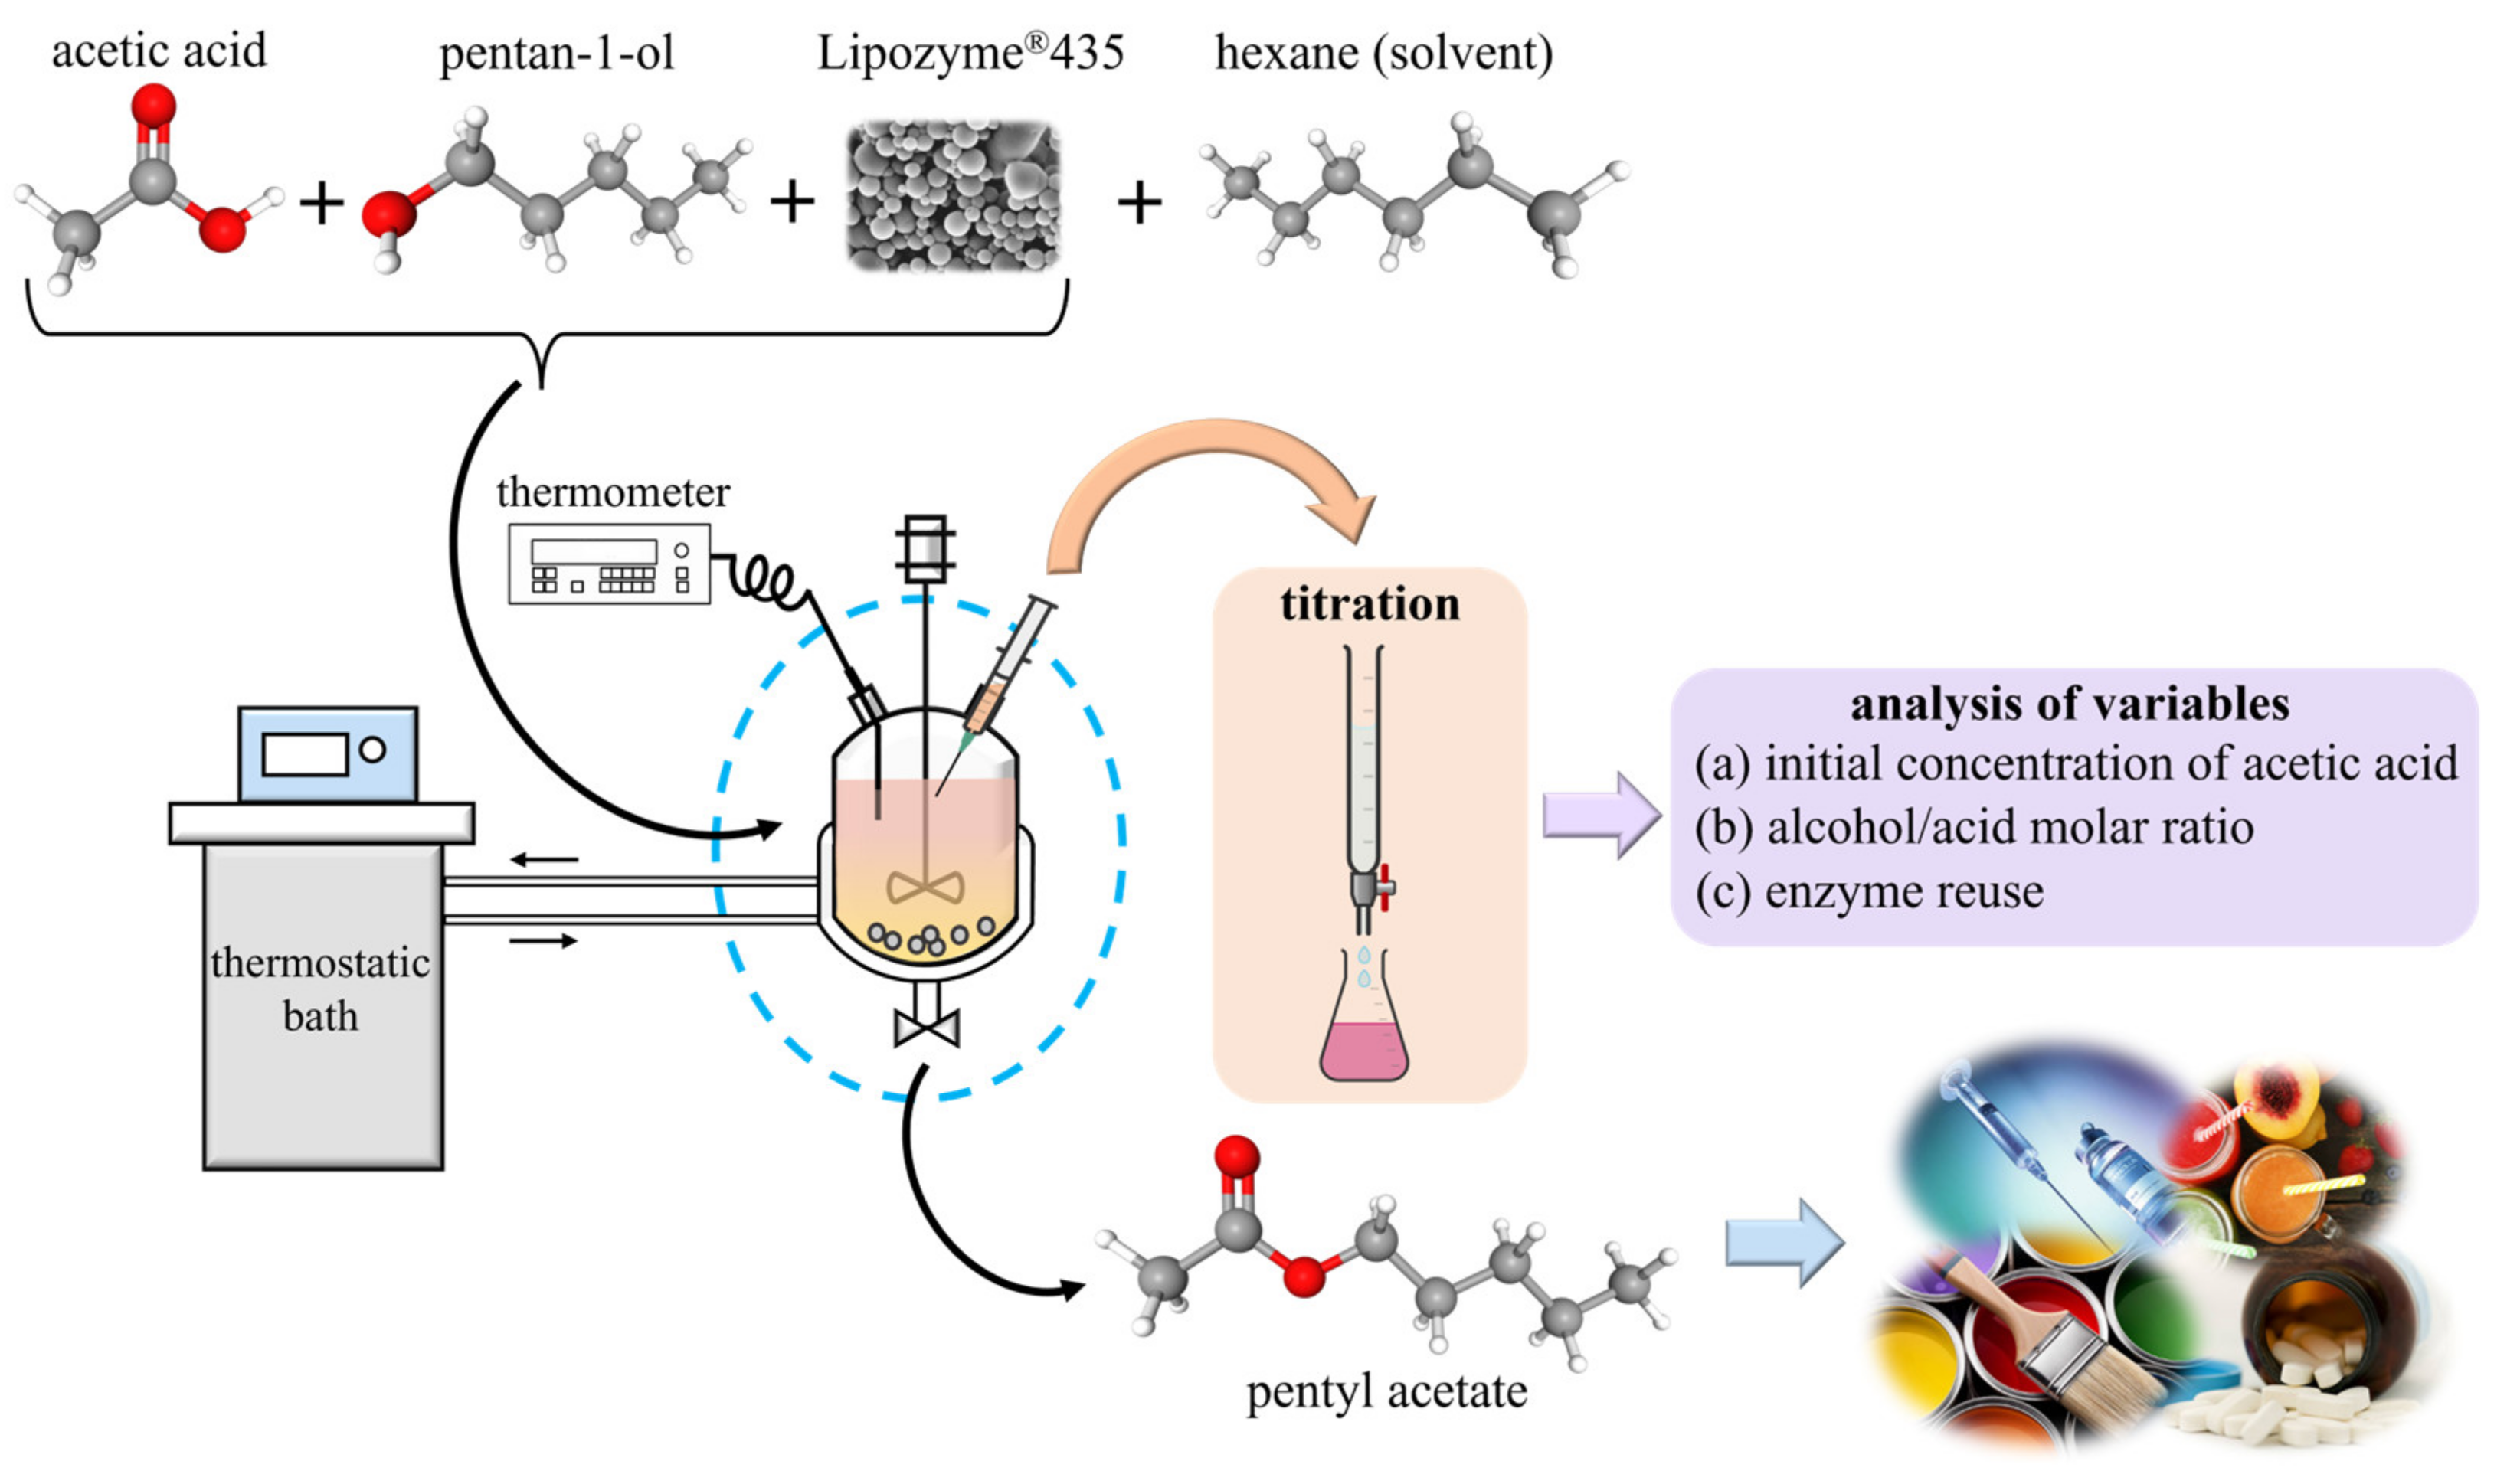
2.3. The Experimental Procedure and Reaction Conditions

The amounts of the reagents (acetic acid and pentan-1-ol), catalyst (Lipozyme®435), and solvent (hexane) initially added to the reactor were determined by weighing on a Gram STA-220 analytical balance, (m ± 0.0001) g. The evaluation of the kinetics was performed at certain time intervals by acid–base titration on samples of unreacted acetic acid, using as an indicator a standard solution of NaOH and phenolphthalein 1% in ethanol, see Figure 1. The estimated uncertainty for the compositions obtained from the samples was x ± 0.05. The hydrolysis of the ester did not significantly affect the titration, which was previously checked using several standard samples prepared with known amounts of acetic acid and ester.
The experiments in the reactor, working in batch mode, were performed under the constancy of certain parameters such as the following: the total volume of liquid components in the reactor = 40 mL, t = 40 °C, u = 100 rpm, using a mass of Lipozyme®435 corresponding to 10% w/w of acetic acid [35,36], and considering its volume negligible. When necessary, sufficient hexane as solvent [36,37] was added to the reactor to complete the indicated volume with all reaction components. The conditions selected above were not arbitrary, as they were chosen based on other experiences that demonstrated improvements in the efficiency of the esterification process. The low agitation u is noteworthy; this is to guarantee the structural integrity and functionality of the catalyst, avoiding its deterioration, so the indicated amount of enzyme is sufficient to not limit the reaction rate. In addition to the established conditions, the effects of other parameters on the reactive process were evaluated as indicated in the introduction: the initial composition of acetic acid in the range x0,acid ∈ {0.10–0.50}; the initial ratio of reagents, alcohol/acid, x0,alcohol/x0,acid = 1,2,3, and the reuse cycle of the enzyme. The latter was analyzed taking into account a specific assay, considered as optimal from a point of view of productivity, a parameter defined in the following section.
The kinetics were studied analyzing the distribution of experimental points obtained during the reaction process in the batch-reactor. During the course of the reaction and at different θ-times, samples of the reaction medium of approximately 0.1 mL were taken to assess their evolution by acid–base titration, as described above.

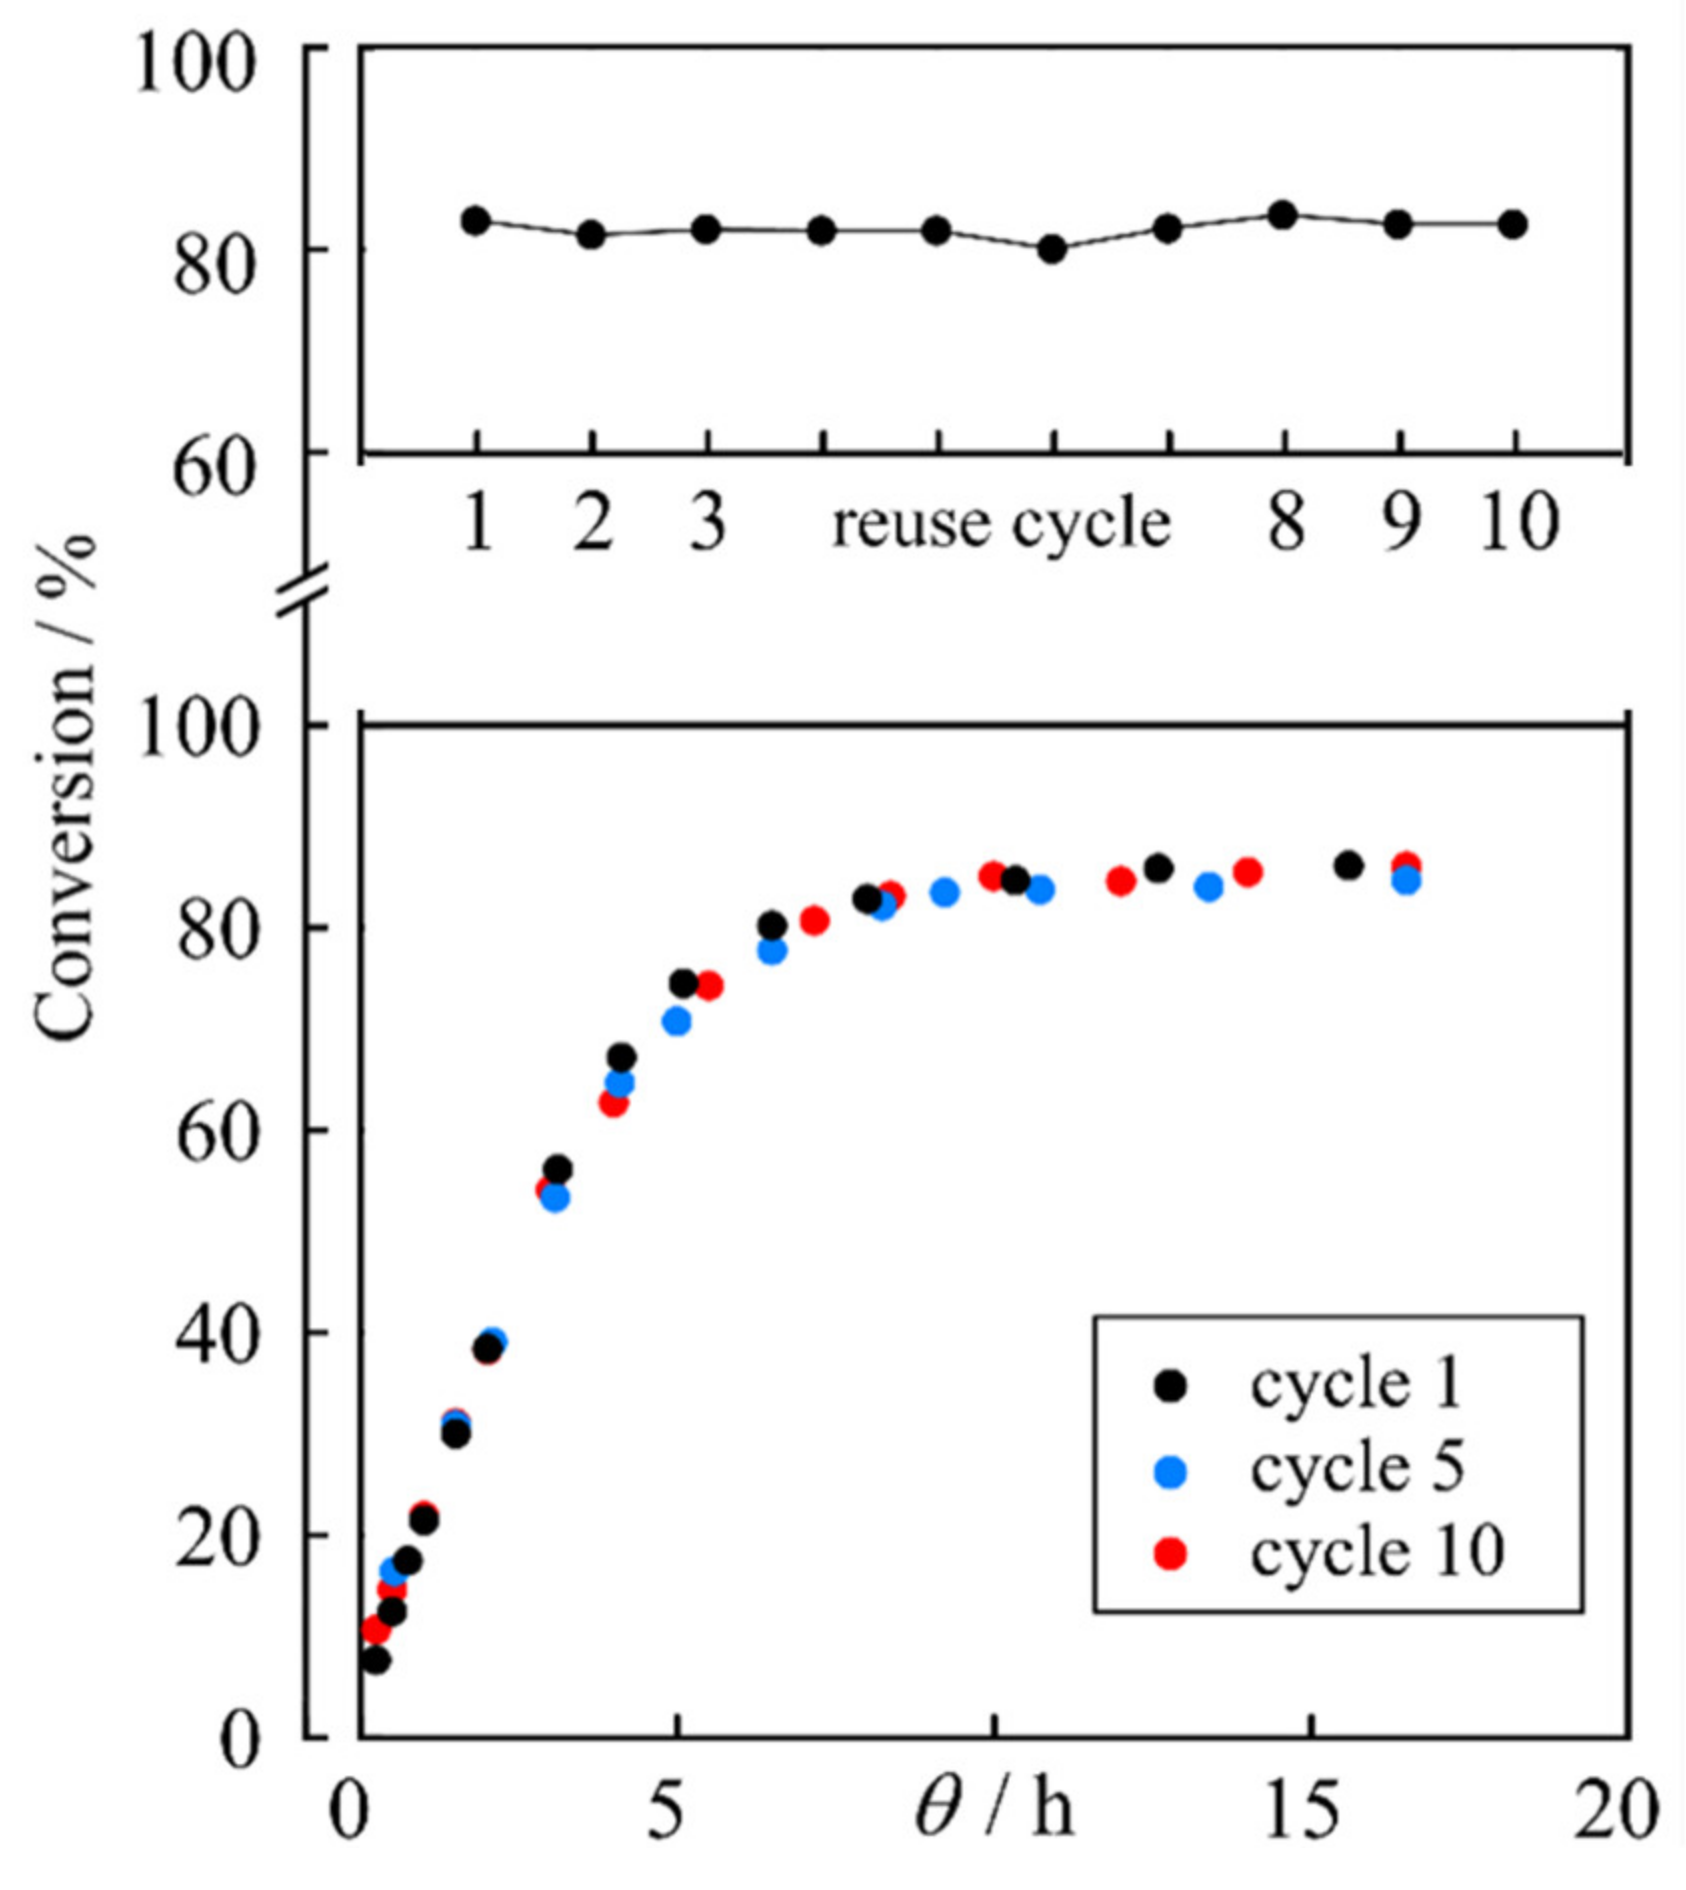
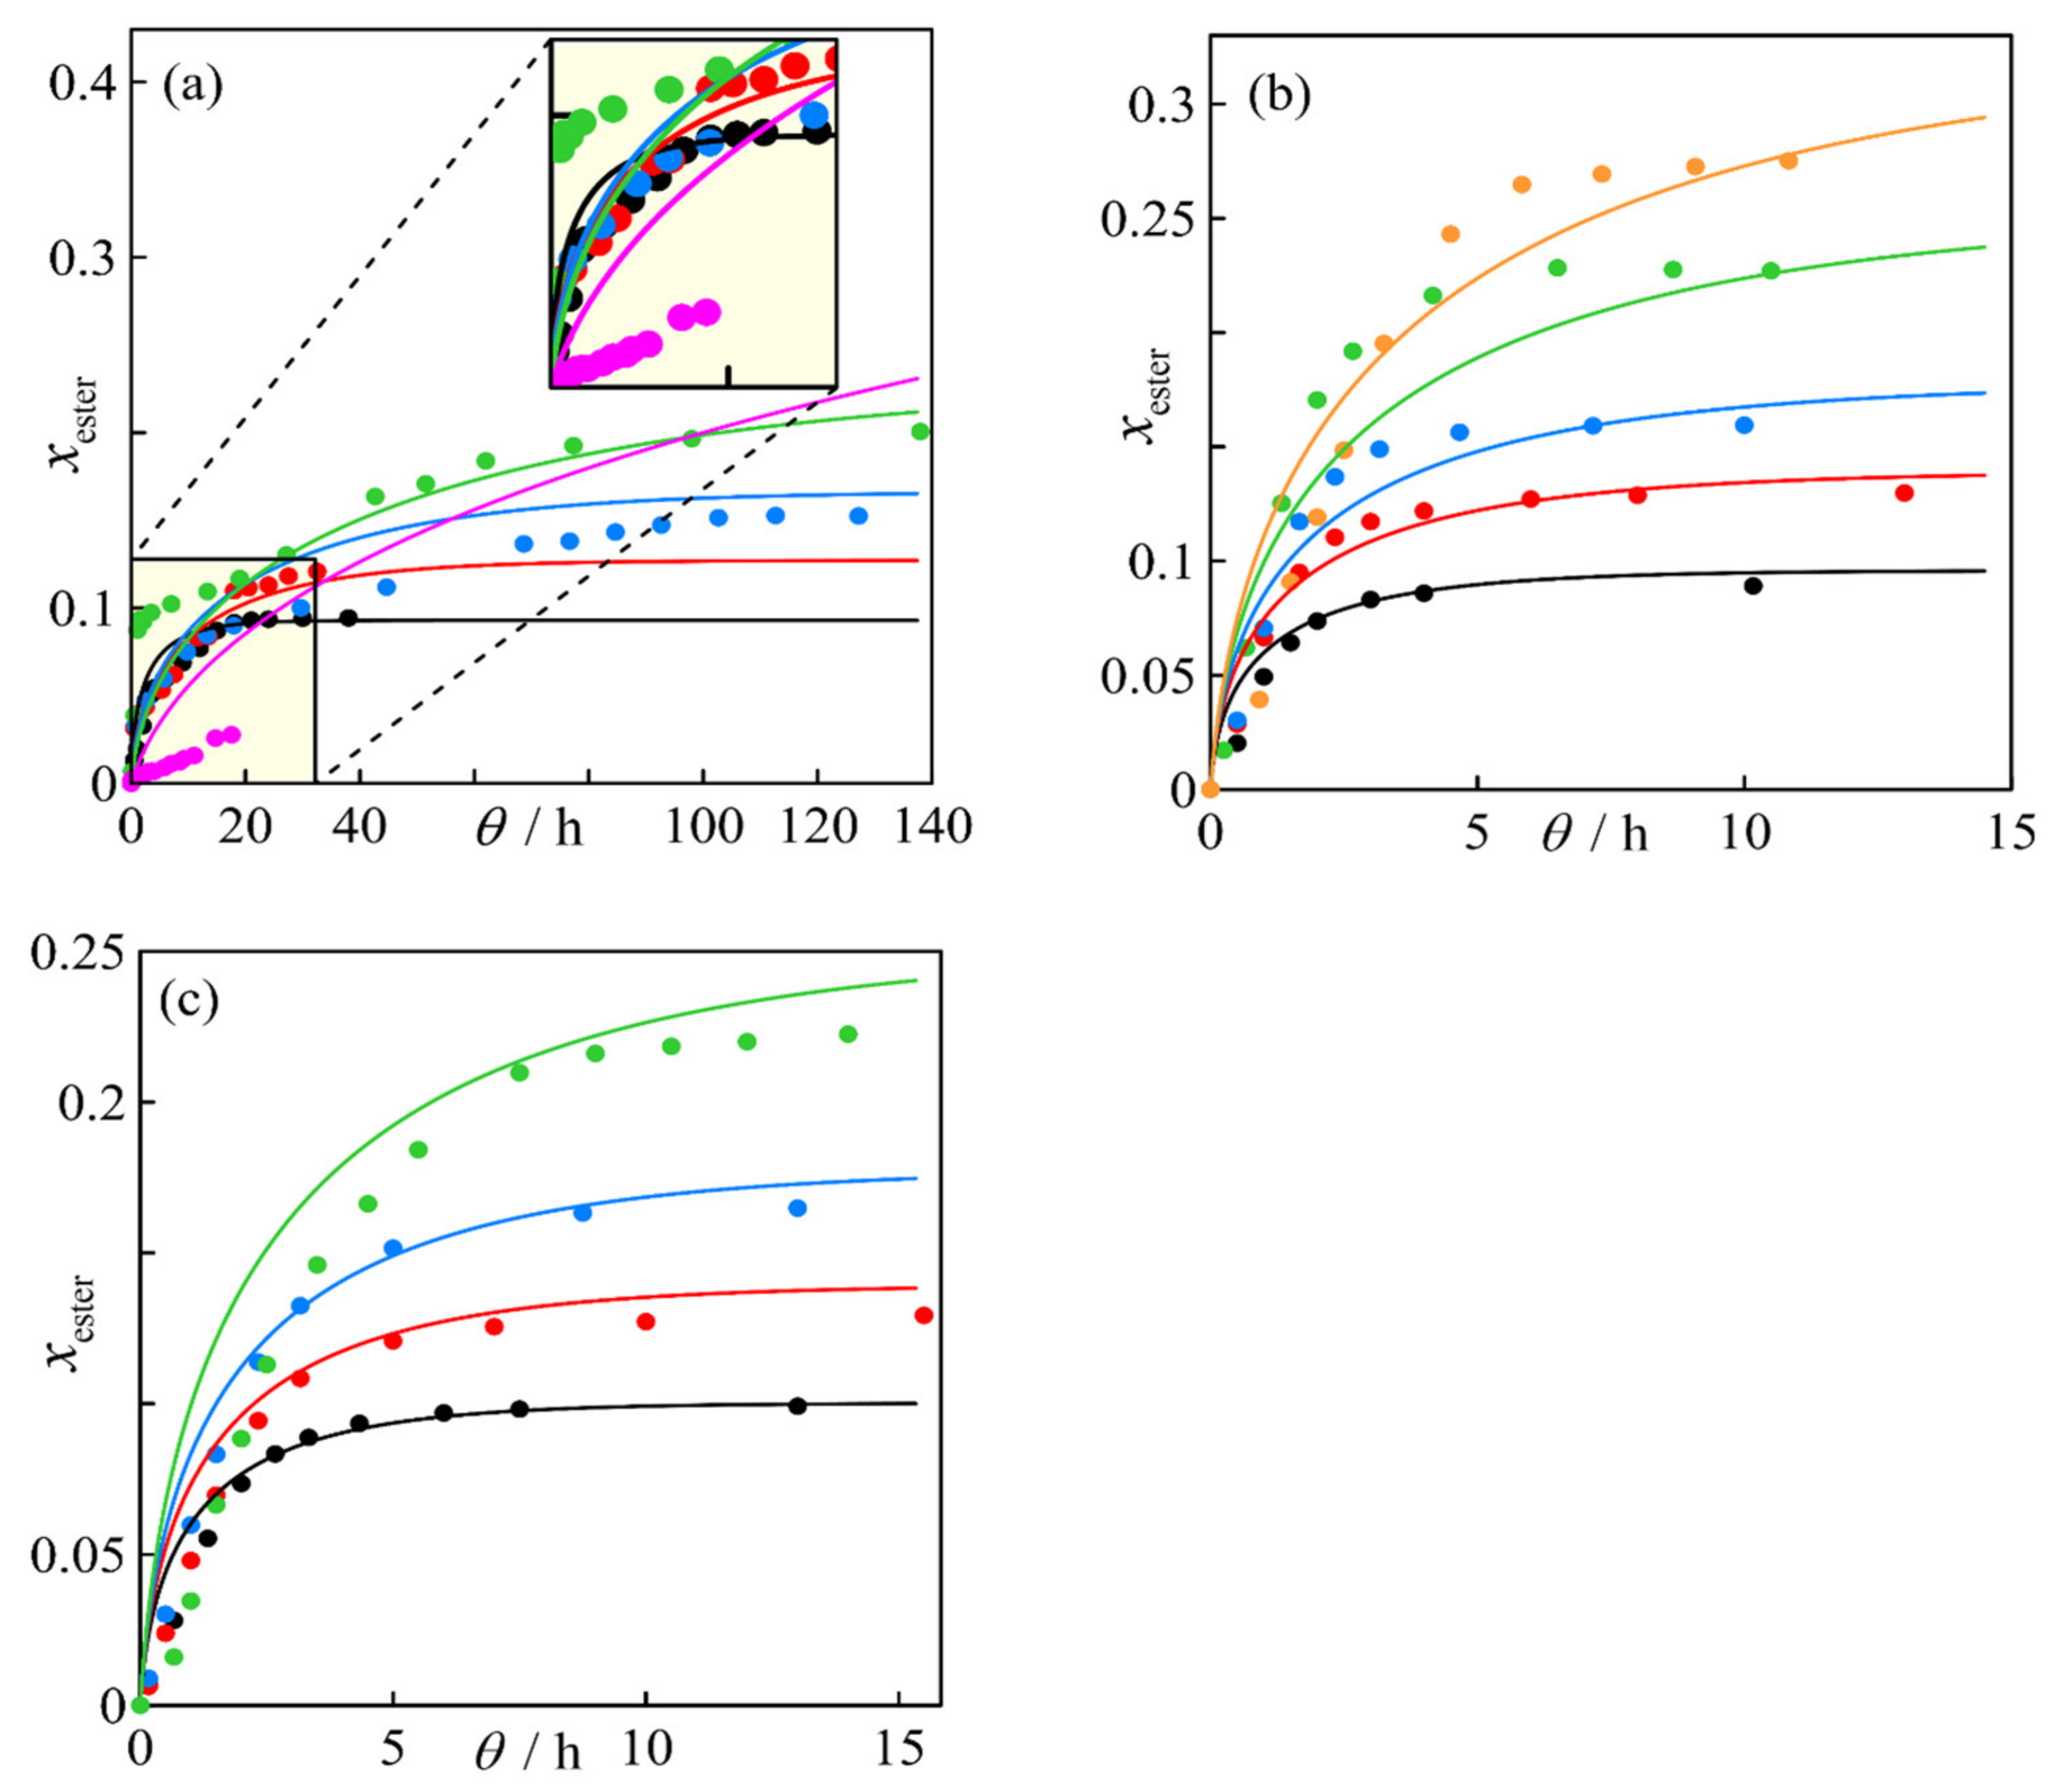
3. Results and Discussion

Table 1 shows, for each experiment, the value of the final conversion, calculated as 95% of the equilibrium conversion and the time elapsed to reach it. Figure S1a shows the results of the tests carried out for the ratio x0,alcohol/x0,acid = 1 and for different acid concentrations, showing the progress of the reaction versus θ-time. In that figure, low reaction rates are observed, especially when high initial acid concentrations are used (x0,acid = 0.18 and 0.25, corresponding to assays 3 and 4, respectively, in Table 1). Due to this, as shown in Figure S1a, the evolution of the kinetics was analyzed over several days to confirm that the equilibrium conversion was reached.
The assay corresponding to the ratio x0,acid = 0.10 (assay n° 1) reached equilibrium earlier. In the assay n° 5, for x0,acid = 0.50 (solvent-free), the reaction rate was much lower, with a conversion close to 5% after 20 h. Figure S1b,c show the experiments performed using the ratios x0,alcohol/x0,acid = 2 and 3, indicating that the reaction rates are higher than those in the previous case, with conversions greater than 80% in 8 h. These two tests show that, for the same concentration of acetic acid, the course of the reaction is similar for both cases, that is, increasing this ratio does not benefit the esterification process. In these series, it is also observed that the solvent-free assays corresponding to x0,acid = 0.33 (assay n° 10 in Table 1, see Figure S1b) and x0,acid = 0.25 (assay n° 14 in Table 1, see Figure S1c) produce the highest reaction rates. This indicates that it is possible to perform the enzymatic esterification without a solvent and to produce an optimal situation that maximizes the reaction rate.
In practice with these types of processes, many authors [18,19,20] have worked with diluted systems, and some publications [14,17] show similar results to those obtained in this work. In most of them, the results of the reactions are analyzed considering the conversion degree but ignoring other possible variables, such as the productivity, expressed in Table 1. The values of said parameters were calculated as the amount of the final product obtained (ester) per feed mass (considering all compounds initially introduced in the reactor), showing that a higher conversion does not imply the existence of a higher concentration of the desired product (pentyl acetate) in the reaction medium. Thus, the assay that offers the best productivity, n° 10, was performed in a solvent-free medium and with 100% alcohol in excess. In some studies, concentrated systems are discarded, as the optimal reaction conditions are selected according to the initial reaction rate [22]. However, it is not advisable to use this practice to select certain conditions for solvent-free reactive systems, since as described by Rodrigues Sousa et al. [38], in solvent-free systems, the reaction medium is a dynamic environment whose properties change during the development of the reaction.
Regarding the reuse of the enzyme as a catalyst, successive experiments were carried out using the working conditions of the assay n° 10, which, as indicated, was selected for producing the highest ester concentration in 8 h. Nine additional assays to n° 10 of the reactive process, noted as 15–23 in Table 1, were performed using the enzyme extracted from the reactor. Figure 2 shows the results obtained for the experiment with fresh catalyst (assay n° 10) and those corresponding to the assays n° 18 and 23.
In the ten cited experiments, no change in the reaction kinetics was observed. In summary, the comments made above, complemented with Figure S1 and Figure 2 and Table S2, respond to the objectives stated in the introduction as (a–c).

4. Modeling: Correlation of Kinetic Data

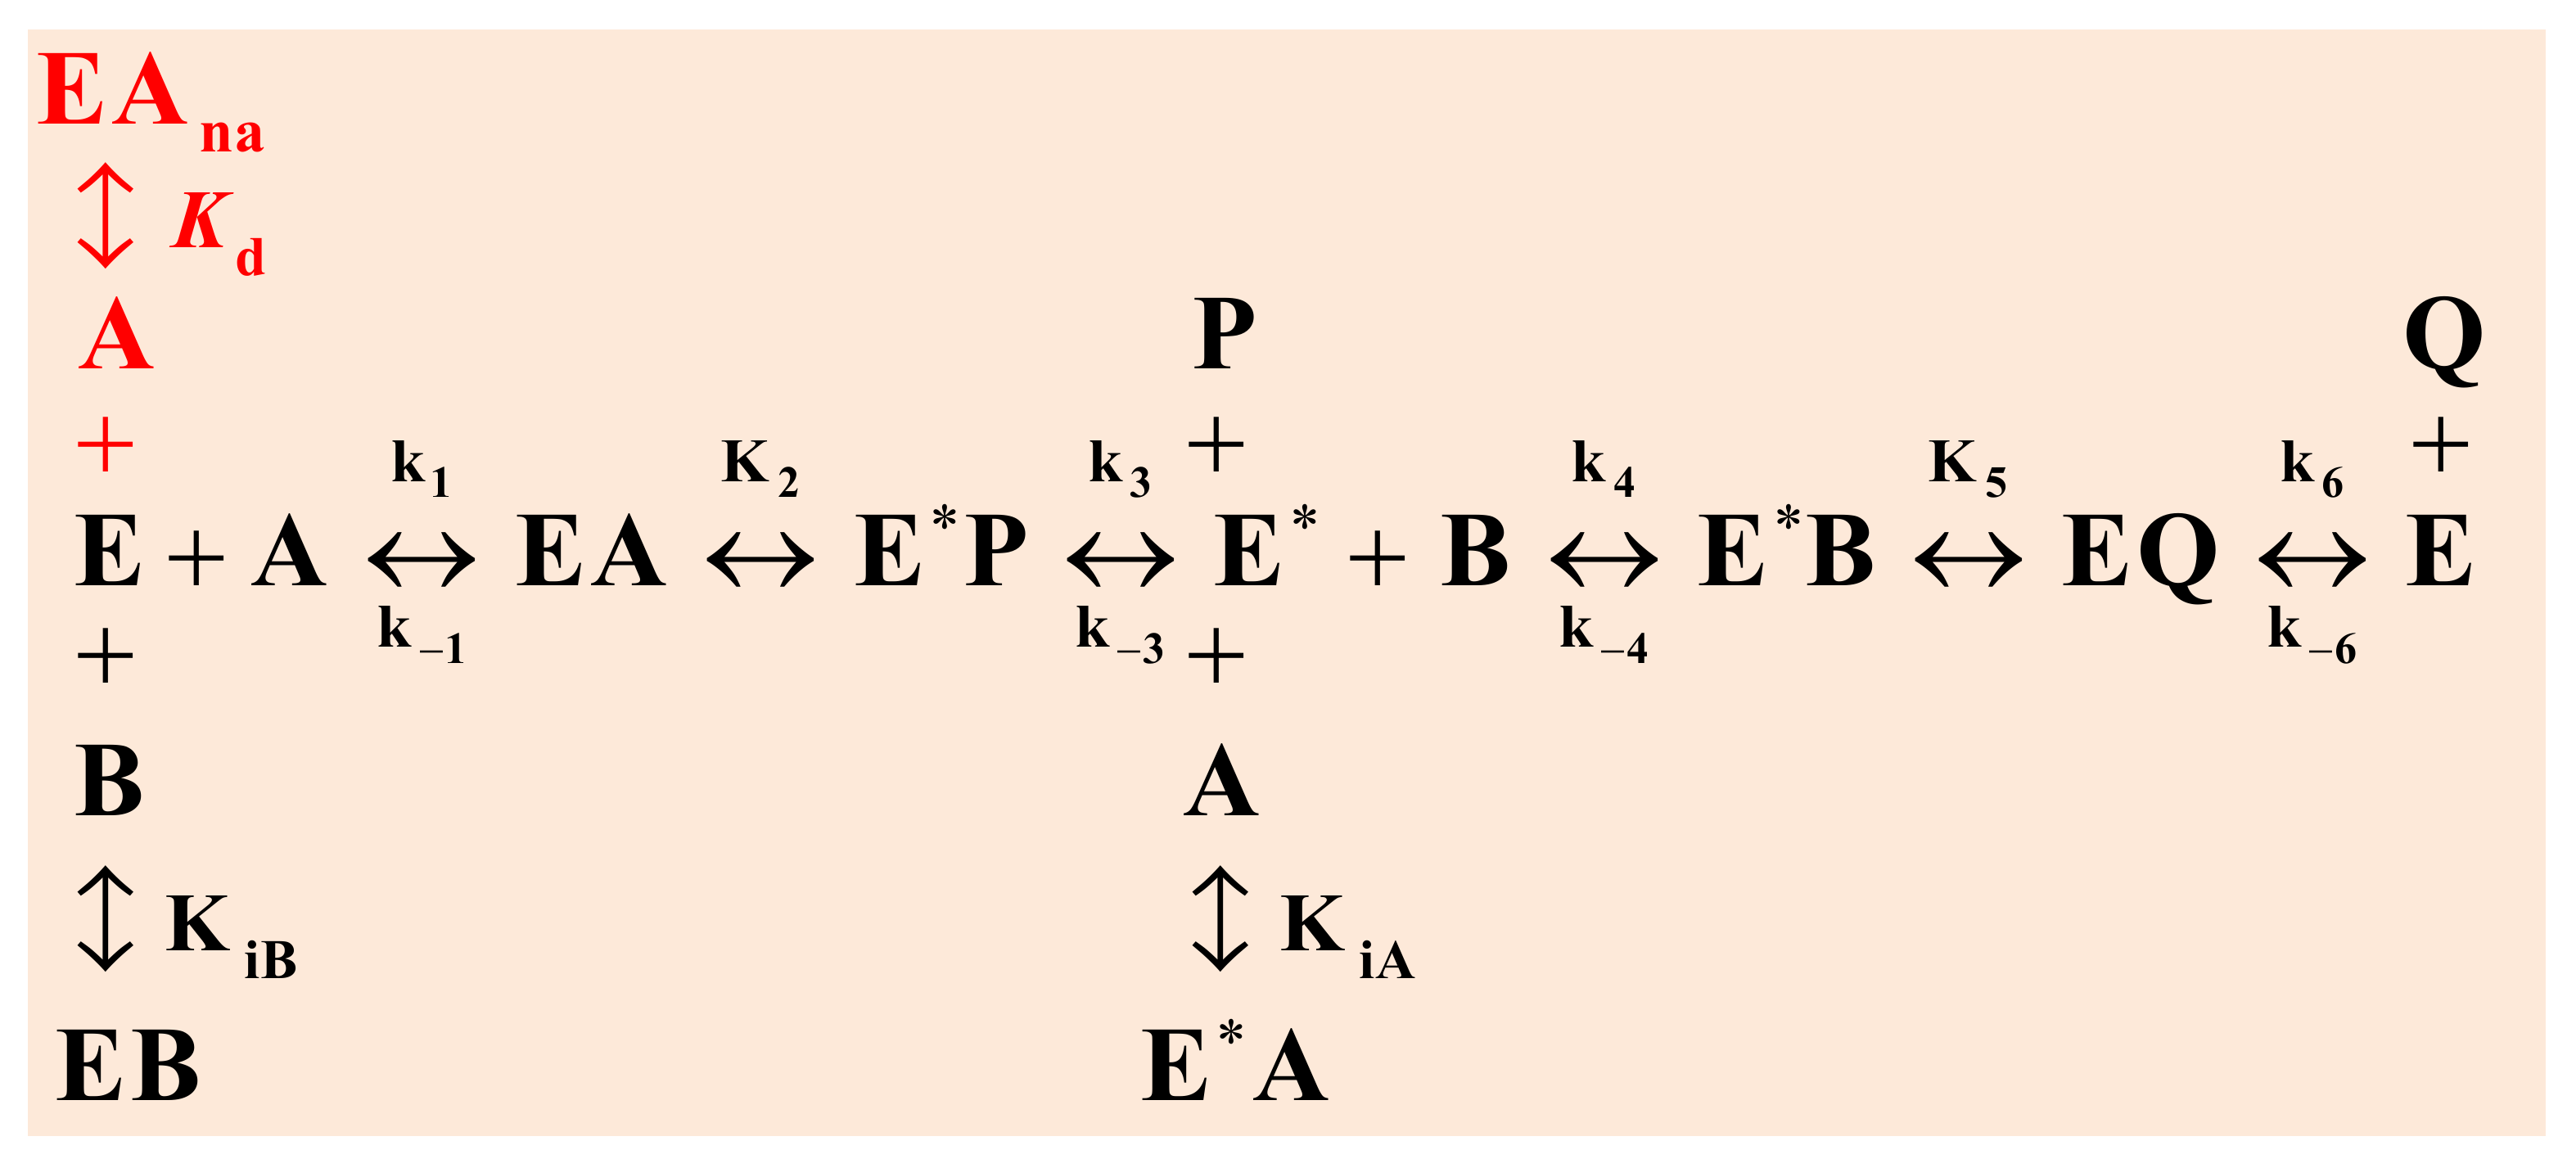
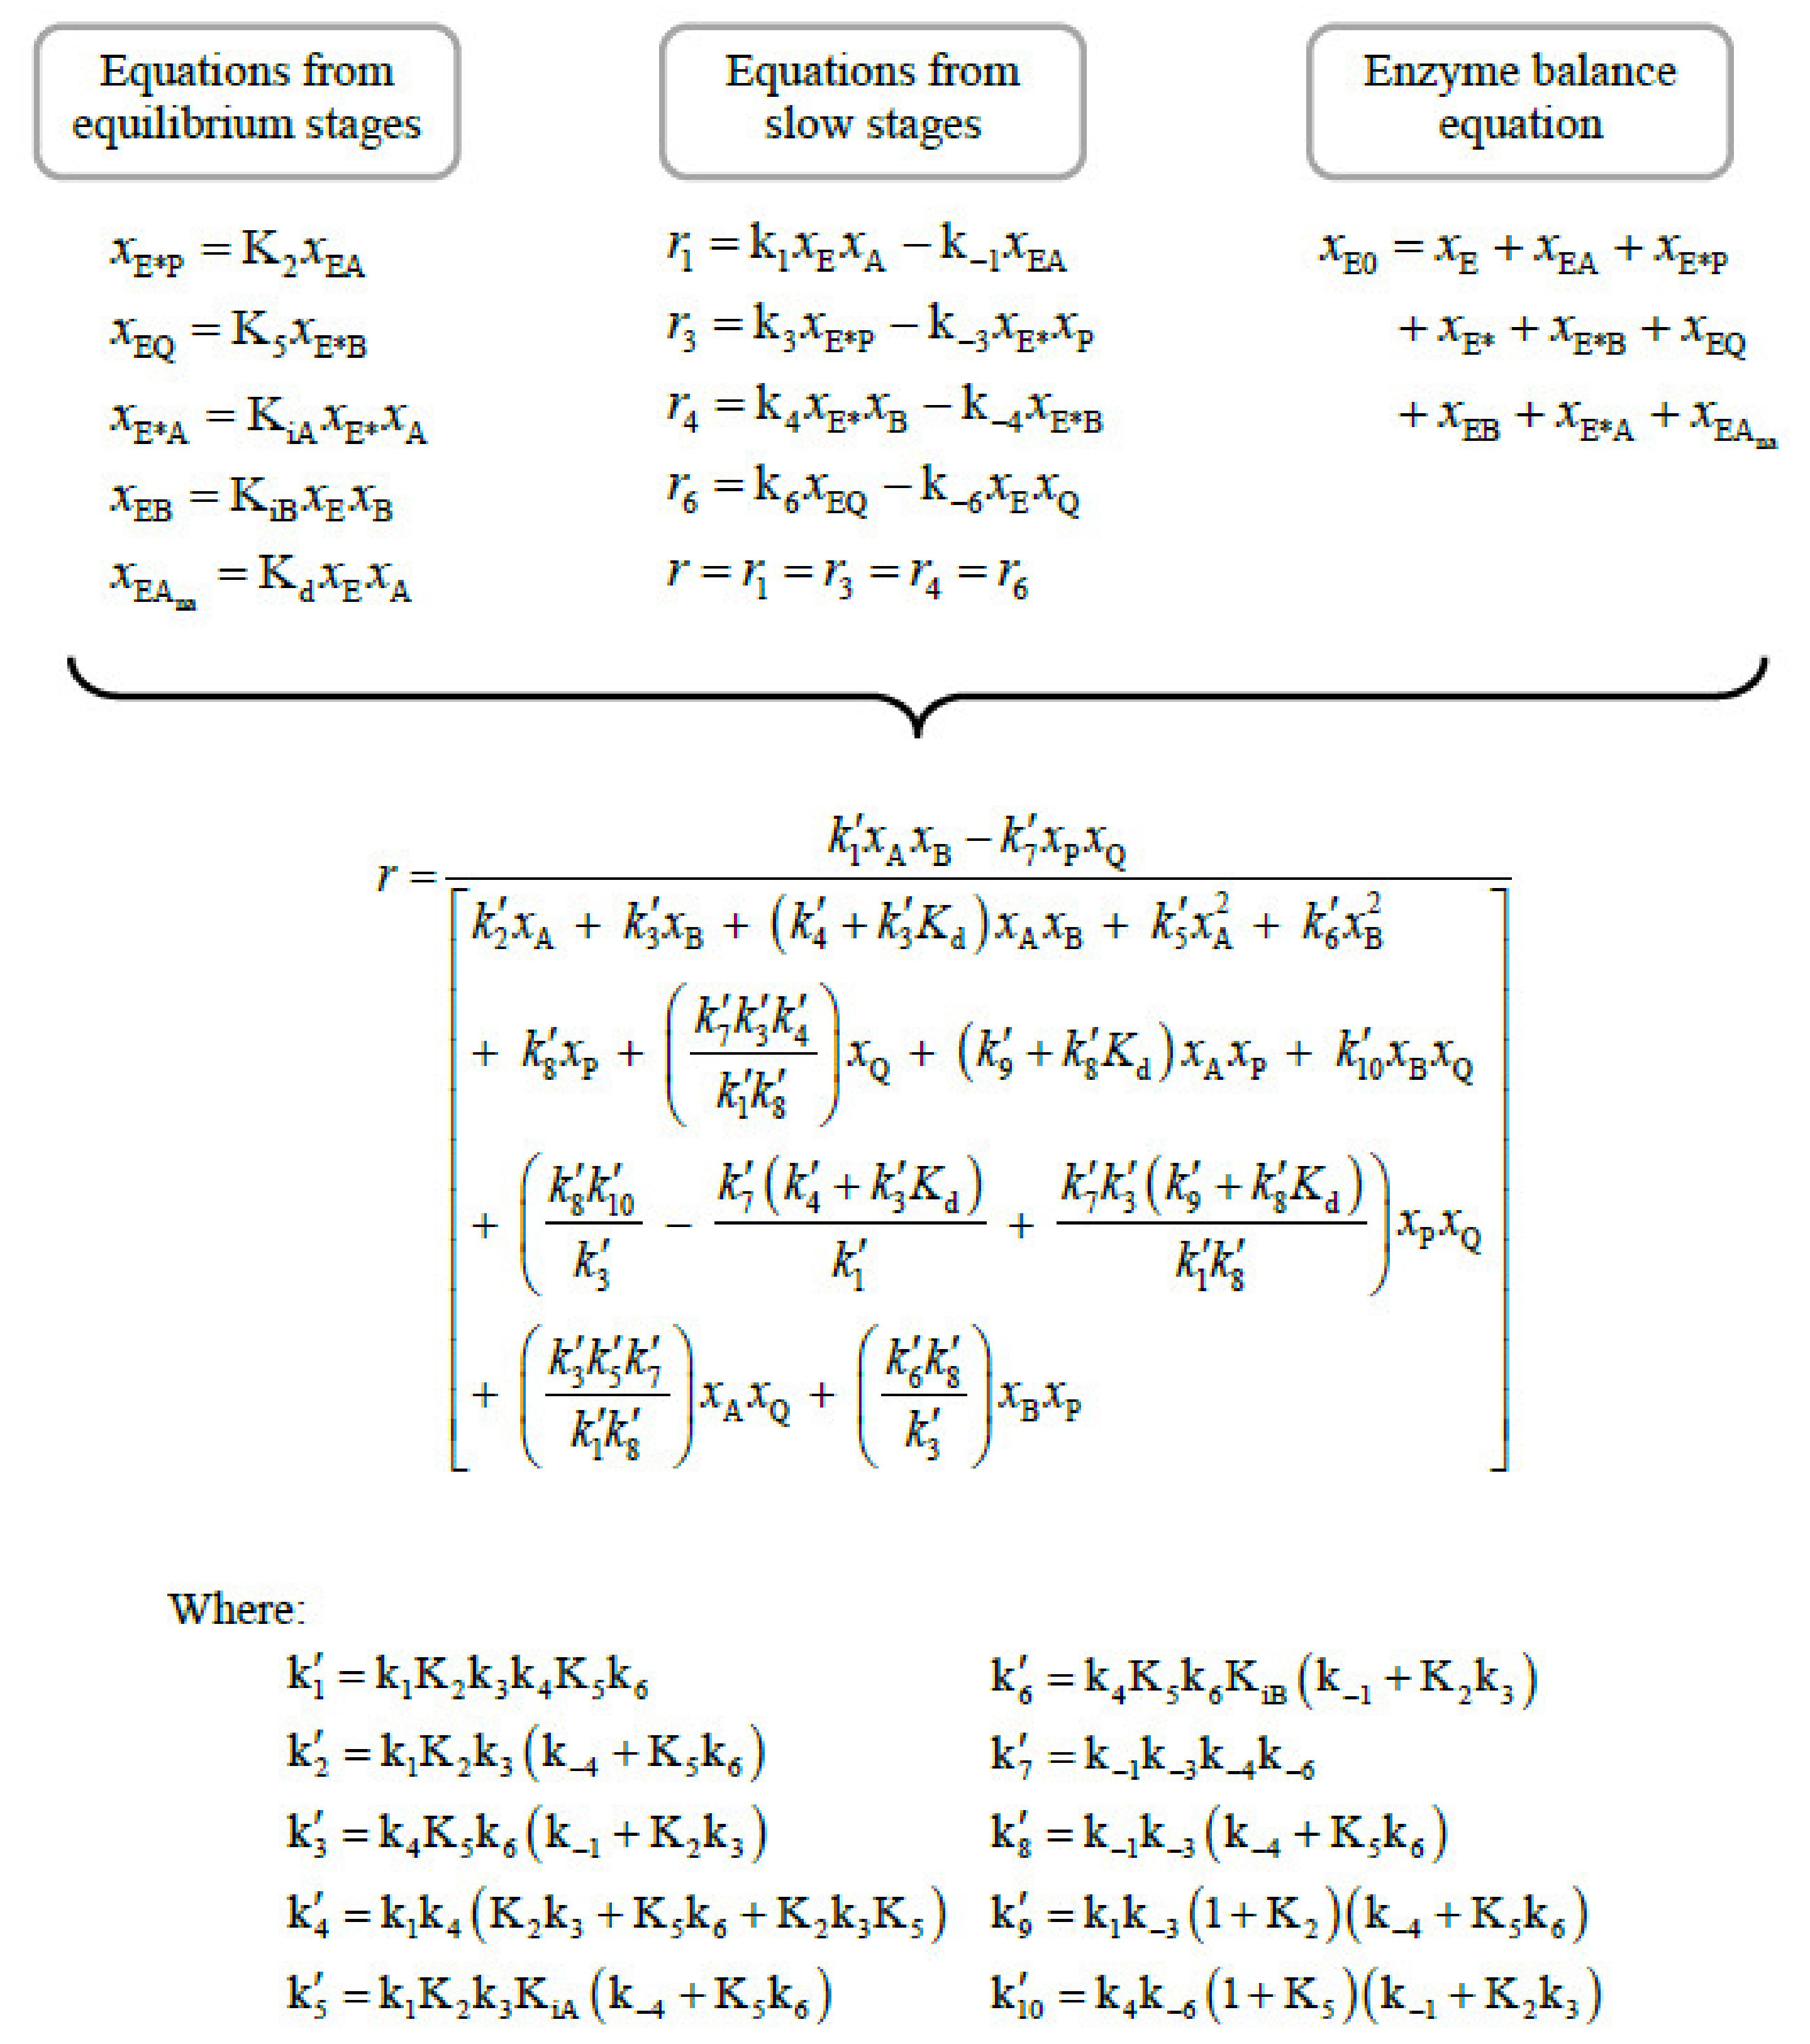
4.1. The Bi–Bi Ping-Pong Mechanism with Inhibition by Both Substrates

In order to analyze the kinetics of the reactions carried out for this work, an additional calculation was first made to determine the influence of mass transfer phenomena on the rate of the reactive process. The sequence of calculations performed is shown schematically in Appendix A; the results showed that these phenomena do not have a significant impact or at least have a very low influence, so they were not taken into account. This makes it possible to establish that the limiting stage is the chemical reaction itself and the experimental data should be modeled only by using a kinetic model.
The enzymatic esterification of a carboxylic acid (A) and an alcohol (B) is a “Bi–Bi reaction” (Bisubstrate–Biproduct). It is known that this type of reaction occurs through the so-called Ping-Pong mechanism, see Figure 3, where one of the reagents (A) binds to the enzyme in its original state (E), releasing one of the reaction products (P), modifying the structure of the catalyst (E*). The second substrate (B) then binds to the active sites of the modified enzyme (E*) to generate the second product (Q). In this way, the enzyme is restored to its original state (E). In addition to this previous description, other authors [2,13] report that if the reagents bind incorrectly to the enzyme, the enzymatic activity is inhibited due to the formation of terminal complexes (EB, E*A). This is reflected through the intermediate stages (in black) in Figure 3.
The mechanism of these reactions is complex, but its interpretation can be simplified by adopting a number of justifiable assumptions and approximations, taking into account some basic concepts known in the field of the kinetics, such as (1) the equilibrium stages between the enzymatic complexes and those of the formation of dead-end complexes are considered fast stages; (2) all stages involving reactants and/or products are considered slow stages; and (3) there is no accumulation of intermediate enzymatic complexes. Taking these approximations into account, the following rate equation is obtained for the mechanism described in Figure 3 according to the sequence set out in black.
With these approximations and conveniently grouping the kinetic constants kj and the equilibrium Kj (described in the mechanism shown in Figure 3) into the fitting parameters k j , by means of the relationship presented in Appendix B, the following rate equation is obtained:
r = d x A d θ = k 1 x A x B k 7 x P x Q k 2 x A + k 3 x B + k 4 x A x B + k 5 x A 2 + k 6 x B 2 + k 8 x P + k 7 k 3 k 4 k 1 k 8 x Q + k 9 x A x P + k 10 x B x Q + k 8 k 10 k 3 k 7 k 4 k 1 + k 7 k 3 k 9 k 1 k 8 x P x Q + k 3 k 5 k 7 k 1 k 8 x A x Q + k 6 k 8 k 3 x B x P
The parametrization of Equation (1) was performed correlating the experimental data x vs. θ using the interior-point method proposed by Lagarias et al. [39] and others [40,41], minimizing the following objective function.
R M S E = i = 1 N j = 1 n i x acid , i , j exp x acid , i , j cal 2 x acid , i , j exp / i = 1 N n i 1 / 2
where x acid , i , j exp and x acid , i , j cal are the respective experimental and calculated molar fractions of acetic acid for each point “j” of each assay “i”, ni is the number of experimental points in each assay, and N is the number of assays included in the correlation. The x acid , i , j cal values are obtained by solving the differential equation given as Equation (1), using the Runge–Kutta method of Dormand–Prince [42]. The quantification of the statistic indicated by Equation (2) relativizes the error, so that the difference in concentrations between the different experiments does not influence the quality of fit of some experiments relative to others. The parameters obtained are summarized in Table S2, and the calculated curves defining the progression of the reaction are plotted together with the experimental data in Figure S2. Although the assays with x0,acohol/x0,acid > 1 are reasonably reproduced by this model, Figure S2b,c, the experiments represented in Figure S2a are not correctly modeled. These results can be improved since the parametrization was not optimal. Therefore, we considered another option closer to the reality of the reactive process considering the denaturation of the enzyme, a fact that has been observed by other authors [23] and by own experimental experience working with a high concentration of acetic acid in the case of x0,alcohol/x0,acid = 1. It was considered to incorporate that fact into the assumptions of the model, which generates an extension of the mechanism with the denatured form of the enzyme added in red in Figure 3 (EAna) because acetic acid (A) binds to the enzyme in its original state (E). Logically, this also causes the modification of the mathematical model, which is now proposed as follows, considering first the initial reaction rate r0, and then the rate corresponding to the course of the process. The extended model is shown below:
r = d x A d θ = k 1 x A x B k 7 x P x Q k 2 x A + k 3 x B + k 4 + k 3 K d x A x B + k 5 x A 2 + k 6 x B 2 + k 8 x P + k 7 k 3 k 4 k 1 k 8 x Q + k 9 + k 8 K d x A x P + k 10 x B x Q + k 8 k 10 k 3 k 7 k 4 + k 3 K d k 1 + k 7 k 3 k 9 + k 8 K d k 1 k 8 x P x Q + k 3 k 5 k 7 k 1 k 8 x A x Q + k 6 k 8 k 3 x B x P
To achieve a better correlation of data when considering the denaturation of the enzyme, a dependence of the parameter Kd on the variables x0,acid and x0,alcohol/x0,acid was established. However, there is no theoretical model available for the denaturation of the enzyme that could be used in this work, so an empirical relationship was established. The analysis of the influence of these variables on the values of Kd, see Figure S3, checking the linearity of Kd with the logarithm of both variables, gave rise to the following equation:
K d = K d 0 x 0 , acid K d 1 x 0 , alcohol / x 0 , acid K d 2
This expression is used together with Equation (3) to model the behavior of the reaction rate considering the denaturation of the enzyme. To obtain the values of the parameters, the same algorithm mentioned in the previous section was used, but the greater complexity of the model made it advisable to carry out the parameterization in three steps as follows:
First step. The parameters k 1 , k 2 , k 3 , k 4 , k 5 , k 6 , K d 0 , K d 1 , K d 2 are fitted to initial reaction rate data minimizing the following objective function:
O F = i = 1 N r 0 , i exp r 0 , i cal / N 1 / 2
where r 0 , i exp and r 0 , i cal are the respective experimental and calculated initial reaction rates for each experiment “i” obtained from Equation (3), that is, at θ = 0:
r 0 = k 1 x A x B k 2 x A + k 3 x B + k 4 + k 3 K d x A x B + k 5 x A 2 + k 6 x B 2
Kd is obtained from Equation (4).
Second step. The parameters obtained in first step remain fixed, and the values for k 7 , k 8 , k 9 , k 10 are achieved by fitting the x versus θ data using Equations (3) and (4), minimizing the OF as Equation (2).
Third step. A global correlation is applied to all data x versus θ to obtain the optimal values of all parameters using Equations (3) and (4). As initial values of the correlation procedure, the values obtained in the previous step are introduced. In this way, finding inappropriate values as mathematical solutions of the numerical problem is prevented. This last fitting is again performed by minimizing the OF (Equation (2)), and the parameters obtained here are taken as definitive.
The values of the parameters and the root mean square error (RMSE) of the compositions calculated with the model, in relation to the experimental values, are presented in Table 2 and plotted together with the data in Figure 4, showing an adequate fit for systems with x0,alcohol/x0,acid > 1, Figure 4b,c, similar to those obtained by the initial form used, Equation (1). Figure 4a shows the modeling of the experiments with x0,alcohol/x0,acid = 1, with a better adaptation to experimental data. Despite this improvement, the model deviates from the data in the solvent-free case (assay n° 5), indicating the necessity to use more accurate models to reproduce the denaturation of the enzyme.

4.2. Modeling

Figure 4 shows the result of the modeling obtained with Equations (3) and (4), while Figure S2 reflects the representation using Equation (1). Although the comparison of the two figures does not seem to reveal any differences, some details of the implementation of both models are mentioned. The second version of the model, considering the enzyme denaturation, given by Equations (3) and (4), shows that the reaction kinetics are acceptably represented under all conditions, except for high concentrations of acetic acid with x0,alcohol/x0,acid = 1 and x0,acid = 0.5. Quantitatively, this latter model shows better results with RMSE = 0.021 compared to a value of 0.067 when the simpler version is used, Equation (1). The major difference between the results obtained occurs for the case mentioned above since the curve estimated by Equation (1) does not describe the experimental behavior. Furthermore, the modeling with Equations (3) and (4) reflects that the conversion and reaction rate of the system are the lowest of all experiments. This fact is important because most of the works in the literature do not use high concentrations of carboxylic acids and do not show these data or do not include them in the modeling because the kinetic behavior [43,44] is not regular.

5. Conclusions

The synthesis of pentyl acetate using acetic acid and pentan-1-ol, with Lipozyme®435 as the catalyst, was carried out using various proportions of the reagents and concentrations of the medium (including solvent-free conditions). Conversions higher than 80% were obtained after 8 h of reaction, except in the most concentrated systems, with a molar ratio x0,alcohol/x0,acid = 1, which presented the inhibition and/or loss of enzymatic activity due to the high concentration of acetic acid. The tests carried out allowed the establishment of the following optimal esterification conditions: a solvent-free medium, ratio of reagents x0,alcohol/x0,acid = 2, and an initial concentration of acetic acid of 3.6 M. Under these conditions, the catalyst could be reused in 10 successive cycles without loss of activity, reaching the values mentioned for conversion. The kinetic equation of the Bi–Bi Ping-Pong model, with the modifications proposed in this work considering the denaturation of the enzyme, in general properly describes the esterification kinetics studied.

Supplementary Materials

The following supporting information is available online at https://www.mdpi.com/article/10.3390/pr11061640/s1, Figure S1: Plot of experimental kinetic results; Figure S2: Plot of experimental kinetic results against primary modeling; Figure S3: Plot of empirical Equation (4); Table S1: Physical properties of compounds used; Table S2: Parametrization of Equation (1) using the primary modeling; Table S3: Parameters used in the calculation of the transfer effectiveness factors according to Appendix A.

Author Contributions

Conceptualization, B.L. and J.O.; methodology, B.L., L.F. and J.O.; software, B.L.; validation, J.O. and L.F.; formal analysis, J.O.; investigation, B.L. and J.O.; data curation, B.L.; writing—original draft preparation, B.L. and J.O.; writing—review and editing, L.F., J.O. and L.D.; visualization, J.O. and L.D.; supervision, J.O.; project administration, J.O.; funding acquisition, J.O. All authors have read and agreed to the published version of the manuscript.

Funding

This research was funded by the Spanish Ministry of Science and Innovation, grant number PID2021-127970OB-I00. All authors have agreed to mention this funding.

Data Availability Statement

The data used in this study are available in the article or Supplementary Materials.

Acknowledgments

One of us (B.L.) thanks her predoctoral contract (PRE2019-087401) from the Spanish Ministry of Science and Innovation.

Conflicts of Interest

The authors declare no conflict of interest.

Glossary

a = 6 / d p surface/volume ratio for spherical particles, cm−1
c 0 initial concentration, M
d p particle diameter of the catalyst, µm
D a obs observable Damköhler number
D eff internal effective diffusivity factor, cm2⋅s−1
D ij = D ji mutual diffusivity coefficient of the reactants i, j, cm2⋅s−1
D ij o diffusivity coefficient at an infinite dilution of compound i in j, cm2⋅s−1
D im diffusivity coefficient of compound i in the mixture, cm2⋅ s−1
D im o diffusivity coefficient of compound i at infinite dilution in hexane, cm2·s−1
k i parameters of Equations (1), (3) and (6)
k L matter transfer coefficient, cm⋅s−1
k i , K i reaction and equilibrium constants, Bi–Bi Ping-Pong mechanism, Figure 3
M molecular weight, g·mol−1
n D refractive index
n i number of experimental points for experiment i, Equation (2)
Nnumber of experiments in the correlation procedure, Equation (2)
rreaction rate, mol mol total 1 min 1
r 0 initial reaction rate, mol mol total 1 min 1
r 0 , obs observable initial reaction rate, mol mol total 1 min 1
T temperature, K
u stirring velocity, rpm
V i molar volume of i-compound that diffuses at boiling point, cm3⋅mol−1
x molar fraction
x 0 initial molar fraction
Greek letters
ε p porosity coefficient of the catalyst
ϕ Thiele module
Φ observable Thiele module
η E external effectiveness parameter
η I internal effectiveness parameter
φ association factor
μ m medium viscosity, cP
θ reaction time, h
ρ density, kg⋅m−3
τ tortuosity coefficient of catalyst
Super and subindices
Arelated to carboxylic acid
Brelated to alcohol
calcalculated from a model
expexperimental data
Prelated to water
Qrelated to ester
Acronyms
ERCenzyme reuse cycle
OFobjective function
GCgas chromatography
RMSEroot mean square error

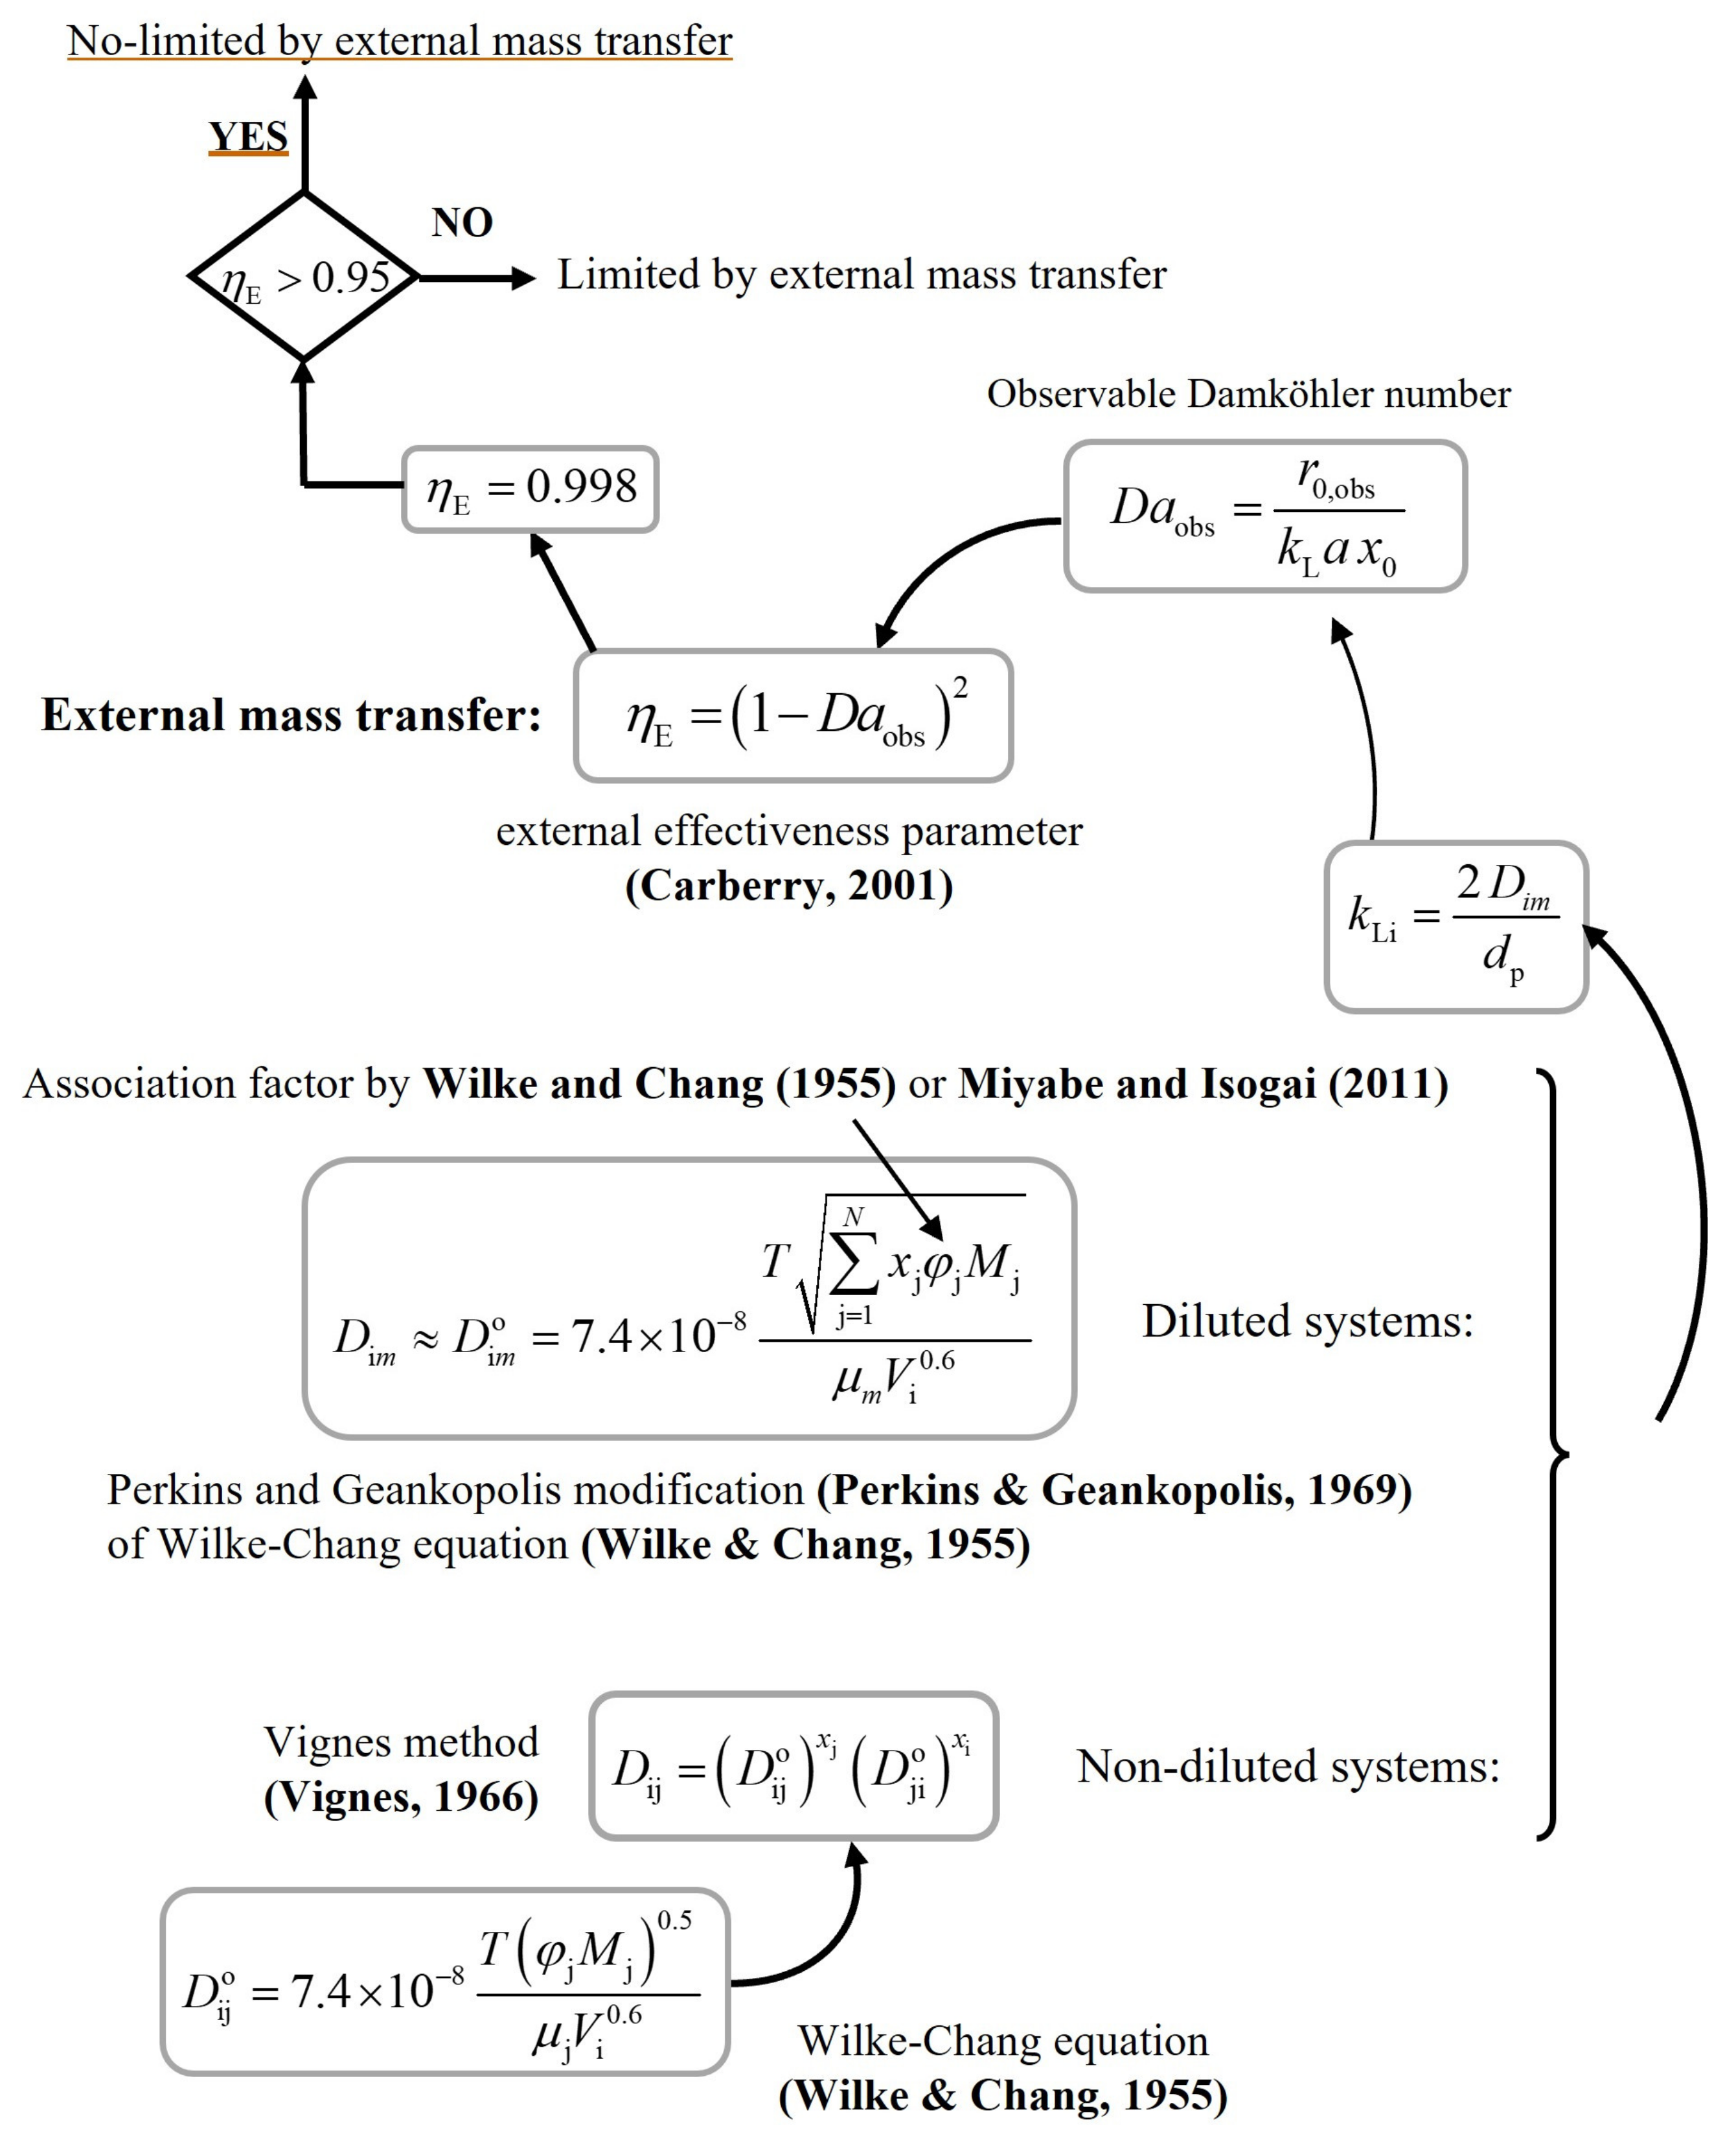
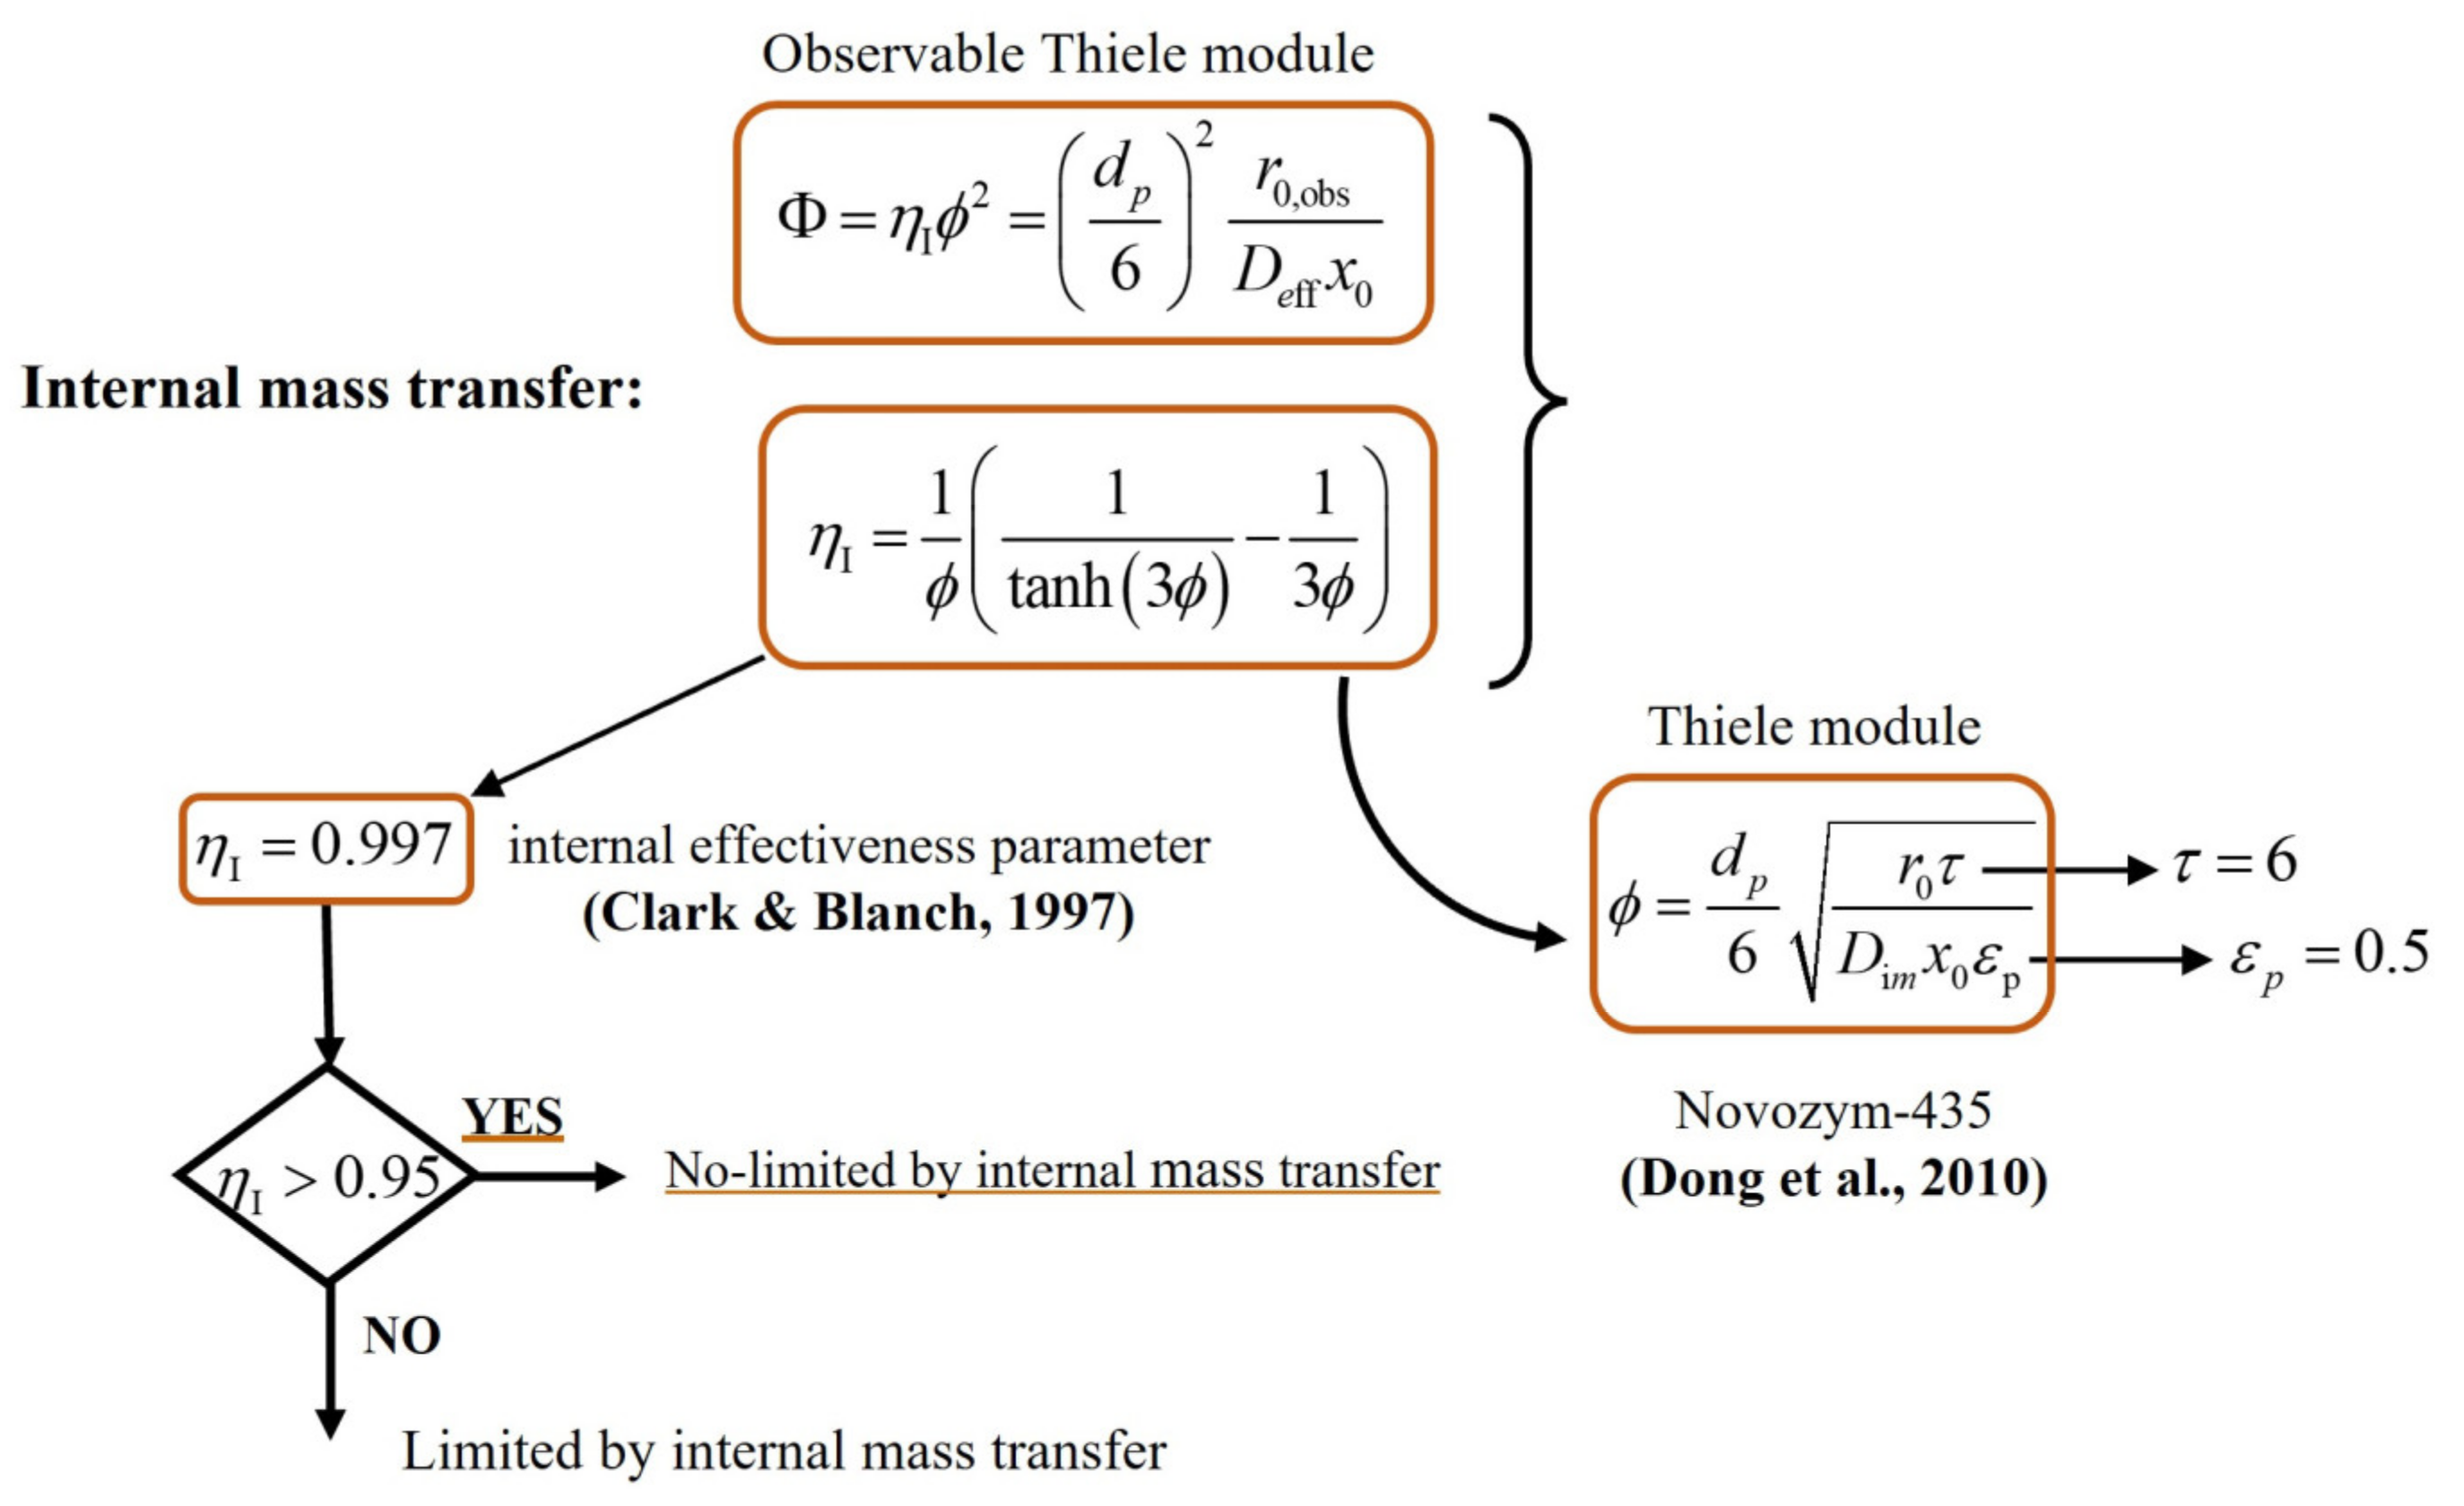
Appendix A. Checking the Influence of Mass Transfer Phenomena on the Reaction Rate

The following schemes show the procedure for calculating the external ηE (Figure A1) and internal ηI (Figure A2) effectiveness parameters. These values establish whether the reaction rate is limited by external or internal mass transfer phenomena, respectively. The reaction rate is not limited by these phenomena when both parameters are greater than 0.95. Final results are shown in Table S3.
Figure A1. Procedure for calculating the external ηE effectiveness parameter. (Carberry, 2001) [45], (Wilke & Chang, 1955) [46], (Perkins & Geankopolis, 1969) [47], (Miyabe & Isogai, 2011) [48], (Vignes, 1966) [49].
Processes 11 01640 g0a1
Figure A2. Procedure for calculating the internal ηI effectiveness parameter. (Clark & Blanch, 1997) [26], (Dong et al., 2010) [50].
Processes 11 01640 g0a2

Appendix B. Deduction of the Rate Model Including the Enzyme Denaturation

Figure A3. Relationships between the parameters of Equation (3) and those of Figure 3.
Processes 11 01640 g0a3

References

  1. Riemenschneider, W.; Bolt, H.M. Esters, Organic. In Ullmann’s Encyclopedia of Industrial Chemistry; Elvers, B., Ed.; Wiley-VCH: Weinheim, Germany, 2005; Volume 13, pp. 245–266. [Google Scholar] [CrossRef]
  2. Divakar, S.; Manohar, B. Use of lipases in the industrial production of esters. In Industrial Enzymes. Structure, Function and Applications; Polaina, J., MacCabe, A.P., Eds.; Springer: Dordrecht, The Netherlands, 2007; pp. 283–300. [Google Scholar] [CrossRef]
  3. Larios, A.; García, H.S.; Oliart, R.M.; Valerio-Alfaro, G. Synthesis of flavor and fragrance esters using Candida antarctica lipase. Appl. Microbiol. Biotechnol. 2004, 65, 373–376. [Google Scholar] [CrossRef]
  4. Divakar, S. Structure-function correlation in lipase catalysed esterification reactions of short and medium carbon chain length alcohols and acids. Indian J. Chem. B Org. Med. Chem. 2002, 41, 1919–1922. [Google Scholar]
  5. Garcia, T.; Coteron, A.; Martinez, M.; Aracil, J. Kinetic model for the esterification of oleic acid and cetyl alcohol using an immobilized lipase as catalyst. Chem. Eng. Sci. 2000, 55, 1411–1423. [Google Scholar] [CrossRef]
  6. Regulation (EC) No 1334/2008 of the European Parliament and of the Council of 16 December 2008 on flavourings and certain food ingredients with flavouring properties for use in and on foods and amending Council Regulation (EEC) No 1601/91, Regulations (EC) No 2232/96 and (EC) No 110/2008 and Directive 2000/13/EC. Off. J. Eur. Union 2008, 354, 34–50.
  7. FDA. Code of Federal Regulations, Title 21, Volume 6, Section 501.22: Animal Foods; Labeling of Spices, Flavorings, Colorings, and Chemical Preservatives (21CFR501.22); FDA: Silver Spring, MD, USA, 2023. [Google Scholar]
  8. Singhania, R.R.; Patel, A.K.; Thomas, L.; Goswami, M.; Giri, B.S.; Pandey, A. Industrial Enzymes. In Industrial Biorefineries & White Biotechnology, 1st ed.; Pandey, A., Höfer, R., Taherzadeh, M., Nampoothiri, K.M., Larroche, C., Eds.; Elsevier: New York, NY, USA, 2015; pp. 473–497. [Google Scholar] [CrossRef]
  9. Senders, M., Jr.; Piedmont, C. Penicillin Extraction Process. US2488559A, 22 November 1949. [Google Scholar]
  10. Leach, B.E.; Ford, J.H.; Whiffen, A.J. Actidione, an antibiotic from Streptomyces griseus. J. Am. Chem. Soc. 1947, 69, 474. [Google Scholar] [CrossRef] [PubMed]
  11. Borodin, N.; Philpot, F.J.; Florey, H.W. An antibiotic from Penicillium tardum. Br. J. Exp. Pathol. 1947, 28, 31–34. [Google Scholar] [PubMed]
  12. Martins, A.B.; da Silva, A.M.; Schein, M.F.; Garcia-Galan, C.; Záchia Ayub, M.A.; Fernandez-Lafuente, R.; Rodrigues, R.C. Comparison of the performance of commercial immobilized lipases in the synthesis of different flavor esters. J. Mol. Catal. B Enzym. 2014, 105, 18–25. [Google Scholar] [CrossRef]
  13. dos Santos, P.; Meireles, M.A.A.; Martínez, J. Production of isoamyl acetate by enzymatic reactions in batch and packed bed reactors with supercritical CO2. J. Supercrit. Fluids 2017, 127, 71–80. [Google Scholar] [CrossRef]
  14. Güvenç, A.; Kapucu, N.; Mehmetoğlu, Ü. The production of isoamyl acetate using immobilized lipases in a solvent-free system. Process Biochem. 2002, 38, 379–386. [Google Scholar] [CrossRef]
  15. Romero, M.D.; Calvo, L.; Alba, C.; Daneshfar, A.; Ghaziaskar, H.S. Enzymatic synthesis of isoamyl acetate with immobilized Candida antarctica lipase in n-hexane. Enzyme Microb. Technol. 2005, 37, 42–48. [Google Scholar] [CrossRef]
  16. Romero, M.D.; Calvo, L.; Alba, C.; Daneshfar, A. A kinetic study of isoamyl acetate synthesis by immobilized lipase-catalyzed acetylation in n-hexane. J. Biotechnol. 2007, 127, 269–277. [Google Scholar] [CrossRef] [PubMed]
  17. Güvenç, A.; Kapucu, N.; Bayraktar, E.; Mehmetoǧlu, Ü. Optimization of the enzymatic production of isoamyl acetate with Novozym 435 from Candida antarctica. Chem. Eng. Comm. 2003, 190, 948–961. [Google Scholar] [CrossRef]
  18. Martins, A.B.; Graebin, N.G.; Lorenzoni, A.S.G.; Fernandez-Lafuente, R.; Ayub, M.A.Z.; Rodrigues, R.C. Rapid and high yields of synthesis of butyl acetate catalyzed by Novozym 435: Reaction optimization by response surface methodology. Process Biochem. 2011, 46, 2311–2316. [Google Scholar] [CrossRef]
  19. Duarte, N.G.; de Queiroz, D.S.; Veloso, C.O.; de Castro, A.M.; Langone, M.A.P. Effects of acetic acid addition methods on butyl acetate enzymatic synthesis. Chem. Eng. Commun. 2020, 207, 177–184. [Google Scholar] [CrossRef]
  20. Martins, A.B.; Schein, M.F.; Friedrich, J.L.R.; Fernandez-Lafuente, R.; Ayub, M.A.Z.; Rodrigues, R.C. Ultrasound-assisted butyl acetate synthesis catalyzed by Novozym 435: Enhanced activity and operational stability. Ultrason. Sonochem. 2013, 20, 1155–1160. [Google Scholar] [CrossRef]
  21. Ben Salah, R.; Ghamghui, H.; Miled, N.; Mejdoub, H.; Gargouri, Y. Production of butyl acetate ester by lipase from novel strain of Rhizopus oryzae. J. Biosci. Bioeng. 2007, 103, 368–372. [Google Scholar] [CrossRef] [PubMed]
  22. Graebin, N.G.; Martins, A.B.; Lorenzoni, A.S.G.; Garcia-Galan, C.; Fernandez-Lafuente, R.; Ayub, M.A.Z.; Rodrigues, R.C. Immobilization of lipase B from Candida antarctica on porous styrene–divinylbenzene beads improves butyl acetate synthesis. Biotechnol. Prog. 2012, 28, 406–412. [Google Scholar] [CrossRef]
  23. Romero-Diaz, M.D.; Gómez, J.M.; Díaz-Suelto, B.; García-Sanz, A. Enzymatic Synthesis of Short-Chain Esters in n-Hexane and Supercritical Carbon Dioxide: Effect of the Acid Chain Length. Eng. Life Sci. 2010, 10, 171–176. [Google Scholar] [CrossRef]
  24. Wu, J.; Su, L.; Chen, J. Method for Synthesizing ester by Using Cutinase. CN103014079A, 24 August 2016. [Google Scholar]
  25. Park, C.H.; Baek, Y.S.; Seo, J.B.; Lee, T.; Oh, J.M.; Jang, M.; Na, J.G.; Park, S.J. A novel method for enzymatic synthesis of formate ester and a kit for producing the same. KR2021094418, 21 January 2020. [Google Scholar]
  26. Clark, D.S.; Blanch, H.W. Biochemical Engineering; Marcel Dekker: New York, NY, USA, 1997. [Google Scholar]
  27. Bailey, J.E.; Ollis, D.F. Biochemical Engineering Fundamentals, 2nd ed.; McGraw-Hill: New York, NY, USA, 1986. [Google Scholar]
  28. Riddick, J.A.; Bunger, W.B.; Sakano, T.K.; Weissberger, A. Organic Solvents: Physical Properties and Methods of Purification, 4th ed.; Wiley: New York, NY, USA, 1986. [Google Scholar]
  29. Ortega, J.; Matos, J.S. Estimation of the isobaric expansivities from several equations of molar refraction for some pure organic compounds. Mater. Chem. Phys. 1986, 15, 415–425. [Google Scholar] [CrossRef]
  30. Granados, K.; Gracia-Fadrique, J.; Amigo, A.; Bravo, R. Refractive Index, Surface Tension, and Density of Aqueous Mixtures of Carboxylic Acids at 298.15 K. J. Chem. Eng. Data 2006, 51, 1356–1360. [Google Scholar] [CrossRef]
  31. Chaar, M.; Ortega, J.; Toledo-Marante, F.J.; González, C. Thermodynamic properties of (a pentyl ester + an-alkane). XIV. The HE and VE for (an ester + an-alkane). J. Chem. Thermodyn. 2001, 33, 689–710. [Google Scholar] [CrossRef]
  32. TRC Thermodynamic Tables. Hydrocarbons & Non-Hydrocarbons; Texas A&M University System: College Station, TX, USA, 1987. [Google Scholar]
  33. Dos Santos, P.; Giovani, L.Z.; Angela, M.; Meireles, A.; Mazutti, M.A.; Martínez, J. Synthesis of eugenyl acetate by enzymatic reactions in supercritical carbon dioxide. Biochem. Eng. J. 2016, 114, 1–9. [Google Scholar] [CrossRef]
  34. Ortega, J.; Matos, J.S.; Paz Andrade, M.I.; Jiménez, E. Excess molar volumes of (ethyl formate or ethyl acetate + an isomer of hexanol) at 298.15 K. J. Chem. Thermodyn. 1985, 17, 1127–1132. [Google Scholar] [CrossRef]
  35. Güvenç, A.; Kapucu, N.; Kapucu, H.; Aydoğan, Ö.; Mehmetoğlu, Ü. Enzymatic esterification of isoamyl alcohol obtained from fusel oil: Optimization by response surface methodology. Enz. Microb. Technol. 2007, 40, 778–785. [Google Scholar] [CrossRef]
  36. Khan, N.R.; Rathod, V.K. Enzyme catalyzed synthesis of cosmetic esters and its intensification: A review. Process Biochem. 2015, 50, 1793–1806. [Google Scholar] [CrossRef]
  37. Hari Krishna, S.; Karanth, N.G. Lipases and lipase-catalyzed esterification reactions in nonaqueous media. Catal. Rev. 2002, 44, 499–591. [Google Scholar] [CrossRef]
  38. Sousa, R.R.; Silva, A.S.A.; Fernandez-Lafuente, R.; Ferreira-Leitão, V.S. Solvent-free esterifications mediated by immobilized lipases: A review from thermodynamic and kinetic perspectives. Catal. Sci. Technol. 2021, 11, 5696–5711. [Google Scholar] [CrossRef]
  39. Lagarias, J.C.; Reeds, J.A.; Margaret, H.W.; Wright, P.E. Convergence Properties of the Nelder-Mead Simplex Method in Low Dimensions. SIAM J. Optim. 1998, 9, 112–147. [Google Scholar] [CrossRef]
  40. Byrd, R.H.; Hribar, M.E.; Nocedal, J. An Interior Point Algorithm for Large-Scale Nonlinear Programming. SIAM J. Optim. 1999, 9, 877–900. [Google Scholar] [CrossRef]
  41. Waltz, R.A.; Morales, J.L.; Nocedal, J.; Orban, D. An interior algorithm for nonlinear optimization that combines line search and trust region steps. Math. Program. 2006, 107, 391–408. [Google Scholar] [CrossRef]
  42. Dormand, J.R.; Prince, P.J. A family of embedded Runge-Kutta formulae. J. Comput. Appl. Math. 1980, 6, 19–26. [Google Scholar] [CrossRef]
  43. Lopresto, C.G.; Calabrò, V.; Woodley, J.M.; Tufvesson, P. Kinetic study on the enzymatic esterification of octanoic acid and hexanol by immobilized Candida antarctica lipase B. J. Mol. Catal. B Enzym. 2014, 110, 64–71. [Google Scholar] [CrossRef]
  44. Hari Krishna, S.; Divakar, S.; Prapulla, S.G.; Karanth, N.G. Enzymatic synthesis of isoamyl acetate using immobilized lipase from Rhizomucor miehei. J. Biotechnol. 2001, 87, 193–201. [Google Scholar] [CrossRef]
  45. Carberry, J. Chemical and Catalytic Reaction Engineering; Dover Publications, Inc.: New York, NY, USA, 2001. [Google Scholar]
  46. Wilke, C.R.; Chang, P. Correlation of diffusion coefficients in dilute solutions. AIChE J. 1955, 1, 264–270. [Google Scholar] [CrossRef]
  47. Perkins, L.R.; Geankoplis, C.J. Molecular diffusion in a ternary liquid system with the diffusing component dilute. Chem. Eng. Sci. 1969, 24, 1035–1042. [Google Scholar] [CrossRef]
  48. Miyabe, K.; Isogai, R. Estimation of molecular diffusivity in liquid phase systems by the Wilke–Chang equation. J. Chromatogr. A. 2011, 1218, 6639–6645. [Google Scholar] [CrossRef] [PubMed]
  49. Vignes, A. Diffusion in binary solutions: Variation of Diffusion Coefficient with Composition. Ind. Eng. Chem. Fundam. 1966, 5, 189–199. [Google Scholar] [CrossRef]
  50. Dong, H.P.; Wang, Y.J.; Zheng, Y.G. Enantioselective hydrolysis of diethyl 3-hydroxyglutarate to ethyl (S)-3-hydroxyglutarate by immobilized Candida antarctica lipase B. J. Mol. Catal. B Enzym. 2010, 66, 90–94. [Google Scholar] [CrossRef]
Figure 1. Scheme of the experimental esterification procedure to obtain pentyl acetate.
Processes 11 01640 g001
Figure 2. Upper graph: conversion after 8 h for successive reuse cycles. Lower graph: conversion vs. θ-time. Tests performed under the conditions of assay n° 10.
Processes 11 01640 g002
Figure 3. Scheme of the Bi–Bi Ping-Pong reaction mechanism with inhibition by both substrates: in black, considering the non-denaturation of the enzyme, and in black plus red, when the denaturation of the enzyme is considered at high acetic acid concentrations.
Processes 11 01640 g003
Figure 4. Experimental results and modeling according to the ratios x0,alcohol/x0,acid, and the different x0,acid values: (a) x0,alcohol/x0,acid = 1; (b) x0,alcohol/x0,acid = 2; (c) x0,alcohol/x0,acid = 3. (⬤) 0.10; () 0.14; () 0.18; () 0.25; () 0.33; () 0.50. The corresponding lines are obtained from modeling using Equations (3) and (4).
Processes 11 01640 g004
Table 1. Conditions established for each experiment and results: final conversion (assumed as 95% of the equilibrium conversion), experimentation time, and productivity defined as ester mass/feed mass. ERC: Enzyme Reuse Cycle.
Assay n°x0,alcohol/x0,acidx0,acid (c0,acid,M)SolventERCConversion
%
θ, hmester/mfeed
110.10 (0.8)hexane18823.10.14
210.14 (1.2)hexane18434.90.18
310.18 (1.5)hexane18544.10.24
410.25 (2.3)hexane18559.80.35
510.50 (6.0)-1---
620.10 (0.8)hexane1862.60.13
720.14 (1.2)hexane1853.20.19
820.18 (1.6)hexane1854.10.24
920.25 (2.5)hexane1855.50.34
1020.33 (3.6)-1857.80.47
1130.10 (0.8)hexane1894.90.14
1230.14 (1.2)hexane1896.30.19
1330.18 (1.7)hexane1898.10.25
1430.25 (2.6)-18911.20.36
1520.33 (3.6)-2847.80.46
1620.33 (3.6)-3857.80.47
1720.33 (3.6)-4857.80.47
1820.33 (3.6)-5857.80.47
1920.33 (3.6)-6867.80.48
2020.33 (3.6)-7857.80.47
2120.33 (3.6)-8877.80.46
2220.33 (3.6)-9857.80.47
2320.33 (3.6)-10857.80.48
Table 2. Values obtained for the parameters of Equations (3) and (4) and RMSE, Equation (2).
k 1 k 2 k 3 k 4 k 5
3.6576 × 1021.00006.1738 × 10−21.14183.3980
k 6 k 7 k 8 k 9 k 10
2.6287 × 1042.42969.8352 × 10−11.9351 × 1041.5530 × 104
Kd0Kd1Kd2 RMSE, Equation (2)
9.6586 × 1071.59426.0141 0.021
Disclaimer/Publisher’s Note: The statements, opinions and data contained in all publications are solely those of the individual author(s) and contributor(s) and not of MDPI and/or the editor(s). MDPI and/or the editor(s) disclaim responsibility for any injury to people or property resulting from any ideas, methods, instructions or products referred to in the content.

