Article

The Influence of a CGA-BP Neural-Network-Based Aeration Oxygen Supply Prediction Model on the Maturity of Aerobic Composting

1
College of Information and Electrical Engineering, Heilongjiang Bayi Agricultural University, Daqing 163319, China
2
College of Engineering, Heilongjiang Bayi Agricultural University, Daqing 163319, China
3
College of Horticulture and Landscape Architecture, Heilongjiang Bayi Agricultural University, Daqing 163319, China
*
Author to whom correspondence should be addressed.
Processes 2023, 11(6), 1591; https://doi.org/10.3390/pr11061591
Submission received: 24 March 2023 / Revised: 15 May 2023 / Accepted: 18 May 2023 / Published: 23 May 2023
(This article belongs to the Section Automation Control Systems)

Abstract

:
In order to improve the problem of low oxygen supply efficiency during aerobic composting and prolong composting maturity, a genetic algorithm was used to optimize the initial weights and thresholds of the standard BP neural network and obtain the optimal parameters, and then a clonal selection algorithm was used to optimize the mutation operator in the genetic algorithm and duplicate the operator. A CGA-BP neural network based on an aeration oxygen supply prediction model was constructed, and the aeration oxygen supply predicted by the model was used to ferment the compost and accelerate the process of compost maturation. The results show that compared with the standard BP neural network algorithm and the GA-BP neural network algorithm, this model has accurate prediction performance in predicting aeration oxygen supply, with a prediction accuracy of 99.26%. The aeration oxygen supply predicted based on the CGA-BP model can effectively promote the composting maturity process and meet the needs of aeration oxygen supply throughout the entire fermentation process of aerobic compost.

1. Introduction

According to statistics, China’s annual agricultural organic waste is about 5.7 billion tons. This includes approximately 3.8 billion tons of livestock, fresh poultry manure and urine and approximately 1 billion tons of straw. The natural discharge or improper use of livestock and poultry manure will bring harm to the environment, and the arbitrary stacking or burning of straw will cause environmental pollution. With the rapid development of the composting industry, compost producers are focusing their attention on the effective utilization of energy in the production process and on improving the quality of compost by controlling the forced ventilation system [1]. Aerobic composting can rationalize the use of livestock manure and straw and alleviate environmental pollution [2,3,4,5]. The amount of aeration will affect the microbial activity in aerobic composting, thereby affecting the normal fermentation of aerobic compost and delaying the composting maturity process. Therefore, precise control of the aeration rate plays a crucial role in aerobic composting fermentation.
In recent years, both Chinese and foreign scholars have conducted research on aeration control. Most studies have established intelligent modeling methods [6,7,8] to control the aeration rate of sewage biochemical tanks, using dissolved oxygen as an intermediate variable and establishing models for inlet and outlet water indicators and dissolved oxygen, as well as models for dissolved oxygen and aeration rates. The hierarchical control concept was introduced into the aeration system, and a controller was designed to track the dissolved oxygen content. The tracking performance of the controller was verified, thereby achieving the goal of precise aeration [7].
The intelligent modeling method achieves precise aeration in the sewage treatment process. During the composting fermentation process, aeration is usually carried out at a fixed time and quantity, and sufficient oxygen is obtained by changing the ventilation mode and frequency of the compost, thereby promoting the normal fermentation of the compost [9,10,11]. In the static aerobic composting experiment of sludge and mushroom residue, by changing the ventilation rate at different stages and the ventilation frequency per unit time, it was found that the stage rates were 0.1, 0.4, 0.6, 0.3 and 0.6 m3/h, and the composting effect was better with a single ventilation of 15 min/h [12]. Under both continuous and intermittent ventilation conditions, there are significant differences in microbial community succession during the fermentation process of cow manure–straw mixed compost, which affects how efficiently the compost reaches maturity [13]. In aerobic composting, experience is mostly used to set the aeration value and aeration rate, which has low efficiency and affects the humification process of compost. This article uses the relationship between multiple factors affecting aerobic compost fermentation and the aeration rate to directly model and predict the aeration rate, accurately control the aeration rate, improve compost fermentation efficiency and promote compost maturity.
Therefore, in order to improve the ventilation technology in the aerobic composting process and accurately control the aeration rate, a prediction model of aeration oxygen based on CGA-BP neural network was established. The standard BP neural network itself has defects such as slow convergence speed and a local infinitesimally small and complex structural analysis [14,15], while the genetic algorithm is better at solving and optimizing nonlinear and multi-dimensional space problems [16] and clone selection algorithms are faster at obtaining optimal or feasible solutions. In this paper, the three algorithms are combined to establish a prediction model of aeration oxygen supply based on a CGA-BP neural network to predict the next required aeration oxygen supply and calculate the aeration rate. The prediction data will be presented in the prediction system in real time to provide a plan for the next aeration rate, improving the experimental efficiency and reducing the experimental time.

2. Materials and Methods

2.1. Instruments and Equipment

The experimental aerobic composting equipment was placed in the scientific and technological achievements demonstration greenhouse of the Beijing Academy of Agricultural and Forestry Sciences. The experiment was conducted with raw materials for aerobic composting. Cow manure, biogas residue, chicken manure and corn stalks were provided by the Haihua biogas Plant in Miyun District, Beijing.
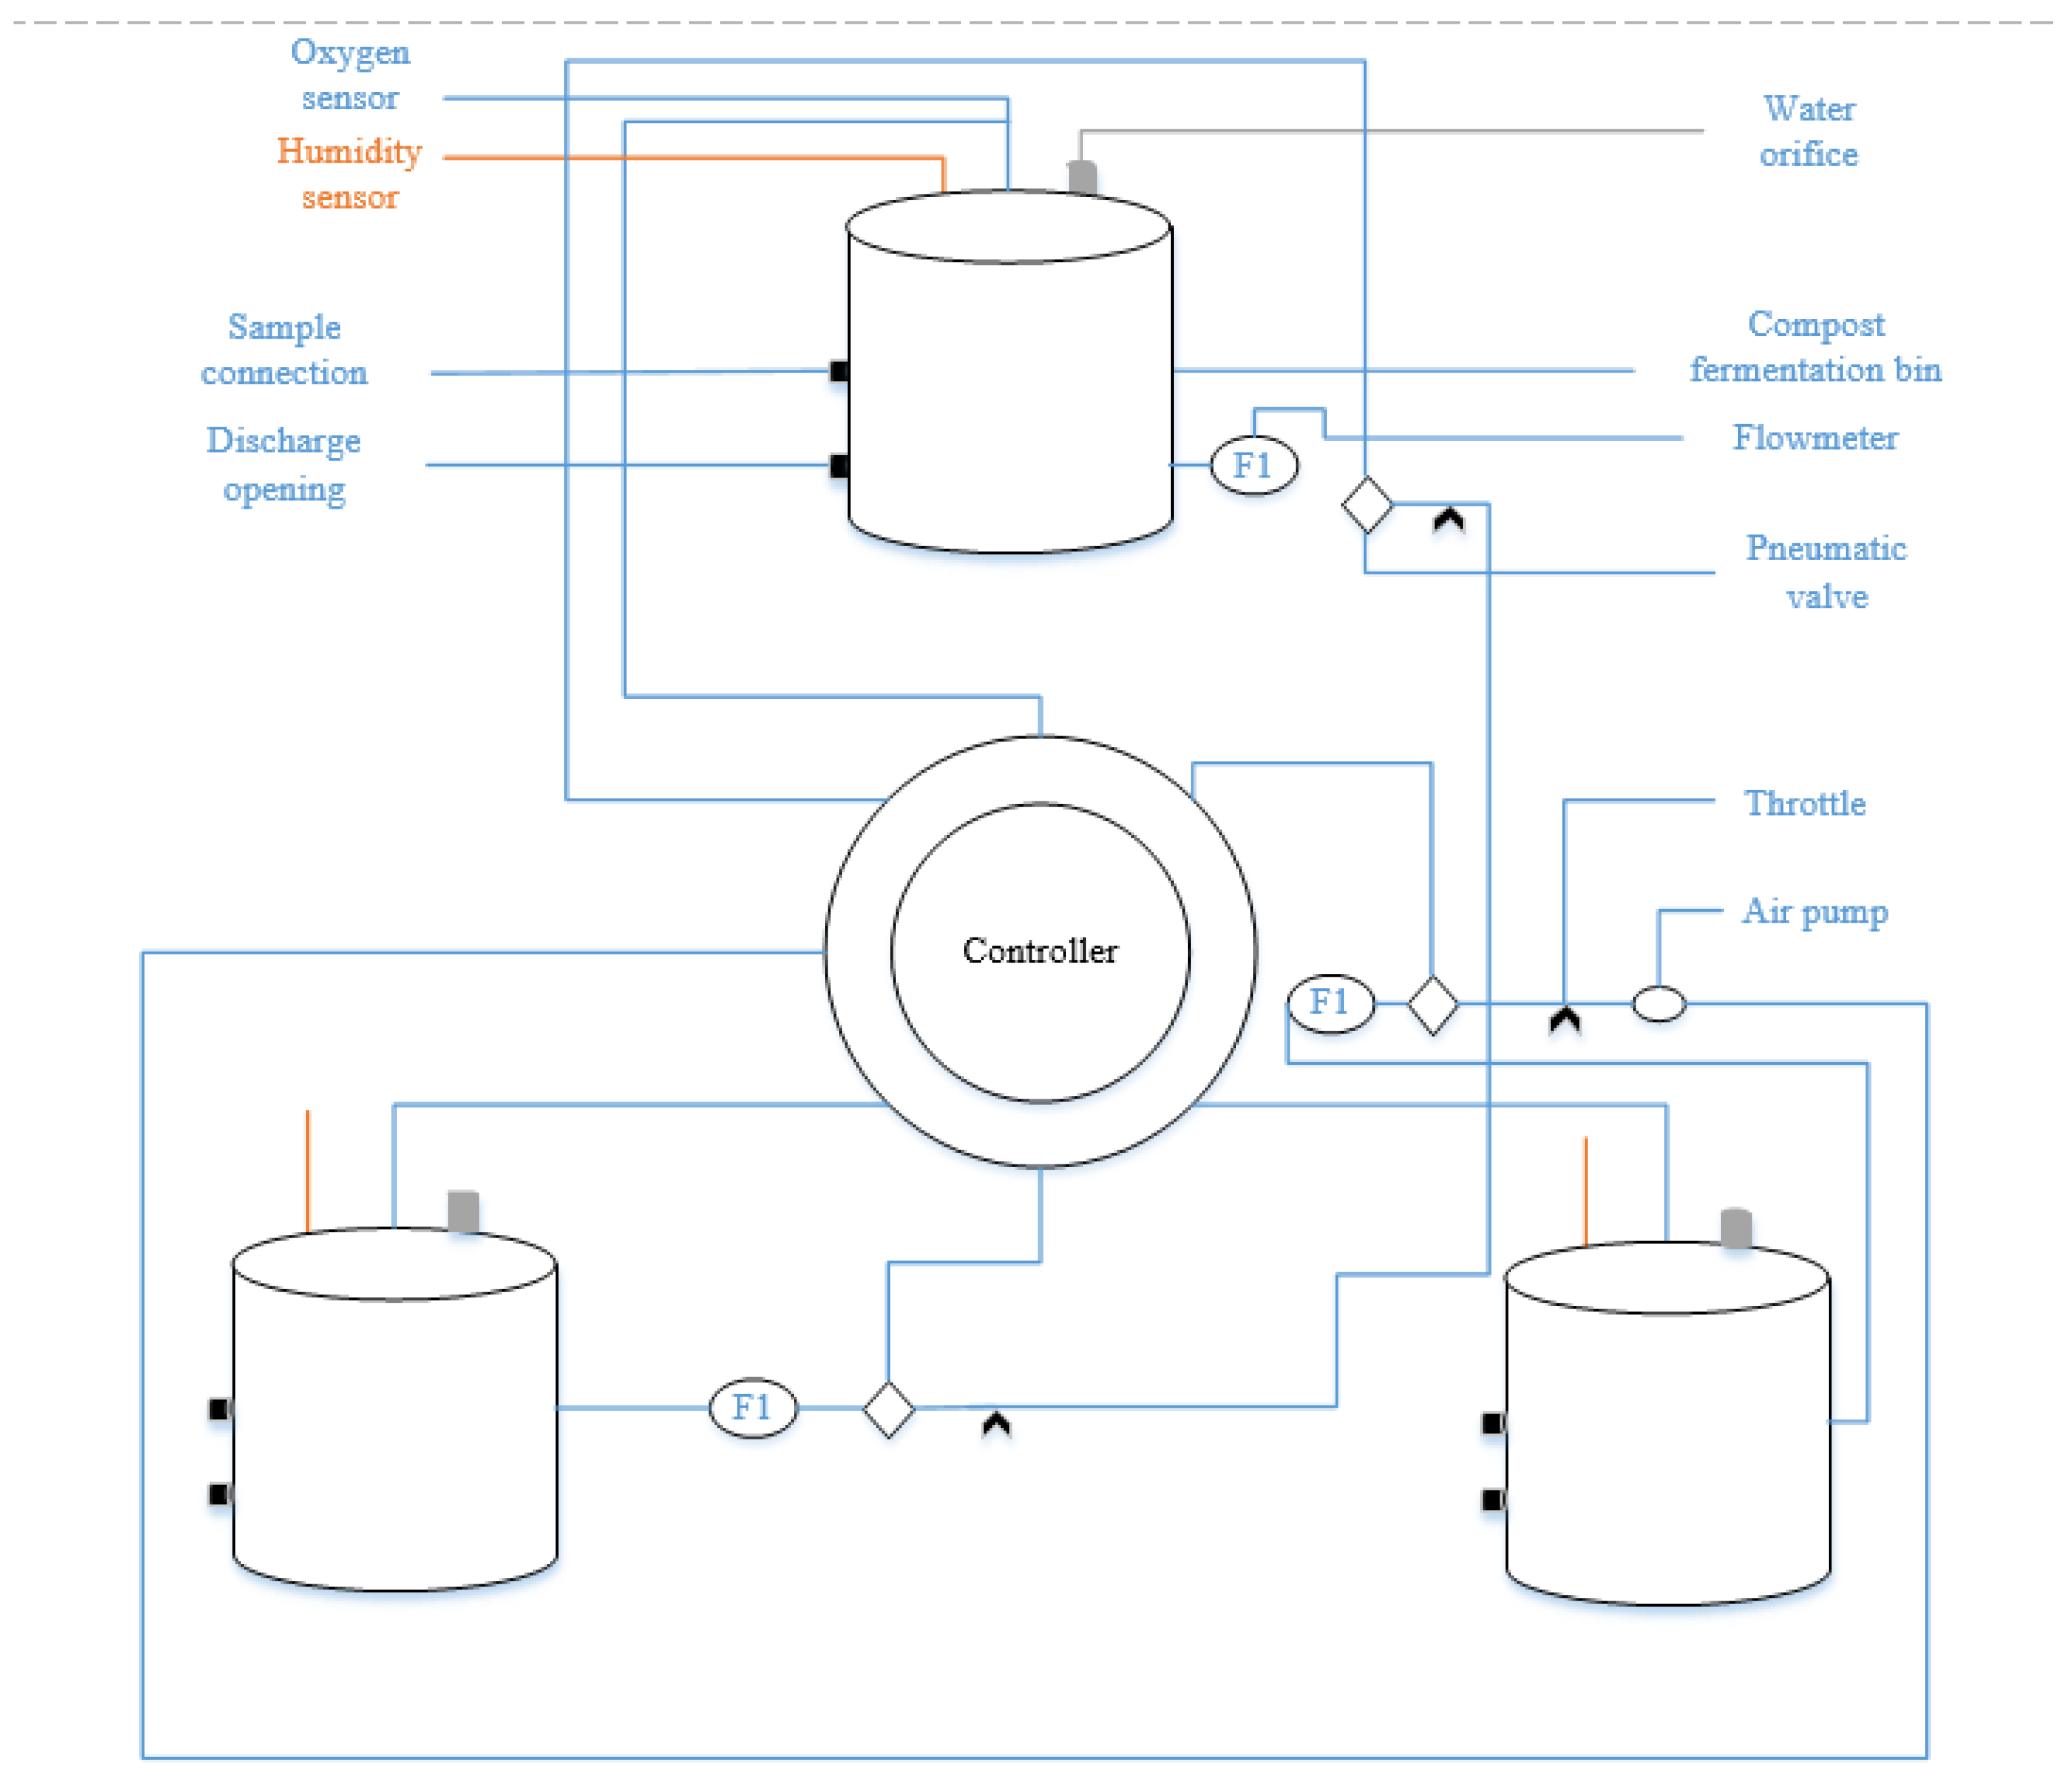
The experimental aerobic composting plant is mainly divided into three units (Figure 1): aerobic fermentation, measurement and control, and aeration. The remote monitoring system was used to monitor the temperature, humidity, oxygen concentration, room temperature, pH and EC in the aerobic fermentation process. The parameters that changed in the aerobic fermentation process were collected by the sensor in the fermentation tank. A controller was placed on site to acquire and transmit sensor data. Data were then uploaded to the monitoring interface via the Internet.

2.2. Data Sources and Selection

The experimental data were selected from the reactor data of no. 1 cow manure and straw of the Haihua Biogas Plant from 4–22 January 2019. Composting is a complex physical, chemical and biological process in which bacteria and fungi degrade organic matter under certain conditions [17]. The activities of micro-organisms such as bacteria and fungi are affected by various factors and lead to changes in the composting process [18]. Factors mainly include the temperature, pH, moisture content, ventilation and oxygen supply conditions of composting materials, carbon/nitrogen ratio and so on [19]. Therefore, the input data of the experiment were room temperature, oxygen concentration, temperature, pH and EC, and the output data were the amount of aeration. The initial physicochemical parameters of compost raw materials are shown in Table 1.
When selecting the sample data, the lost data were repaired and the outliers were removed. Finally, a total of 218 sets of data were selected as data samples; 218 sets of data were randomly selected as input data, and 50 sets of data were selected as test samples, calculate error analysis, and use Microsoft Excel (v.2304 Build 16.0.16327.20200, Microsoft, Redmond, DC, USA) to optimize the image of the aeration oxygen supply prediction model [20].

3. Establishment and Evaluation of the Aeration Oxygen Supply Prediction Model

3.1. Data Preprocessing

To improve the training rate and operation accuracy, data should be normalized due to the large numerical differences between different dimensions in the original data [21]. To evenly distribute the data, the mapminmax function is adopted in this paper to normalize the original data. The normalization formulas are shown as follows:
inputn = 2 i n p u t m i n i n p u t m a x i n p u t m i n i n p u t 1
outputn = 2 o u t p u t m i n o u t p u t m a x o u t p u t m i n o u t p u t 1
where input and output are input and output samples of the original data, respectively; mininput and maxinput are the minimum and maximum values of the input, respectively; minoutput and maxoutput are the minimum and maximum values of the output, respectively; inputn and outputn are the normalized input and output samples, respectively, namely median values of the influencing factors. At this time, the data fitted by BP neural network are still normalized data, thus the mapminmax function is needed to reverse the normalization processing of the experimental data to obtain normal values.

3.2. Design of BP Neural Network

To construct a BP neural network model, appropriate parameters need to be determined. In this paper, each parameter of the BP neural network was set, which mainly included the number of network layers, the number of neurons in each layer, training times and the training model.

3.2.1. Design the Number of Network Layers

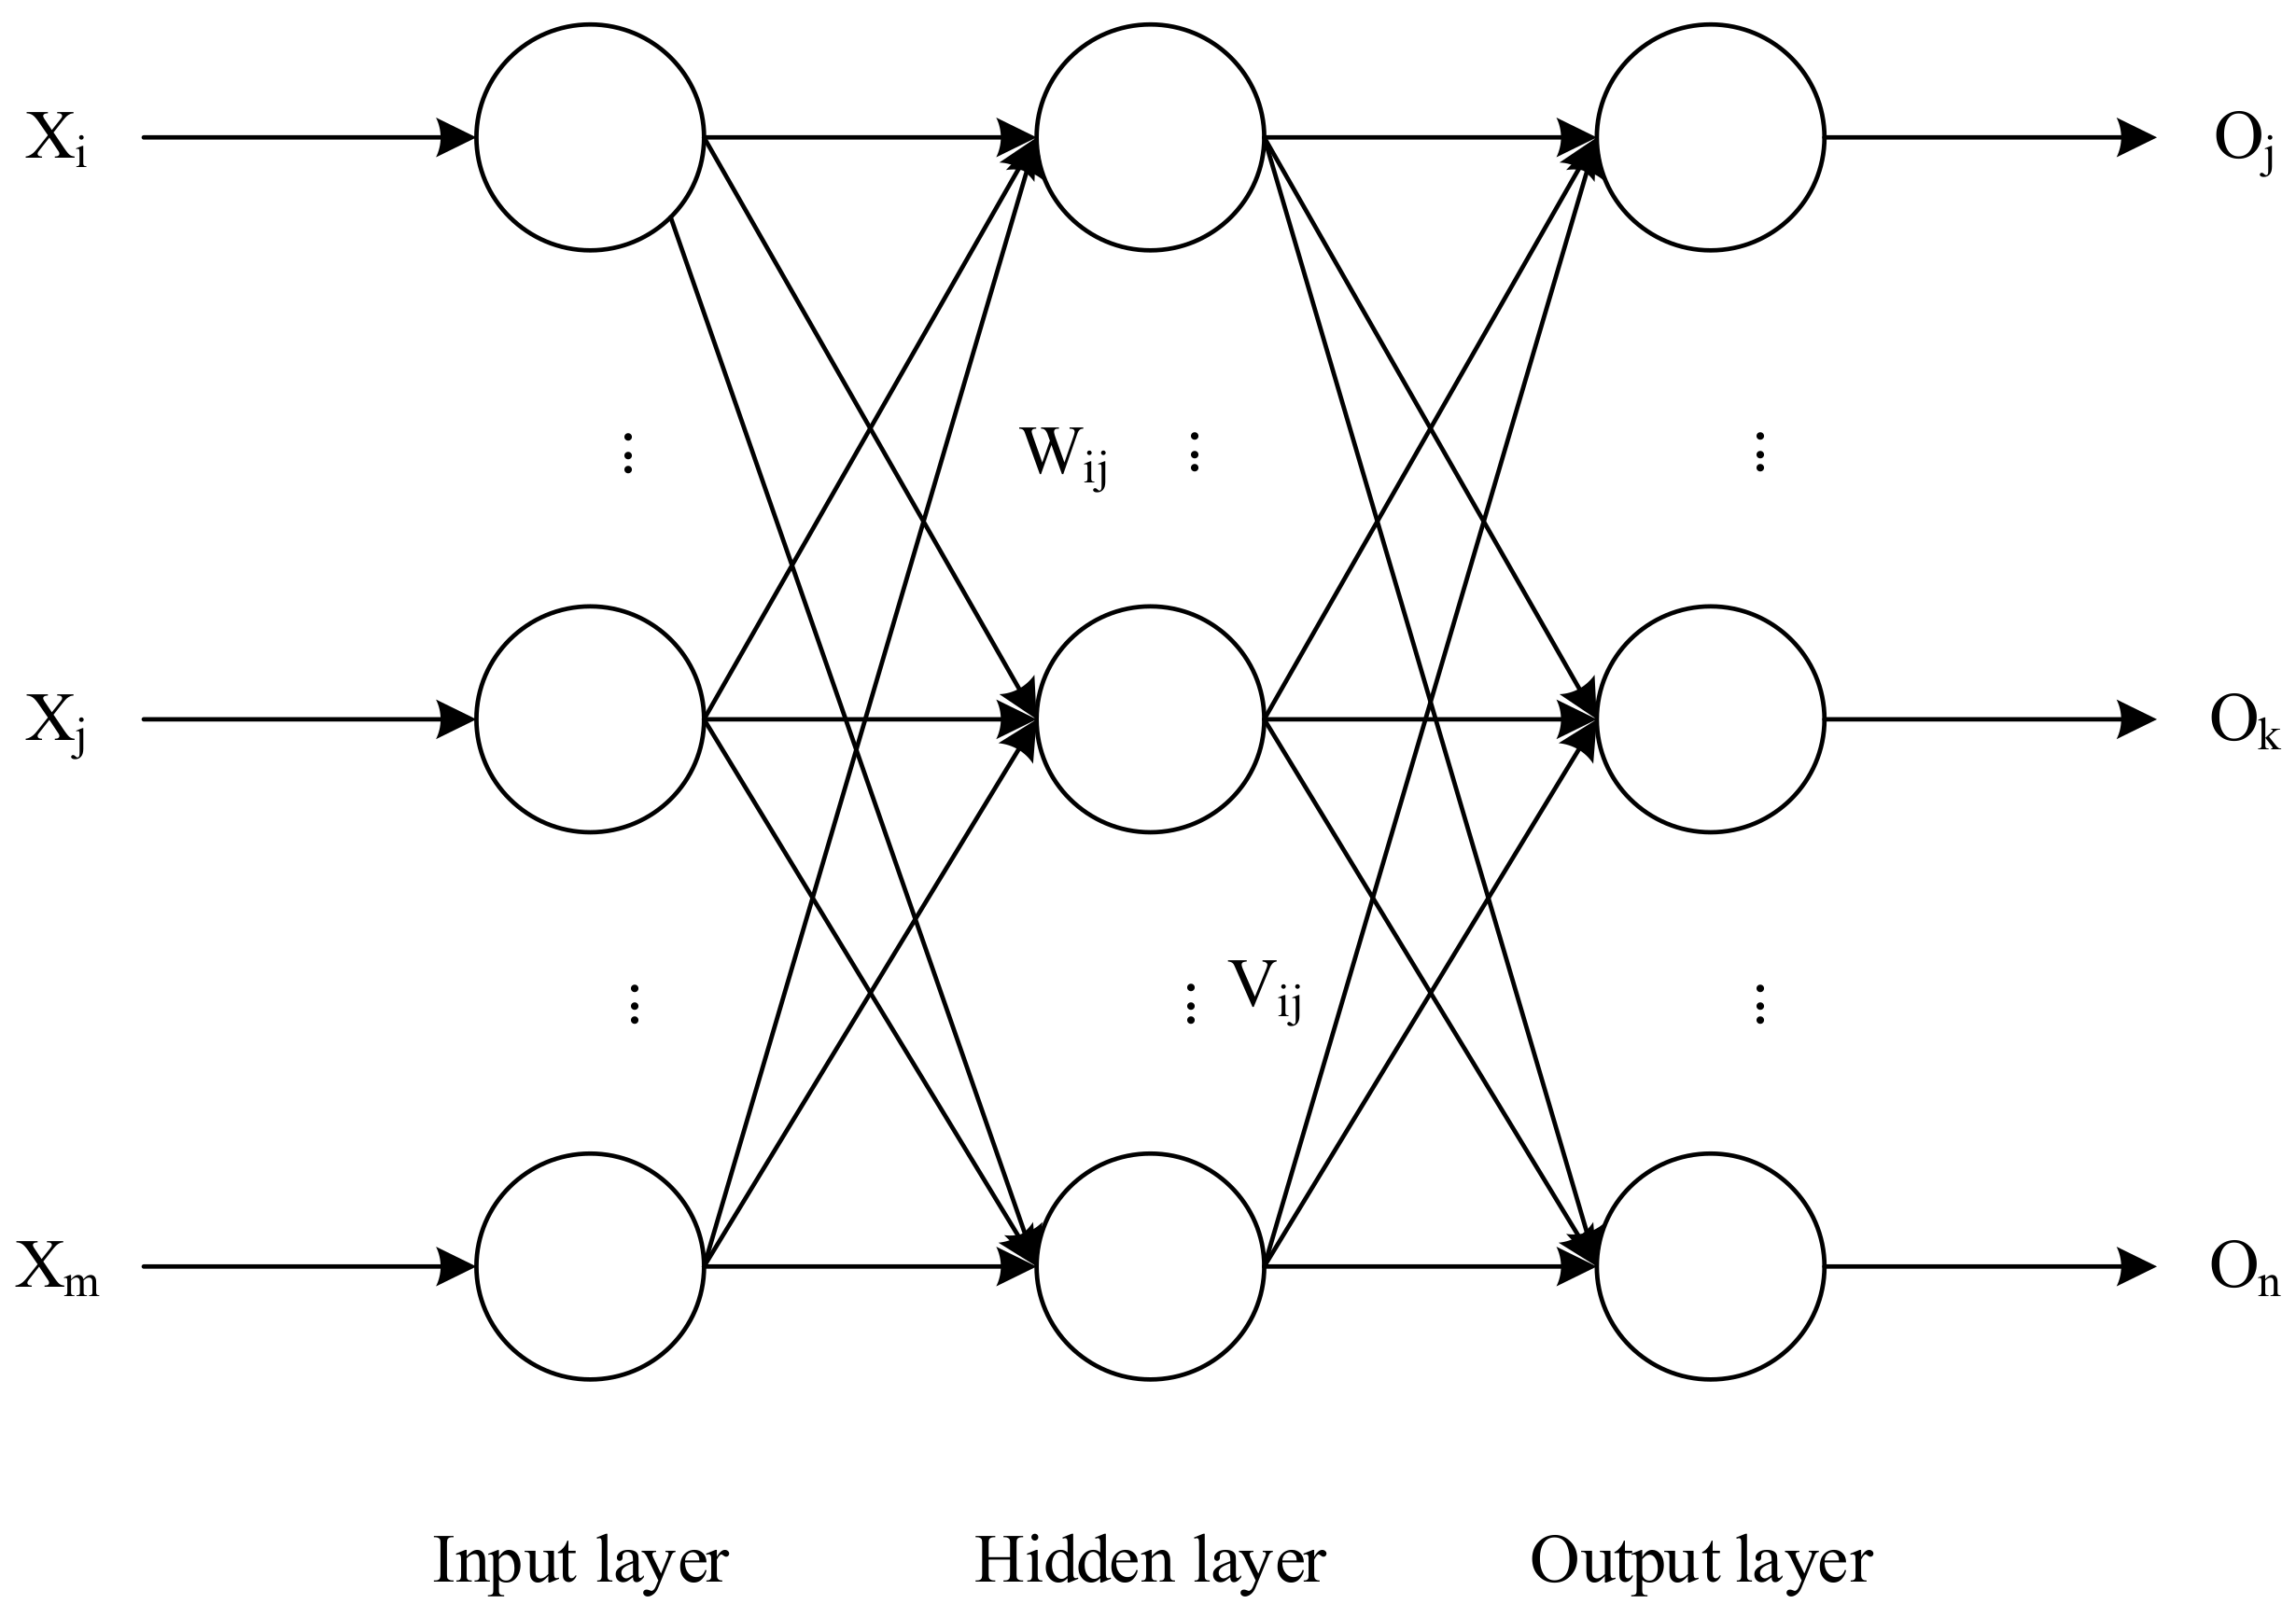
The single hidden layer runs faster when the BP neural network can meet the accuracy requirements of the network. Therefore, the basic structure of the prediction model with a three-layer network structure is shown in Figure 2:

3.2.2. Selection of Neuron Number in Each Layer

The factors affecting the aeration oxygen supply of this experimental data are temperature, humidity, oxygen concentration, room temperature, pH and EC value, and these six-dimensional data are used as the input values for predicting the aeration oxygen supply, so the number of neurons in the input layer and output layer were set as 6 and 1, respectively.
Since too few neurons in the hidden layer cannot establish a complex nonlinear relationship, too many will consume a large amount of learning time, the trial-and-error method is used to determine the number of nodes in the hidden layer of the BP neural network, and the number of nodes in the hidden layer corresponding to the minimum network error is selected. The commonly used empirical formula is shown as follows:
n = m + l + α
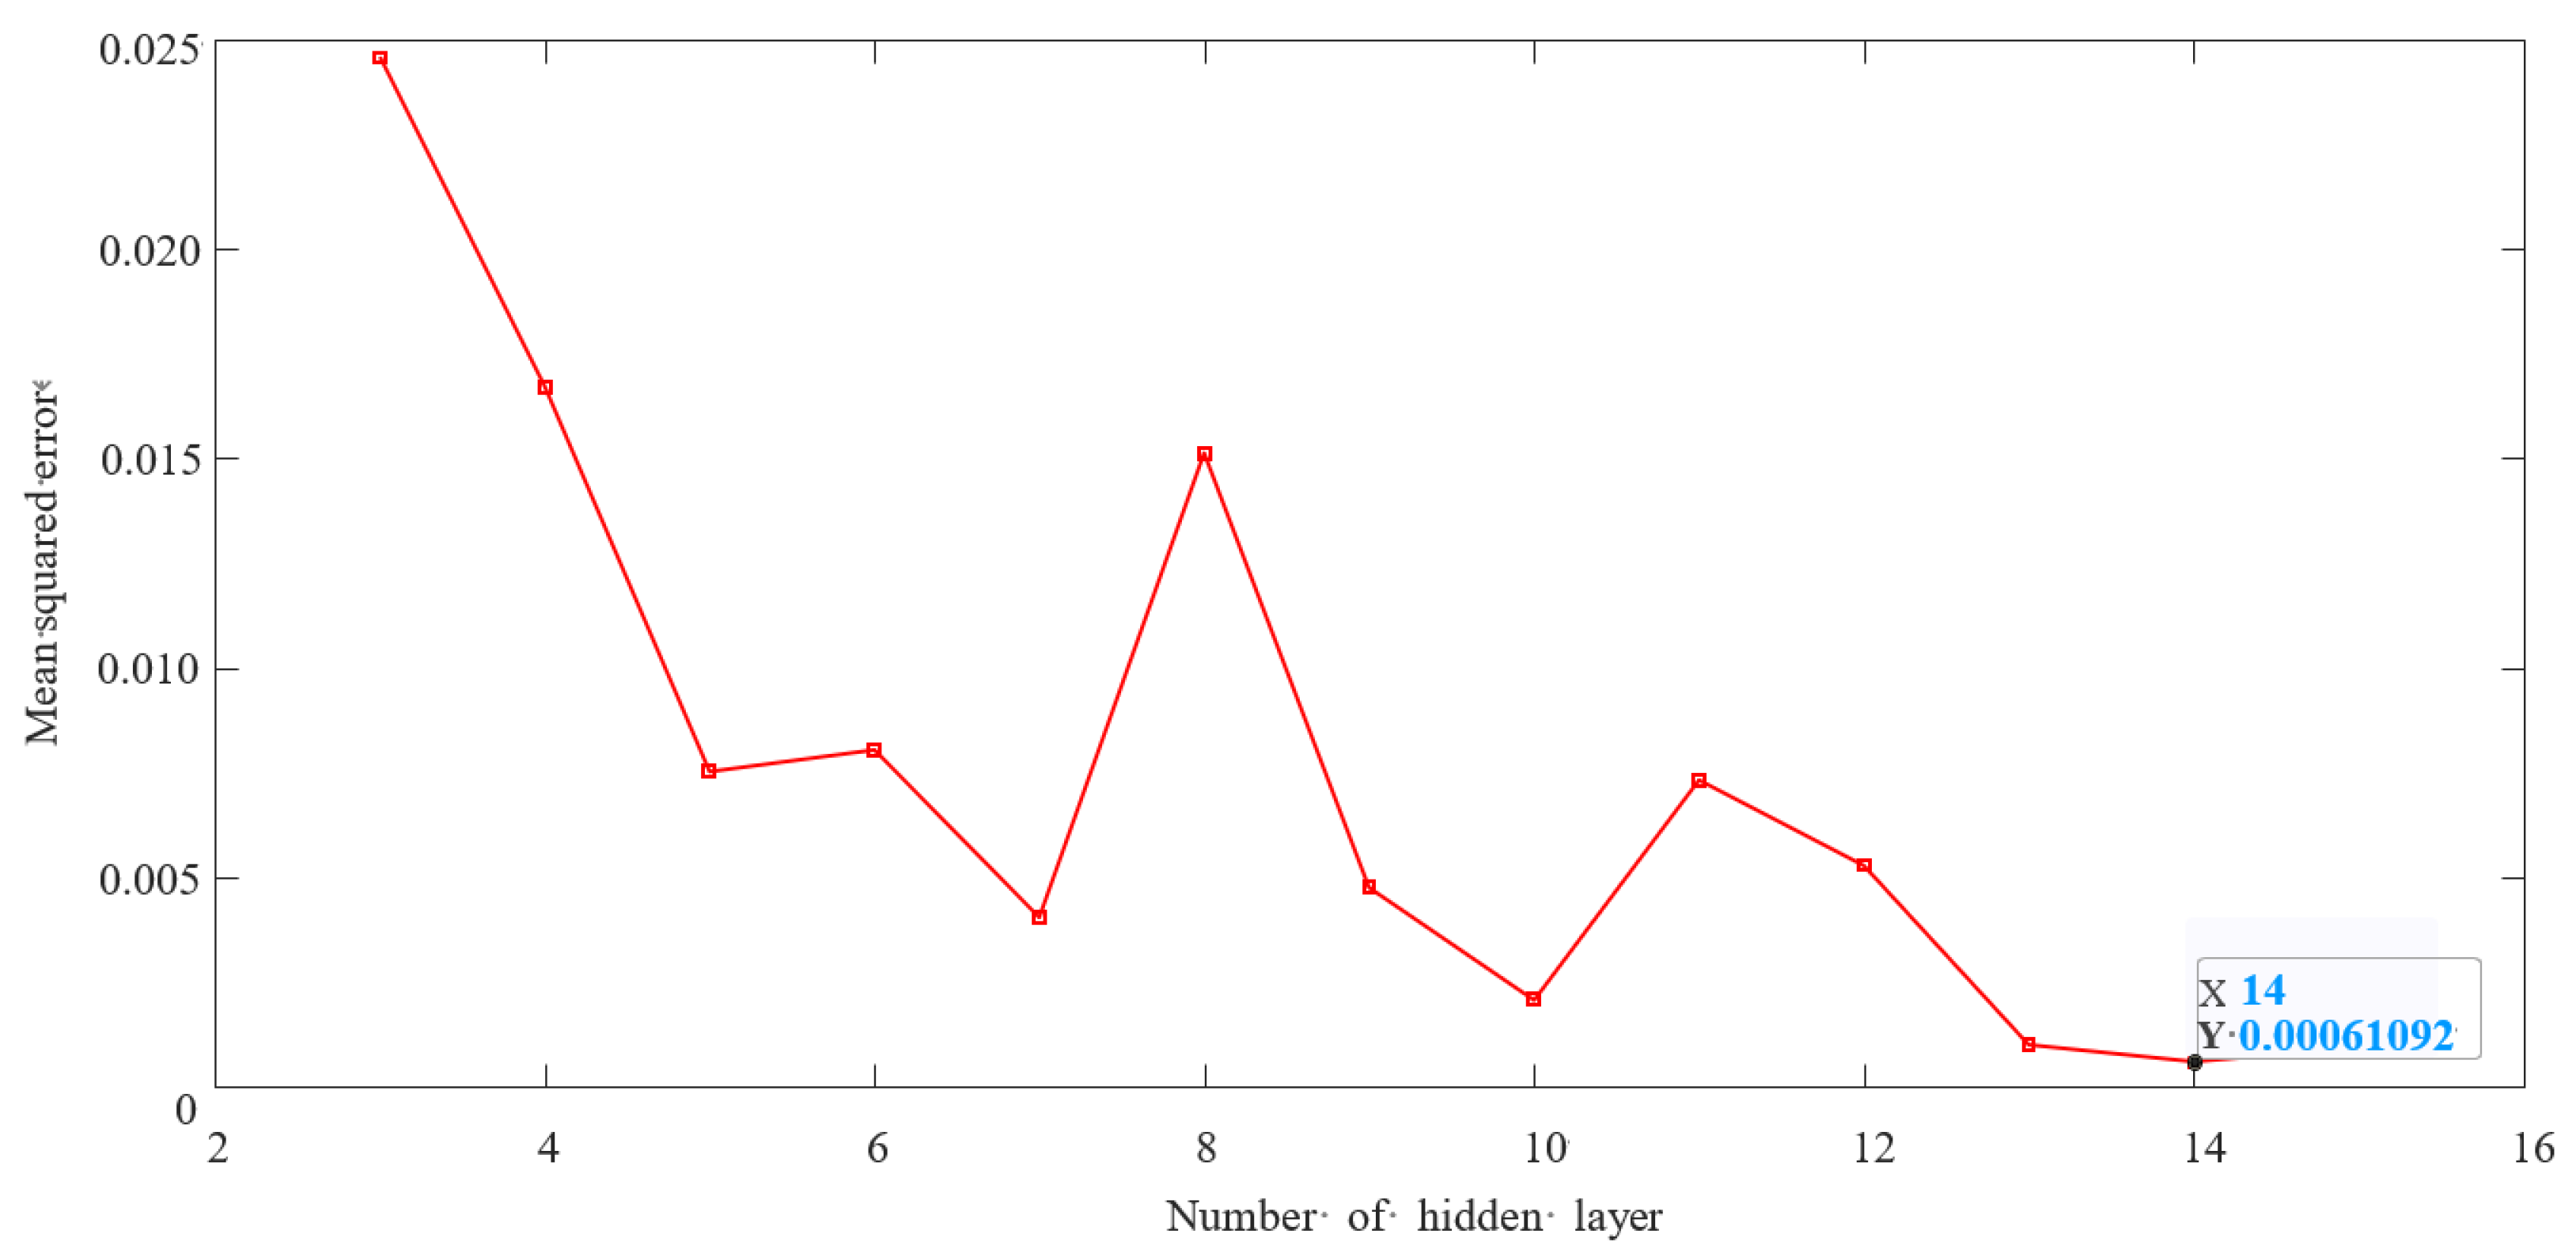
where α is an integer between 1 and 13. The number of neurons in the hidden layer is determined in the range of 3 to 15 according to the formula. In the case of the same sample set and training times, network errors corresponding to the number of nodes in different hidden layers are shown in Table 2 and Figure 3.
According to the simulation results in Figure 3, when the number of hidden layer nodes reaches 14, the training error reaches the minimum of 0.00061092. Therefore, the number of hidden layer nodes of the neural network designed in this paper is 14.
Based on the above analysis, the number of nodes in the input, hidden and output layers of the experimental model are 6-14-1, respectively, and the prediction model of 6-14-1 for aerobic composted aeration based on the BP neural network is established, as shown in Figure 4:

3.3. Parameter Setting of Genetic Algorithm

The parameters of fitness function, population size, number of iterations, crossover probability and mutation probability were set as below during the implementation of the genetic algorithm.

3.3.1. Fitness Function

The fitness function can determine the probability of an individual being selected [22]. In this experiment, the reciprocal of the squared error of the test data was used as the fitness function:
f x = 1 S E = 1 s s e T ^ T = 1 i = n t i ^ t i 2 .  
where T ^ = t 1 ^ , t 2 ^ , t n ^ is the prediction value for the test set; T = t 1 ,     t 2 , t n is the true value of the test set; and n is the number of samples in the test set.

3.3.2. Population Size

The population size can affect the performance of the genetic algorithm to some degree. The population size was determined by the optimized accuracy of the algorithm. The simulation results are shown in Table 3:
According to the experimental optimization accuracy in Table 2, when the population size is 40, the experimental effect is better.

3.3.3. Number of Iterations

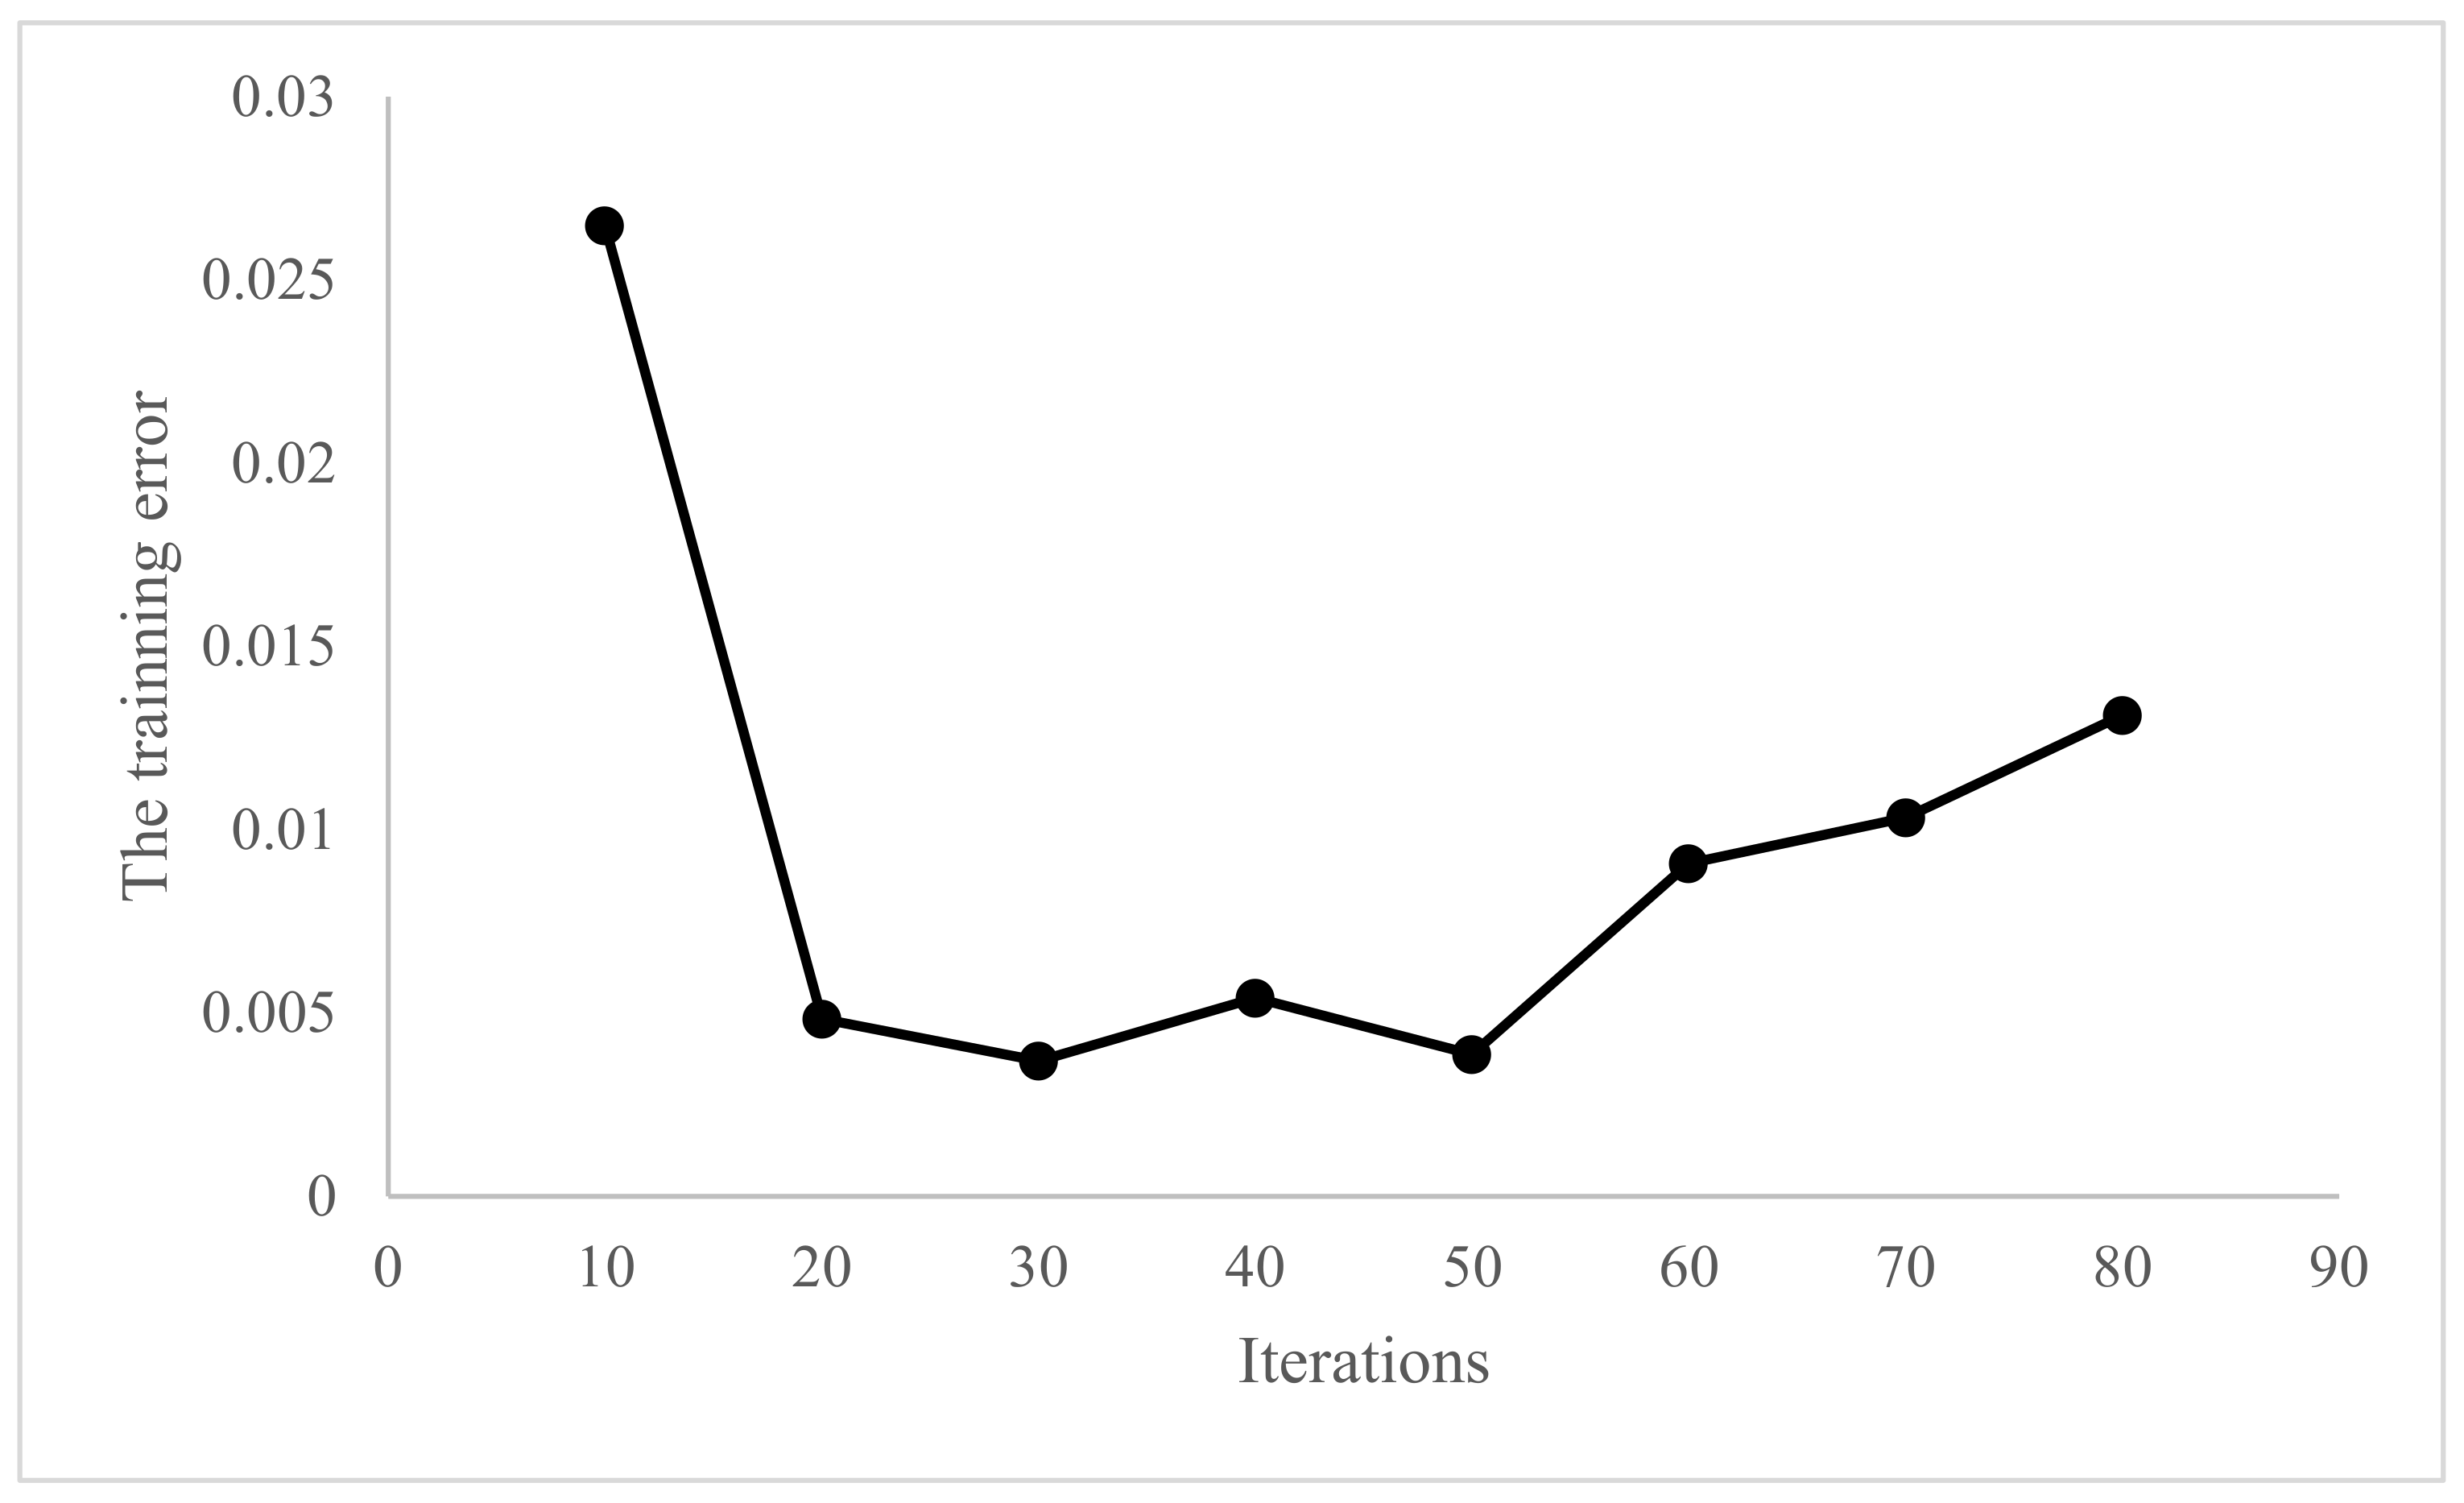
Depending on the number of iterations, the accuracy achieved by the genetic algorithm when converging will be different. Thus, it is necessary to find a balance between the accuracy of the algorithm and the efficiency of the system. The difference in algorithm error is analyzed for different numbers of iterations. The simulation results are shown in Table 4:
The algorithm error curve results corresponding to different numbers of iterations are shown in Figure 5:
It can be seen from Figure 5 that when the number of iterations is 30, the minimum algorithm error is 0.0036939. Thus, the number of iterations is set to 30.

3.3.4. Crossover Probability

The size of the crossover probability will indirectly affect the performance of the algorithm [23]. When the crossover probability is high, each generation can be fully crossed, but there will be a large generation gap, and the good patterns in the group will also be destroyed. When the crossover probability is low, the generation gap decreases, but the evolutionary process will slow down, which may lead to the stagnation of the genetic search. Therefore, the crossover probability is generally limited to between 0.2 and 0.99. The corresponding algorithm errors obtained when the number of iterations is linearly correlated with the crossover probability are shown in Table 5:
From Table 4, when the number of iterations is linearly correlated with the crossover probability, the algorithm error is small when the crossover probability is 0.8.

3.3.5. Variation Probability

The size of the mutation probability will affect the birth of new individuals. When the mutation probability is high, it is easy to produce new individuals, but it may also change the structure of the existing pattern [16]. If the mutation probability is too low to produce new individuals, the convergence performance of the algorithm will be reduced. Generally, this is limited to between 0.0001 and 0.1, with the initial setting at 0.1.

3.4. Prediction Model of Aeration Oxygen Supply by GA-BP Neural Network

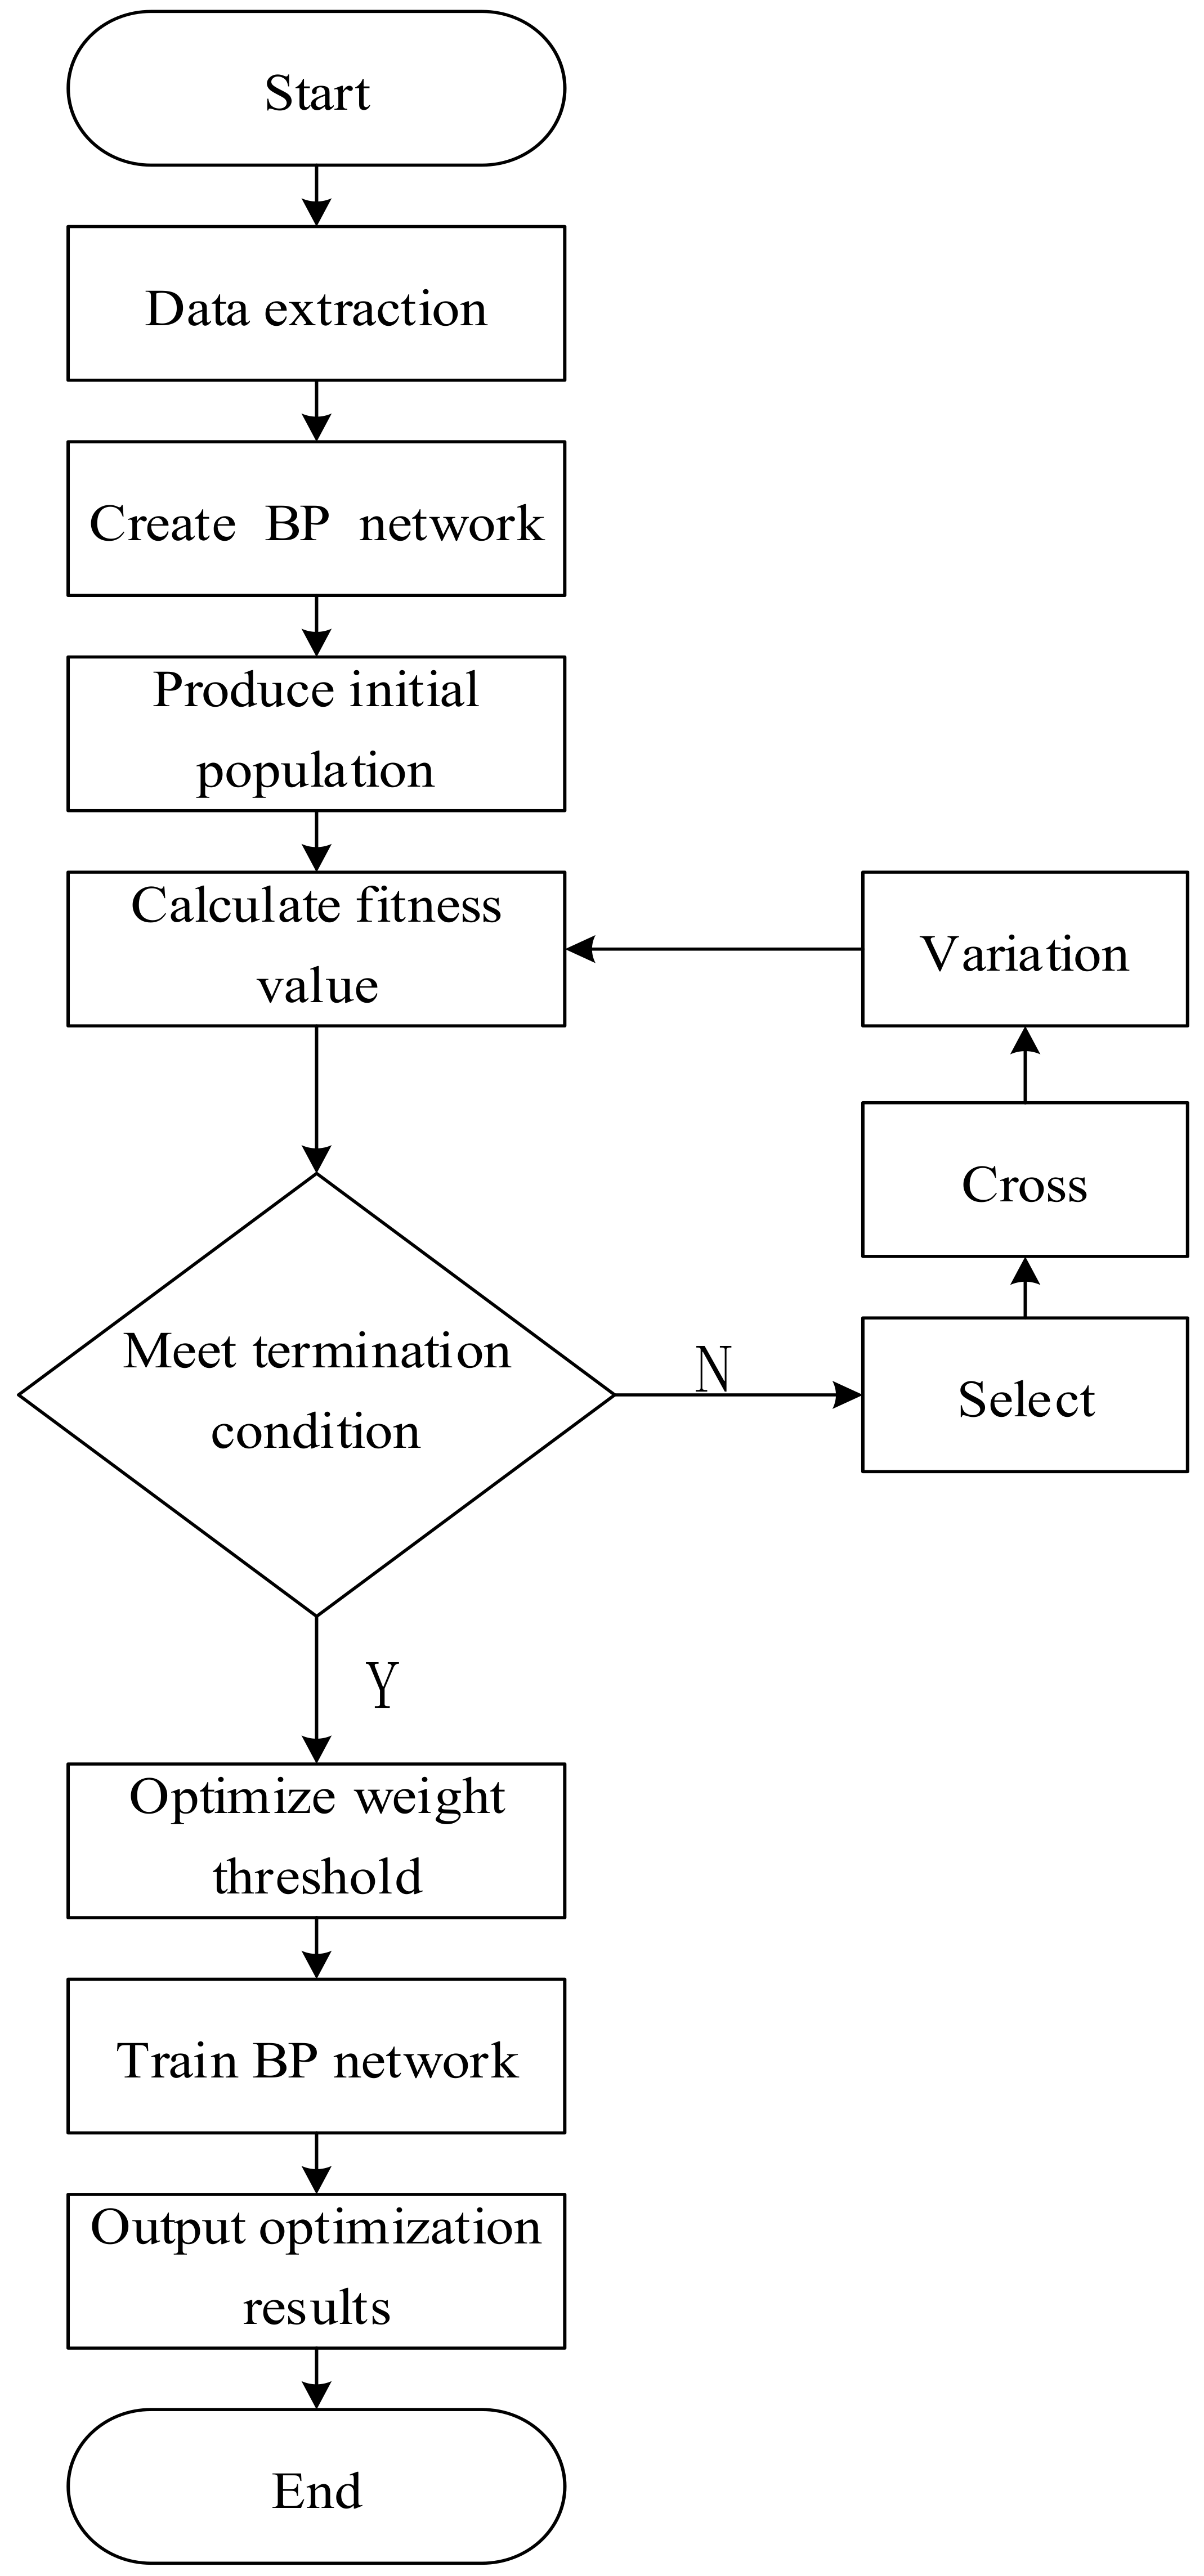
Since the standard BP neural network is prone to issues such as falling into local extremum and having slow convergence, this paper combines it with genetic algorithms, which are better at solving nonlinear and multidimensional space optimization problems, to establish an aeration oxygen supply prediction model based on a GA-BP neural network. The genetic algorithm optimization of the BP neural network mainly optimizes the initial weights and thresholds [24] and is noted as a GA-BP neural network model, through selection, crossover and mutation operations, to obtain optimal parameters for the assignment and training of the BP neural network, which ultimately delivers the most optimal solution for the predictive oxygen aeration model based on GA-BP neural network. This algorithm process is shown in Figure 6:

3.5. BP Neural Network Based on Improved Genetic Algorithm Optimization

Since the traditional genetic algorithm generally searches for feasible solutions, the convergence speed is relatively slow, the search ability is poor and it is easy to fall into the local optimum, which is the “premature” problem. In order to improve the above problems, make the optimized network converge faster and more accurately and improve the global search ability of the genetic algorithm, the traditional genetic algorithm is improved in the clone selection algorithm.

3.5.1. Clone Selection Algorithm

In 2002, based on the immune mechanism of the biological immune system, De Castro proposed the clonal immunization algorithm, abbreviated as CLONALG [25]. The core of the clonal selection algorithm is the use of the proportional replication operator and the proportional variation operator.
At the beginning of the algorithm, two subpopulations of H antibodies are generated at random, which can be divided into memory cells and remaining populations. Then, the affinity between the antigen and the antibody is calculated. The c antibodies with high affinity are selected for replication in set P to form set C. This process is cloning. High-frequency mutation is performed on set C to avoid the local optimum of the algorithm, and the antibodies are selected in the mutated population Cn. The above process is repeated until the algorithm satisfies the conditions.

3.5.2. Optimization of BP Neural Network Based on Clonal Genetic Algorithm

Due to the slow convergence speed of the standard BP neural network, the prediction accuracy is low and it is easy for the genetic algorithm to fall into local optimum, which has great limitations. In contrast, the clonal selection algorithm has the advantages of parallelism and adaptivity, which can maintain the diversity of the population and search for the optimal solution or feasible solution faster. The clone selection algorithm maintains the diversity of the population by adopting the proportional replication operator and proportional variation operator, while using the ability to balance the global and local search [26] of memory units, and optimizing the parameters of BP neural network and GA. Therefore, a BP neural network model based on clonal genetic algorithm optimization is established to optimize BP neural network, which is noted as the CGA-BP neural network model.
The flow chart of the BP neural network optimized based on the clonal genetic algorithm is shown in Figure 7.
Through the above simulation experiments on the parameters of the BP neural network and GA, the parameters of the predicted aeration oxygen supply model are shown in Table 6.

3.6. Model Evaluation Index

To comprehensively and accurately evaluate the performance of the aeration oxygen supply prediction model, MAE, MAPE and MSE were selected as evaluation indexes in this paper [20,26,27]. The expression of each evaluation index is
M M A E = 1 N i = 1 N y i y i ^
M M A P E = 1 N i = 1 N y i y i ^ y i
M M S E = 1 N i = 1 N y i y i ^ 2
y i —real value;
y i ^ —predicted;
N —number of test samples.

4. Prediction Results and Discussion

4.1. Model Prediction Results

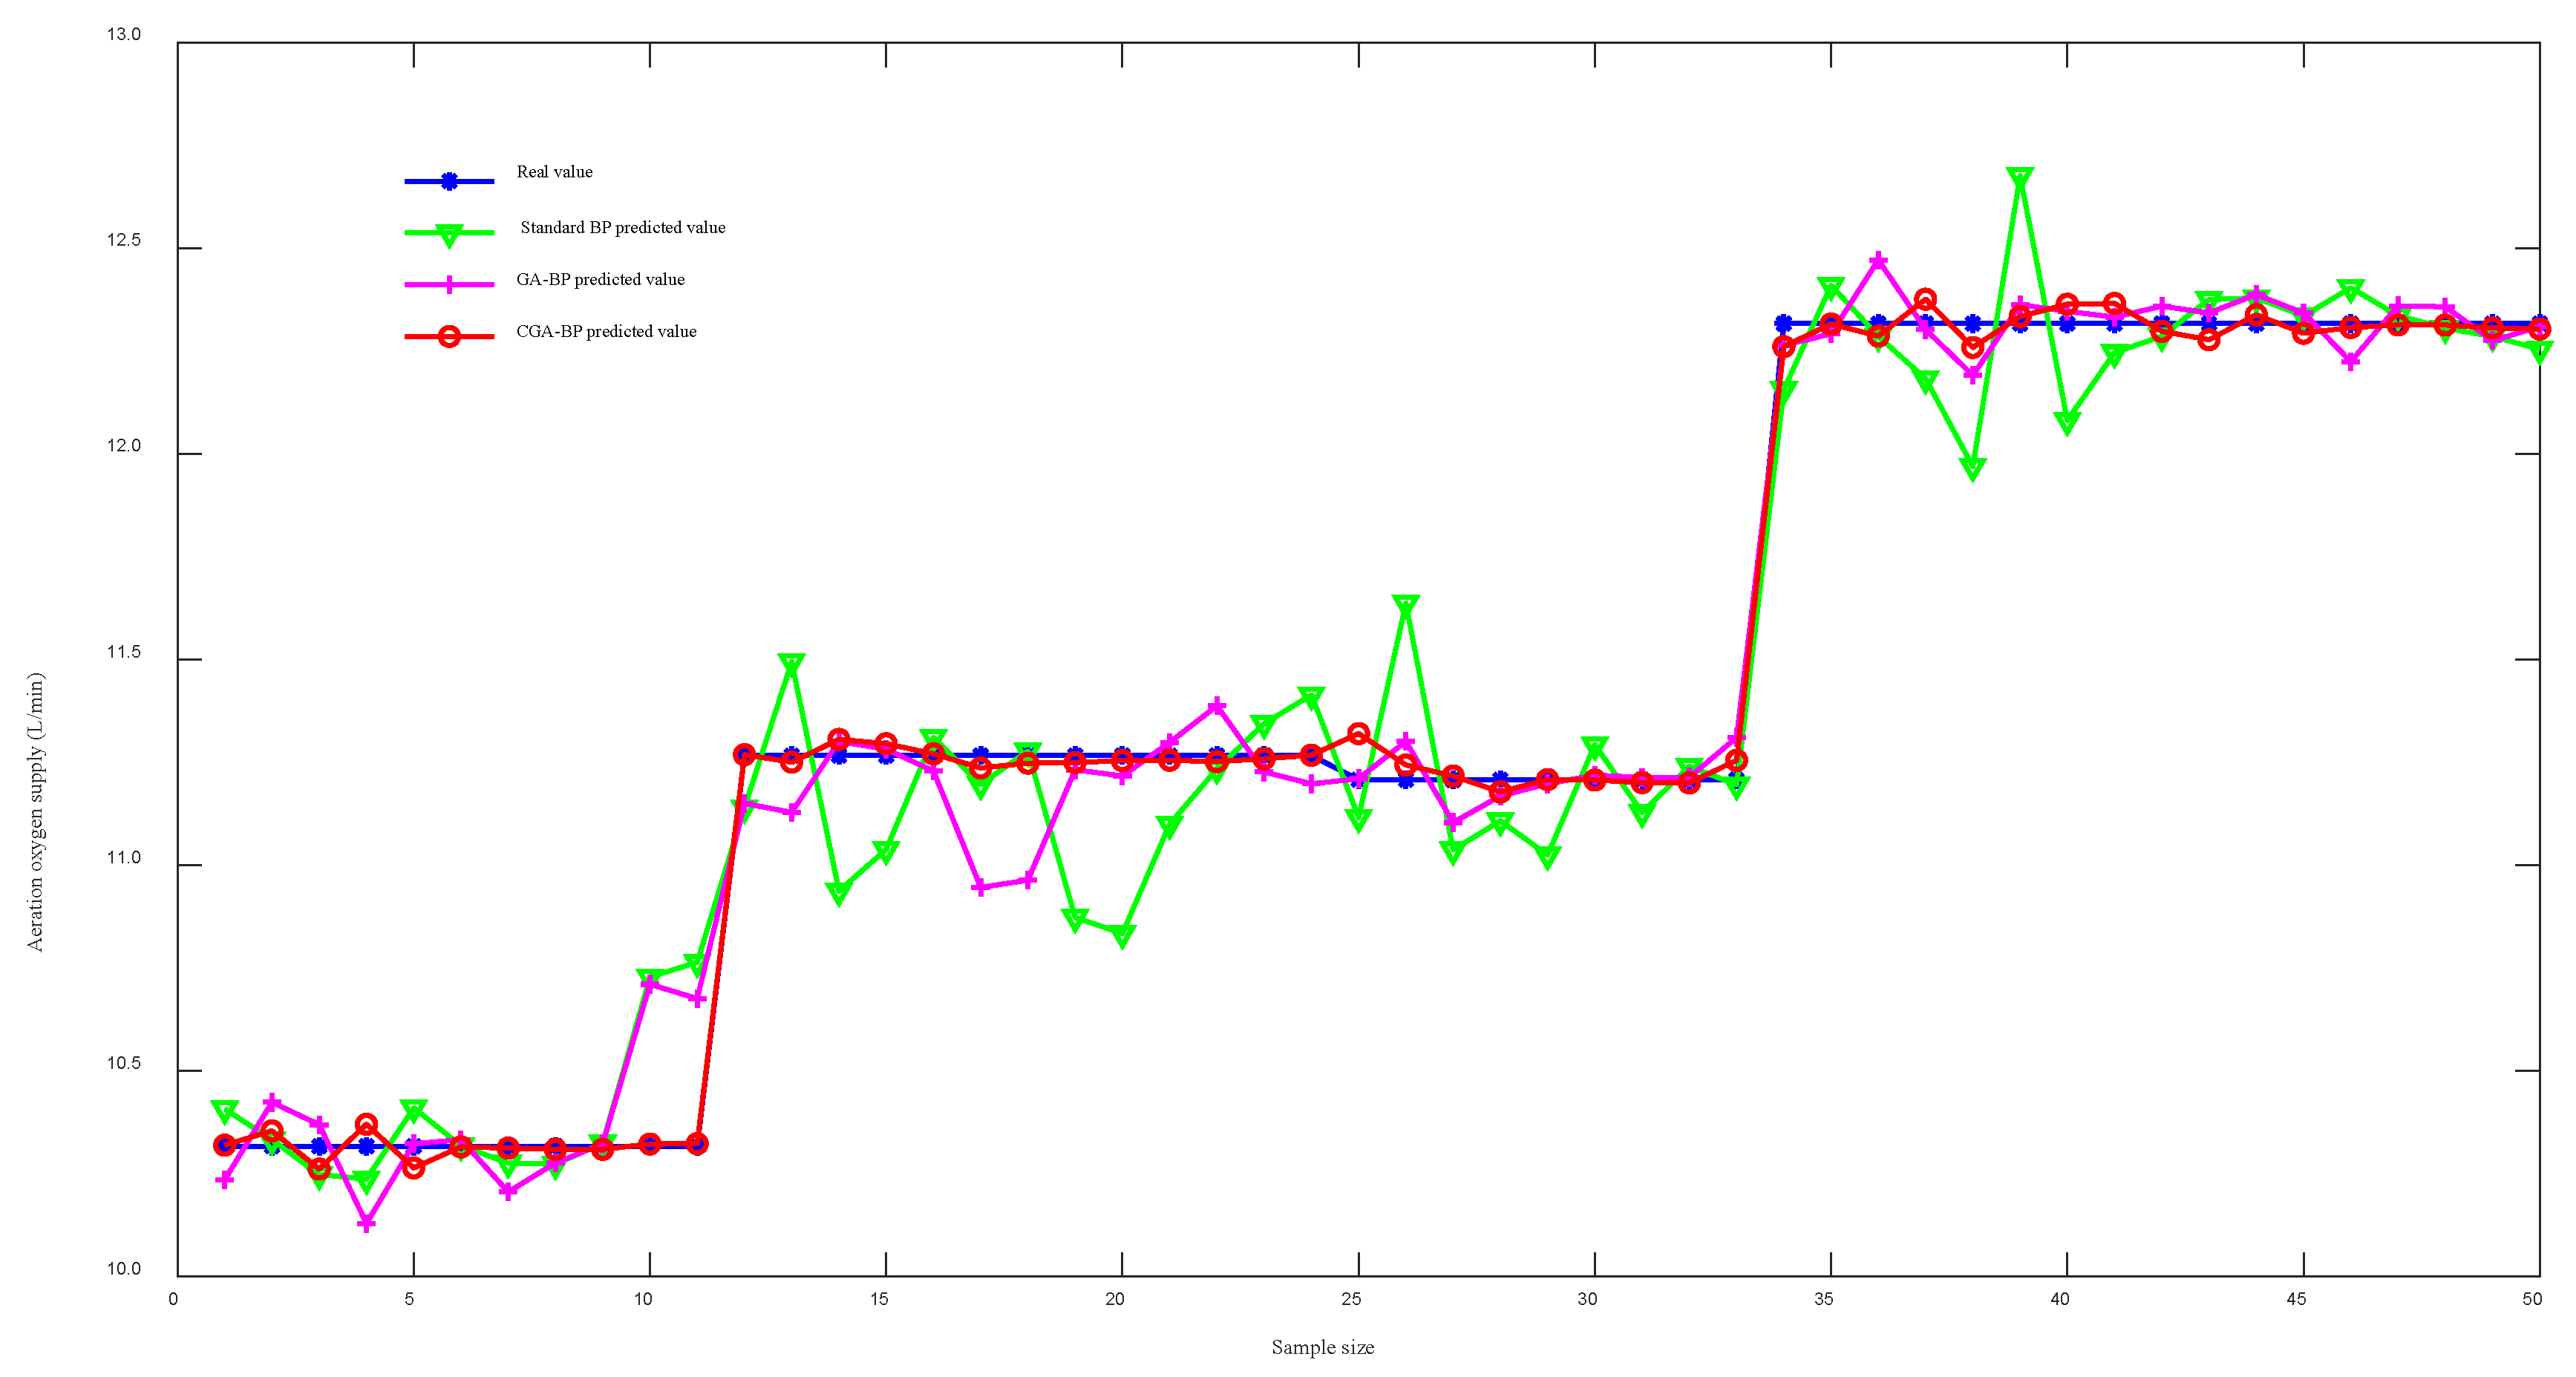
Figure 8 shows the comparison between the predicted and actual values of the standard BP algorithm, GA-BP neural network algorithm and CGA-BP neural network algorithm. It can be seen visually that the trend of variation in the aeration oxygen supply of the CGA-BP neural network algorithm, the GA-BP neural network algorithm and the standard BP algorithm is consistent with the actual changing trend. After the BP neural network was optimized by the GA, the prediction results were more accurate than those of the standard BP neural network, but after the GA-BP neural network was optimized by the clone selection algorithm, the prediction results were closer to the actual value than the GA-BP neural network algorithm, and the CGA-BP prediction value was almost the same as the real value with high accuracy when the real value of aeration is 12.25 min/L.
Figure 9 shows the comparison of the error between the aeration oxygen supply and the actual value of the three algorithms of the standard BP neural network algorithm, the GA-BP neural network and the CGA-BP neural network. From Figure 9, we can see that the prediction error of the GA-BP neural network is much smaller than the prediction error of the standard BP neural network, and the prediction error of the CGA-BP neural network is almost 0. Therefore, the improved CGA-BP neural network prediction model can accurately predict the next aeration oxygen supply.
The prediction results of aerobic compost aeration oxygen supply based on the CGA-BP neural network show that using six commonly used indicators, such as temperature, humidity, oxygen concentration, room temperature, pH value and EC, to predict the aeration amount further improves the prediction accuracy and improves the aeration efficiency during the compost fermentation process.
In the past, most studies have used aeration control systems to control the aeration rate. Through aeration systems, the oxygen content in sewage tanks can be studied. Through parameter control, the change in oxygen content in the aeration tank does not exceed 0.5 mg/L of soil [28]. Zhao and others analyzed the operation of the precise aeration control system, indicating that the gas supply volume of the gas supply system has decreased by 30% [29]. Now, some scholars have introduced modeling methods to control aeration rate and improve aeration efficiency. Jin established an energy consumption prediction model using a BP neural network, and used inflow information to predict dissolved oxygen, providing a reliable basis for the timely scheduling of aeration volume [30]. Tang established a genetic-algorithm-optimized BP neural network model to predict the aeration rate of the biochemical tank, and the proportion of test sample data prediction errors within 5% reached 98.67% [31]. The results of this study show that the prediction accuracy is improved to 99.65% by using the clonal selection algorithm to optimize the genetic algorithm and BP neural network.
As can be seen from Table 7, the genetically optimized BP neural network algorithm has a significant improvement in prediction accuracy over the standard BP neural network algorithm, with an accuracy of 98.94% for the BP neural network algorithm, 99.26% for the genetic-algorithm-optimized standard BP neural network and 99.65% for the clonally optimized genetic algorithm. The MAE, MAPE and MSE of the GA-BP model were 0.083017, 0.0073914 and 0.013188, respectively, and the MAE, MAPE and MSE of the CGA-BP model were 0.038882, 0.003506 and 0.003373, respectively. The MAE, MAPE and MSE of the GA-BP model were improved compared with the standard BP model by 29.4913%, 30.1644% and 53.2490%, and the MAE, MAPE and MSE of the CGA-BP model were improved by 53.1638%, 52.5638% and 74.4260%, respectively, compared with the GA-BP model. This shows that the prediction accuracy of the CGA-BP algorithm is higher than that of the GA-BP algorithm and the BP neural network algorithm, and the error between the predicted and true values of the CGA-BP neural network model is basically zero, which can predict the aeration oxygen supply well and provide data for the next aeration.

4.2. Parameter Changes during Aerobic Composting Fermentation Process

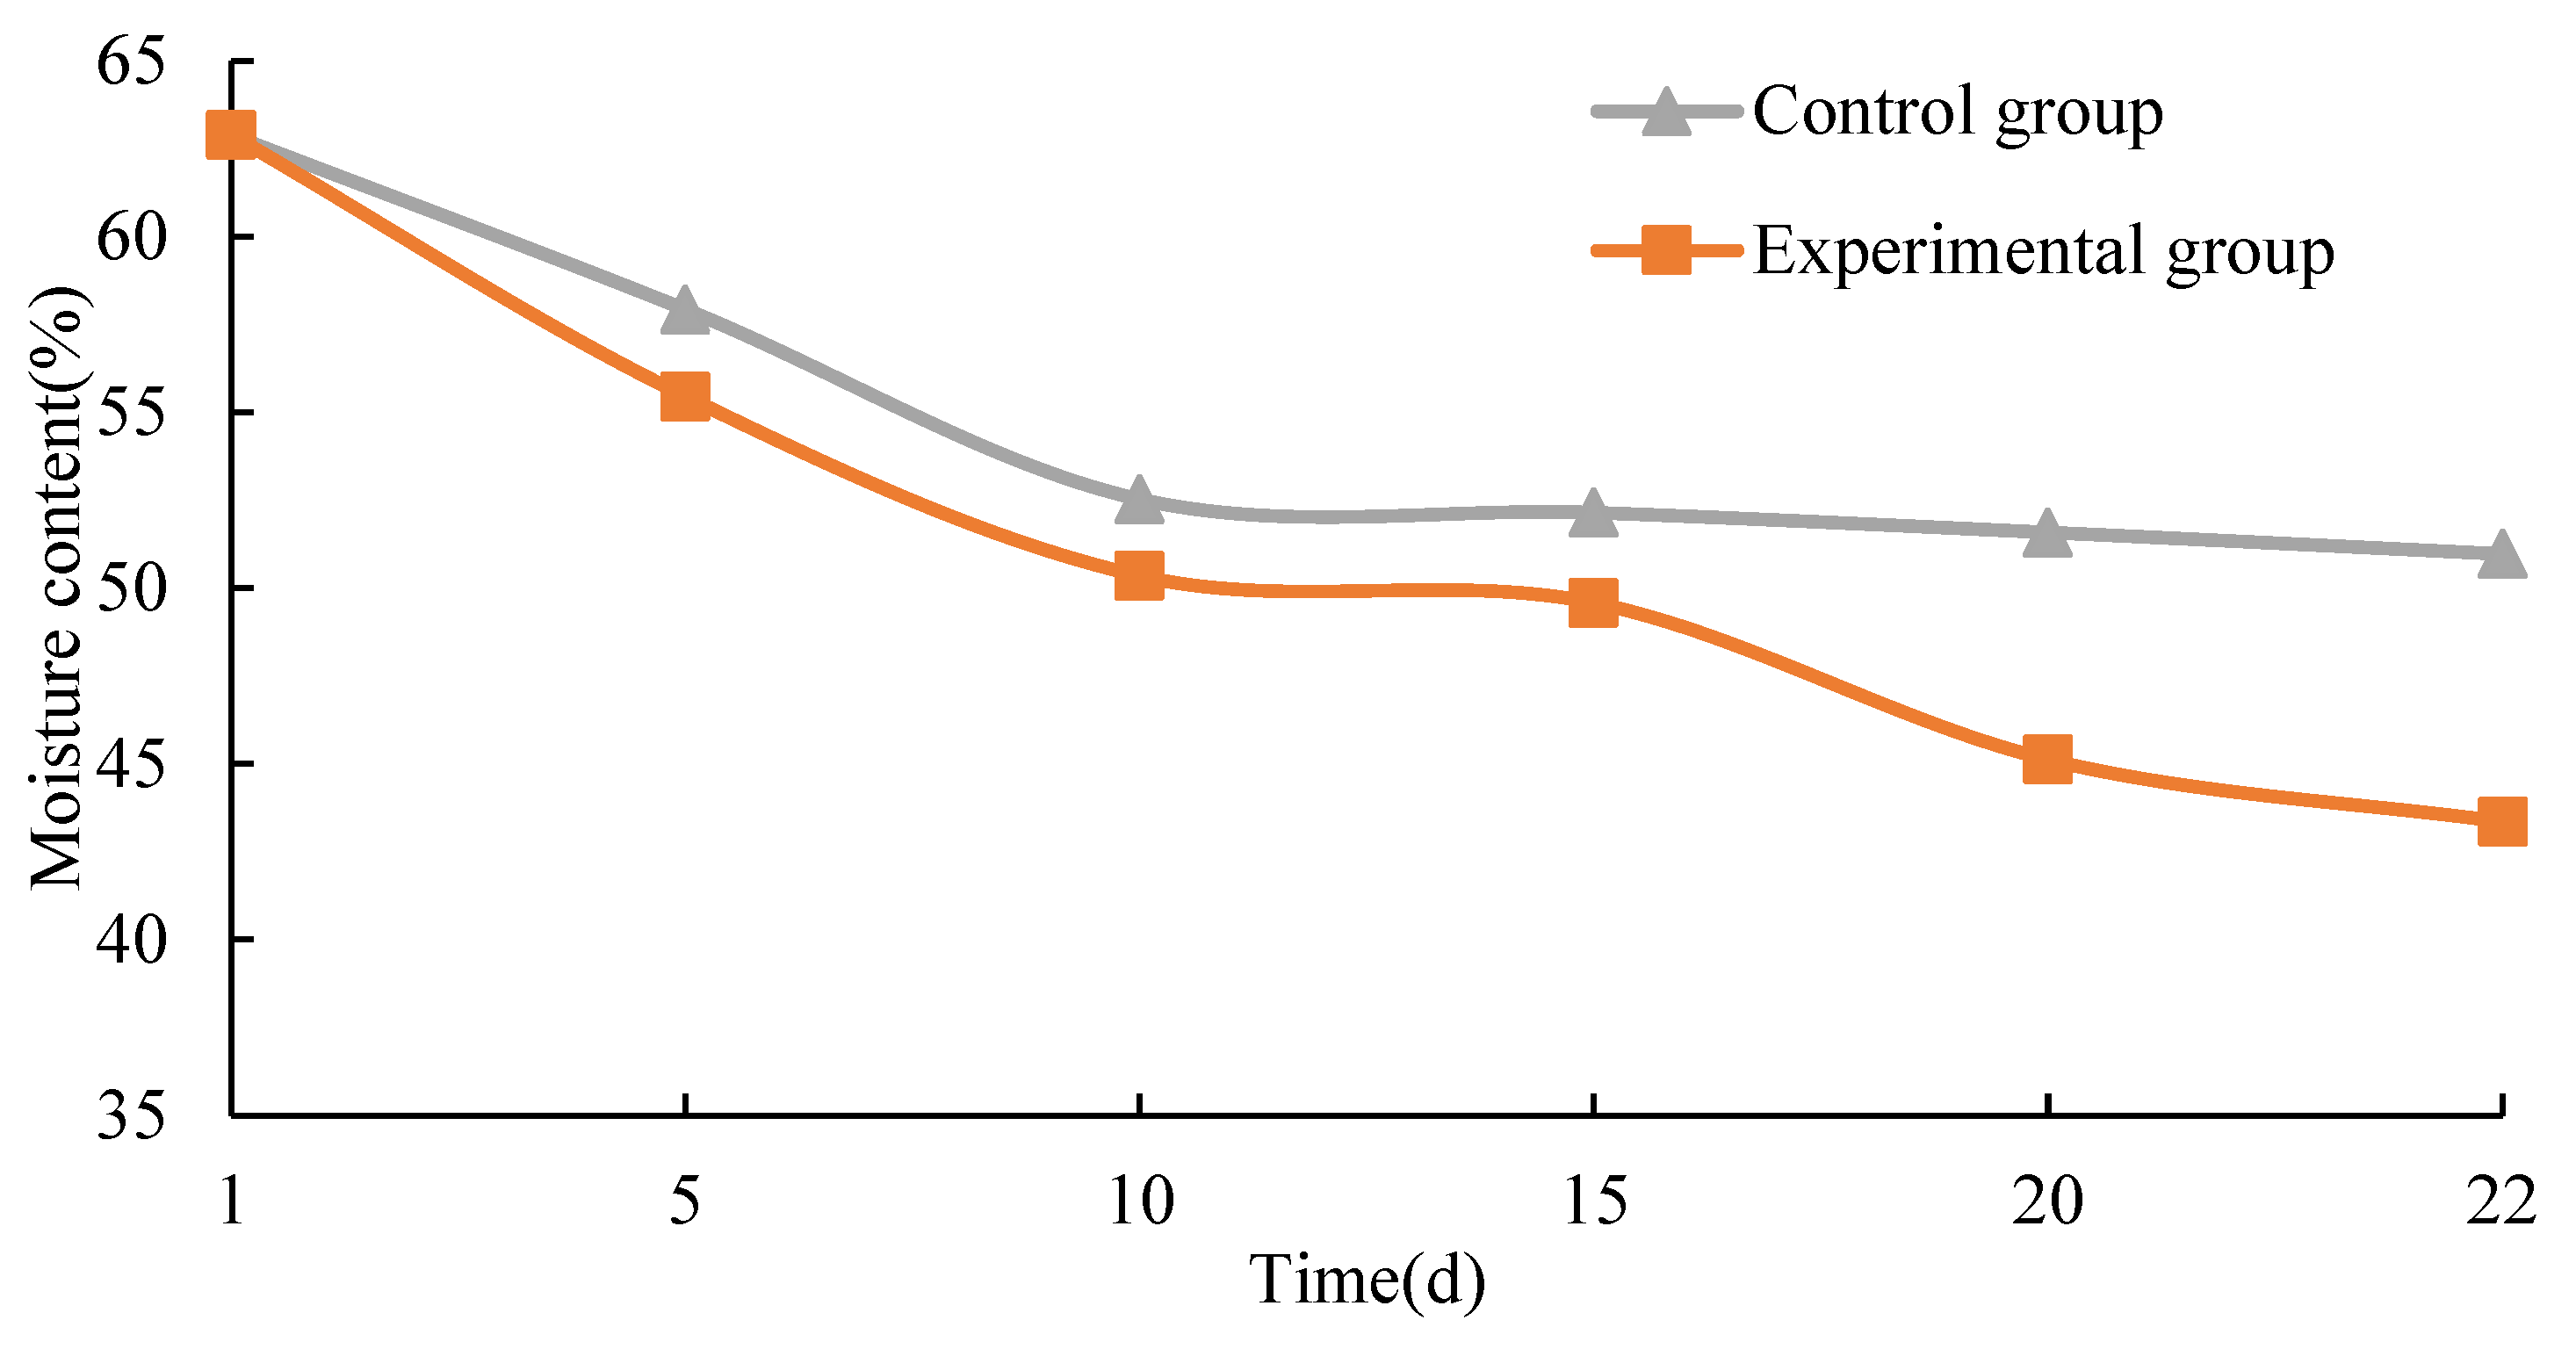
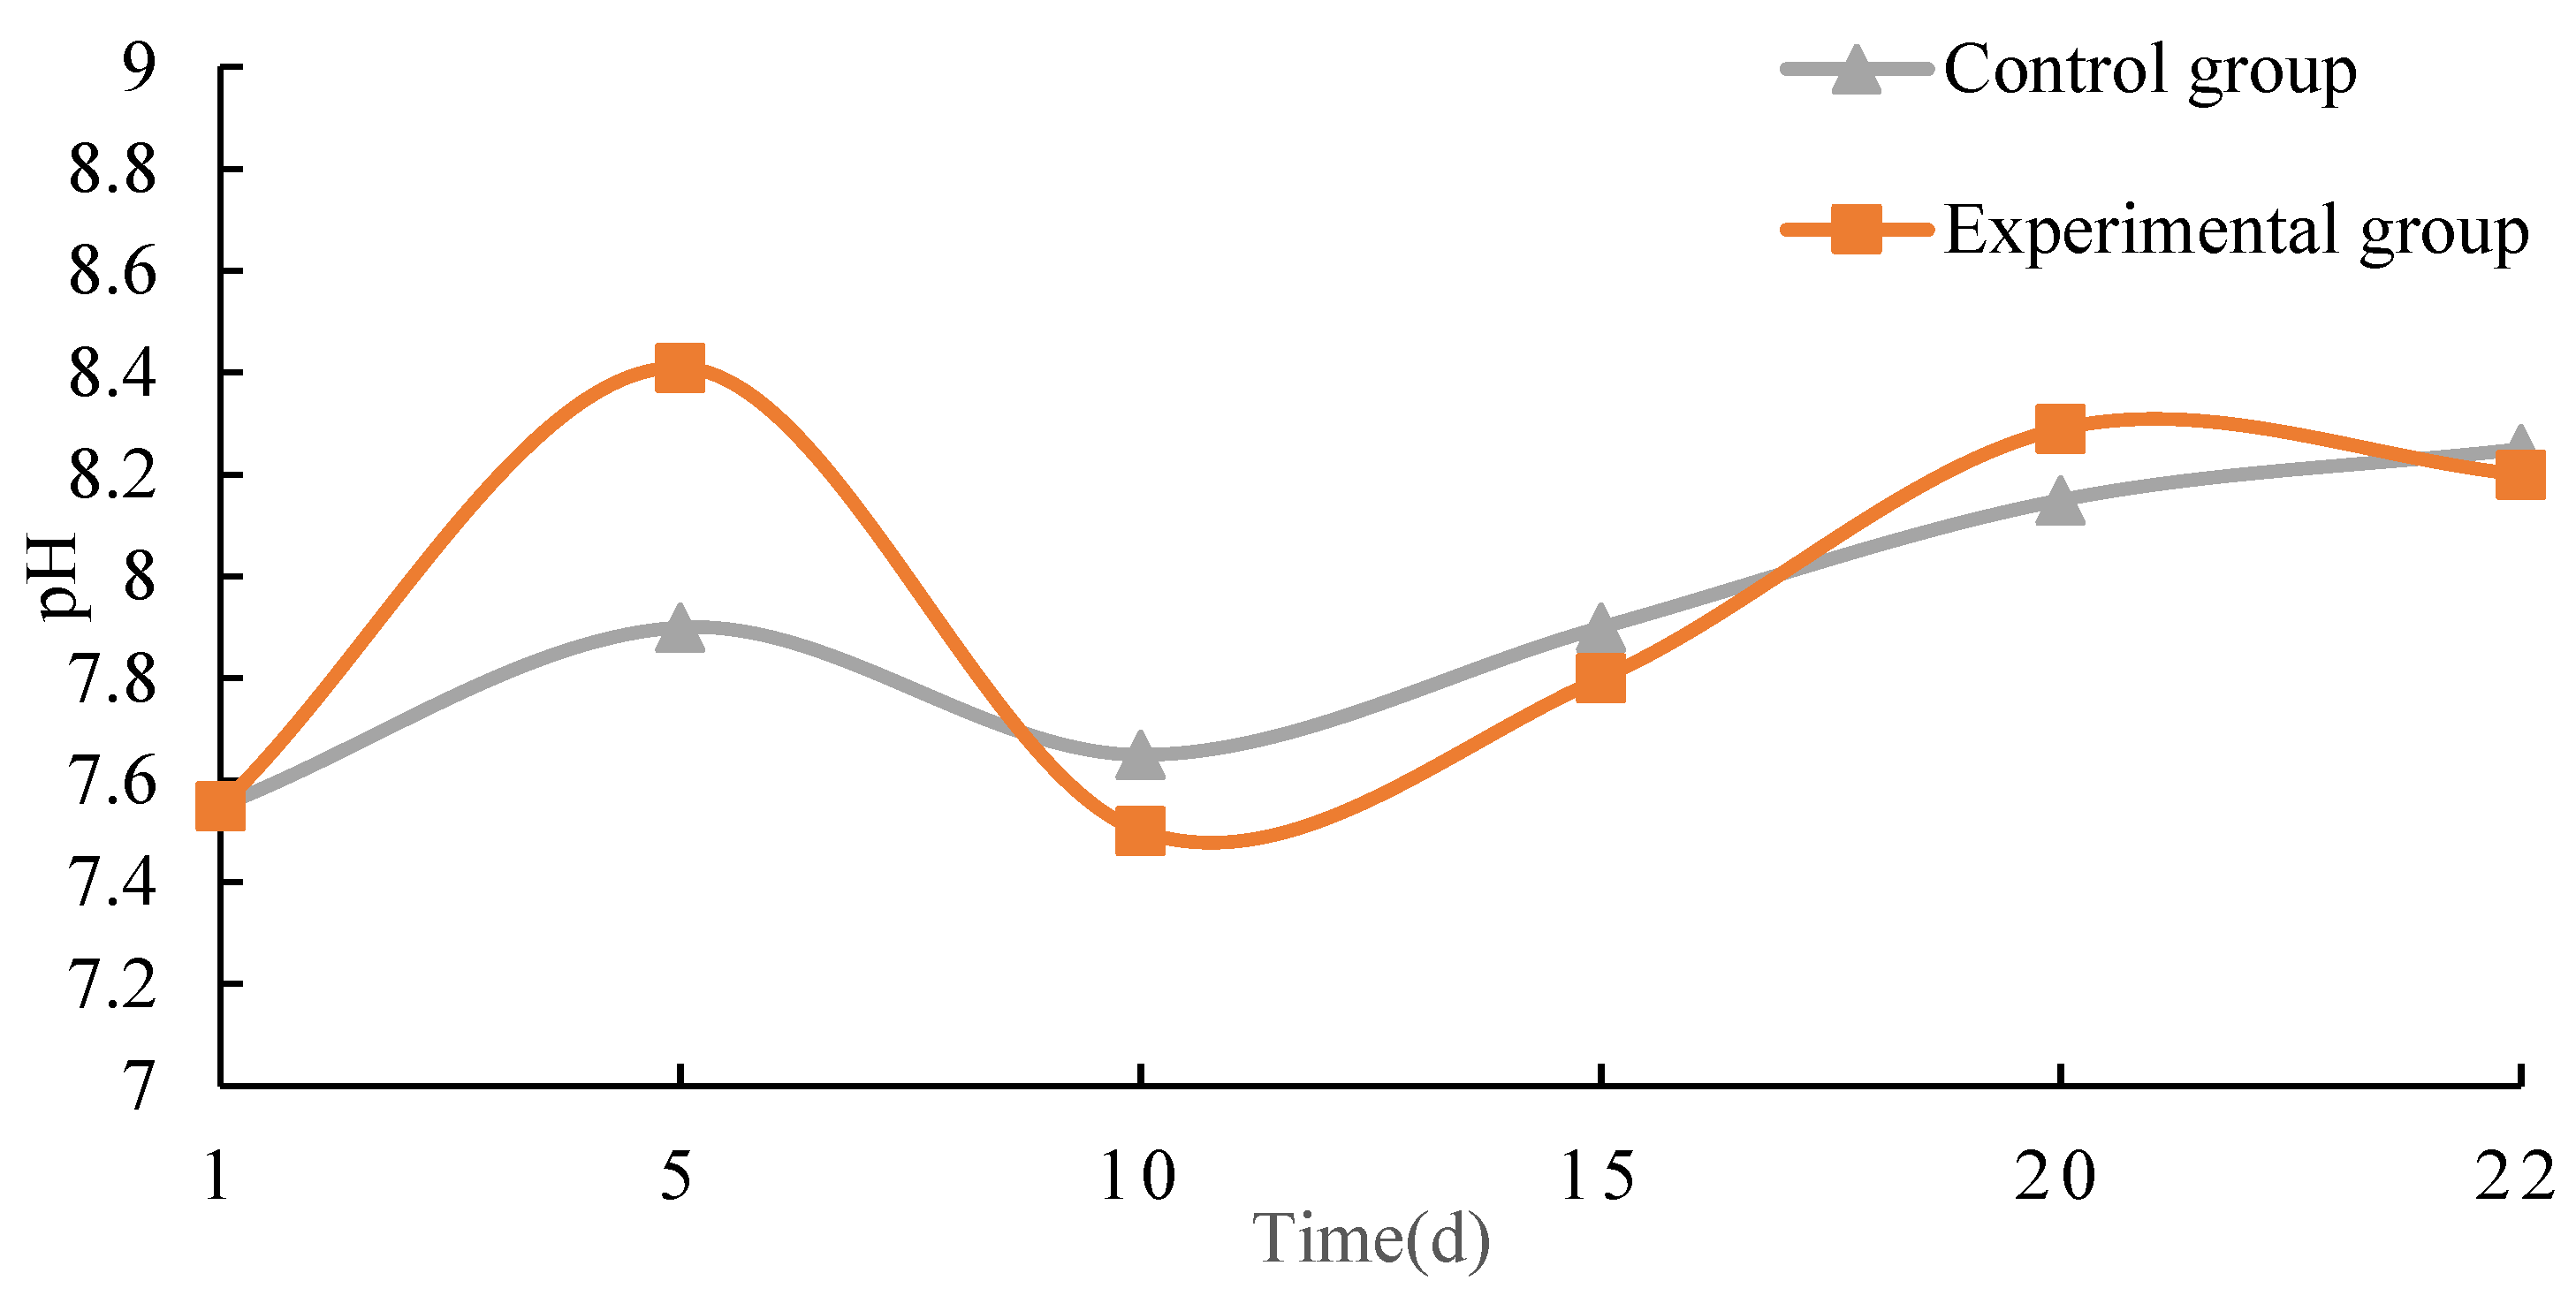
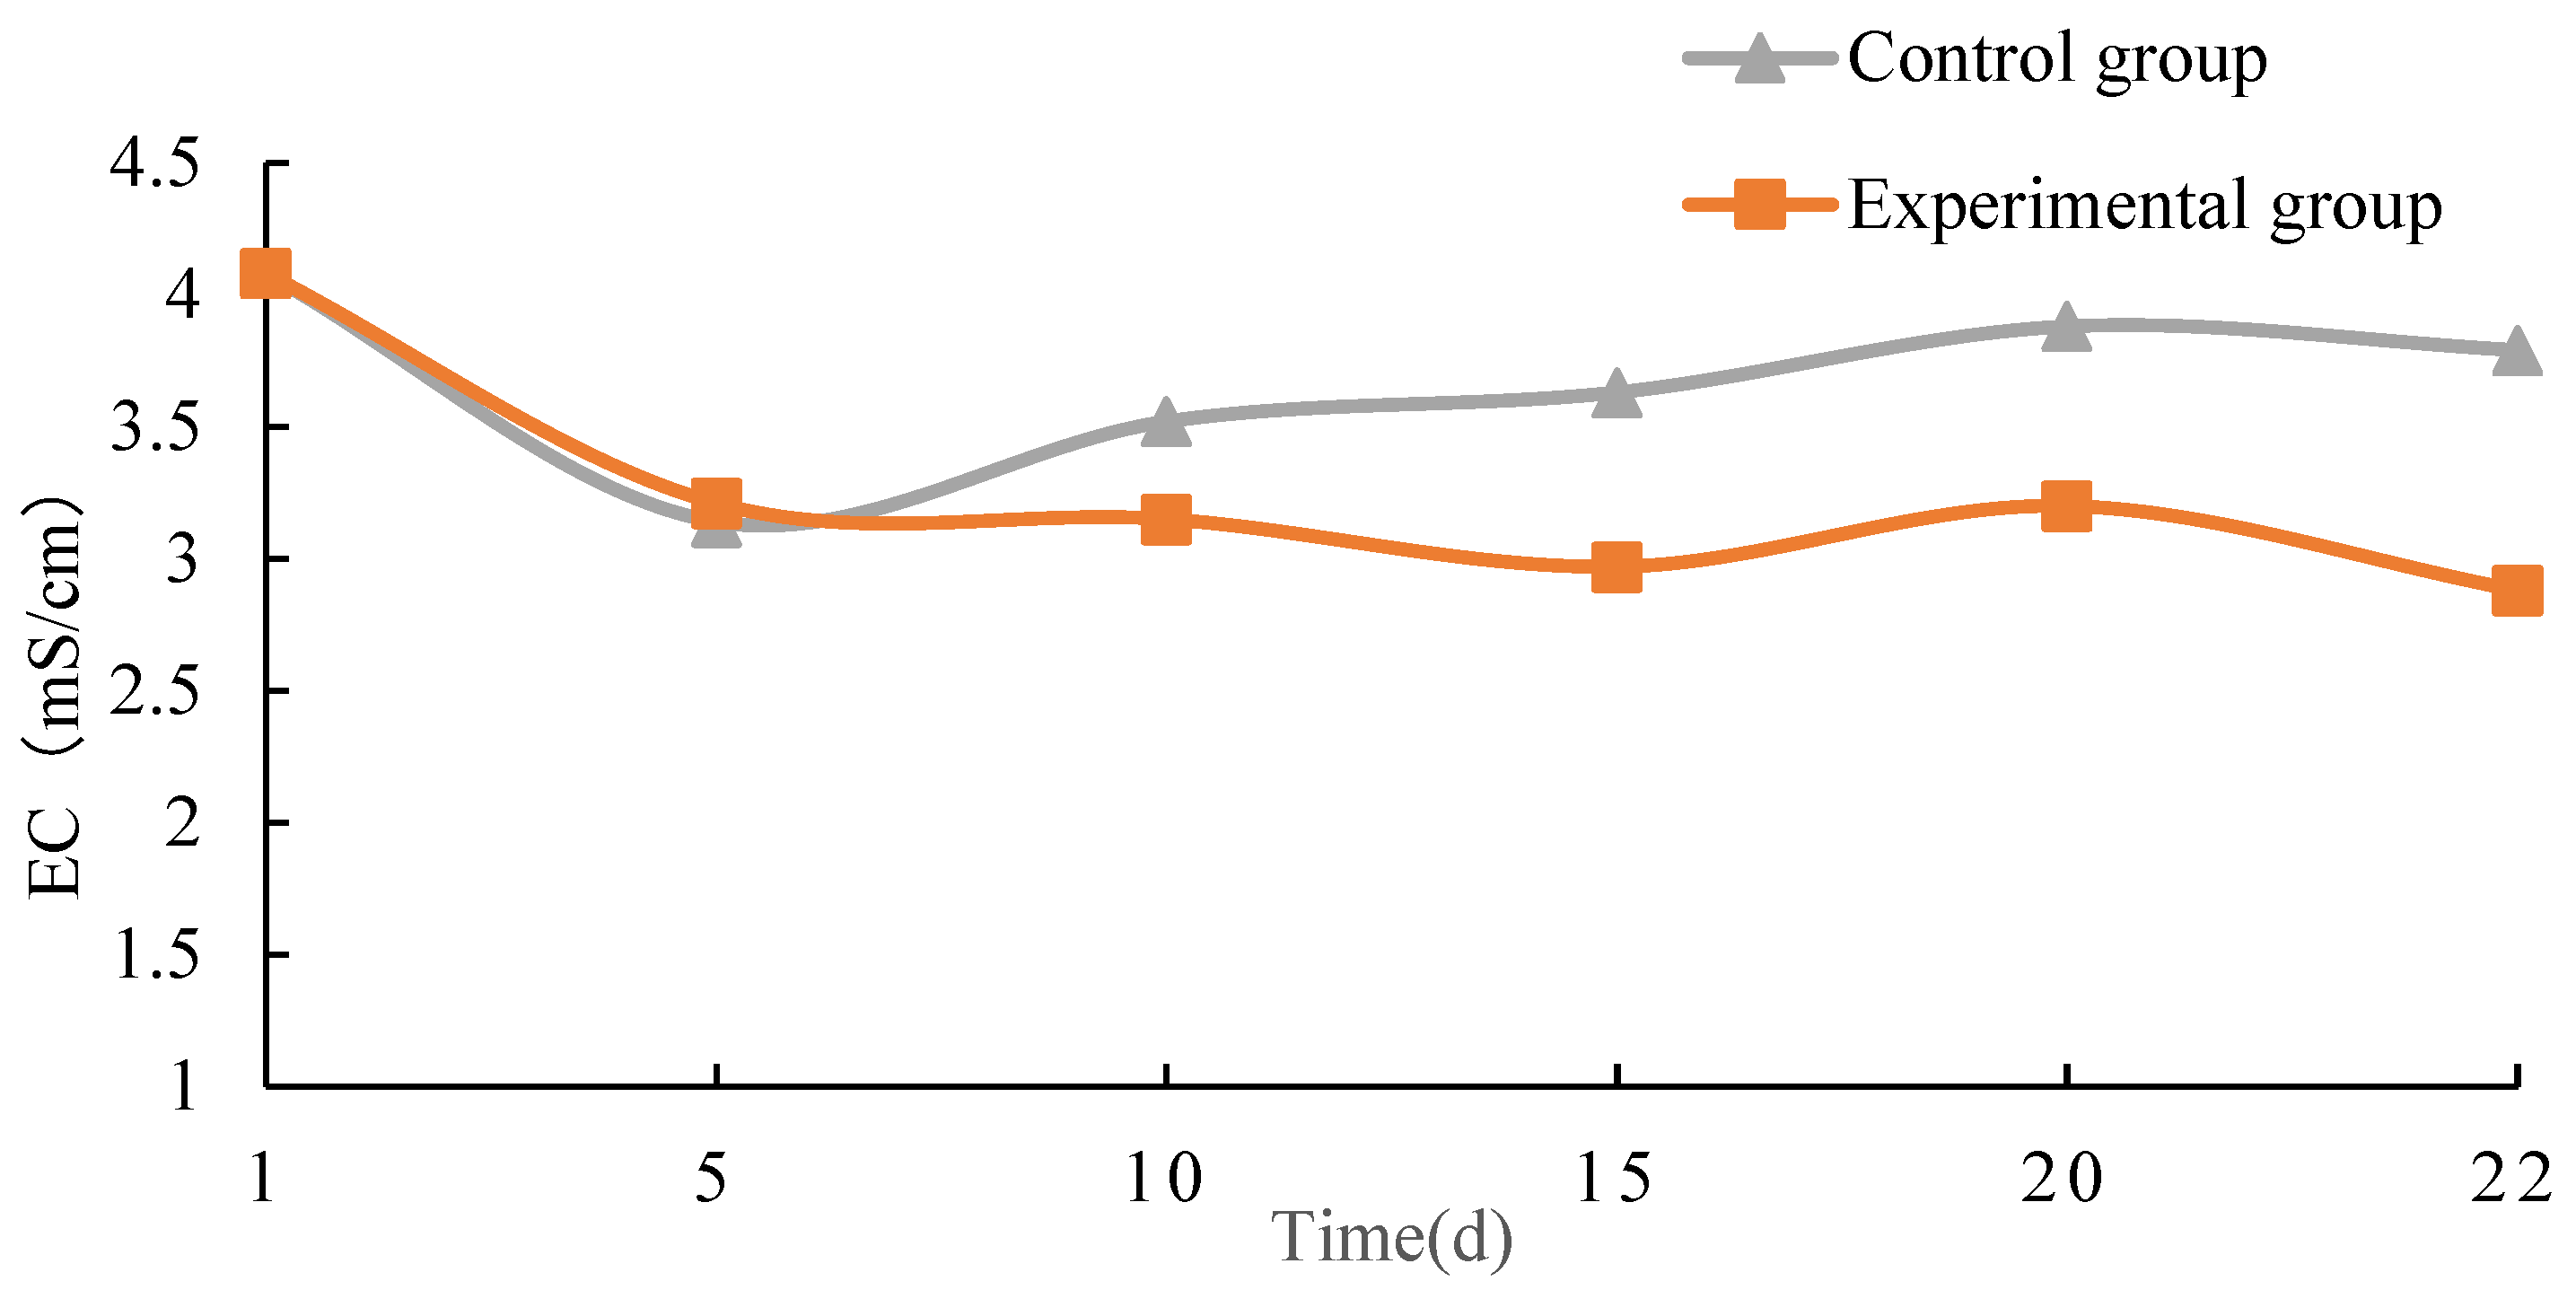
This experiment used the CGA-BP model to predict the aeration oxygen supply for compost fermentation, and used it as the experimental group. The other group is the control group without aeration, which analyzes the changes in moisture content, C/N, pH and EC value during the aerobic composting fermentation process. By comparison, it can be concluded that the CGA-BP aeration oxygen supply prediction model can promote faster and more complete fermentation of compost, and improve the efficiency of compost maturation.
(1)
Moisture content
The moisture content of aerobic compost is the main factor affecting the process of aerobic composting and the rate of organic matter decomposition, and its changes are mainly the result of the combined action of organic matter oxidation and decomposition to produce water and ventilation to remove water. The overall moisture content showed a decreasing trend until the end of the composting reaction. The moisture content of the control group and the experimental group decreased by 11.91% and 19.54%, respectively. As shown in Figure 10, in the early stage of composting, due to the continuous increase in pile temperature, bacterial activity increases and absorbs a large amount of water. After the evaporation of water during the high-temperature period, the rate of decrease in moisture content significantly slows down, and the microbial metabolism rate decreases. The experimental group aerates the compost to fully react, resulting in a more significant decrease in moisture content. At this point, the compost reaches a more mature state.
(2)
C/N
C/N plays an important role in the growth and metabolism of micro-organisms in compost. Low C/N can lead to high salt content and inhibit microbial growth, while high C/N can lead to substandard nutrient content in compost fertilizers. The C/N change curve is shown in Figure 11. Comparing the two groups, it was found that the experimental group showed a gradual decrease in C/N during the composting fermentation process, which is more conducive to reducing nitrogen loss and promoting compost maturity.
(3)
pH
pH is an important parameter that can be used to determine the microbial environment and is also one of the many factors that evaluate the maturity of aerobic compost. Research has shown that composting fermentation can proceed efficiently and smoothly when the pH is between 6 and 9, as shown in Figure 12, showing the dynamic changes in pH values during various stages of aerobic composting fermentation. The pH value curves of the two groups showed a similar trend of change, showing an overall upward trend, rising first and then decreasing, and then rebounding to a stable range between 7.5 and 8.5. The overall fluctuation range of the pH value of the experimental group is larger than that of the control group, but it tends to stabilize faster than the control group until the compost fermentation is completed. The pH values of the control group and the experimental group are 8.25 and 8.2, respectively, meeting the commonly considered compost maturity standards (pH 8.0–9.0) [32].
(4)
EC
The size of the EC value is directly related to the salt concentration in the aerobic composting fermentation process. Generally speaking, the smaller the EC value, the more harmless it is for plants. The dynamic changes in EC values are shown in Figure 13. The EC values of the two groups do not change much. During each stage of composting fermentation, the metabolic rate of micro-organisms increases, and the decomposition of organic matter generates a large amount of mineral salts, which increases the EC value. As ammonia volatilizes, the EC value also decreases. The experimental group can fully react in the early stage of composting, and then continue stable fermentation, effectively promoting maturity.
5. Conclusions

Aiming at the problems of low prediction accuracy and poor aeration efficiency in aerobic composting, this paper trains the neural network with normalized data, adjusts various parameters to suit the model and establishes an aeration oxygen supply prediction model based on a GA-BP neural network for aerobic composting. The simulation was conducted by MATLAB toolbox functions. The comparison of the experimental results shows that by optimizing the BP neural network through GA, the optimal weights and thresholds can be obtained. Thus, it solves the problem that the BP neural network is prone to local extremes and improves the convergence speed as well as the prediction accuracy of the model. The clonal selection algorithm optimizes the genetic algorithm and establishes the CGA-BP neural network model, which has a more accurate prediction effect and can better predict the aeration oxygen supply in the composting fermentation process.
The results indicate that the CGA-optimized BP neural network method used in this article has good predictive ability and practical value in predicting aeration oxygen supply. The aeration oxygen supply predicted by the CGA-BP model can effectively promote the compost ripening process, improve compost fermentation efficiency and further determine the required aeration oxygen supply during the aerobic compost ripening process.

Author Contributions

G.D.: conceptualization, formal analysis, investigation, data curation, writing—original draft, project administration. X.S.: conceptualization, formal analysis, investigation, data curation, writing—original draft, project administration. J.H.: writing—review and editing, supervision. P.J.: methodology, writing—review and editing, funding acquisition, supervision. All authors have read and agreed to the published version of the manuscript.

Funding

This research received no external funding.

Data Availability Statement

All the data used to support the findings of this study are in the manuscript.

Conflicts of Interest

The authors declare no conflict of interest.

References

  1. Ekinci, K.; Tosun, İ.; Kumbul, B.S.; Şevik, F.; Sülük, K.; Bıtrak, N.B. Aeration requirement and energy consumption of reactor-composting of rose pomace influenced by C/N ratio. Environ. Monit. Assess. 2020, 192, 1–9. [Google Scholar] [CrossRef] [PubMed]
  2. Tokarski, D.; Šimečková, J.; Kučerík, J.; Kalbitz, K.; Demyan, M.S.; Merbach, I.; Barkusky, D.; Ruehlmann, J.; Siewert, C. Detectability of degradable organic matter in agricultural soils by thermogravimetry. J. Plant Nutr. Soil Sci. 2019, 182, 729–740. [Google Scholar] [CrossRef]
  3. Guo, H.; Gu, J.; Wang, X.; Song, Z.; Qian, X.; Sun, W.; Nasir, M.; Yu, J. Negative effects of oxytetracycline and copper on nitrogen metabolism in an aerobic fermentation system: Characteristics and mechanisms. J. Hazard. Mater. 2021, 403, 123890. [Google Scholar] [CrossRef]
  4. Thomsen, I.K. Recovery of nitrogen from composted and anaerobically stored manure labelled with 15N. Eur. J. Agron. 2001, 15, 31–41. [Google Scholar] [CrossRef]
  5. Cui, X.; Guo, L.; Li, C.; Liu, M.; Wu, G.; Jiang, G. The total biomass nitrogen reservoir and its potential of replacing chemical fertilizers in China. Renew. Sustain. Energy Rev. 2021, 135, 110215. [Google Scholar] [CrossRef]
  6. Manu, D.S.; Thalla, A.K. Artificial intelligence models for predicting the performance of biological wastewater treatment plant in the removal of Kjeldahl Nitrogen from wastewater. Appl. Water Sci. 2017, 7, 1–9. [Google Scholar] [CrossRef]
  7. Piotrowski, R.; Paul, A.; Lewandowski, M. Improving SBR Performance Alongside with Cost Reduction through Optimizing Biological Processes and Dissolved Oxygen Concentration Trajectory. Appl. Sci. 2019, 9, 2268. [Google Scholar] [CrossRef]
  8. Azimirad, V.; Ramezanlou, M.T.; Sotubadi, S.V.; Janabi-Sharifi, F. A consecutive hybrid spiking-convolutional (CHSC) neural controller for sequential decision making in robots. Neurocomputing 2022, 490, 319–336. [Google Scholar] [CrossRef]
  9. Manga, M.; Muoghalu, C.; Camargo-Valero, M.A.; Evans, B.E. Effect of turning frequency on the survival of fecal indicator microorganisms during aerobic composting of fecal sludge with sawdust. Int. J. Environ. Res. Public Health 2023, 20, 2668. [Google Scholar] [CrossRef]
  10. Fan, X.Q.; Chen, R.; Li, W.T.; Wei, Y.Q.; Li, Y.D.; Zhan, Y.B.; Li, J. The effect of ventilation on rapid high-temperature composting and nitrogen conversion of kitchen waste. Environ. Eng. 2022, 40, 71–78. [Google Scholar]
  11. Gu, J.L.; Luo, W.H.; Yuan, J.; Li, G.X.; Liu, L.L.; Zhang, B.X. The effect of ventilation rate on the maturity and pollution gas emissions of chicken manure tobacco powder compost. Southwest Agric. J. 2021, 34, 872–879. [Google Scholar]
  12. Li, S.M.; Dang, Y.Q.; Tang, F.B.; Meng, Y.J. Optimization of evaluation indicators for aerobic composting based on ventilation frequency control. Chin. Soil Fertil. 2020, 57, 182–188. [Google Scholar]
  13. Wang, Y.L.; Qiu, H.Z.; Li, M.C.; Zhang, C.H. Microbial community succession and its response to environmental factors during cow manure composting under different ventilation methods. J. Environ. Sci. 2019, 1–13. [Google Scholar]
  14. Cheng, Y.F.; Han, J.S.; Liu, B.; Li, D. A prediction method for galloping of transmission lines based on improved neural network. Int. J. Mech. Eng. Appl. 2018, 4, 126–133. [Google Scholar] [CrossRef]
  15. Ding, H.; Wang, Z.; Guo, Y.; Yin, X. Research on laser processing technology of instrument panel implicit weakening line based on neural network and genetic algorithm. Optik 2020, 203, 163970. [Google Scholar] [CrossRef]
  16. Zhang, X.; Liao, Z.; Ma, L.; Yao, J. Hierarchical multistrategy genetic algorithm for integrated process planning and scheduling. J. Intell. Manuf. 2022, 33, 223–246. [Google Scholar] [CrossRef]
  17. Semple, K.T.; Reid, B.J.; Fermor, T.R. Impact of composting strategies on the treatment of soils contaminated with organic pollutants. Environ. Pollut. 2001, 112, 269–283. [Google Scholar] [CrossRef]
  18. Paillat, J.M.; Robin, P.; Hassouna, M.; Leterme, P. Predicting ammonia and carbon dioxide emissions from carbon and nitrogen biodegradability during animal waste composting. Atmos. Environ. 2005, 39, 6833–6842. [Google Scholar] [CrossRef]
  19. Tran, H.T.; Lin, C.; Bui, X.T.; Ngo, H.H.; Cheruiyot, N.K.; Hoang, H.G.; Vu, C.T. Aerobic composting remediation of petroleum hydrocarbon-contaminated soil. Current and future perspectives. Sci. Total Environ. 2021, 753, 142250. [Google Scholar] [CrossRef]
  20. Fayaz, M.; Shah, H.; Aseere, A.M.; Mashwani, W.K.; Shah, A.S. A framework for prediction of household energy consumption using feed forward back propagation neural network. Technologies 2019, 7, 30. [Google Scholar] [CrossRef]
  21. Zhu, Q.Y.; Yin, Y.H.; Zhu, H.J.; Zhou, H. Effect of magnitude differences in the original data on price forecasting. J. Algorithms Comput. Technol. 2014, 8, 389–420. [Google Scholar] [CrossRef]
  22. Ismail, F.S.; Bakar, N.A. Adaptive mechanism for GA-NN to enhance prediction model. In Proceedings of the 9th International Conference on Ubiquitous Information Management and Communication, Bali, Indonesia, 8–10 January 2015; pp. 1–5. [Google Scholar]
  23. Liu, R.; Liu, L. Predicting housing price in China based on long short-term memory incorporating modified genetic algorithm. Soft Comput. 2019, 23, 11829–11838. [Google Scholar] [CrossRef]
  24. Zhao, L.; Hu, Y.M.; Zhou, W.; Liu, Z.H.; Pan, Y.C.; Shi, Z.; Wang, L.; Wang, G.X. Estimation methods for soil mercury content using hyperspectral remote sensing. Sustainability 2018, 10, 2474. [Google Scholar] [CrossRef]
  25. De Castro, L.N.; Von Zuben, F.J. Learning and optimization using the clonal selection principle. IEEE Trans. Evol. Comput. 2002, 6, 239–251. [Google Scholar] [CrossRef]
  26. Mohammadi, M.; Raahemi, B.; Akbari, A.; Nassersharif, B.; Moeinzadeh, H. Improving linear discriminant analysis with artificial immune system-based evolutionary algorithms. Inf. Sci. 2012, 189, 219–232. [Google Scholar] [CrossRef]
  27. Yan, J.; Xu, Z.; Yu, Y.; Xu, H.; Gao, K. Application of a hybrid optimized BP network model to estimate water quality parameters of Beihai Lake in Beijing. Appl. Sci. 2019, 9, 1863. [Google Scholar] [CrossRef]
  28. Shen, J. Operation of Precision Aeration System (AVS) in AAO process analysis. Water Purif. Technol. 2016, 35, 73–78. [Google Scholar]
  29. Zhao, Y.R.; Li, Y.; Zhang, F.F. Precision aeration control system (AVS)Application in sewage biochemical treatment systems. Eng. Constr. Des. 2019, 67, 127–128. [Google Scholar]
  30. Jin, W.J.; Yang, P.W.; Cong, B.B.; Li, D.W. Research on energy consumption prediction model for biochemical pool based on neural network. Environ. Eng. 2014, 32, 961–963. [Google Scholar]
  31. Tang, W.; Tao, Y.X.; Hao, Q.W.; Pang, Z.H. Optimization of aeration prediction of BP neural network based on genetic algorithm. Control. Eng. 2022, 29, 1600–1605. [Google Scholar]
  32. Li, Y.X.; Wang, M.J.; Wang, J.S. Maturity parameters and indicators of organic solid waste composting. Environ. Sci. 1999, 24, 99–104. [Google Scholar]
Figure 1. Schematic diagram of aerobic composting experiment unit.
Processes 11 01591 g001
Figure 2. BP neural network structure diagram.
Processes 11 01591 g002
Figure 3. Network training errors corresponding to the number of neurons in different hidden layers.
Processes 11 01591 g003
Figure 4. Prediction model of aerobic composting aeration based on BP neural network.
Processes 11 01591 g004
Figure 5. Changes in number of iterations.
Processes 11 01591 g005
Figure 6. Algorithm flow chart.
Processes 11 01591 g006
Figure 7. Flow chart of BP neural network algorithm optimized by cloning genetic algorithm.
Processes 11 01591 g007
Figure 8. Comparison of the predicted and true values of BP, GA-BP and CGA-BP.
Processes 11 01591 g008
Figure 9. Comparison of BP, GA-BP and CGA-BP errors.
Processes 11 01591 g009
Figure 10. Moisture content change curve.
Processes 11 01591 g010
Figure 11. C/N variation curve.
Processes 11 01591 g011
Figure 12. PH value change curve.
Processes 11 01591 g012
Figure 13. EC value variation curve.
Processes 11 01591 g013
Table 1. Initial physical and chemical parameters of compost raw materials.
MaterialMoisture Content/%C/NpH ValueEC/(μS·cm)
Cow dung57.3418.187.03864
Corn straw5.0849.348.32986
Cow manure + corn straw62.8921.277.64125
Table 2. Network errors corresponding to the number of nodes in different hidden layers.
Hidden Layer NodesNetwork Training ErrorHidden Layer NodesNetwork Training Error
30.0245790100.0020776
40.0167170110.0073227
50.0075307120.0052863
60.0080417130.0010084
70.0040497140.00061092
80.0151270150.0009366
90.0047590
Table 3. Performance of optimization algorithm corresponding to different population sizes.
Population SizeOptimal AccuracyPopulation SizeOptimal Accuracy
100.02013500.017293
200.0082072600.0096451
300.016153700.010597
400.0036939800.010084
Table 4. Algorithm errors corresponding to different numbers of iterations.
IterationsAlgorithm ErrorIterationsAlgorithm Error
100.026475500.0038662
200.0048512600.0090891
300.0036939700.010336
400.0054137800.013127
Table 5. Algorithm errors corresponding to different crossover probabilities.
Crossover ProbabilityAlgorithm ErrorCrossover ProbabilityAlgorithm Error
0.20.01130200.60.0077799
0.30.00839820.70.0082414
0.40.01311700.80.0036939
0.50.01169000.90.0101390
Table 6. Parameter Settings of GA-BP neural network.
Parameter NameParameter ValueParameter NameParameter Value
Network layer numbers3Cloning factor0.6
Input layer numbers6Population size40
Hidden layer numbers14Iterations30
Output layer numbers1Crossover probability0.8
Vector0.1Variation probability0.1
Table 7. Evaluation indexes of BP and GA-BP algorithms.
AlgorithmsMAEMAPEMSE
BP0.1177400.01058400.0282090
GA-BP0.0830170.00739140.0131880
CGA-BP0.0388820.0035060.003373
Disclaimer/Publisher’s Note: The statements, opinions and data contained in all publications are solely those of the individual author(s) and contributor(s) and not of MDPI and/or the editor(s). MDPI and/or the editor(s) disclaim responsibility for any injury to people or property resulting from any ideas, methods, instructions or products referred to in the content.