Article

Modeling and Control of an Air Conditioner Powered by PV Energy and the Grid Using a DC Microgrid

by
Alberto Martinez-Barbosa
1,
Gerardo Guerrero-Ramirez
1,*,
Jorge Calleja-Gjumlich
1,
Esteban Guerrero-Ramirez
2,
Manuel Adam-Medina
1,
Carlos Aguilar-Castillo
1 and
Jesus Aguayo-Alquicira
1
1
Electronics Engineering Department, National Center for Research and Development of Technology, Cuernavaca 62490, Morelos, Mexico
2
Institute of Electronics and Mechatronics, Technological University of the Mixteca, Huajuapan de León 69000, Oaxaca, Mexico
*
Author to whom correspondence should be addressed.
Processes 2023, 11(5), 1547; https://doi.org/10.3390/pr11051547
Submission received: 11 April 2023 / Revised: 12 May 2023 / Accepted: 15 May 2023 / Published: 18 May 2023
(This article belongs to the Special Issue Optimal Design for Renewable Power Systems)

Abstract

:
This paper presents the mathematical modeling and control design procedure of the compressor motor of an air conditioner using the energy from a photovoltaic system combined with the power grid in a DC microgrid. A comprehensive model considers the interconnection of the photovoltaic cells with their associated DC/DC converter, the DC bus, the three-phase squirrel-cage induction motor with its driver, the bidirectional DC/AC converter, the output filter, and the power grid. The state-of-the-art showed that a complete mathematical model of the proposed system is unavailable. Therefore, the mathematical model of the system is compared and validated in simulation with a block diagram in the Matlab/Simulink environment. In addition, several control approaches are used in the whole system to track the maximum power point of the photovoltaic cells, obtain a soft start on the machine, control the velocity using the variable frequency drive, regulate the DC bus voltage, and manage the power flow between the DC bus and the power grid.

1. Introduction

Renewable energies have become integral to everyday appliances that require the most energy from the electricity grid, such as air conditioners [1,2,3]. These devices provide cooling, dehumidification, purification, and cleaning of the environment in an enclosed space. Integrating renewable energy into Heating-Ventilation-Air Conditioning (HVAC) systems provide several benefits. From an environmental point of view, it helps mitigate climate change caused by the dependence on fossil fuels for energy production. From a socially conscious point of view, the end user maintains comfort without needing technical knowledge of renewable energy issues. Finally, from an economic perspective, reducing the power demand on the power grid lowers operational costs.
In this sense, solar energy is the most appropriate because the highest temperatures coincide with the maximum intensity of the sun’s rays. Solar energy has been harnessed in air conditioning applications either by solar collectors as a thermal source [4,5] or by using photovoltaic (PV) cells to cover part or all of the electrical demands of the system [6,7]. Even existing works showed ideas to combine thermal and PV effects in the same device, called the solar-thermal-PV collector [8,9]. Refs. [10,11,12,13,14,15] have performed different techno-economic analyses between different methods of using solar energy in air conditioning, which showed that using only PV energy in these systems proves the most viable. Currently, relatively few works use solar PV energy to power an air conditioner, described below.
In [16,17], PV cells are connected directly to the compressor motor drive, as in water pumping applications. However, these systems require more flexibility and control of variables, such as temperature and humidity, which differs from water pumping. In addition, the available energy is dependent on incident solar radiation, which is ultimately economical but impractical. A solution to the dependency on environmental conditions is combining PV energy with other sources. In this case, a microgrid manages the energy balance among sources and loads. In [18], the authors propose an AC microgrid consisting of PV cells, an inverter, a distribution box, and a control stage. As a result, the energy from the PV cells is transformed from DC to AC to power the air conditioner. However, these devices rectify the power from AC to DC for use in the compressor motor drive, transforming the power back to DC. Therefore, a more efficient way to harness the energy from PV cells is to avoid power rectification using a DC microgrid [19].
In this sense, Refs. [20,21] presents an isolated DC microgrid consisting of the PV cells, the storage stage with its associated converter, the inverter, and the air conditioner. This configuration uses PV energy to cover the increased demand for the air conditioner and the storage stage as an auxiliary power source. The main drawback is that it needs to include that the storage stage also requires energy from the PV cells to charge the batteries, so more than the harvested energy may be required to cover both tasks.
Furthermore, Ref. [22] proposes a DC microgrid for powering the air conditioner with PV energy and the power grid. The microgrid comprises the PV cells, a storage stage, the DC/DC boost converter, the rectifier, the power grid, and the compressor motor. In this system, there is only a unidirectional flow of energy, in this case, from the power grid to the DC bus of the microgrid. Finally, Ref. [23] presents a DC microgrid interconnected to the grid consisting of PV cells, the power grid, and an air conditioner that combines energy sources internally. The disadvantage of this system is that it does not consider that the PV cells are a non-linear energy source and the harvested power depends on environmental conditions, omitting the tracking of the maximum power point.
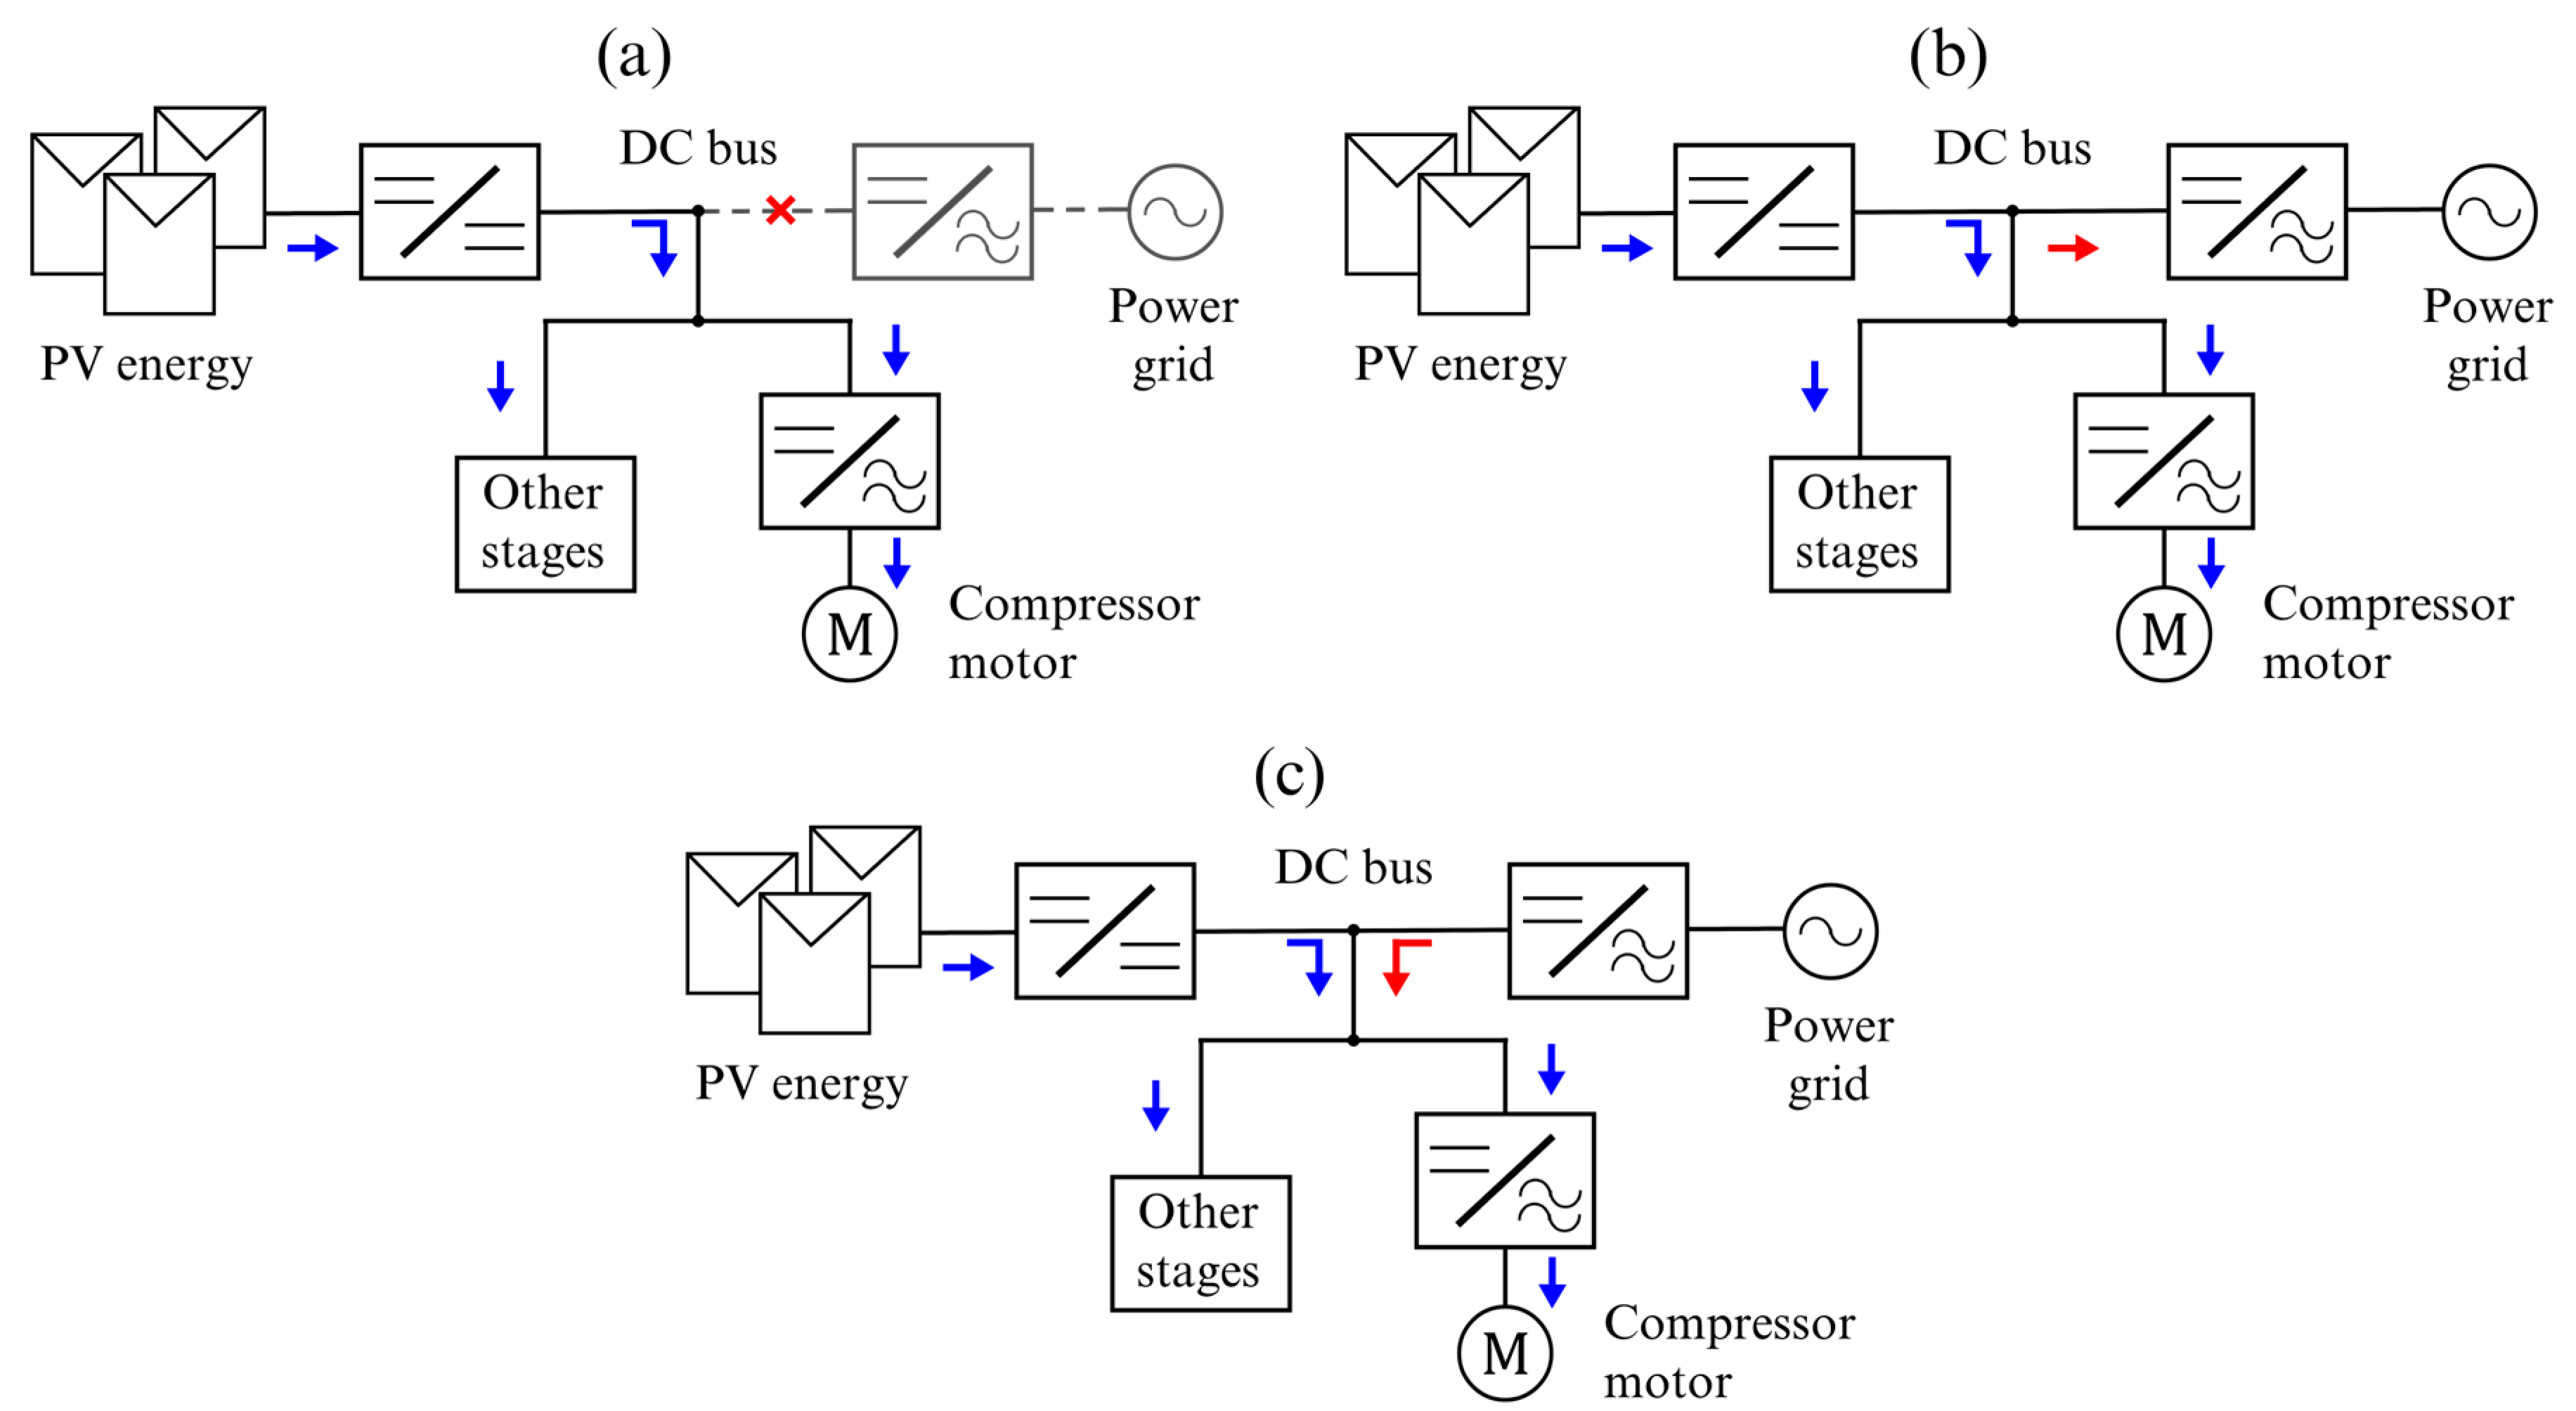
Based on the above, this paper proposes the DC microgrid to power an air conditioner with solar PV energy and the power grid shown in Figure 1. This configuration uses different power electronic converters: the DC/DC converter harvests maximum energy from PV cells. There are two DC/AC converters; one of them drives the compressor motor, while the other converter manages the power flow between the DC bus and the grid. In addition, other stages could optionally connect to the DC bus of the microgrid. The figure also shows three operation modes of the DC microgrid:
  • Operation mode I. In this operation mode, the compressor motor and other stages depend on the environmental conditions because PV energy is the only power source;
  • Operation mode II. The PV energy satisfies the demand of the air conditioner’s compressor motor; therefore, the grid absorbs the surplus energy;
  • Operation mode III. In this case, the PV energy is insufficient to power the loads, requiring the necessary power from the grid.
The state-of-the-art showed that a complete mathematical model of the proposed system is not available because these systems use specialized software tools to carry out the different control tasks. Therefore, the mathematical model stands out because many control approaches often require it to control the system without specific software. In addition, the complexity of the system requires the use of different controllers to accomplish tasks such as tracking the maximum power point of the PV cells, adjusting the velocity of the compressor motor, and supplying power from the grid to the motor when the PV system power is not sufficient, or transferring surplus power from the PV system to the grid if necessary. Therefore, the scientific contributions of this paper are: (i) to obtain and validate the integral mathematical model of the compressor power supply system of an air conditioner powered by solar PV combined with the power grid in a DC microgrid, and (ii) to show the design procedure to adapt the control approaches for the system’s tasks.
One of the advantages of mathematical modeling is that it allows a better detailing of the system’s dynamic behavior, including the interaction between the different stages that comprise it. In addition, the mathematical model of the system enables the use of control theories that require a more specific system model, avoiding non-mathematical models of the devices in particular software. Using these control theories will enhance system performance by improving its dynamic behavior, optimizing the system design, minimizing the value of the components, requiring fewer sensors, estimating signals, and canceling disturbances, among others. However, in this work, only the integral mathematical model of the system is obtained and validated, using sophisticated control approaches for future work. Furthermore, the control design procedure presents how the control approaches suit the system. In this case, control approaches are taken from the literature for the different tasks. Therefore, there is information to adapt the particularities of the control approaches for the proposed system.
The rest of the paper is organized as follows: the second Section shows the integral mathematical modeling of the proposed system; the third Section presents the control approaches and the design procedure used for the different system tasks; Section 4 presents the validation of the obtained mathematical model using the Matlab/Simulink R2020b environment. Finally, Section 5 presents the general conclusions and future work to be developed based on this proposal.

2. Modeling of the Air Conditioner Powered by PV Energy and the Power Grid

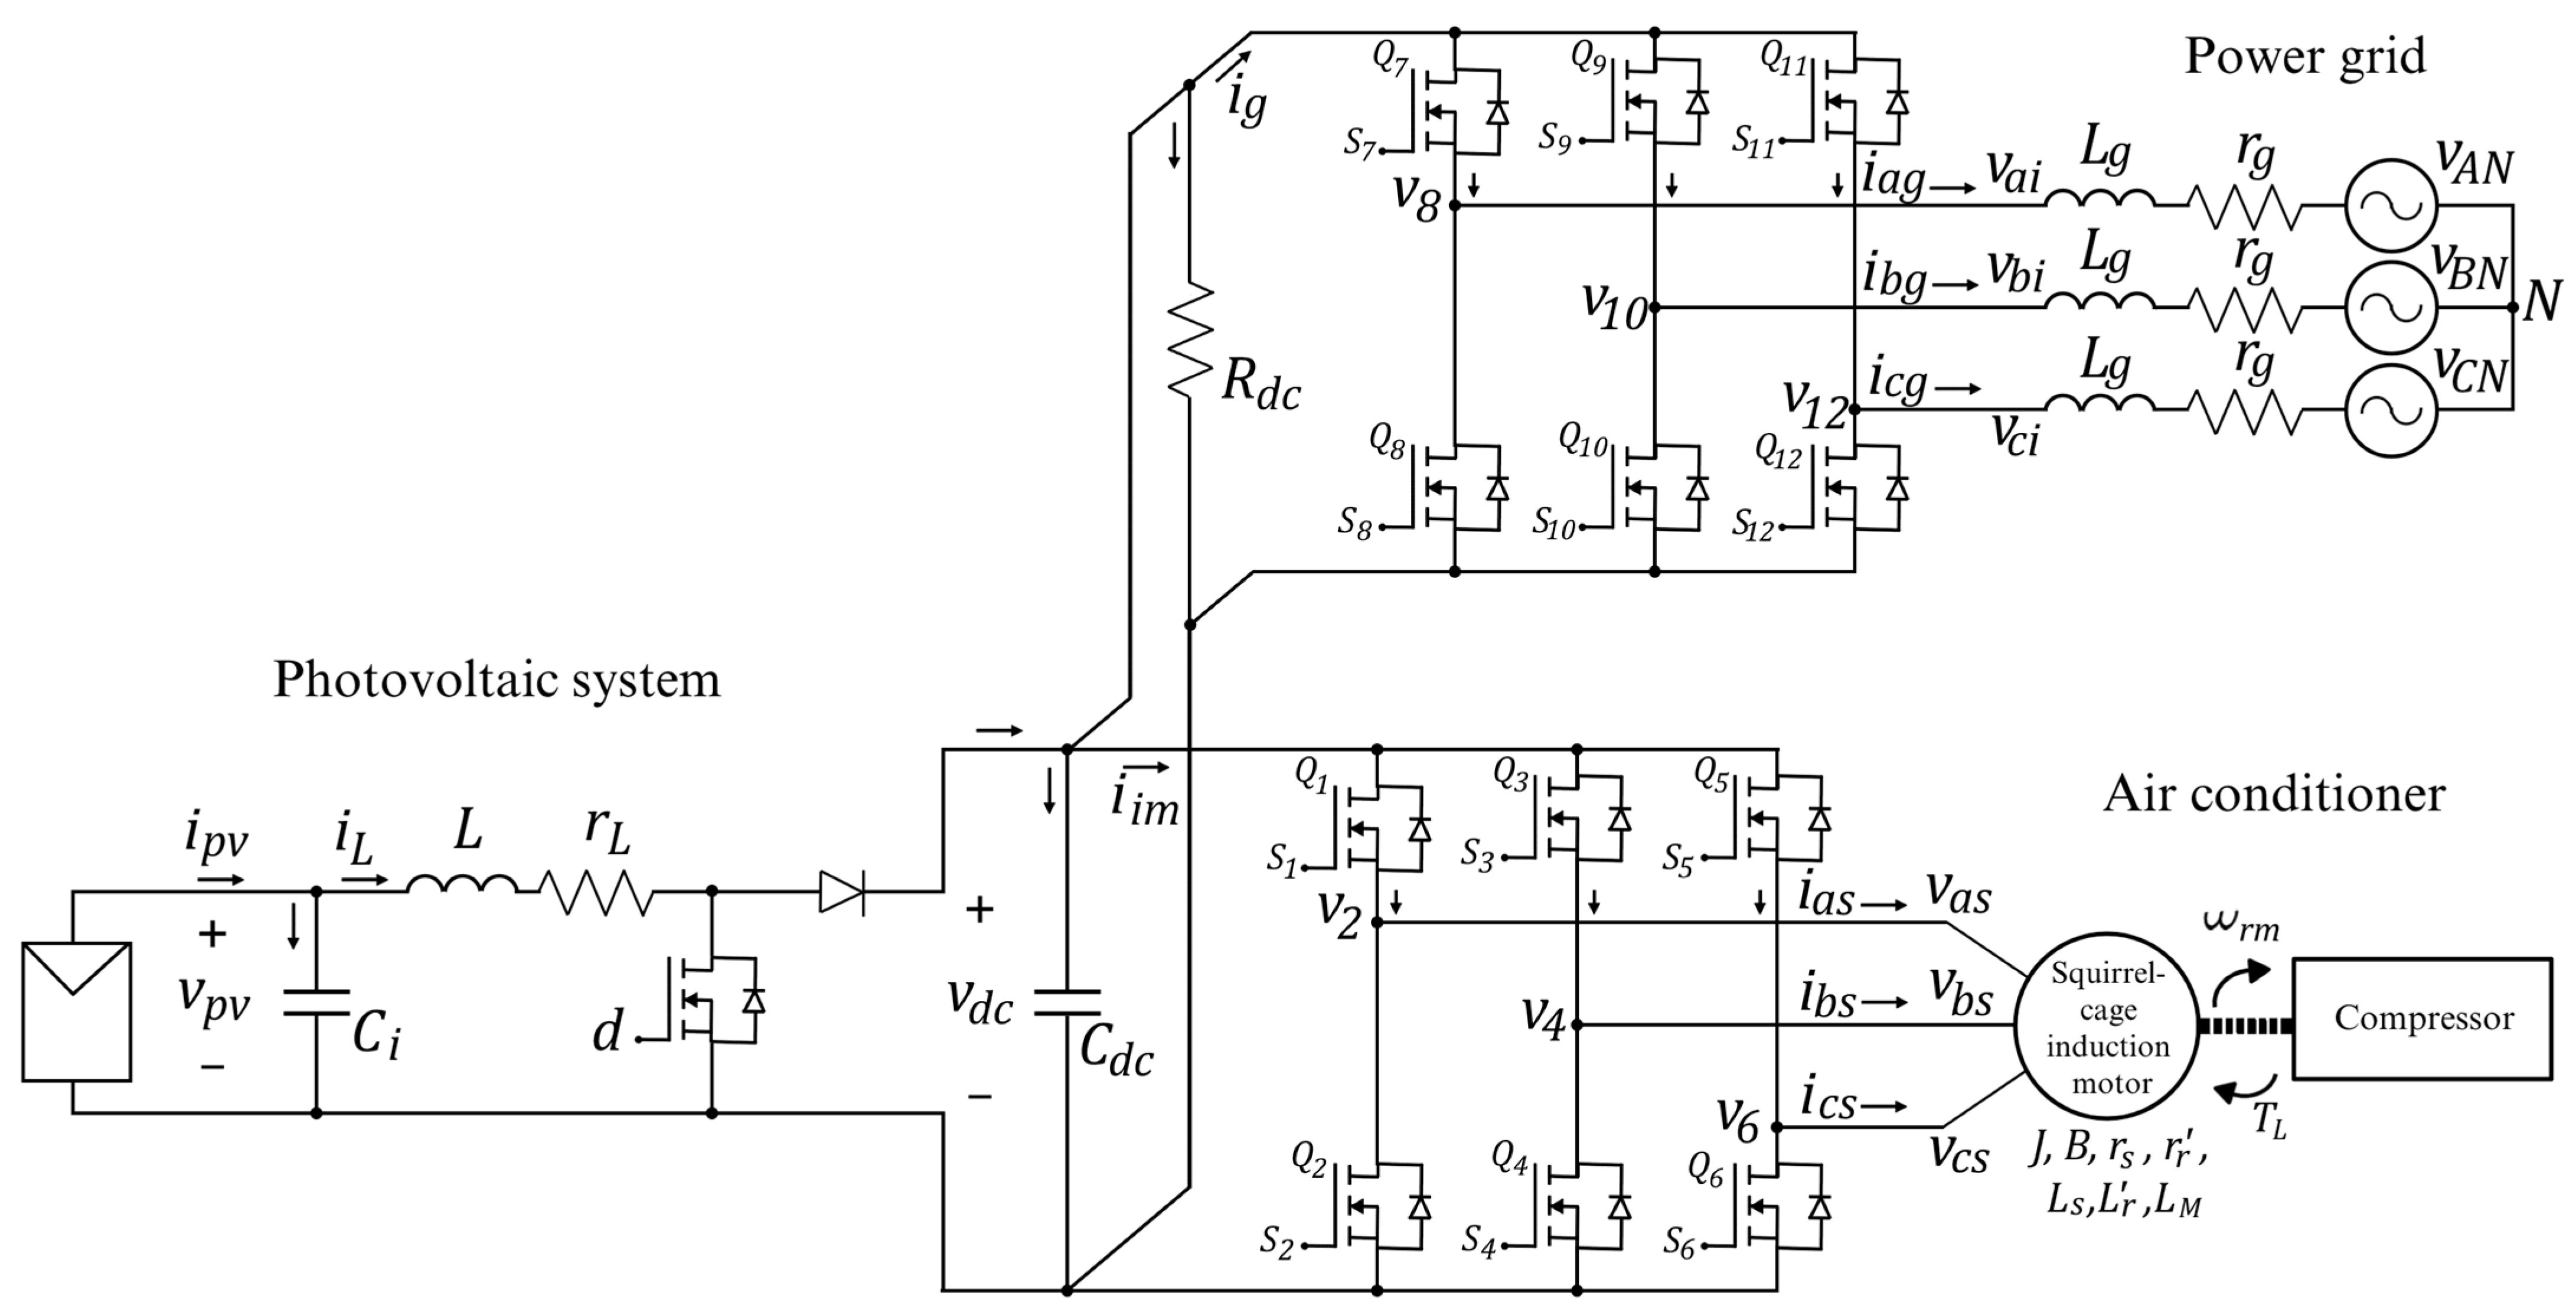
Figure 2 shows the proposed system consisting of the PV cells, the DC/DC boost converter, the DC bus with other stages considered as a load, a three-phase voltage source inverter as the motor drive, the three-phase squirrel cage induction motor, a three-phase DC/AC converter as the linkage converter, the inductive output filter, and the power grid. The modeling of this system requires the following considerations and restrictions:
  • The DC/DC boost converter operates in the continuous conduction mode;
  • The switches open/close immediately after their control signal is activated and no conduction losses in the semiconductors are considered;
  • The three-phase squirrel cage induction motor operates in the linear magnetic flux region, the stator windings are in a wye connection, and it is a balanced system;
  • The power grid is a balanced three-phase system.
First, the connection of the PV cells, the DC/DC boost converter, and the DC bus is analyzed, where d [ 0 ,   1 ] is the duty cycle of the converter; v p v is the voltage of the PV cells and the capacitor C i ; i p v is the current of the PV cells; i L is the current of the inductor L and its parasitic resistance r L of the converter; v d c is the voltage of the capacitor C d c and the DC bus; R d c represents other stages interconnecting in the DC bus. Applying Kirchhoff’s laws of voltage and current results in (1)–(3), where the values of C i , L , y, C d c are design parameters; the current i p v and the control signal d are input variables; R d c depends on the other stages interconnected to the DC bus, but the value is considered known; and i i m and i g currents are directed to the induction motor drive and the linkage converter, respectively. These variables are currently unknown, so they will be determined below by analyzing their interaction with the system.
d v p v d t = 1 C i i p v i L
d i L d t = 1 L v p v r L i L 1 d v d c
d v d c d t = 1 C d c 1 d i L 1 R d c v d c i i m i g
The motor drive is a three-phase voltage source inverter comprised of three branches and six switches, { Q 1 , Q 3 , Q 5 } at the top and { Q 2 , Q 4 , Q 6 } at the bottom. The switching functions { S 1 , , S 6 } { 0 ,   1 } control the switching on and off. The voltages { v a s , v b s , v c s } of each branch of the motor drive connect directly to the stator winding of the induction motor. In addition, the current i i m from (1) is expressed in terms of the currents of the switches Q 1 , Q 3 , and Q 5 as in (4).
i i m = i Q 1 + i Q 3 + i Q 5
Furthermore, the expressions of the stator phase-to-phase voltages are:
v a b s = v 2 v 4
v b c s = v 4 v 6
v c a s = v 6 v 2
Table 1, Table 2 and Table 3 show the currents and voltages of the drive branches according to the switching functions S 1 to S 6 [24]. As a result, (8)–(13) show the circuit switches’ behavior of currents and voltages obtained from the tables.
i Q 1 = S 1 i a s
v 2 = S 1 v d c
i Q 3 = S 3 i b s
v 4 = S 3 v d c
i Q 5 = S 5 i c s
v 6 = S 5 v d c
Substituting (8), (10), and (12) in (4) gives the current i i m in terms of the switching functions and the stator currents in (14).
i i m = S 1 i a s + S 3 i b s + S 5 i c s
In addition, (9), (11), and (13) are substituted into (5)–(7) to obtain the stator phase-to-phase voltages in terms of the switching functions and the DC bus voltage in (15)–(17).
v a b s = S 1 v d c S 3 v d c
v b c s = S 3 v d c S 5 v d c
v c a s = S 5 v d c S 1 v d c
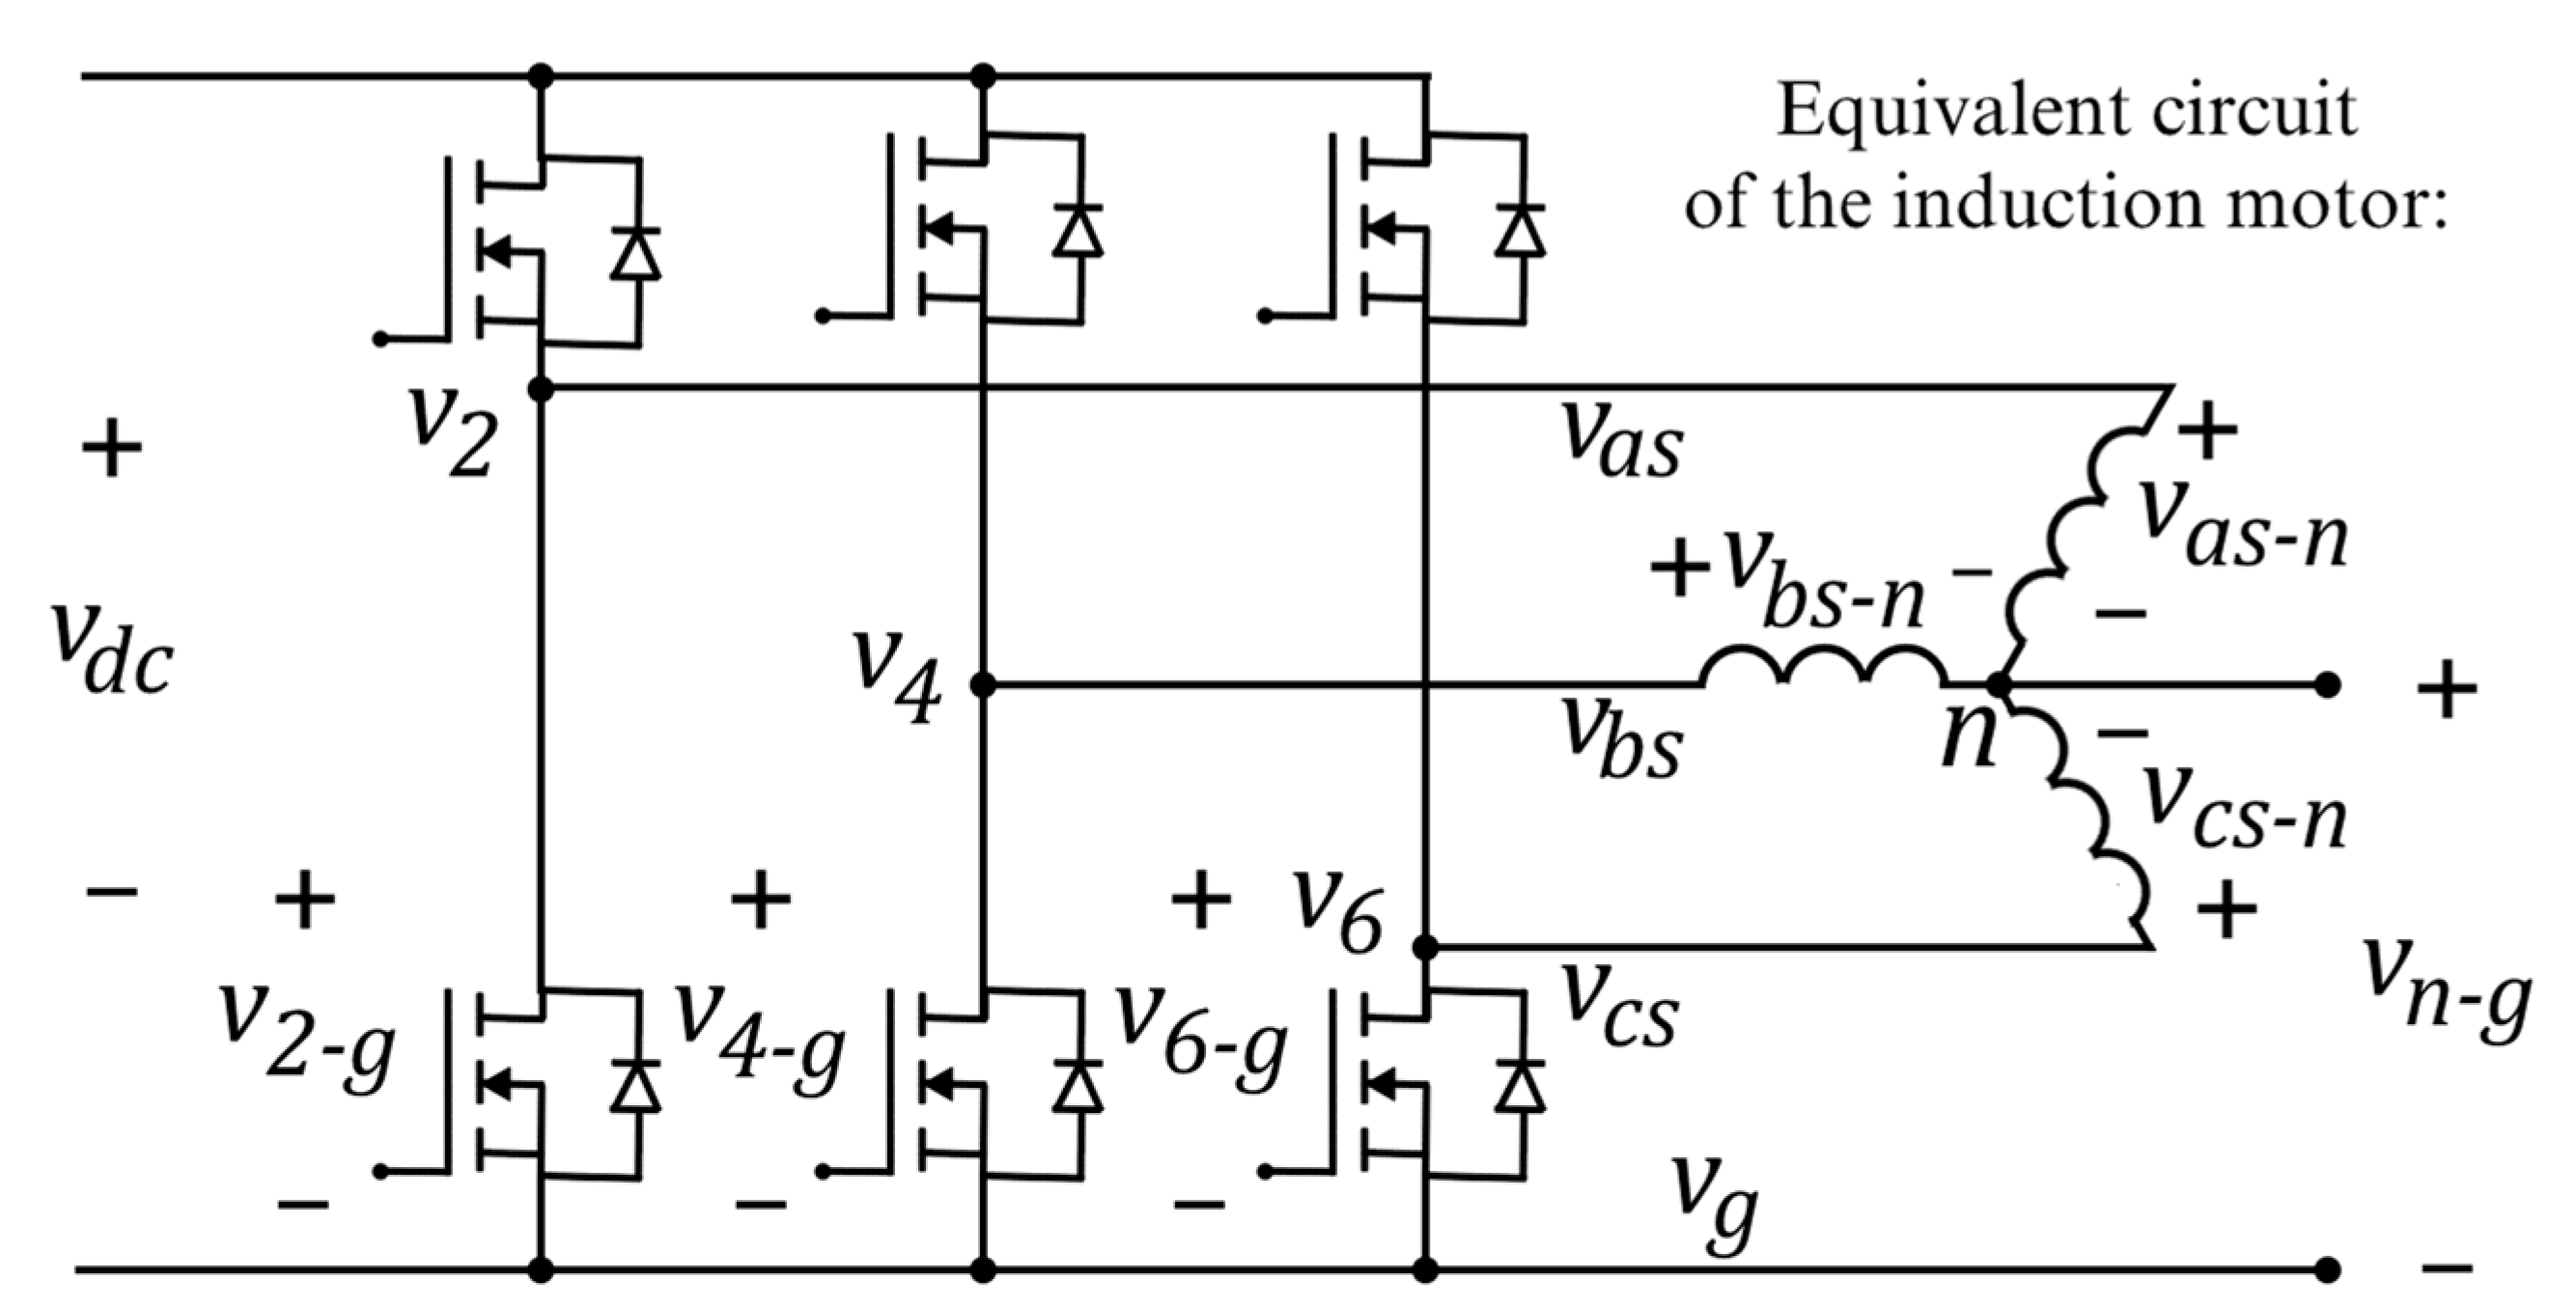
The induction motor is internally wye-connected with a neutral n, as shown in Figure 3. Therefore, the phase-to-ground, phase-to-neutral, and neutral-to-ground voltages have the relationship shown in (18)–(20), where v 2 g , v 4 g , v 6 g are the phase-to-ground voltages; v a s n , v b s n , v c s n are the phase-to-neutral voltages; v n g is the neutral-to-ground voltage.
v 2 g = v a s n + v n g
v 4 g = v b s n + v n g
v 6 g = v c s n + v n g
Now, adding the three terms and solving for v n g , the expression in (21) is obtained, considering that v a s n + v b s n + v c s n = 0 because it is a symmetric machine.
v n g = 1 3 v 2 g + v 4 g + v 6 g
Then, (21) is substituted into (18)–(20) and solved for the stator voltages.
v a s = 2 3 v 2 1 3 v 4 1 3 v 6
v b s = 1 3 v 2 + 2 3 v 4 1 3 v 6
v c s = 1 3 v 2 1 3 v 4 + 2 3 v 6
The stator voltages are expressed in (25) regarding the switching functions and the DC bus voltage by substituting (9), (11), and (13) into (22)–(24).
v a s v b s v c s = v d c 3 2 1 1 1 2 1 1 1 2 S 1 S 3 S 5
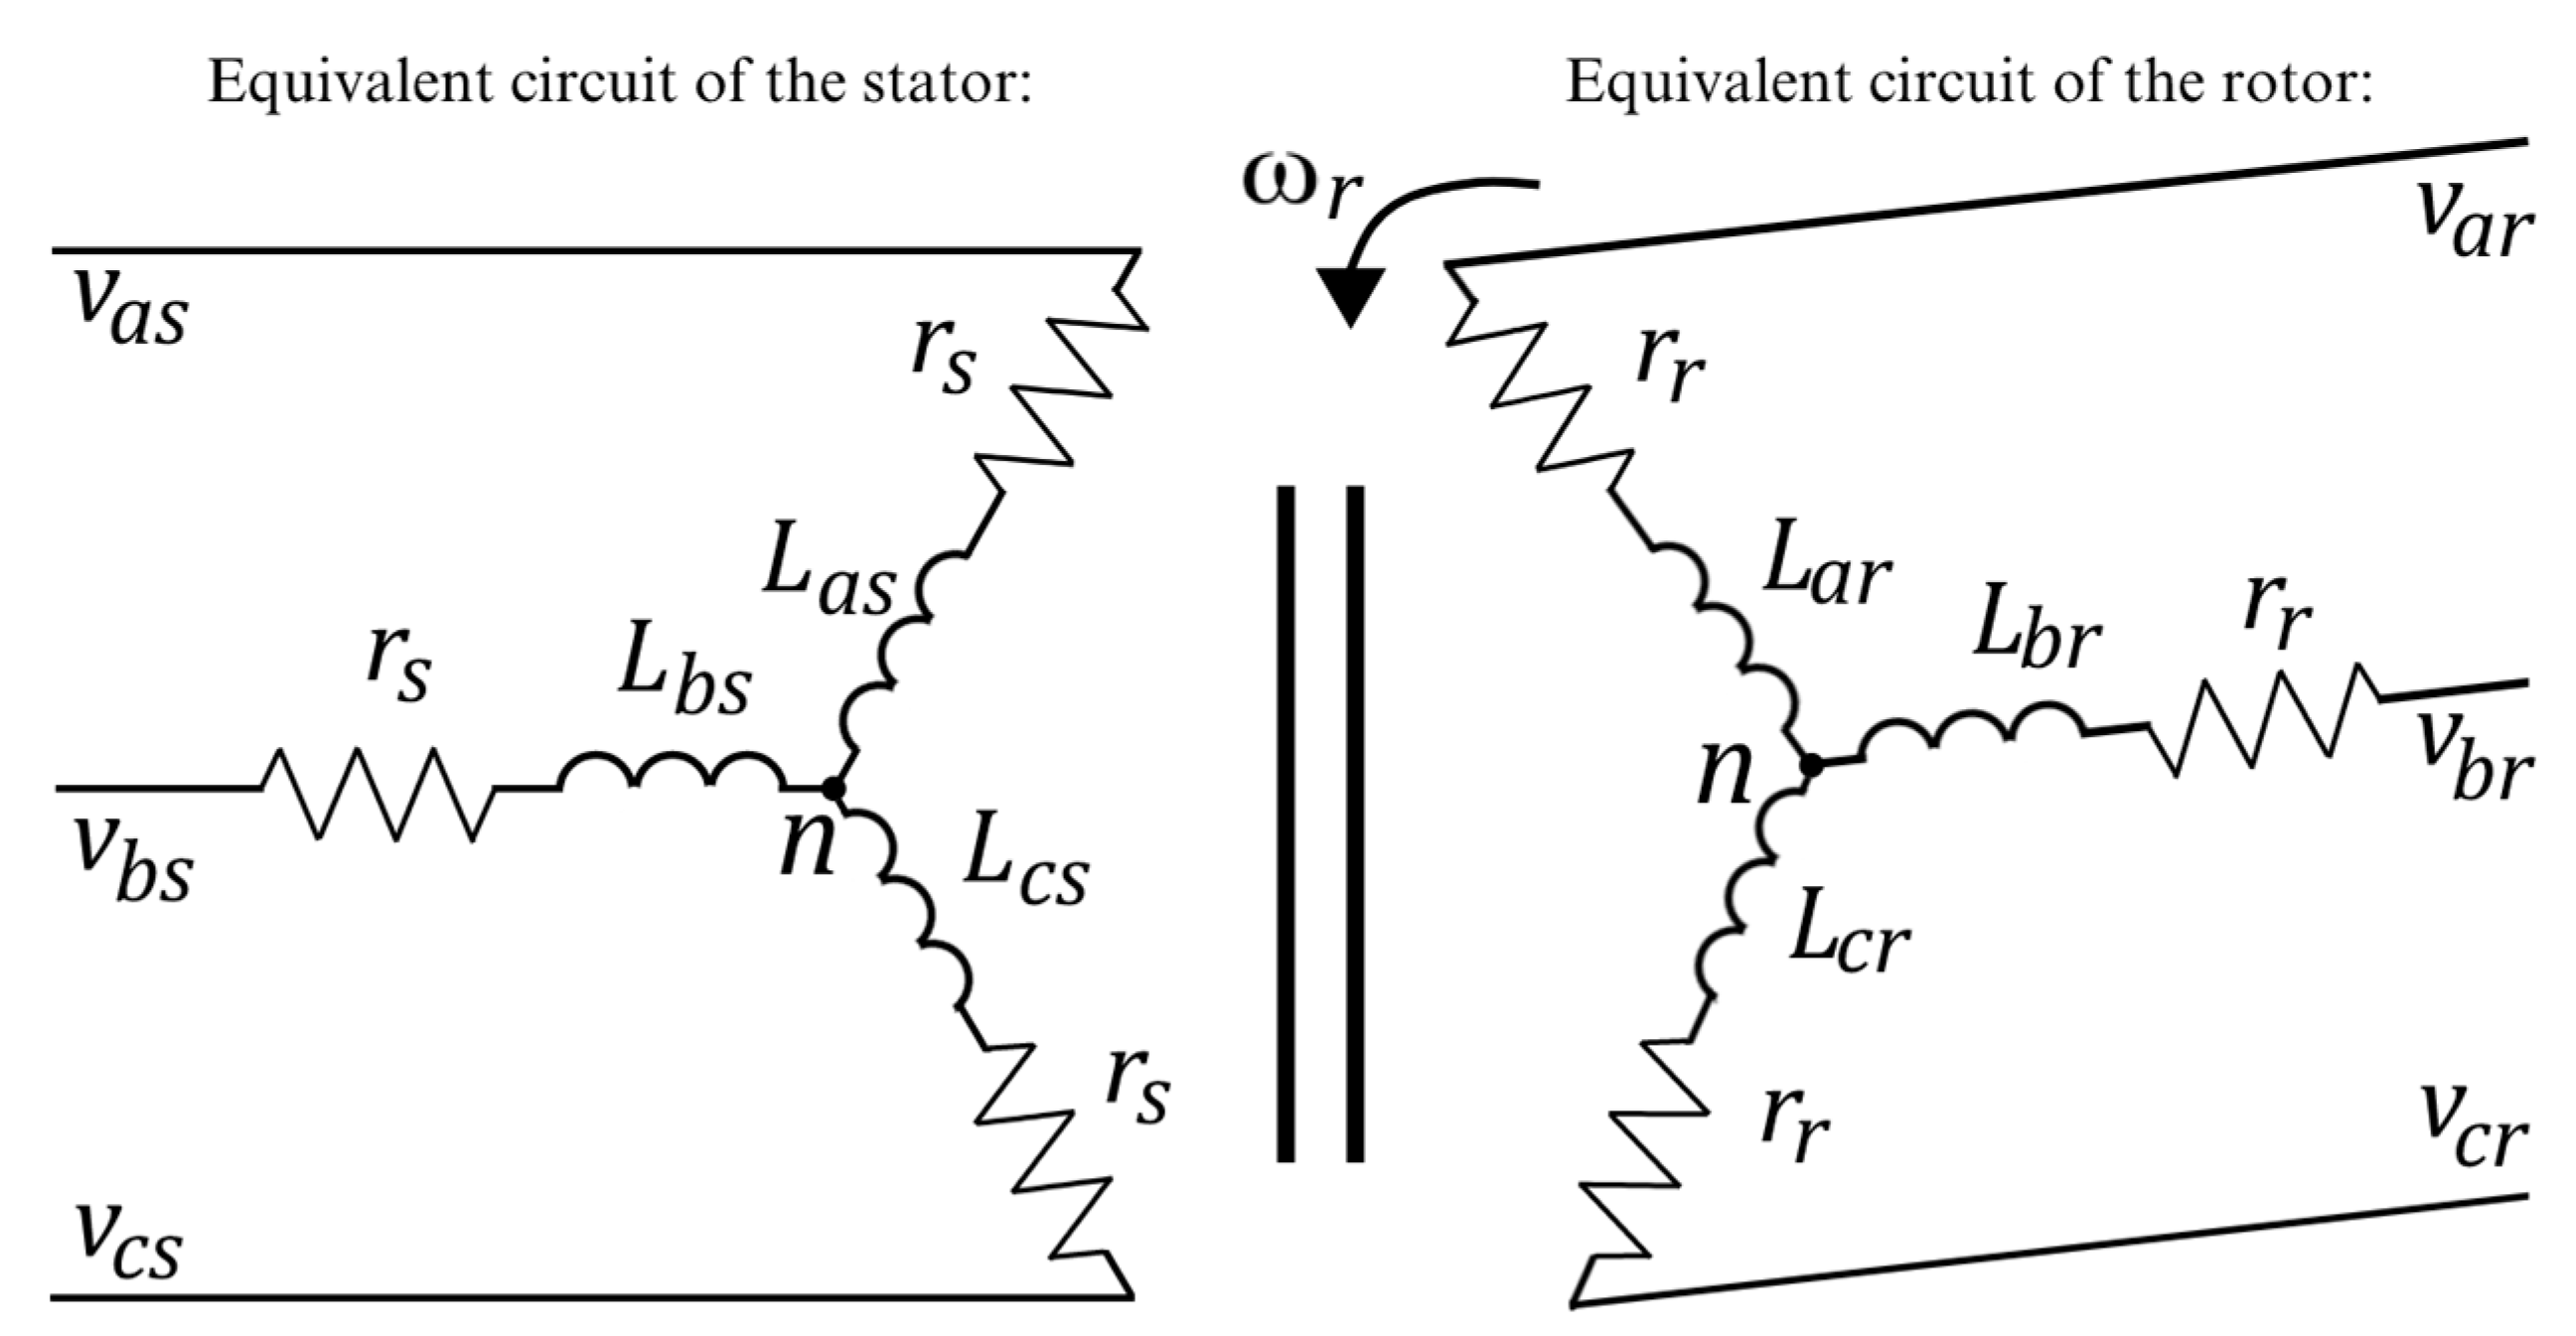
Figure 4 shows the equivalent diagram of the stator and rotor of the induction motor, where the rotor rotates at a specific electrical velocity ω r . From this Figure, using Kirchhoff’s Laws results in the expressions of (26) and (27).
v a b c s = r s i a b c s + d d t λ a b c s
v a b c r = r r i a b c r + d d t λ a b c r
where v a b c s = v a s v b s v c s T , i a b c s = i a s i b s i c s T and λ a b c s = λ a s λ b s λ c s T are the vectors of voltages, currents and flux linkages of the stator winding. v a b c r = v a r v b r v c r T , i a b c r = i a r i b r i c r T , and λ a b c r = λ a r λ b r λ c r T are the vectors of voltages, currents and flux linkages of the rotor winding referred to the stator. r s and r r are diagonal resistive matrixes of the stator and rotor reflected in the stator, respectively. The resistive matrixes have the same resistance value, r s and r r Because it is considered a symmetrical machine. Furthermore, the flux linkages are expressed in terms of the currents in (28).
λ a b c s λ a b c r = L s L s r L s r T L r i a b c s i a b c r
where:
L s = L l s + L m s 1 2 L m s 1 2 L m s 1 2 L m s L l s + L m s 1 2 L m s 1 2 L m s 1 2 L m s L l s + L m s is the stator inductance matrix, L r = L l r + L m s 1 2 L m s 1 2 L m s 1 2 L m s L l r + L m s 1 2 L m s 1 2 L m s 1 2 L m s L l r + L m s is the rotor inductance matrix reflected in the stator, and L s r = L m s c o s θ r c o s θ r + 2 3 π c o s θ r 2 3 π c o s θ r 2 3 π c o s θ r c o s θ r + 2 3 π c o s θ r + 2 3 π c o s θ r 2 3 π c o s θ r is the mutual inductance matrix reflected in the stator, where L l s and L m s are the stator leakage and magnetization inductances, and L l r the rotor leakage inductance reflected in the stator. The value of the matrix L s r varies by the relative motion between the rotor and the stator; therefore, its values vary according to the electric angular displacement of the rotor θ r , related in (29) to the electric angular velocity of the rotor ω r [25].
ω r = d θ r d t
As a result, (26) and (27) are expressed as:
v a b c s v a b c r = r s 0 3 x 3 0 3 x 3 r r i a b c s i a b c r + d d t L s L s r L s r T L r i a b c s i a b c r + L s L s r L s r T L r d d t i a b c s i a b c r
Equations (31) and (32) show the relationships between positions and velocities in the rotor, where θ r and θ r m are the electrical and mechanical angular positions of the rotor, ω r , and ω r m are the electrical and mechanical angular velocities of the rotor, and n p is the number of pole pairs of the machine. The resulting mathematical electrical model of the induction motor is shown in (33).
θ r = n p θ r m
ω r = n p ω r m
L s L s r L s r T L r d d t i a b c s i a b c r = v a b c s v a b c r r s 0 3 x 3 0 3 x 3 r r i a b c s i a b c r n p ω r m 0 3 x 3 d d θ r L s r d d θ r L s r T 0 3 x 3 i a b c s i a b c r
In (34)–(36), the mechanical relationships of the machine are shown, where J and B are the coefficients of inertia and viscous friction, respectively, and τ L is the external load torque applied to the motor shaft.
T e = n p i a b c s T d d θ r L s r i a b c r
ω r m = d d t θ r m
d d t ω r m = 1 J T e B J ω r m 1 J τ L
The electrical model in (33) is in an a b c framework. However, the q d 0 framework is generally preferred because it facilitates control tasks. Hence, the transformation matrices (37) and (38) are used for the stator and rotor, respectively.
K s = 2 3 c o s θ c o s θ 2 3 π c o s θ + 2 3 π s e n θ s e n θ 2 3 π s e n θ + 2 3 π 1 2 1 2 1 2
K r = 2 3 c o s β c o s β 2 3 π c o s β + 2 3 π s e n β s e n β 2 3 π s e n β + 2 3 π 1 2 1 2 1 2
with:
β = θ θ r
The reference framework change uses the Park transformation to transform a three-phase signal a b c to a two-phase orthogonal rotating reference frame q d 0 . In this case, θ and β are the transformation angles, with the difference that β also considers the rotor motion θ r . The transformation angles have arbitrary values depending on the transformation purposes and control objectives. For example, the stationary reference framework aligns the a b c framework’s phase a axis with the phase q axis of the q d 0 framework. It is worth mentioning that it is more convenient to mention reference frame rotation speeds instead of angles in the reference framework change. In this case, the reference frame rotation speed is given by (40).
ω = d θ d t
As a result, Equations (41) and (42) transform the a b c framework into the q d 0 reference frame.
f q d 0 s = K s f a b c s
f q d 0 r = K r f a b c r
where f q d 0 s = f q s f d s f 0 s T and f a b c s = f a s f b s f c s T are the vectors representing f as any voltage, current, or flux linkage of the stator. f q d 0 r = f q r f d r f 0 r T and f a b c r = f a r f b r f c r T are the vectors representing f as any voltage, current, or flux linkage of the rotor referenced to the stator. As a result, expression (43) shows the mathematical model of the three-phase induction motor in the q d 0 reference frame.
K s L s K s 1 K s L s r K r 1 K r L s r T K s 1 K r L r K r 1 d d t i q d 0 s i q d 0 r = v q d 0 s v q d 0 r r s 0 3 x 3 0 3 x 3 r r i q d 0 s i q d 0 r + ω 0 1 0 1 0 0 0 0 0 0 3 x 3 0 3 x 3 ( ω ω r ) 0 1 0 1 0 0 0 0 0 K s L s K s 1 K s L s r K r 1 K r L s r T K s 1 K r L r K r 1 i q d 0 s i q d 0 r
The a b c to q d 0 transformation does not affect the mechanical equations; therefore, (35) and (36) remain unchanged. However, the electromagnetic torque is affected by its electrical part. Consequently, Equation (44) shows the electromagnetic torque in the q d 0 reference frame, where L M is the mutual inductance defined in (45).
T e = 3 2 n p L M i q s i d r i d s i q r
L M = 3 2 L m s
Therefore, if the stator voltages and the external load torque τ L are known, the mechanical angular velocity ω r m , the electromagnetic torque T e , and the stator and rotor currents are determined. The above implies that the motor currents from (14) and the current i i m from (3) are now known. However, the linkage converter’s current i g has not yet been determined.
The linkage converter has six switches { Q 7 , , Q 12 } controlled by switching functions { S 7 , , S 12 } { 0 ,   1 } . In this case, the voltages between each branch are v a i ,   v b i , v c i , and their output currents are also the grid currents i a g ,   i b g , i c g . The current i g is expressed in terms of the currents of switches Q 7 , Q 9 , and Q 11 as:
i g = i Q 7 + i Q 9 + i Q 11
While the expressions of the phase-to-phase linkage voltages are:
v a b i = v 8 v 10
v b c i = v 10 v 12
v c a i = v 12 v 8
Table 4, Table 5 and Table 6 show the behavior of the switch currents and voltages regarding the switching functions { S 7 , , S 12 } [24]. Based on the tables, Equations (50)–(55) show the switch behavior as a function of the grid currents and the DC bus voltage.
i Q 7 = S 7 i a g
v 8 = S 7 v d c
i Q 9 = S 9 i b g
v 10 = S 10 v d c
i Q 11 = S 11 i c g
v 12 = S 11 v d c
Equations (50), (52) and (54) are now substituted into (46) to express the current i g in terms of the switching functions and the grid currents.
i g = S 7 i a g + S 9 i b g + S 11 i c g
The branch voltages of the linkage converter are obtained in (57)–(59) by substituting Equations (51), (53) and (55) into (37)–(39).
v a b i = S 7 v d c S 9 v d c
v b c i = S 9 v d c S 11 v d c
v c a i = S 11 v d c S 7 v d c
While the phase voltages are expressed in (60), considering a symmetrical and balanced power grid configuration.
v a i v b i v c i = v d c 3 2 1 1 1 2 1 1 1 2 S 7 S 9 S 11
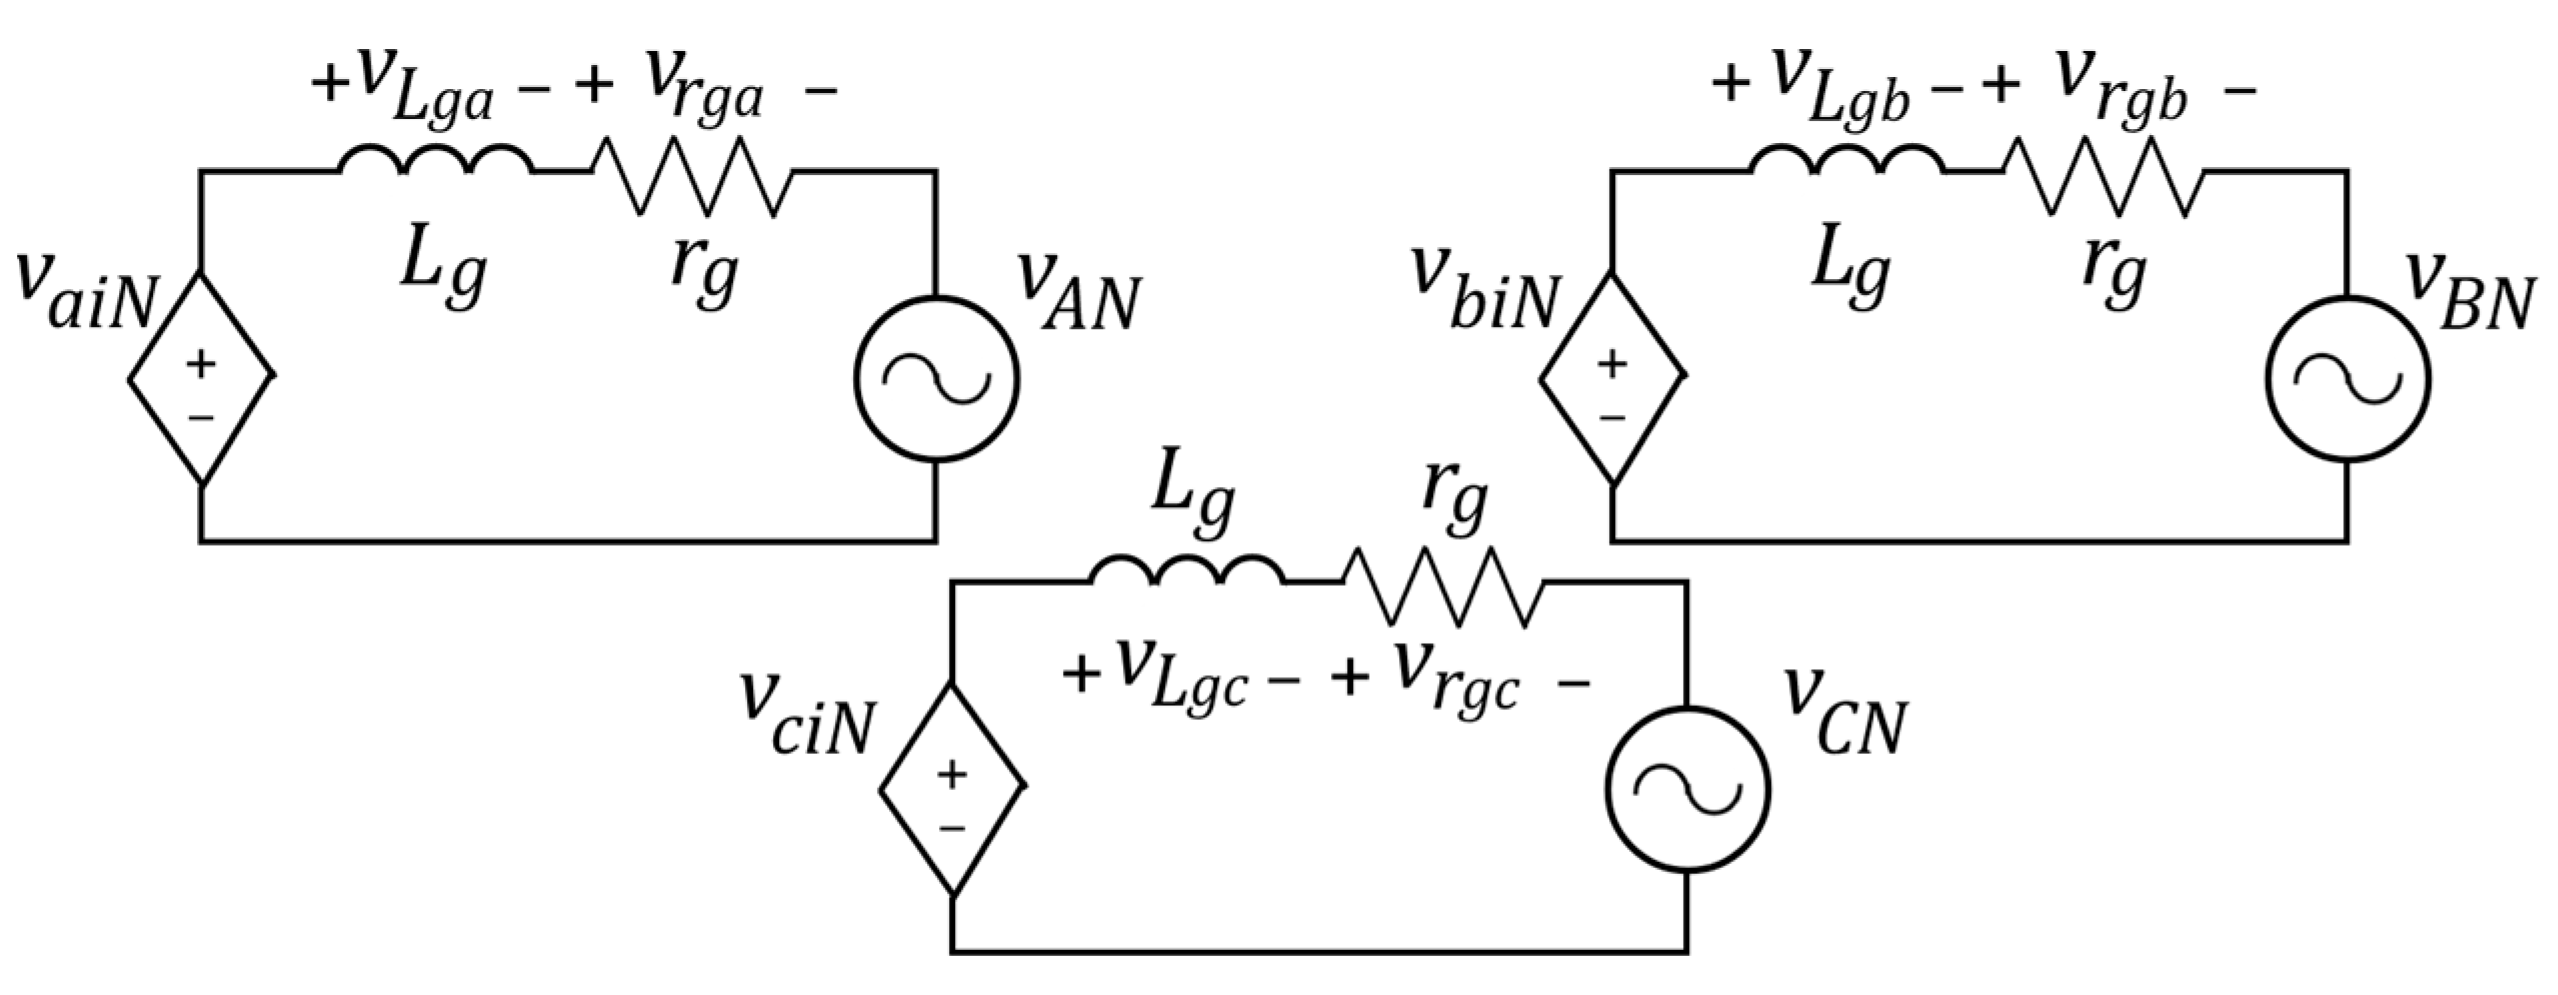
In the same way, the dynamics of the grid currents are obtained from Figure 5 and shown in (61)–(63).
d i a g d t = 1 L g v a i r g i a g v A N
d i b g d t = 1 L g v b i r g i b g v B N
d i c g d t = 1 L g v c i r g i c g v C N
The development of this section allowed obtaining the mathematical model of the proposed system in Figure 2. As a summary, Figure 6 shows the interaction between the model equations where:
  • The required inputs are the PV cells current i p v , the duty cycle of the DC/DC boost converter d , the drive switching functions { S 1 , S 3 , S 5 } , the reference frame rotation speed ω , the applied load torque τ L , the linkage converter switching functions { S 7 , S 9 , S 11 } , the grid angle θ g and its voltages v A N , v B N , and v C N ;
  • The outputs are the PV cell’s voltage v p v , the inductor’s current i L , the DC bus voltage v d c , the stator voltages, the stator and rotor currents in the a b c and q d 0 frameworks, the electromagnetic torque T e , the mechanical angular velocity ω r m , the electric rotor position θ r , the linkage voltages { v a i , v b i , v c i } , and the grid currents in the frameworks a b c and q d 0 .
The established mathematical model of the system in this section will be validated through simulations in the Matlab/Simulink environment. However, defining the control approaches to control the system adequately is necessary.
3. Control Approaches Used in the System

3.1. Maximum Power Point Tracking

PV cells are non-linear energy sources that depend on environmental conditions. PV cells have a maximum power point (MPP) to maximize solar energy conversion into electrical energy. The MPP involves maximum energy harvesting; therefore, finding this point through Maximum Power Point Tracking (MPPT) techniques is essential [26]. This paper proposes two techniques for this system: the Perturb and Observe (P&O) algorithm and the Particle Swarm Optimization (PSO) approach.

3.1.1. The Perturb and Observe Algorithm

The Perturb and Observe algorithm is the most popular MPP technique due to its easy operation. The operating principle of the P&O algorithm is based on the PV cells’ real-time voltage and current measurement to calculate the power and compare iteratively with its previous value. Based on this comparison, the converter’s duty cycle is modified to track the MPP according to the higher power [27,28]. Figure 7 shows the flowchart of the P&O algorithm for the DC/DC boost converter, where P is the PV cell’s power difference between the actual sample P p v [k] and the previous sample P p v [k − 1], V is the PV cells voltage difference between V p v [k] and the previous sample V p v [k − 1], d is the duty cycle of the DC/DC boost converter, and D is the perturbation to the duty cycle.

3.1.2. Particle Swarm Optimization

The objective function for MPPT in Particle Swarm Optimization is a global maximization P p v : R R [29,30], such that:
P p v d * P p v d ,   d S
where P p v d * is the global maximum corresponding to the MPP, d is the average duty cycle of the power electronic converter associated with the PV system, d * is the global maximizing duty cycle to obtain the MPP, S is the search space defined as S = { d R : d m i n d d m a x } , where d m i n and d m a x are the minimum and maximum duty cycles allowed in the converter.
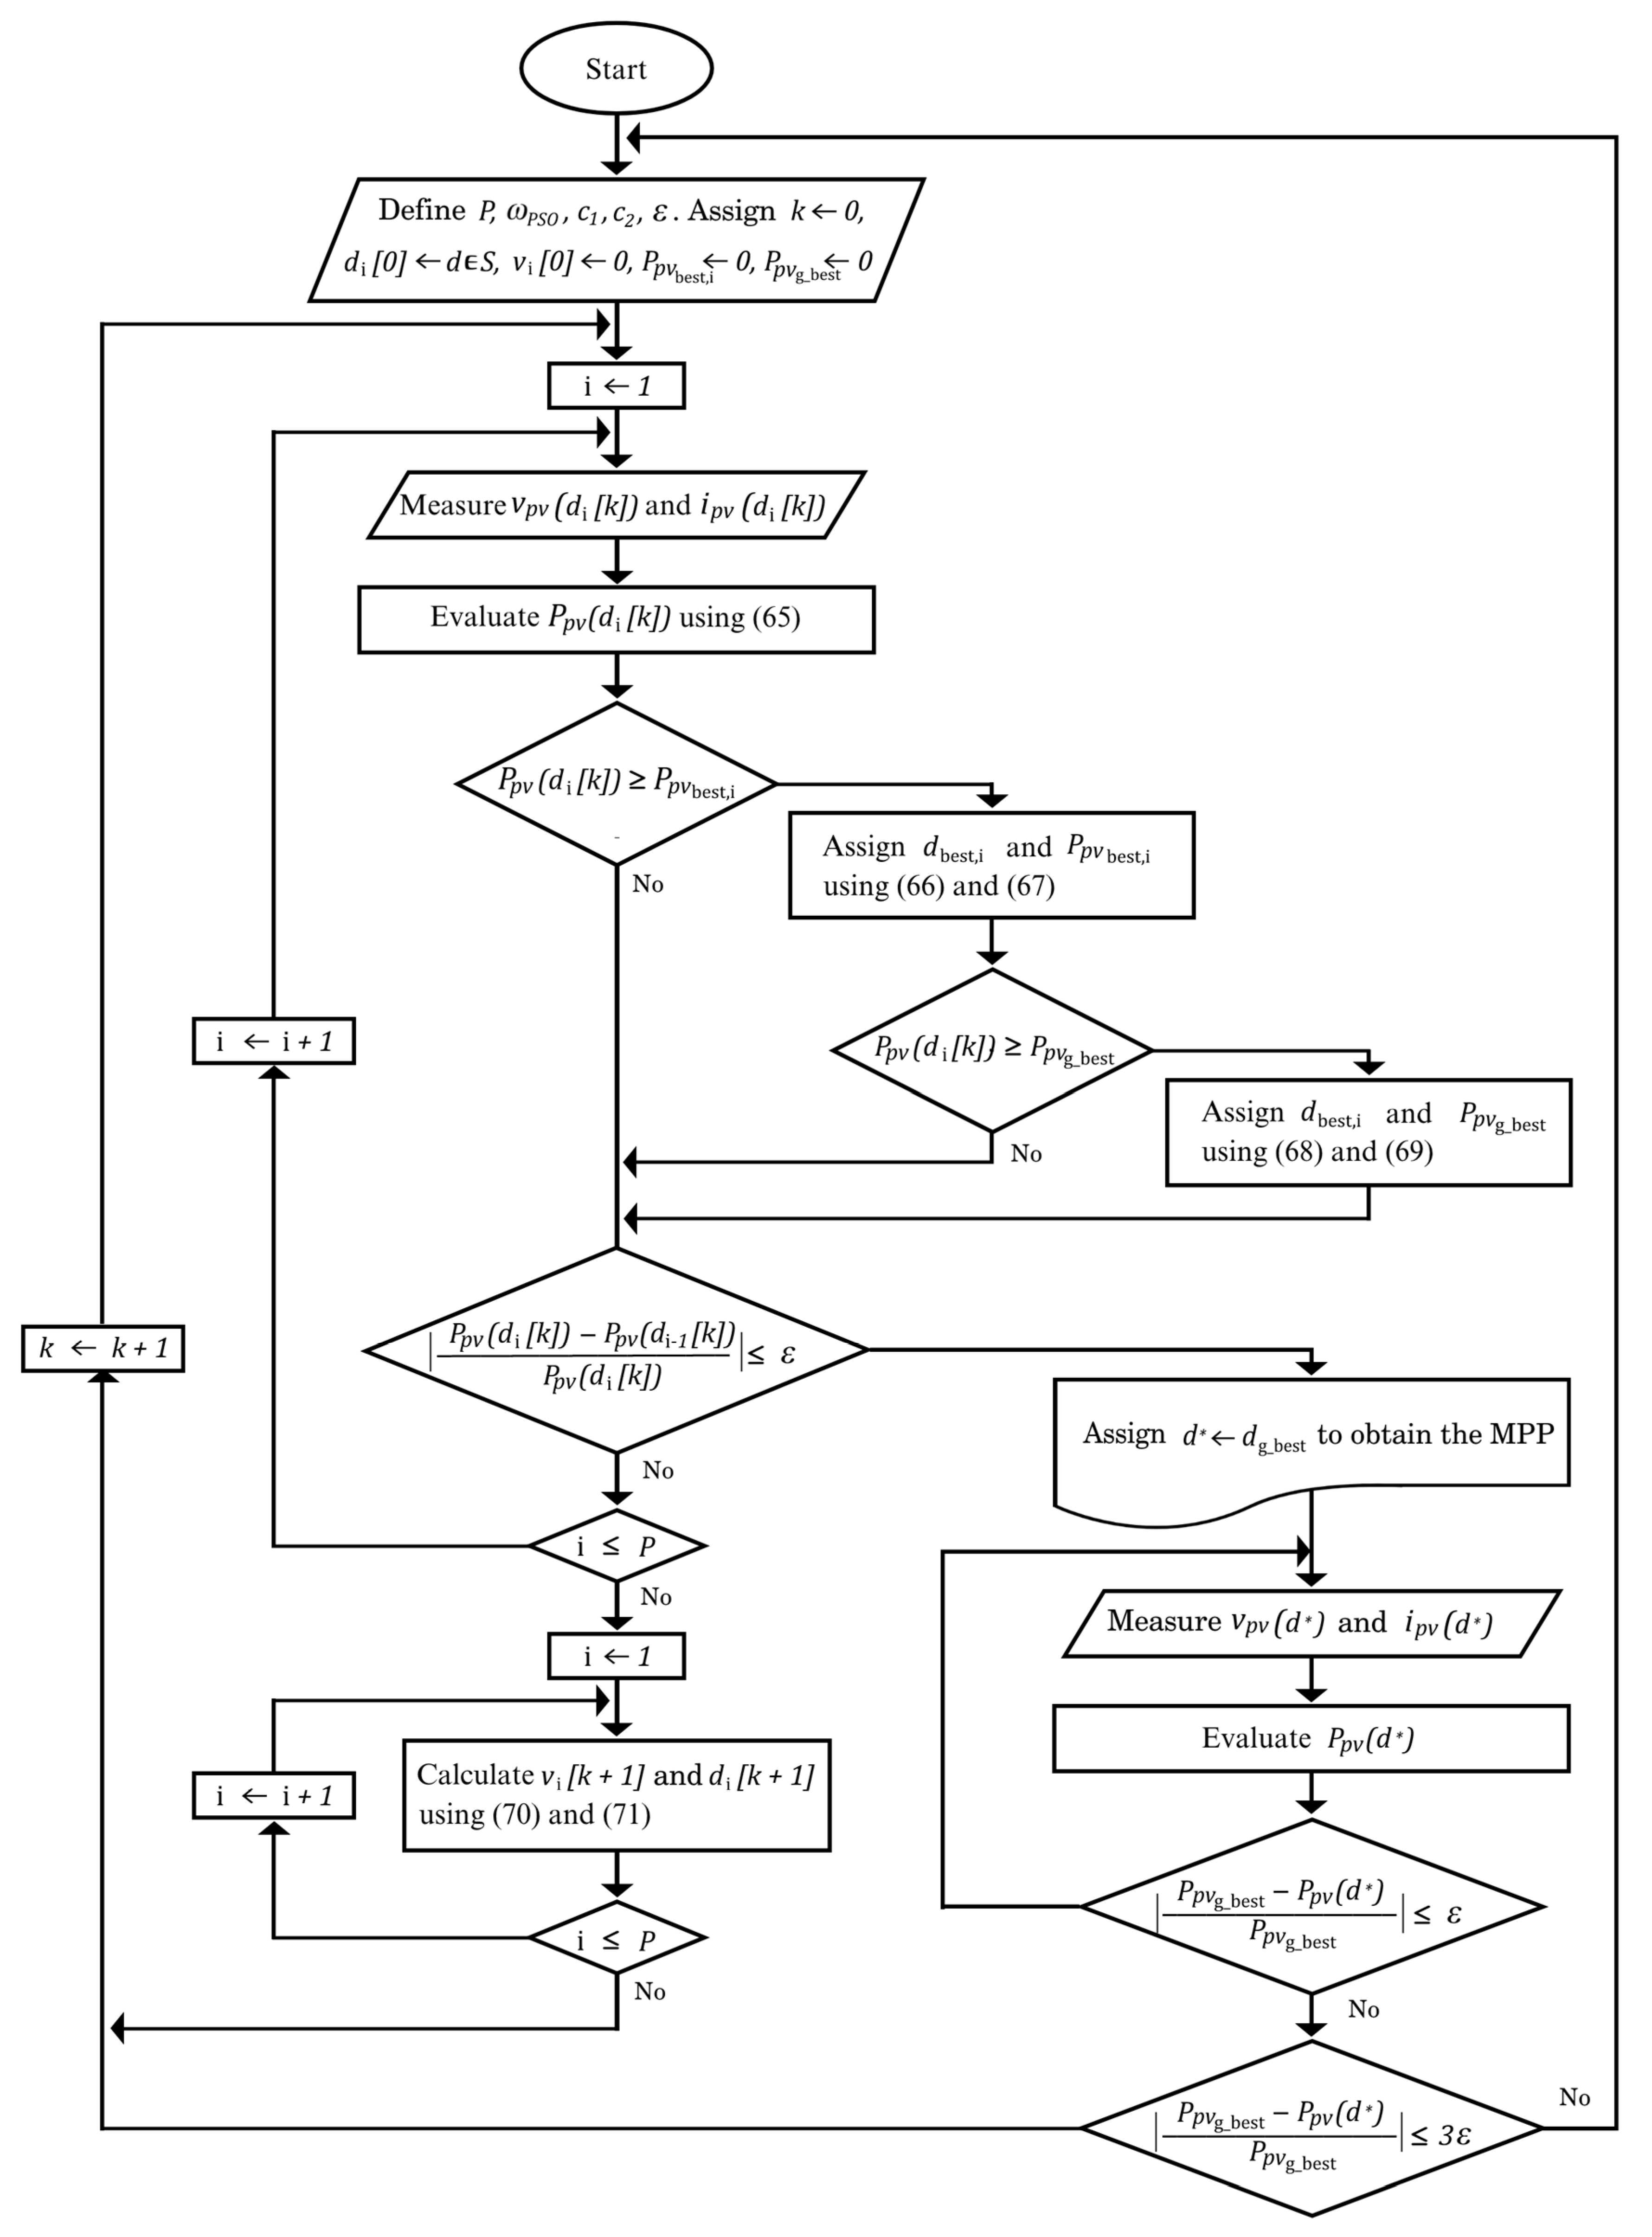
Figure 8 shows the PSO flowchart with the following considerations:
  • Initialization. This stage defines the size of the swarm P , the inertia coefficient ω P S O , the cognitive acceleration coefficient c 1 , the social acceleration coefficient c 2 , the threshold ε for convergence determining, and the sample time t s . The particle positions d i in the initial iteration ( k 0 ) are assigned with a fixed value within the search space S from i = [ 1 , , P ] . Similarly, first-iteration particle velocities are assigned to zero, i.e., v i 0 0 from i = [ 1 , , P ] . The evaluations of the best personal particle values and the global best value are assigned the worst possible value, i.e., P p v b e s t , i 0 from i = [ 1 , , P ] and P p v g _ b e s t 0 ;
  • Evaluation. The objective function P p v is evaluated from the measurements of i p v and voltage v p v at the ith particle of the kth iteration, as shown in (65);
    P p v d i [ k ] = v p v d i [ k ] i p v d i [ k ]
  • Comparison. The best personal and global values will be the ones with the best evaluation in the objective function. Equations (66)–(69) show how to calculate the best individual value of the particle, the best evaluation of the particle, the best overall collective value, and the best evaluation of the particle, respectively.
d b e s t , i d i k , if P p v d i [ k ] P p v b e s t _ i d b e s t , i , if P p v d i [ k ] < P p v b e s t _ i
P p v b e s t _ i P p v d i [ k ] , if P p v d i [ k ] P p v b e s t _ i P p v b e s t _ i , if P p v d i [ k ] < P p v b e s t _ i
d g _ b e s t d i k , if P p v d i [ k ] P p v g _ b e s t d g _ b e s t , if P p v d i [ k ] < P p v g _ b e s t
P p v g _ b e s t P p v d i [ k ] , if P p v d i [ k ] P p v g _ b e s t P p v g _ b e s t , if P p v d i [ k ] < P p v g _ b e s t
  • Calculation of the positions and velocities of the particles. Equations (70) and (71) calculate the new velocities v i k + 1 and positions d i k + 1 for the next iteration, respectively. These equations consider the random values r 1 , r 2 [ 0 ,   1 ] in the i-th particle. This stage also verifies that the new particle position does not exceed the search space S .
    v i k + 1 = ω P S O v i k + c 1 r 1 d b e s t , i d i [ k ] + c 2 r 2 d g _ b e s t d i [ k ]
    d i k + 1 = d i k + v i k + 1
  • Convergence determining. The convergence determining involves the MPP condition and the new search condition. MPP condition verified that the power between particles is less than the threshold ε . If yes, the duty cycle d g _ b e s t is the global maximizer d * to obtain the MPP; otherwise, the optimization process continues. The new search condition implies that the PV cells are in the MPP. Therefore, it is verified whether the overall maximizing power P p v d * varies due to environmental conditions in each sampling period t s to start a new search.

3.2. Variable Frequency Drive

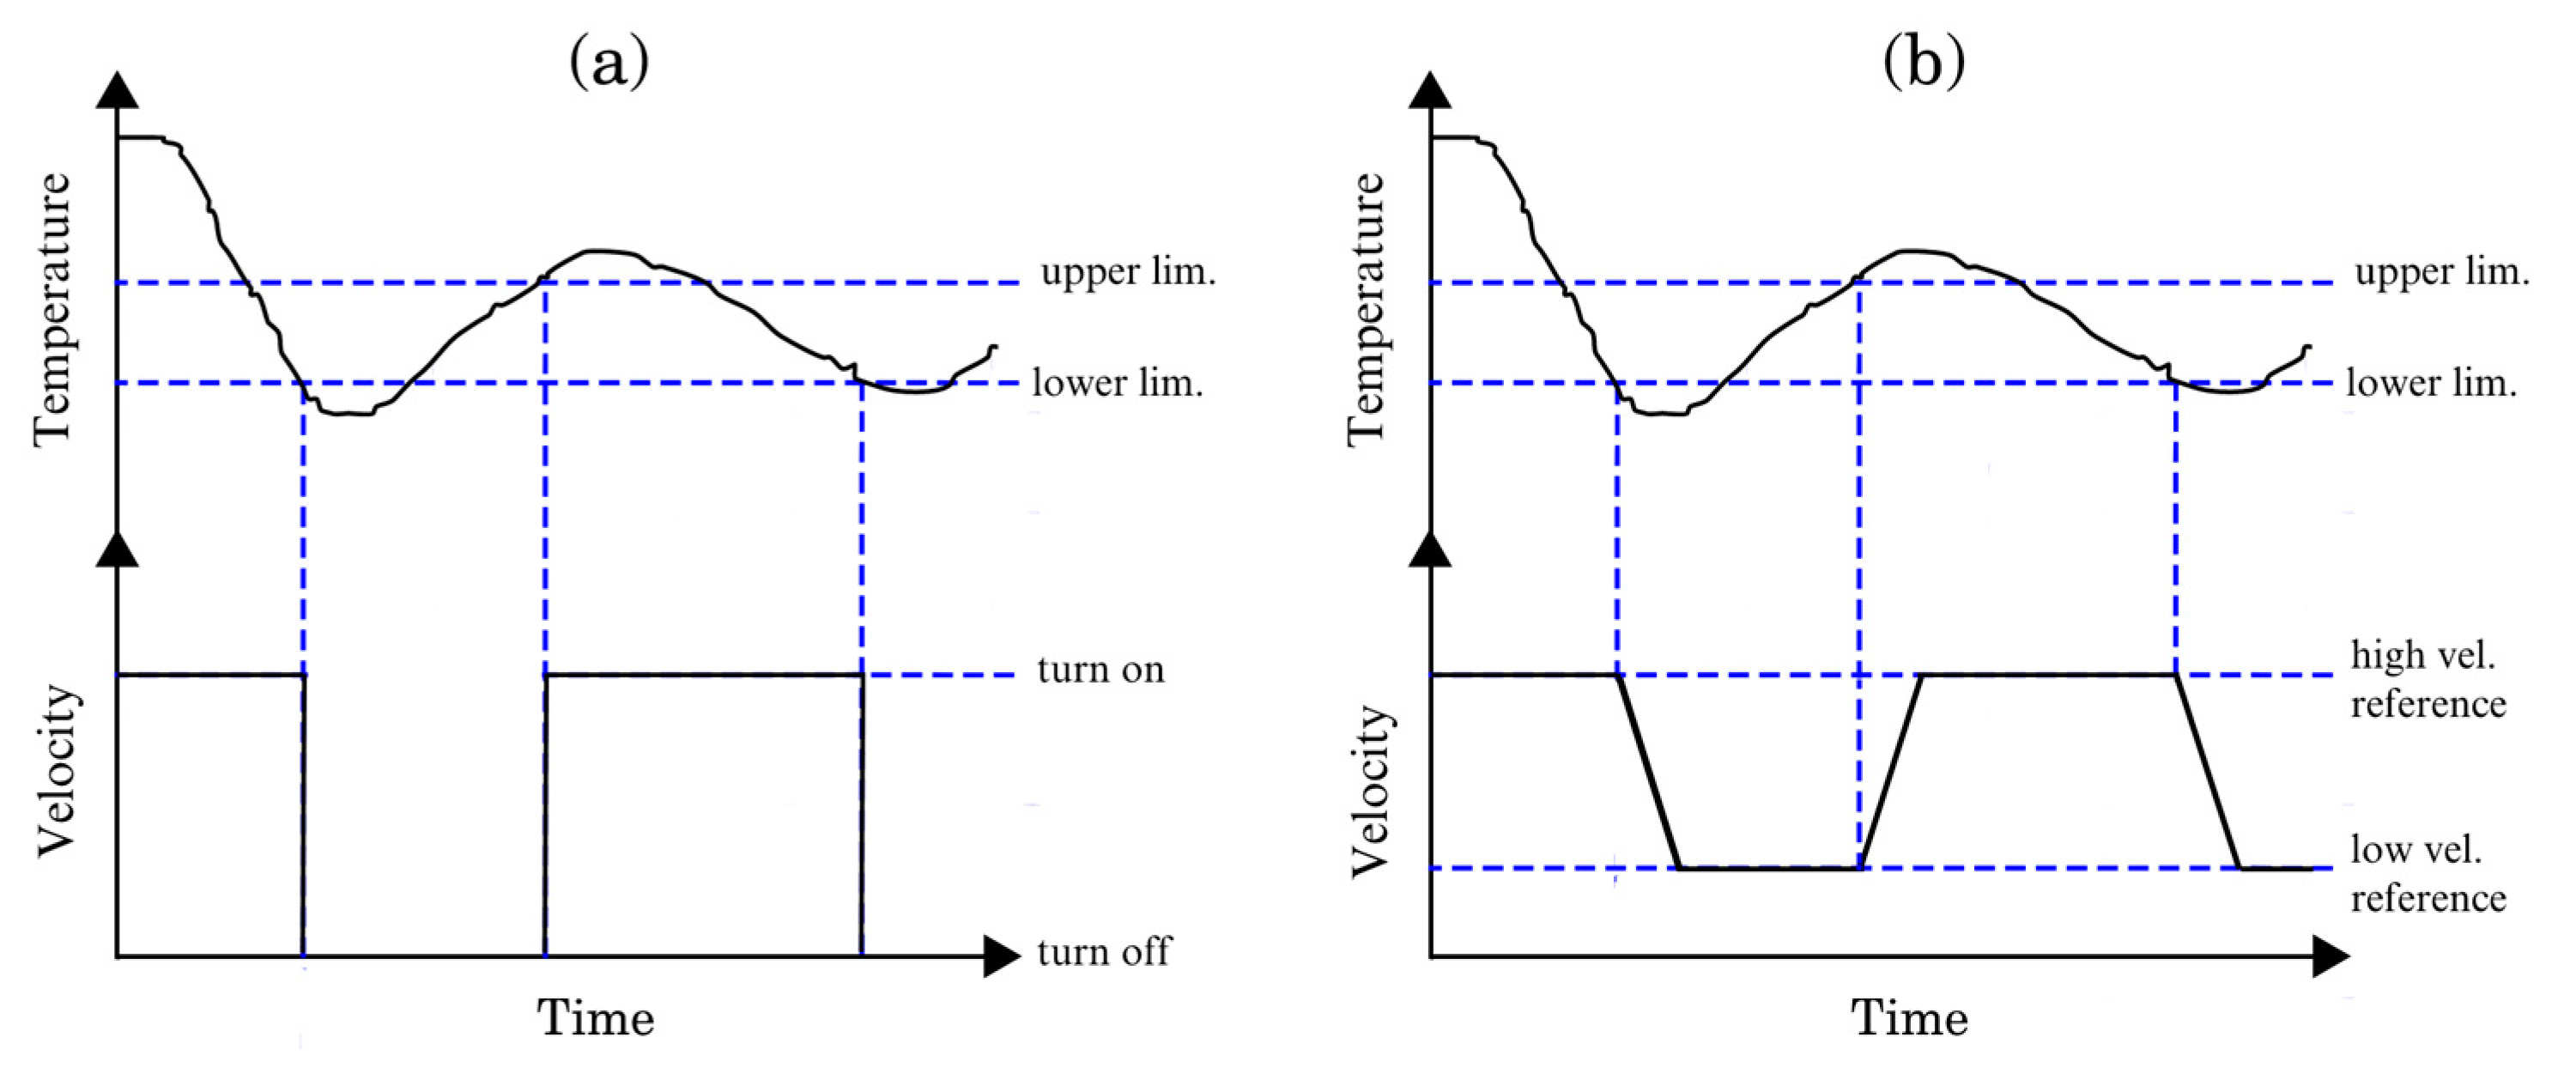
Efficient systems are sought to reduce energy consumption. One of the innovations has been to replace the traditional method of turning on and turning off the motor drive with better control techniques such as the Variable Frequency Drive (VFD). Figure 9 compares the traditional on/off technique against the VFD. Figure 9a shows that the motor runs at nominal velocity or is turned off, depending on the upper and lower limits of the temperature hysteresis. In Figure 9b, the motor velocity varies between high and low velocity instead of turning off the air conditioner. According to [31,32], the VFD has become the recommended choice because there is no excess evaporator capacity when there is a low load, as happens when the ambient temperature is close to the desired temperature. Another advantage is that it may provide a soft start, reducing the high initial current peaks at the motor stars.
Figure 10 shows the control scheme to regulate the velocity of the motor using mainly the Volt/Hertz control and a Bezier polynomial. The VFD flag changes the reference velocity between high and low reference values. The change between reference values is not instantaneous; instead, the 10th-order Bezier polynomial in (72)–(73) smoothly changes between the reference values to adopt energy-saving measures. The control scheme uses a PI controller between the reference value ω r m * and the output velocity ω r m . Then, the error is added to the reference value and transformed from r a d / s to H z to use in the Volt-Hertz control. The nominal voltage and frequency of the induction motor and the DC bus voltage feedback are required to generate the motor drive’s modulation indexes and switching functions [33].
ω r m * = ω r m , m i n for t < t i n i ω r m , m i n + ( ω r m , m a x ω r m , m i n ) P B e z ( t ) for t i n i < t < t f i n ω r m , m a x for t > t f i n
P B e z t = 252 Γ 5 1050 Γ 6 + 1800 Γ 7 1575 Γ 8 + 700 Γ 9 126 Γ 10 Γ = t t i n i t f i n t i n i

3.3. Management of the Power Flow between the DC Bus and the Power Grid

Figure 11 shows the control scheme applied to the linkage converter to control the power flows between the DC bus and the grid [34]. There are four main stages in the control scheme:
  • The transformation from the a b c framework to the q d 0 reference frame uses the grid angle to simplify control tasks. Therefore, a Phase-Locked Loop (PLL) obtains the grid angle for synchronization;
  • The DC voltage regulator controls the DC bus voltage to a desired value through a PI 1 controller. The DC voltage regulator also controls the power flow between the DC bus and the grid. The result of the PI control is a desired i g d current;
  • There are two PI current controllers, where i g d * controls the active power and i g q * the reactive power. In this case, the reference current i g q * is zero because it is not desirable to supply this type of power to the grid;
  • As a result, there is an inverse transformation to convert the average modulation indexes from q d 0 to a b c framework.

4. Results

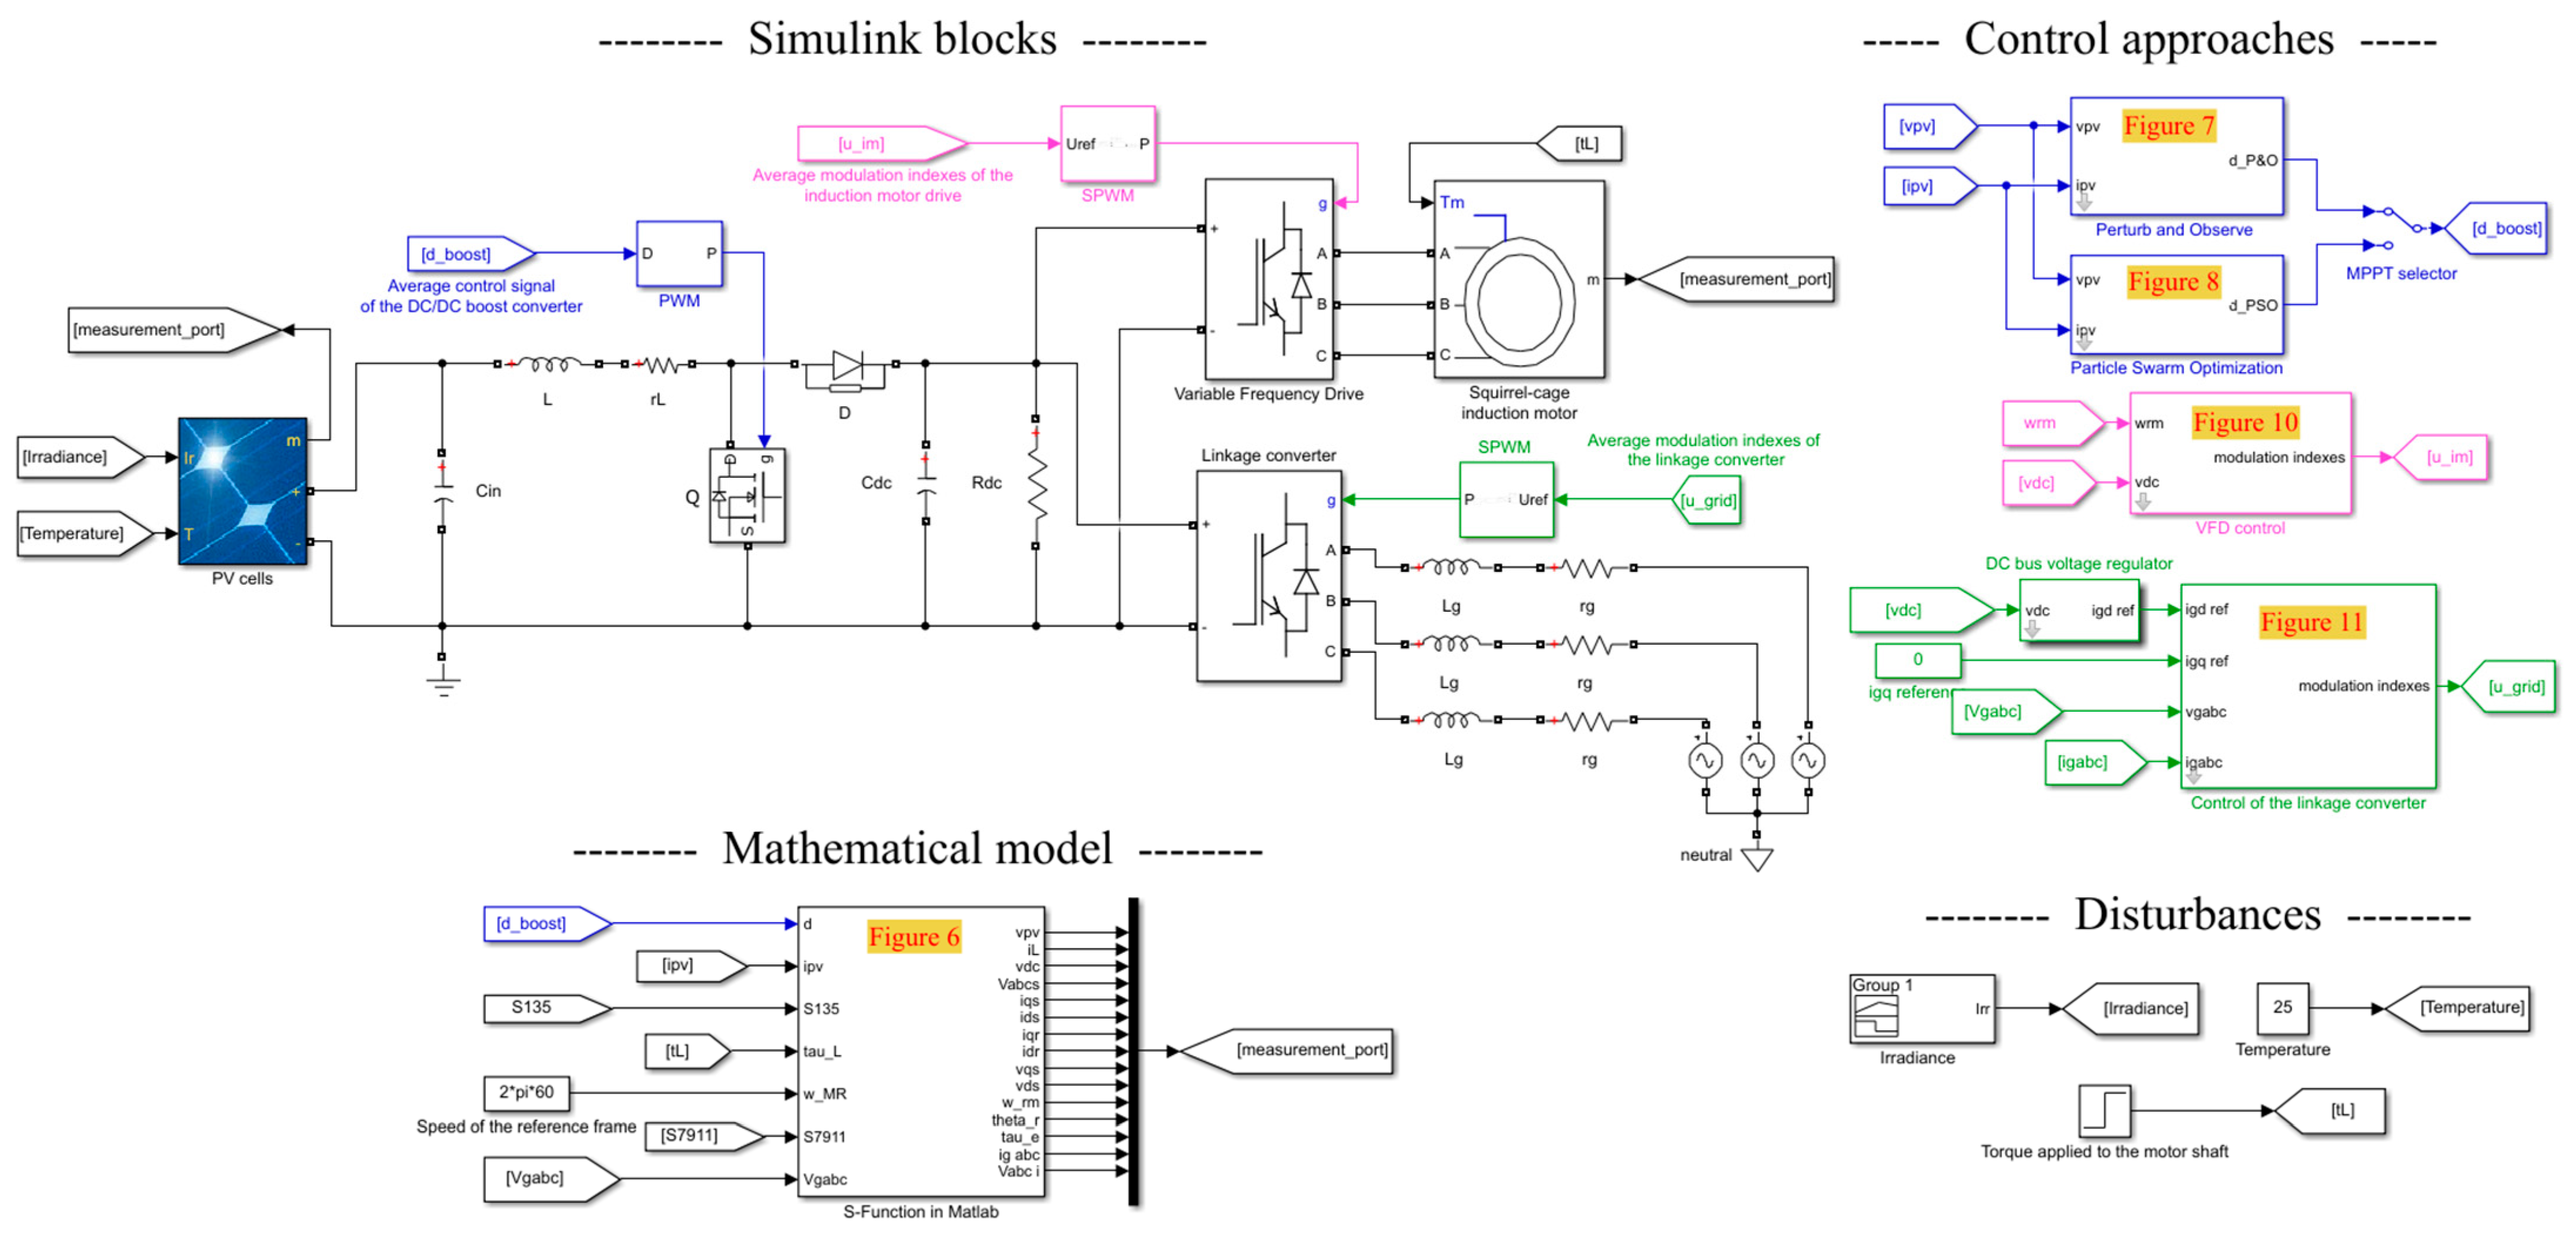
Figure 12 shows a simplified diagram in the Matlab/Simulink environment to validate the system’s model of Section 2 using the control approaches of Section 3. A Matlab S-function contains the code of the mathematical model (see Figure 6) of the proposed system, comparing its dynamic behavior with the block diagram in Simulink. The figure also shows the control approaches from Figure 7, Figure 8, Figure 10 and Figure 11. In addition, the disturbances in the system include variations in irradiance, temperature, and the applied torque in the motor shaft. It is worth mentioning that the simulation files, Supplementary Material, and data availability are openly available in the Figshare repository at https://doi.org/10.6084/m9.figshare.21632261 (accessed on 16 May 2023), reference number [35].
The simulations compare two different induction motors available in the laboratory, the BHI62S-A model of the Oriental Motors manufacturer and the AMK DV 4-1-4 model of the AMKmotion manufacturer, where the parameters are given in Table 7. The reference DC bus voltage v d c * is 400   V according to the induction motor and grid characteristics. The PV array consists of three series-connected modules, where Table 8 shows the solar panel characteristics. In addition, Table 9 shows the design parameters of the power electronic converters. Finally, Table 10, Table 11, Table 12 and Table 13 show the parameters of the control approaches, including the P&O algorithm, the PSO, and the motor drive and linkage converter controllers.

4.1. Scenario of Simulation 1

The first simulation scenario uses the induction motor number 1 from Table 7 and the following considering:
  • At t = 0 s, the irradiance is I r r = 1000   W / m 2 ; the control signals of the motor drive and the linkage converter are zero; the average duty cycle of the DC/DC boost converter is d = 0.4 , i.e., it does not operate at MPP; and the PV cells are the only supply source of the other stages connected to the DC bus. Therefore, the system operates in mode I from Figure 1;
  • At t = 0.75 s, the P&O algorithm is enabled as MPPT;
  • At t = 2.00 s, the control signals of the linkage converter are enabled to regulate the DC bus voltage. As a result, the system changes from operation mode I to operation mode II because there is surplus energy;
  • At t = 3.00 s, the motor starts without load, considering a reference velocity of 350   rpm ;
  • At t = 5.00 s, the reference velocity value change from 350   r p m to 1500   r p m considering the Bezier polynomial function with a transition time of 8 s;
  • At t = 9.00 s, there is an applied torque of 1.25   N · m in the velocity transition;
  • At t = 17.00 s, the irradiance decreases from I r r = 1000   W / m 2 to 250   W / m 2 . As a result, the system changes from operation mode II to operation mode III because the grid delivers energy instead of absorbing it.
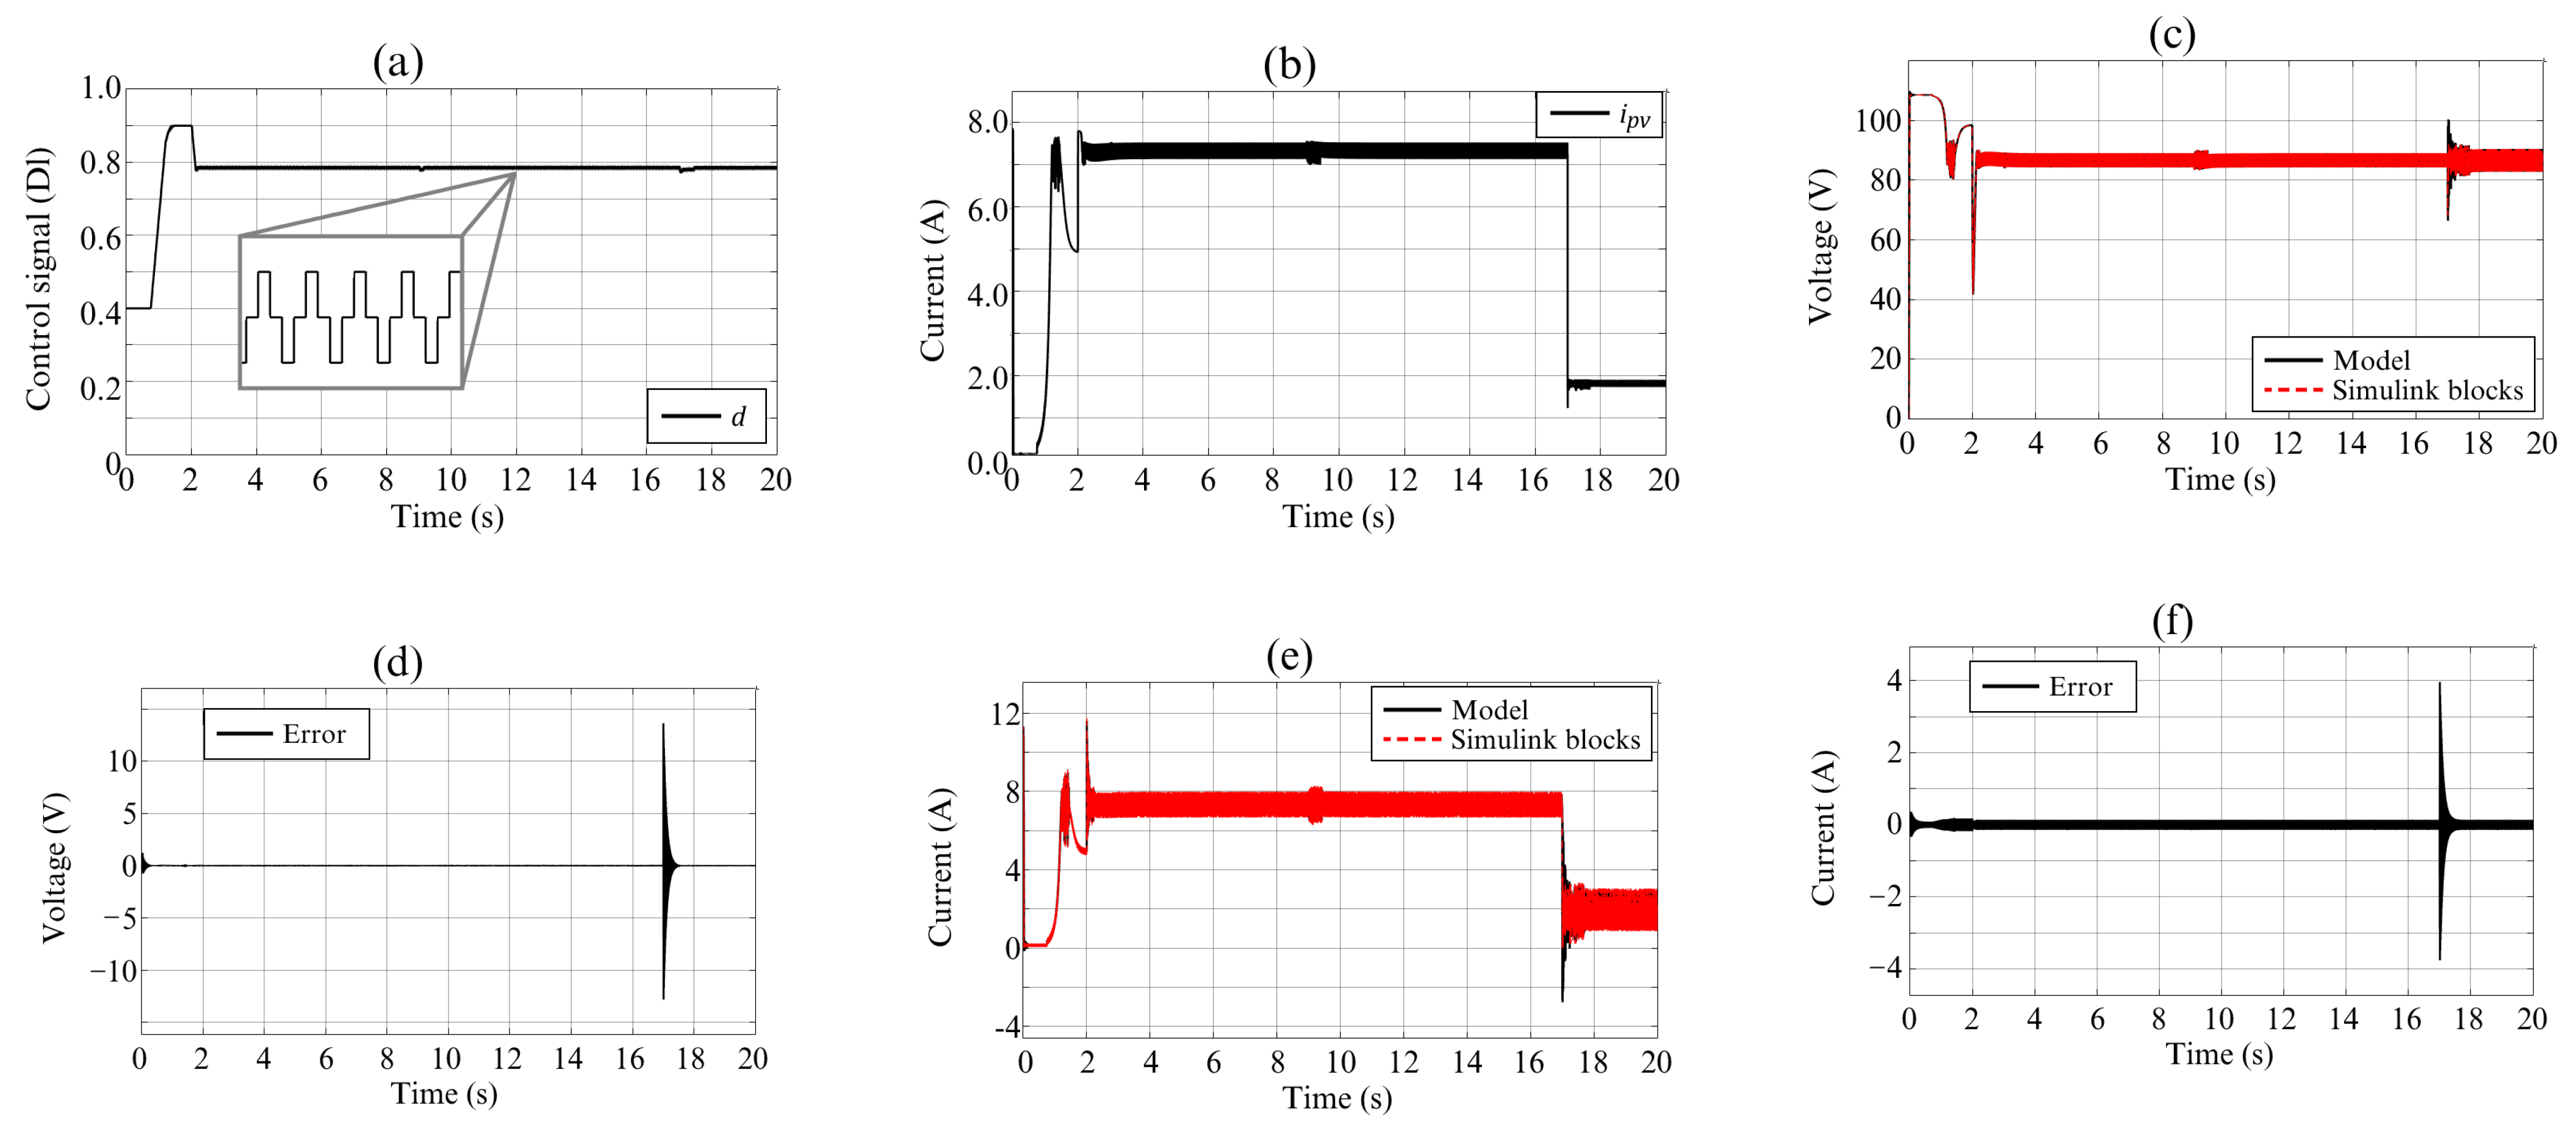
Figure 13 compares the mathematical model and the block diagram of the variables related to the PV cells and the DC/DC boost converter. Figure 13a shows the average duty cycle of the DC/DC boost converter d , which varies with different disturbances to track the MPP. In addition, the figure shows the oscillations around the steady-state MPP typical of the P&O algorithm. Figure 13b shows the PV cells current i p v , where its main change is that it decreases drastically due to the change in irradiance. This figure also shows that i p v has a higher value enabling the MPPT instead of an arbitrary duty cycle, affecting the power of the PV cells shown below. Figure 13c shows the PV cells’ voltage v p v . In this case, v p v is a variable of the mathematical model to compare with the block diagram; hence, Figure 13d shows the error between the signals, oscillating around zero. Figure 13e compares the inductor current of the DC/DC boost converter i L between the mathematical model and the block diagram. As a result, Figure 13f shows the error between the mathematical model and block diagram for i L , showing an error around zero. The error figures have the largest amplitude during the irradiance change, mainly because the converter no longer operates in the continuous conduction mode. It is essential because the mathematical modeling considered this constraint in Section 2. However, this condition is unsatisfied during the irradiance change because the inductor current drops to zero at t = 17.00 s.
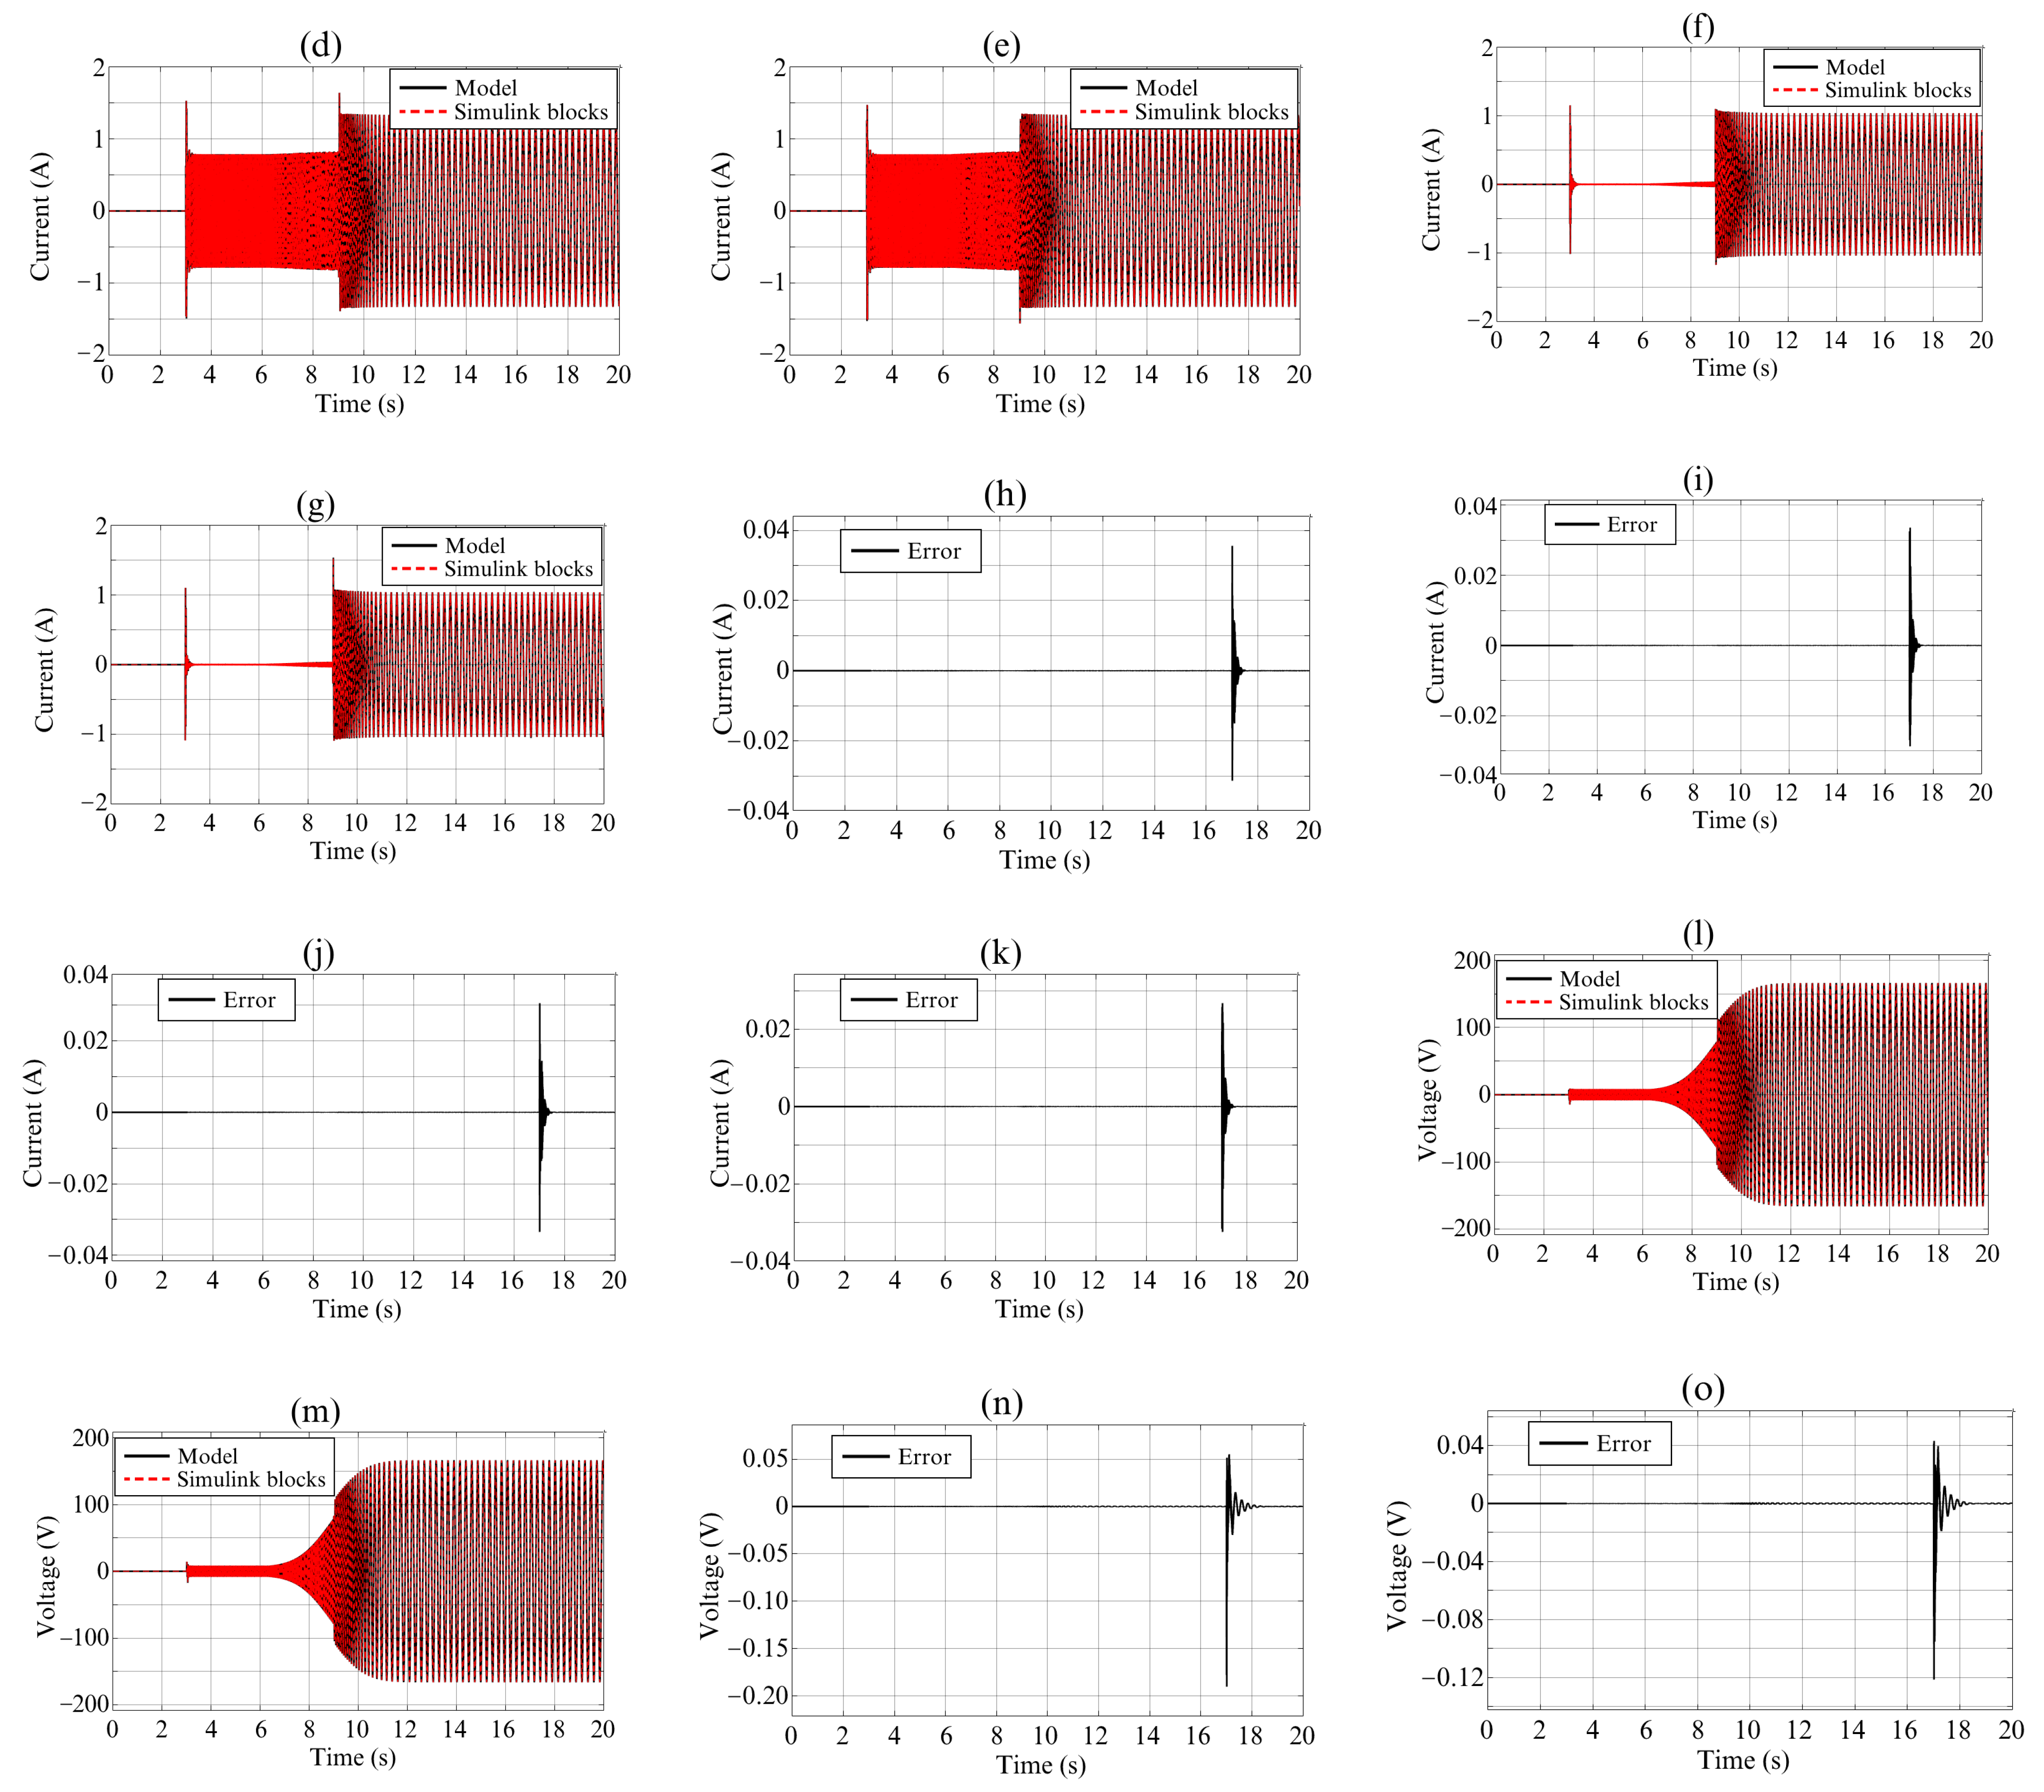
Figure 14 focuses on the motor drive signals in the same simulation scenario. First, Figure 14a shows only the modulation index u a i m since u b i m and u c i m are the same but shift 120° and 240 ° , respectively. Figure 14b shows the mechanical angular velocity of the rotor in rpm ω r m , which reaches the reference value when the motor starts. Figure 14c shows the error of ω r m between the mathematical model and block diagram, presenting an error around zero. Figure 14d,e shows the stator currents in the q d 0 reference frame, in which the mathematical model is also compared with the block diagram. Figure 14f,g compares the rotor currents reflected in the stator in the q d 0 reference frame. Figure 14h–k shows the errors between the mathematical model and the block diagram of the stator and rotor currents of the machine, where the errors are almost always zero. Figure 14l,m shows the stator voltages in the q d 0 reference frame, and Figure 14n,o shows the error between the mathematical model and block diagram. All presented error signals also show the highest error during irradiance change, where the DC/DC boost converter is not operating in the continuous conduction mode. Therefore, it is essential to note the integral interrelationship of the whole model and how all variables are affected.
Another highlight of Figure 14d–g,l,m is the variations in amplitude and frequency of the signals in the q d 0 framework. Firstly, the change in current amplitude results from the torque change in the motor shaft at t = 9 s. In addition, the current, voltage, and frequency variations are due to the a b c to q d 0 transformation using a constant reference frame rotation speed of ω = 120 π (see Figure 12). However, the control approach of the variable frequency drive varies the amplitude and frequency of the motor power supply, which differs from the arbitrarily selected constant speed. In this case, the control approach in Figure 10 does not use the a b c to q d 0 transformation, but it is shown to highlight that the q d 0 framework can be used in other control approaches to take advantage of it. In this sense, an example is the transformation of the power grid signals shown below.
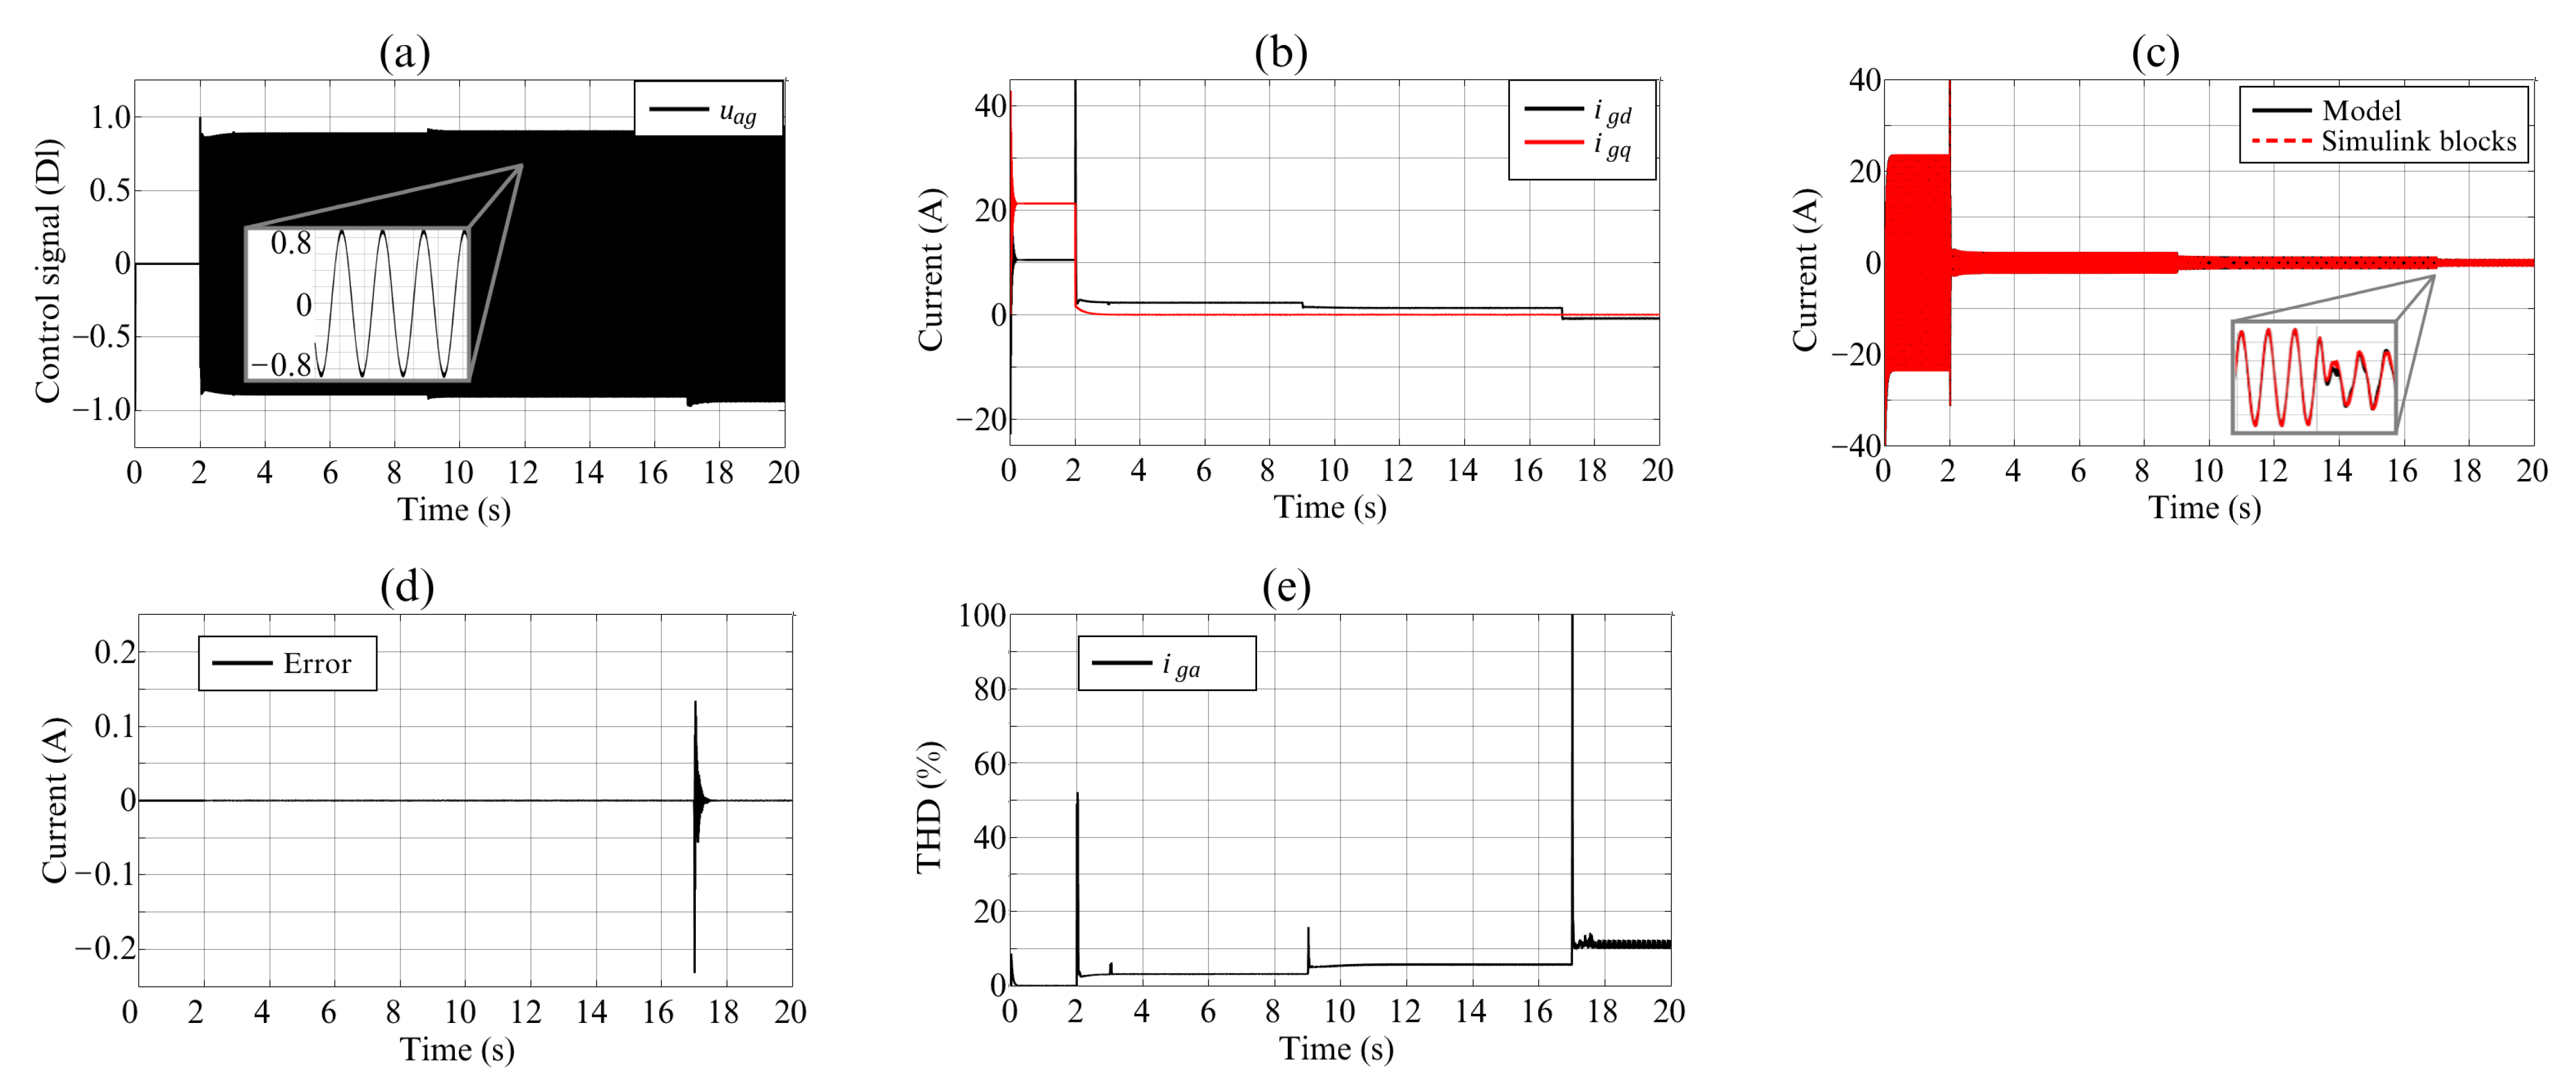
Figure 15 focuses on the interconnection between the DC bus and the power grid. Figure 15a shows the modulation index u a g since, as in the motor drive, the signals u b g and u a c are identical but out of phase by 120°. Figure 15b shows the power grid currents’ behavior in the q d 0 framework, highlighting the regulation of i g q to zero, and the value of i g d depends on the power on the DC bus. The figure shows that the current i g d has a negative value when the irradiance decreases, as the grid supplies power because the power from PV cells is insufficient at the change in irradiance. As a result, the system changes from operating mode II to operating mode III. Figure 15c also shows the power grid current, but now in the a b c framework, comparing the i a g current between the mathematical model and the block diagram. The currents i b g and i c g show the same behavior as i a g , with the only difference of the 120 ° displacement. Figure 15d shows the error of i a g between the mathematical model and the block diagram. As in the previous comparisons, the error of this variable is practically zero, and the most significant error amplitude occurs when not operating in the continuous conduction mode of the converter. Figure 15e shows the Total Harmonic Distortion (THD) of the current of the grid i a g , mainly affected by the connection between the DC bus and the power grid, the starting of the induction motor, and the change of power flow between the DC bus and the grid.
Figure 16 focuses on the signals related to the DC bus. Figure 16a shows the DC bus voltage v d c , which has a constant voltage at the beginning by the control signal of the DC/DC boost converter in Figure 13a. Its voltage is unregulated and seeks the MPP, and finally, it is regulated to the desired voltage of 400   V when interconnecting the DC bus and the power grid. Figure 16b shows the error between the mathematical model and the block diagram for v d c , where the error has the same behavior as in the previous signals. Finally, Figure 16c shows the power of the different stages, including the power of the PV cells P p v ; the power of the other interconnected stages on the DC bus P R d c ; the electrical and mechanical power of the induction motor P s t a t o r and P m e c h , respectively; and the power of the grid P g r i d . This figure shows that P p v is much higher when operating at the MPP than in an arbitrary duty cycle. For instance, the maximum power of PV cells with an irradiance of 250   W / m 2 is higher than using a constant duty cycle, and the irradiance of 1000   W / m 2 , highlighting the importance of the MPPT. Figure 16c also shows that the power absorbed by the grid is the difference in power between P p v with the P R d c and P s t a t o r loads. In this figure, the power P g r i d has a positive value when operating in mode II from Figure 1. Furthermore, P g r i d is negative when the irradiance decreases, implying that the grid is now supplying the necessary power to satisfy the demand of the loads in operating mode III (except at t < 2.00 s when operating in mode I because of the scenario considerations).

4.2. Scenario of Simulation 2

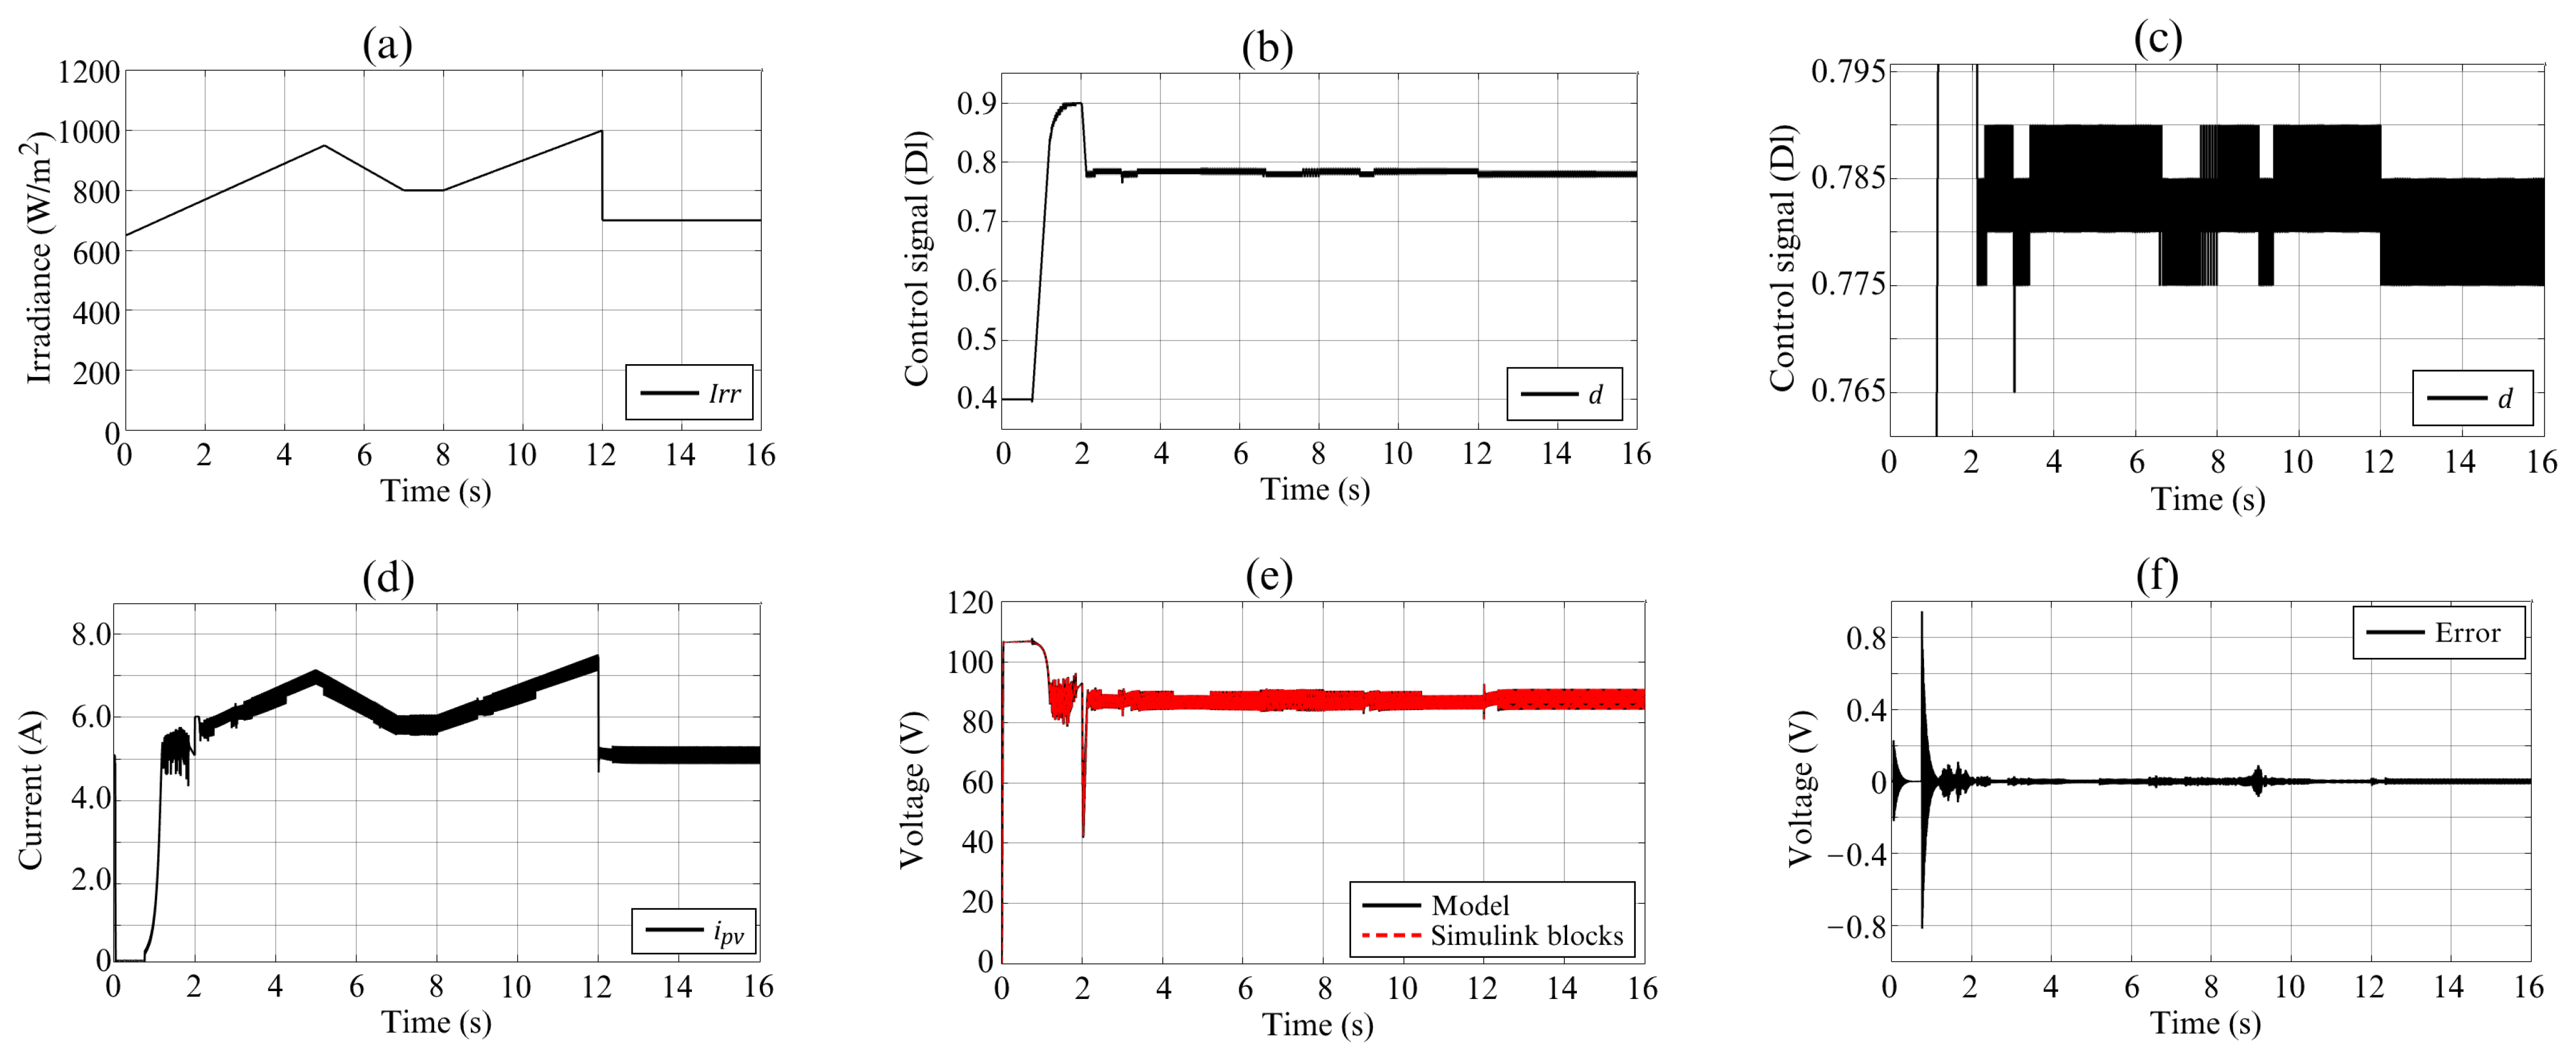
This simulation scenario considers the variable irradiance shown in Figure 17a and the induction machine number 2 from Table 7. The other considerations are similar to the previous scenario:
  • At t = 0 s, the control signals of the motor drive and the linkage converter are zero, and the average duty cycle of the DC/DC boost converter is d = 0.4 . Therefore, the system is in operating mode I;
  • At t = 0.75 s, the P&O algorithm is enabled as MPPT;
  • At t = 2.00 s, the control signals of the linkage converter are enabled to change operating mode I to operating mode II;
  • At t = 3.00 s, the motor starts without load with a reference velocity of 350   r p m ;
  • At t = 5.00 s, the reference velocity value change from 350   r p m to 1500   r p m ;
  • At t = 9.00 s, there is an applied torque of 1.5   N · m to the motor shaft. This disturbance causes the system to change from operating modes II to III.
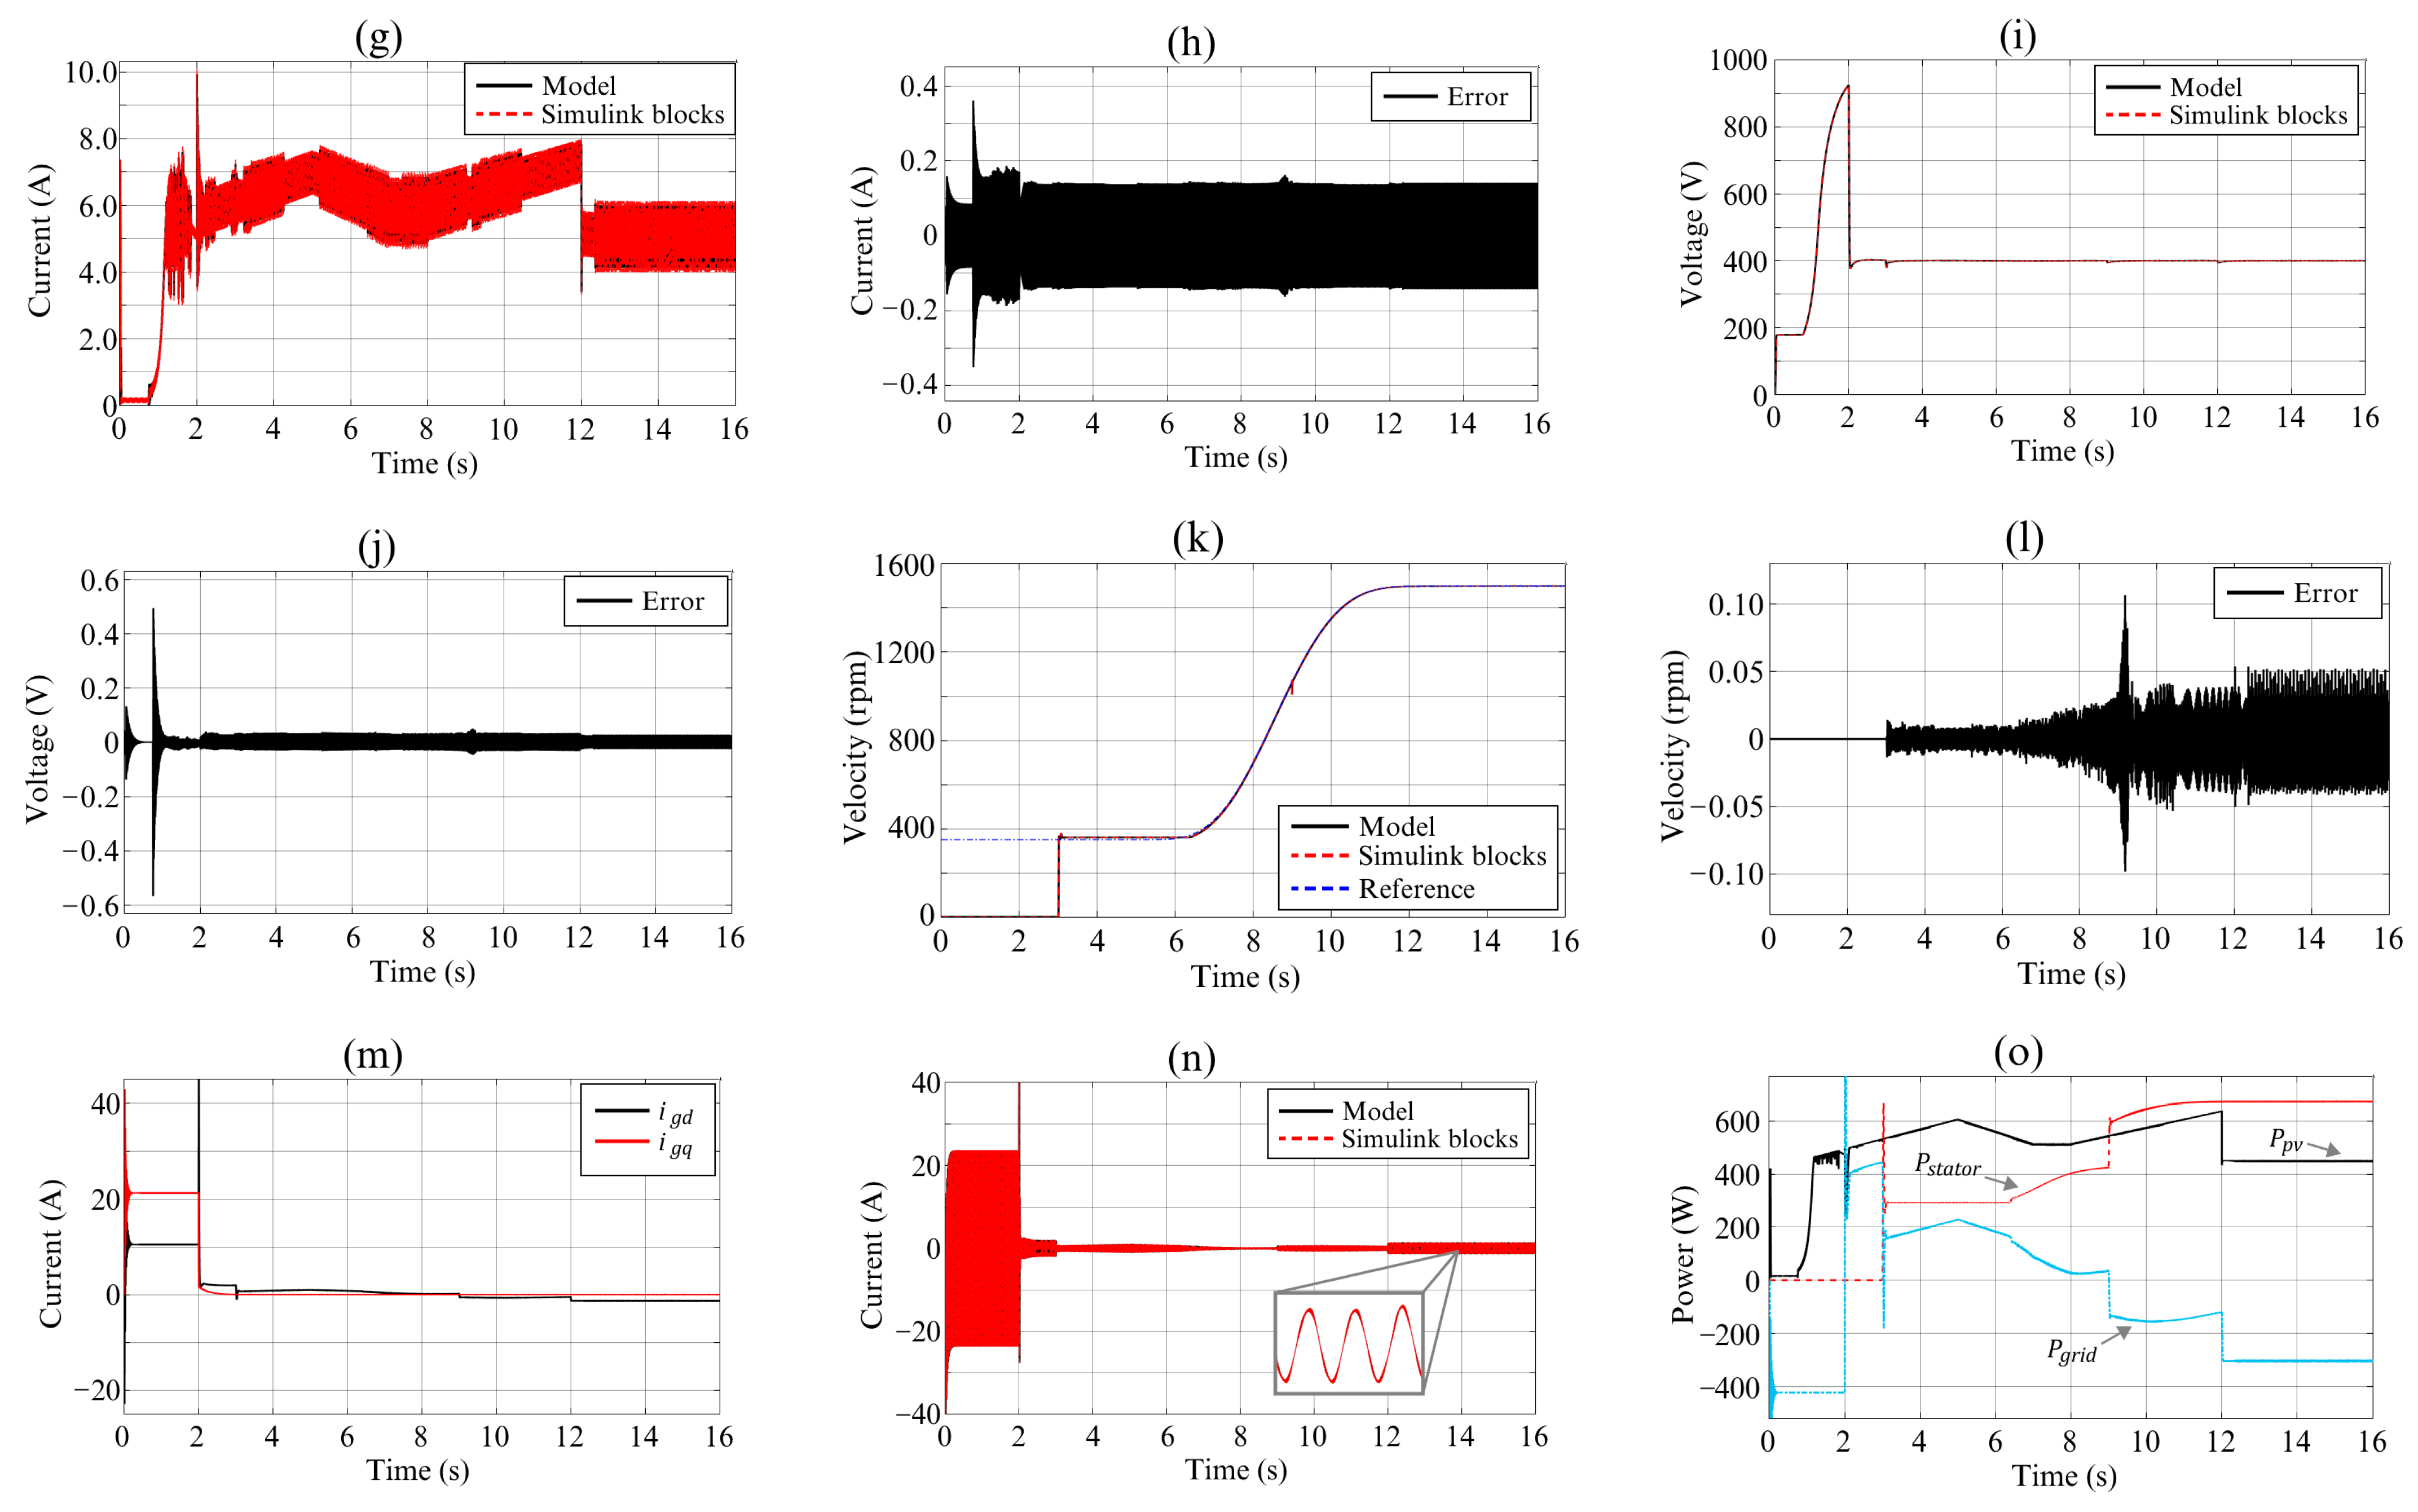
Figure 17 shows the most relevant signals in the system. Figure 17b,c shows the average duty cycle of the P&O algorithm to track the MPP of the PV cells. As a result, Figure 17d shows the behavior of i p v , which varies similarly to the irradiance when the MPPT is enabled. Figure 17e shows the behavior of the mathematical model and the block diagram of the v p v , where Figure 17f shows the error between these signals. In this case, the error is closer to zero than the first simulation scenario since the converter always operates in continuous conduction mode. Figure 17g shows the current i L , which has a similar behavior to i p v but with the addition of a ripple. Figure 17h shows the error between the mathematical model and the block diagram for i L , where the error is practically the current ripple that the mathematical model averages. Figure 17i shows the DC bus voltage regulated to a desired value when the DC bus is interconnected to the grid. Figure 17j shows the error closest to zero between the mathematical model and the block diagram for v d c . Figure 17k shows the angular velocity of the induction motor, where the Bezier polynomial reference value for the machine is reached again. Therefore, the induction motor operates correctly despite environmental variations such as solar irradiation changes. In addition, Figure 17l shows the error closest to zero between the mathematical model and the block diagram for ω r m . Figure 17m,n show that the variables mainly affected by environmental variations are the grid currents. In this case, the current i g d varies as a function of the DC bus power, which is reflected in the amplitude of the current i a g in the a b c framework. Finally, Figure 17o shows the powers of the PV cells, the induction motor, and the grid. In this figure, the motor is poorly efficient because it is an old motor that has been worked on in the laboratory, deteriorating its performance. However, the purpose is to show that the mathematical model applies to different motors and that the results obtained serve as a basis for the experimental platform for future work.
Figure 17 shows that the main variables affected by solar radiation are the currents of the PV cells, the inductor, and the grid, as well as the powers of the PV cells and the grid. Figure 17d,g shows that the PV cells and inductor currents are proportional to irradiance. Similarly, Figure 17o shows that PV energy is proportional to this variable, which is well known and the reason for choosing geographical areas with a high level of solar radiation. However, Figure 17k,o shows that the motor is not concerned with irradiance variations, requiring only enough energy to satisfy the requirements of the compressor. Conversely, solar radiation affects the current and power of the grid. For example, extra power from the PV cells is supplied to the grid through the variation of the current i g d once the power demand of the DC bus loads is satisfied, as shown in the operating mode II in Figure 1b. Therefore, solar irradiation affects the amount of power supplied or required from the grid. Higher irradiance provides more energy from the PV cells to the grid in operating mode II. In contrast, it decreases the necessary energy from the grid to satisfy system’s the power requirements in operating mode III.

4.3. Scenario of Simulation 3

The third simulation scenario focuses on the PSO approach as MPPT. In this case, induction motor 1 from Table 7 is used, and the irradiance always is I r r = 1000   W / m 2 . The other considerations are similar to those of the first simulation scenario:
  • At t = 0 s, the control signals of the motor drive and the linkage converter are zero, the average duty cycle of the DC/DC boost converter is d = 0.4 , and the system is in operating mode I;
  • At t = 0.75 s, the PSO is used instead of the P&O algorithm;
  • At t = 2.00 s, the control signals of the linkage converter are enabled;
  • At t = 3.00 s, the motor starts without load with a reference velocity of 350   r p m ;
  • At t = 5.00 s, the reference velocity value change from 350   r p m to 1500   r p m ;
  • At t = 9.00 s, there is an applied torque of 1.25   N · m in the motor shaft.
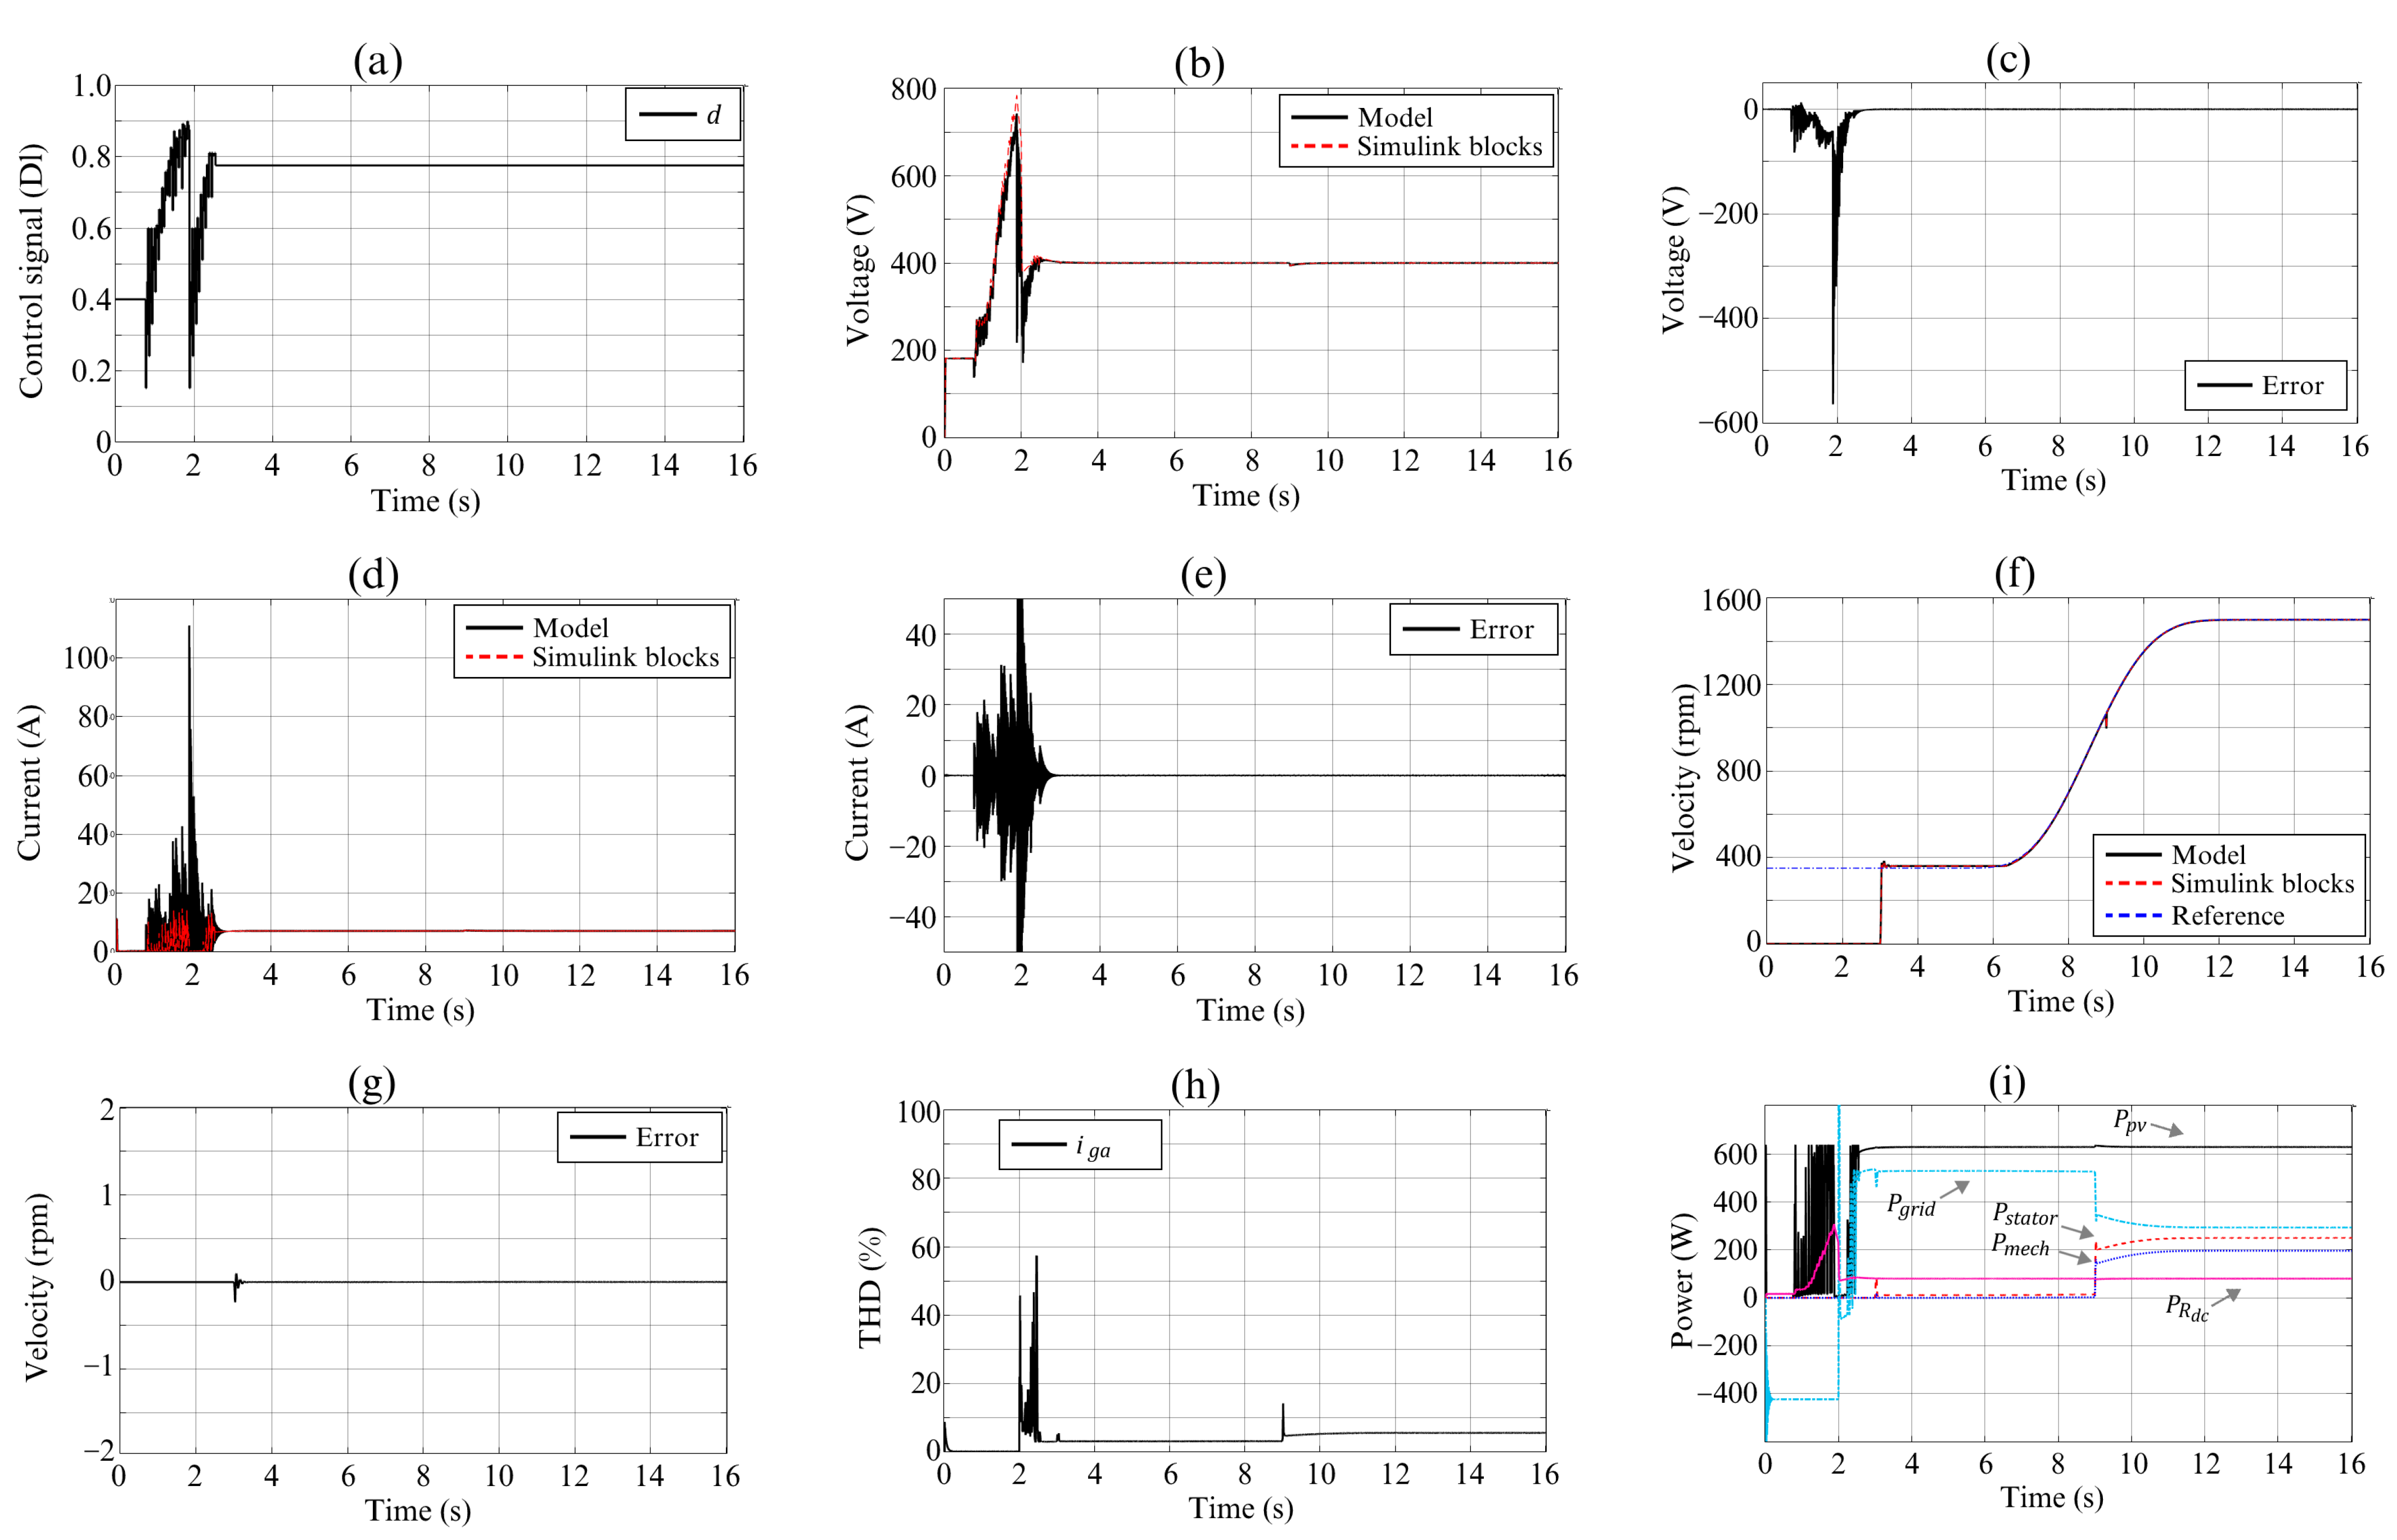
As a result, Figure 18a shows the duty cycle of the DC/DC boost converter, evaluating four particles one-by-one to obtain the MPP. Afterward, the duty cycle remains unchanged until there is a significant change in environmental conditions. Figure 18b,c shows the DC bus voltage and the error between the mathematical model and block diagram. This figure shows a much larger error than the previous scenarios because the nature of the PSO produces abrupt changes in voltages and currents during the search process, causing the converter not to continue to operate in the continuous conduction mode. Therefore, these significant errors are also seen in the other error signals. Figure 18d shows the current i L , and Figure 18e shows the error between the mathematical model and the block diagram with the abovementioned error behavior. Figure 18f shows the induction motor velocity with an identical behavior to the other two simulation scenarios. In this case, the desired velocity is achieved regardless of the approach used to track the MPP. Figure 18g shows the error between the mathematical model and the block diagram for ω r m , presenting an error not as noticeable as the previous signals because the PSO search process ended when the machine started. Figure 18h shows the THD for the current i a g , where the TDH is about 1.5% lower than in Figure 15e with the P&O algorithm as the MPPT approach. The above is because the PSO does not have steady-state oscillations, improving the regulation of the other variables. Finally, Figure 18i shows the powers of the different stages. The figure shows changes between operation modes II and III at t = 2.00 s due to the abovementioned PSO search process. However, the power from the PV cells supplies the air conditioning compressor motor and the power P R d c , delivering the surplus power to the grid in operation mode II at a steady state.

5. Conclusions and Future Works

This paper presented the integral mathematical model of the compressor motor of an air conditioner powered by solar photovoltaic energy combined with the power grid. The obtained mathematical model was validated in the Matlab/Simulink environment. Furthermore, the modeling was tested using control approaches for the different tasks, such as tracking the maximum power point; starting the compressor motor smoothly; changing the reference velocity of the motor; distributing the power flows between the DC bus and the power grid. As a result, the dynamics of the variables between the integral mathematical model and the simulation diagram were very similar when the converter operates in the continuous conduction mode, which gives more certainty to the work performed and takes the integral mathematical model as valid.
The following steps in this research involve applying the obtained mathematical model with other control approaches to improve the system’s performance. In addition, there are ideas to develop a system prototype to carry out the appropriate experimental tests.

Supplementary Materials

Simulation files and high-resolution figures are openly available in the Figshare repository at https://doi.org/10.6084/m9.figshare.21632261 (accessed on 16 May 2023), reference number [35].

Author Contributions

Conceptualization, G.G.-R. and J.C.-G.; methodology, A.M.-B., G.G.-R. and E.G.-R.; software, A.M.-B., G.G.-R., J.C.-G., E.G.-R., M.A.-M., C.A.-C. and J.A.-A.; validation, J.C.-G., M.A.-M. and C.A.-C.; formal analysis, A.M.-B. and G.G.-R.; investigation, E.G.-R., M.A.-M., C.A.-C. and J.A.-A.; resources, A.M.-B. and G.G.-R.; data curation, G.G.-R., J.C.-G. and E.G.-R.; writing—original draft preparation, A.M.-B. and G.G.-R.; writing—review and editing, J.C.-G., E.G.-R., M.A.-M., C.A.-C. and J.A.-A.; visualization, M.A.-M., C.A.-C. and J.A.-A.; supervision, G.G.-R. and J.C.-G.; project administration, A.M.-B. and G.G.-R. All authors have read and agreed to the published version of the manuscript.

Funding

This research received no external funding.

Data Availability Statement

Not applicable.

Conflicts of Interest

The authors declare no conflict of interest.

References

  1. Almeida, A.D.; Fong, J.; Brunner, C.U.; Werle, R.; Werkhoven, M.V. New technology trends and policy needs in energy efficient motor systems—A major opportunity for energy and carbon savings. Renew. Sustain. Energy Rev. 2019, 115, 109384. [Google Scholar] [CrossRef]
  2. Marwan, M. The impact of probability of electricity price spike and outside temperature to define total expected cost for air conditioning. Energy 2020, 195, 116994. [Google Scholar] [CrossRef]
  3. Wu, J.; Liu, C.; Li, H.; Ouyang, D.; Cheng, J.; Wang, Y.; You, S. Residential air-conditioner usage in China and efficiency standardization. Energy 2017, 119, 1036–1046. [Google Scholar] [CrossRef]
  4. Kumar, L.; Hasanuzzaman, M.; Rahim, N.A. Global advancement of solar thermal energy technologies for industrial process heat and its future prospects: A review. Energy Convers. Manag. 2019, 195, 885–908. [Google Scholar] [CrossRef]
  5. Lazzarin, R. Heat pumps and solar energy: A review with some insights in the future. Int. J. Refrig. 2020, 116, 146–160. [Google Scholar] [CrossRef]
  6. Gugulothu, R.; Somanchi, N.S.; Banoth, H.B.; Banothu, K. A Review on Solar Powered Air Conditioning System. Procedia Earth Planet. Sci. 2015, 11, 361–367. [Google Scholar] [CrossRef]
  7. Gupta, A.; Choudhary, S.; Thakur, A.; Roy, K. A Review on Solar Powered Air Conditioning System. Int. Res. J. Eng. Technol. 2016, 3, 2314–2318. [Google Scholar]
  8. Brahim, T.; Jemni, A. Economical assessment and applications of photovoltaic/thermal hybrid solar technology: A review. Sol. Energy 2017, 153, 540–561. [Google Scholar] [CrossRef]
  9. Herez, A.; Hage, H.E.; Lemenand, T.; Ramadan, M.; Khaled, M. Review on photovoltaic/thermal hybrid solar collectors: Classifications, applications and new systems. Sol. Energy 2020, 207, 1321–1347. [Google Scholar] [CrossRef]
  10. Eicker, U.; Pietruschka, D.; Schmitt, A.; Haag, M. Comparison of photovoltaic and solar thermal cooling systems for office buildings in different climates. Sol. Energy 2015, 118, 243–255. [Google Scholar] [CrossRef]
  11. Guo, X.; Zhang, S.; Wang, D.; Peng, N.; Zhang, X. Techno-economic feasibility study of an electric-thermal coupling integrated energy system for commercial buildings in different latitudes. Int. J. Energy Res. 2020, 44, 7789–7806. [Google Scholar] [CrossRef]
  12. Huide, F.; Xuxin, Z.; Lei, M.; Tao, Z.; Qixing, W.; Hongyuan, S. A comparative study on three types of solar utilization technologies for buildings: Photovoltaic, solar thermal and hybrid photovoltaic/thermal systems. Energy Convers. Manag. 2017, 140, 1–13. [Google Scholar] [CrossRef]
  13. Leite, G.D.N.P.; Weschenfelder, F.; Araújo, A.M.; Ochoa, Á.V.; Neto, N.D.F.P.; Kraj, A. An economic analysis of the integration between air-conditioning and solar photovoltaic systems. Energy Convers. Manag. 2019, 185, 836–849. [Google Scholar] [CrossRef]
  14. Mahmoudi, M.; Dehghan, M.; Haghgou, H.; Keyanpour-Rad, M. Techno-economic performance of photovoltaic-powered air conditioning heat pumps with variable-speed and fixed-speed compression systems. Sustain. Energy Technol. Assess. 2021, 45, 101113. [Google Scholar] [CrossRef]
  15. Wang, K.; Herrando, M.; Pantaleo, A.M.; Markides, C.N. Technoeconomic assessments of hybrid photovoltaic-thermal vs. conventional solar-energy systems: Case studies in heat and power provision to sports centers. Appl. Energy 2019, 254, 113657. [Google Scholar] [CrossRef]
  16. Salilih, E.M.; Birhane, Y.T. Modelling and performance analysis of directly coupled vapor compression solar refrigeration system. Sol. Energy 2019, 190, 228–238. [Google Scholar] [CrossRef]
  17. Su, P.; Ji, J.; Cai, J.; Gao, Y.; Han, K. Dynamic simulation and experimental study of a variable speed photovoltaic DC refrigerator. Renew. Energy 2020, 152, 155–164. [Google Scholar] [CrossRef]
  18. Chen, Y.; Liu, Y.; Liu, J.; Luo, X.; Wang, D.; Wang, Y.; Liu, J. Design and adaptability of photovoltaic air conditioning system based on office buildings. Solar Energy 2020, 202, 17–24. [Google Scholar] [CrossRef]
  19. Kumar, D.; Zare, F.; Ghosh, A. DC Microgrid Technology: System Architectures, AC Grid Interfaces, Grounding Schemes, Power Quality, Communication Networks, Applications, and Standardizations Aspects. IEEE Access 2017, 5, 12230–12256. [Google Scholar] [CrossRef]
  20. Huang, B.J.; Hou, T.F.; Hsu, P.C.; Lin, T.H.; Chen, Y.T.; Chen, C.W.; Lee, K.Y. Design of direct solar PV driven air conditioner. Renew. Energy 2016, 88, 95–101. [Google Scholar] [CrossRef]
  21. Mishra, R.; Chaulya, S.K.; Prasad, G.M.; Mandal, S.K.; Banerjee, G. Design of a low cost, smart and stand-alone PV cold storage system using a domestic split air conditioner. J. Stored Prod. Res. 2020, 89, 101720. [Google Scholar] [CrossRef]
  22. Liu, Z.; Li, A.; Wang, Q.; Chi, Y.; Zhang, L. Performance study of a quasi grid-connected photovoltaic powered DC air conditioner in a hot summer zone. Appl. Therm. Eng. 2017, 121, 1102–1110. [Google Scholar] [CrossRef]
  23. Aguilar, F.J.; Aledo, S.; Quiles, P.V. Experimental analysis of an air conditioner powered by photovoltaic energy and supported by the grid. Appl. Therm. Eng. 2017, 123, 486–497. [Google Scholar] [CrossRef]
  24. Beristáin, J.; Pérez, J. Convertidor bidireccional CD-CA trifásico con aislamiento en alta frecuencia: Modelado utilizando funciones de conmutación. Rev. Iberoa Autom. Inf. Ind. 2022, 19, 199–209. [Google Scholar] [CrossRef]
  25. Krause, P.C.; Wasynczuk, O.; Sudhoff, S.D.; Pekarek, S.D. Analysis of Electric Machinery and Drive Systems; John Wiley & Sons: Hoboken, NJ, USA, 2013. [Google Scholar]
  26. Guerrero-Ramirez, E.; Martinez-Barbosa, A.; Contreras-Ordaz, M.A.; Guerrero-Ramirez, G.; Guzman-Ramirez, E.; Barahona-Avalos, J.L.; Adam-Medina, M. DC Motor Drive Powered by Solar Photovoltaic Energy: An FPGA-Based Active Disturbance Rejection Control Approach. Energies 2022, 15, 6595. [Google Scholar] [CrossRef]
  27. Femia, N.; Petrone, G.; Spagnuolo, G.; Vitelli, M. Optimization of Perturb and Observe Maximum Power Point Tracking Method. IEEE Trans. Power Electron. 2005, 20, 963–973. [Google Scholar] [CrossRef]
  28. Raiker, G.A.; Loganathan, U.; Reddy, B.S. Current Control of Boost Converter for PV Interface With Momentum-Based Perturb and Observe MPPT. IEEE Trans. Ind. Appl. 2021, 57, 4071–4079. [Google Scholar] [CrossRef]
  29. Obukhov, S.; Ibrahim, A.; Diab, A.A.Z.; Al-Sumaiti, A.S.; Aboelsaud, R. Optimal performance of dynamic particle swarm optimization based maximum power trackers for stand-alone PV system under partial shading conditions. IEEE Access 2020, 8, 20770–20785. [Google Scholar] [CrossRef]
  30. Eltamaly, A.M.; Farh, H.M.H.; Al Saud, M.S. Impact of PSO Reinitialization on the Accuracy of Dynamic Global Maximum Power Detection of Variant Partially Shaded PV Systems. Sustainability 2019, 11, 2091. [Google Scholar] [CrossRef]
  31. Wang, G.; Song, L. Performance assessment of variable frequency drives in heating, ventilation, and air-conditioning systems. Sci. Technol. Built Environ. 2018, 24, 1075–1083. [Google Scholar] [CrossRef]
  32. Agamloh, E.B. Power and Efficiency Measurement of Motor-Variable-Frequency Drive Systems. IEEE Trans. Ind. Appl. 2017, 53, 766–773. [Google Scholar] [CrossRef]
  33. Hinkkanen, M.; Tiitinen, L.; Mölsä, E.; Harnefors, L. On the stability of volts-per-hertz control for induction motors. IEEE J. Emerg. Sel. Top. Power Electron. 2021, 10, 1609–1618. [Google Scholar] [CrossRef]
  34. Blaabjerg, F.; Teodorescu, R.; Liserre, M.; Timbus, A.V. Overview of control and grid synchronization for distributed power generation systems. IEEE Trans. Ind. Electron. 2006, 53, 1398–1409. [Google Scholar] [CrossRef]
  35. Martinez-Barbosa, A.; Guerrero-Ramírez, G.; Calleja-Gjumlich, J.H.; Guerrero-Ramirez, E.; Adam-Medina, M.; Aguilar, C.; Aguayo-Alquicira, J. Supplementary Material and Data Availability of the Paper Entitled “Modeling and Control of an Air Conditioner Powered by PV Energy and the Grid Using a DC Microgrid”. 2023. Available online: https://figshare.com/s/d07c19c62811b227ed01 (accessed on 16 May 2023).
Figure 1. DC microgrid to power the compressor motor of the air conditioner: (a) operation mode I, (b) operation mode II, (c) operation mode III.
Processes 11 01547 g001
Figure 2. Proposed system to power the compressor motor of the air conditioner using the PV cells and the power grid.
Processes 11 01547 g002
Figure 3. Relationship between line-to-ground, line-to-neutral, and neutral-to-ground voltages of the induction motor and its drive.
Processes 11 01547 g003
Figure 4. Electrical windings of the induction motor.
Processes 11 01547 g004
Figure 5. Equivalent circuits of the output filter coupled to the grid.
Processes 11 01547 g005
Figure 6. Block diagram with the relationship of the main equations of the proposed system.
Processes 11 01547 g006
Figure 7. Flowchart of the P&O algorithm to track the MPP.
Processes 11 01547 g007
Figure 8. Flowchart of the PSO to track the MPP.
Processes 11 01547 g008
Figure 9. (a) On/off control, and (b) VFD.
Processes 11 01547 g009
Figure 10. The control scheme of the VFD in the induction motor drive.
Processes 11 01547 g010
Figure 11. Control scheme to manage the power flow between the DC bus and the grid.
Processes 11 01547 g011
Figure 12. Validation of the system’s model in the Matlab/Simulink environment.
Processes 11 01547 g012
Figure 13. (a) The average duty cycle of the DC/DC boost converter d , (b) PV cell’s current i p v , (c) PV cell’s voltage v p v , (d) error between model and block diagram for v p v , (e) converter inductor current i L , (f) error between model and block diagram for i L .
Processes 11 01547 g013
Figure 14. (a) modulation index u a i m , (b) velocity ω r m , (c) error between model and block diagram for ω r m , (d) stator current i q s , (e) stator current i d s , (f) rotor current i q r , (g) rotor current i d s , (h) error between model and block diagram for i q s , (i) error between model and block diagram for i d s , (j) error between model and block diagram for i q r , (k) error between model and block diagram for i d s , (l) stator voltage v q s , (m) stator voltage v d s , (n) error between model and block diagram for v q s , (o) error between model and block diagram for v d s .
Processes 11 01547 g014aProcesses 11 01547 g014b
Figure 15. (a) Modulation index u a g , (b) grid currents in the q d 0 framework, (c) grid currents in the a b c framework i a g , (d) error between model and block diagram for i a g , (e) current THD.
Processes 11 01547 g015
Figure 16. (a) DC bus voltage v d c , (b) error between model and block diagram for v d c , (c) powers of the different stages.
Processes 11 01547 g016
Figure 17. (a) Irradiance, (b) average duty cycle of the DC/DC boost converter d , (c) zoom of d , (d) PV cell’s current i p v , (e) PV cell’s voltage v p v , (f) error between model and block diagram for v p v , (g) converter inductor current i L , (h) error between model and block diagram for i L , (i) DC bus voltage v d c , (j) error between model and block diagram for v d c , (k) velocity ω r m , (l) error between model and block diagram for ω r m , (m) grid currents in the q d 0 framework, (n) grid current in the a b c framework i a g , (o) powers of the different stages.
Processes 11 01547 g017aProcesses 11 01547 g017b
Figure 18. (a) The average duty cycle of the DC/DC boost converter d , (b) DC bus voltage v d c , (c) error between model and block diagram for v d c , (d) converter inductor current i L , (e) error between model and block diagram for i L , (f) velocity ω r m , (g) error between model and block diagram for ω r m , (h) current THD, (i) powers of the different stages.
Processes 11 01547 g018
Table 1. Switching functions in the first branch of the motor drive.
S 1 S 2 i Q 1 v 2
0100
10 i a s v d c
Table 2. Switching functions in the second branch of the motor drive.
S 3
S 4
i Q 3
v 4
0100
10 i b s
v d c
Table 3. Switching functions in the second branch of the motor drive.
S 5
S 6
i Q 5
v 6
0100
10 i c s
v d c
Table 4. Switching functions in the first branch of the linkage converter.
S 7 S 8 i Q 7 v 8
0100
10 i a s v d c
Table 5. Switching functions in the second branch of the linkage converter.
S 9 S 10 i Q 9 v 9
0100
10 i b s v d c
Table 6. Switching functions in the third branch of the linkage converter.
S 11 S 12 i Q 11 v 10
0100
10 i c s v d c
Table 7. Squirrel-cage induction motor parameters.
ParameterMotor 1Motor 2
Nominal mechanical power P n o m 200   W 320   W
Nominal rms voltage line-to-line V s , r m s L L 220   V 220   V
Pole pairs n p 2 2
Nominal velocity ω r m , n o m 1625   r p m 1700   r p m
Nominal stator frequency f s 60   H z 60   H z
Stator resistance r s 11.995   Ω 2.25   Ω
Rotor resistance r r 15.250   Ω 4.57   Ω
Stator reactance X l s 12.190   Ω 1.88496   Ω
Rotor reactance X l r 12.190   Ω 1.88496   Ω
Magnetizing reactance X M 209.740   Ω 13.80918   Ω
Inertia coefficient J 4.6423 × 10 4   k g / m 2 0.09 × 10 3   k g / m 2
Friction factor B 0 0
Maximum torque applied τ L , m a x 1.25   N · m 2.00   N · m
Table 8. Solar panel parameters.
ParameterValue
Maximum power point * P m p p 213.15   W
MPP voltage * v m p p 29.00   V
MPP current * i m p p 7.35   A
Open-circuit voltage v o c 36.30   V
Short-circuit current i s c 7.84   A
* Performance under standard test conditions (STC).
Table 9. System design parameters.
ParameterValue
Input capacitor C i 400   μ F
Inductor of the DC/DC boost converter L 0.005   H
Inductor resistance r L 0.1   Ω
DC bus capacitor C d c 400   μ F
Interconnected stages resistance R d c 2000   Ω
Switching frequency of the DC/DC boost converter f b o o s t 50   k H z
Switching frequency of the linkage converter f l k 10   k H z
Switching frequency of the motor drive f i m 10   k H z
Grid rms voltage line-to-line v g , r m s L L 220   V
Grid frequency f g 60   H z
Filter inductor L g 0.020   H
Filter inductor resistance r g 0.5   Ω
Table 10. P&O parameters.
ParameterValue
Sample time t s , P & O 0.005 s
Perturbation to the duty cycle D 0.005
Table 11. PSO parameters.
ParameterValue
Sample time t s , P S O 0.020 s
Size of the swarm P 4 particles
Threshold ε 0.05
Inertia coefficient ω P S O 0.7298
Cognitive acceleration coefficient c 1 1.4962
Social acceleration coefficient c 2 1.4962
Initial position of the first particle d 1 [ 0 ] 0.15
Initial position of the second particle d 2 [ 0 ] 0.30
Initial position of the third particle d 3 [ 0 ] 0.45
Initial position of the fourth particle d 4 [ 0 ] 0.60
Table 12. VFD parameters.
ParameterValue
Reference velocity at minimum VFD condition ω r m , m i n 350   r p m
Reference velocity at maximum VFD condition ω r m , m a x 1500   r p m
Proportional gain of the PI controller k p , V F D 200
Integral gain of the PI controller k i , V F D 80
Table 13. Linkage converter control parameters.
ParameterValue
Reference DC bus voltage v d c * 400   V
Proportional gain of the PI 1 controller k p 1 50
Integral gain of the PI 1 controller k i 1 200
Proportional gain of the PI 2 controller k p 2 50
Integral gain of the PI 2 controller k i 2 200
Proportional gain of the PI 3 controller k p 3 50
Integral gain of the PI 3 controller k i 3 200
Disclaimer/Publisher’s Note: The statements, opinions and data contained in all publications are solely those of the individual author(s) and contributor(s) and not of MDPI and/or the editor(s). MDPI and/or the editor(s) disclaim responsibility for any injury to people or property resulting from any ideas, methods, instructions or products referred to in the content.