Abstract
In multi-energy power grids in which electric vehicles (EVs) participate in response, there are significant differences in the power balance between multi-energy supply and load at different time scales and spatial scales. To optimize the energy balance demand of each region, this paper proposes a dynamic partition coordination model for power grid energy regulation demand that considers the willingness of electric vehicles to respond and the uncertainties related to sources, loads, and storage. Firstly, the charging and discharging characteristics of multi-energy conversion devices in power grids, as well as the response uncertainties of these devices, are studied, and a source, load, and storage uncertainty model is established. Then, based on the Markov random field theory and the energy prior model, the dynamic partition model and its solution algorithm for the multi-energy power grid are proposed. Finally, a simulation system is established based on the actual operating data of a multi-energy power grid, and the proposed method is simulated and analyzed. The results indicate that the energy balance partition optimization method proposed in this article is effective. The application of the method proposed in this article can fully leverage the regulatory potential of energy conversion equipment, effectively reduce the proportion of traditional energy supply and peak shaving capacity, and improve the utilization rate of renewable energy.
1. Introduction
With the development and utilization of new energy, the large-scale grid connection of new energy has brought many challenges to the smooth and efficient operation of traditional power grids, among which the energy exchange and balance issues between regional interconnected systems of multiple energy grids are noteworthy [1,2]. When the energy balance adjustment of a multi-energy grid is required at various time scales, the energy imbalance often starts from a certain node or a local area of the multi-energy grid. In most cases, it is neither necessary nor advisable to adjust the energy balance from the overall perspective of the multi-energy grid network, and doing so may even lead to an increase in network loss. Instead, according to the peak shaving demand of the multi-energy grid in different peak shaving capacities and different energy forms, realizing the peak shaving optimization of different energy forms of multi-energy grid will lead to quickly and accurately judge the local areas or nodes with energy imbalances and the energy forms of energy regulation demand of the multi-energy grid [3,4,5,6].
At present, domestic and foreign scholars have carried out a lot of research on the energy regulation demand of multi-energy grids. Reference [7] proposed a multi-energy participant (MEP) behavior prediction model based on signal price coupling that optimizes the energy balance of multi-energy systems based on signal price. An energy control method based on a multi-energy energy storage system was proposed in [8] to optimize power grids in consideration of economy and stability. The modified prediction percentage of dissatisfaction (PPD) index, related to thermal environment parameters, was introduced in [9] to realize a comprehensive evaluation of energy storage. Different power grid optimization methods were analyzed in [10], considering the accuracy, complexity, and stability of the studied models, and a dynamic optimal energy flow model was established based on the multi-objective optimization method. Reference [11] mainly studied the frequency regulation and carbon emission reduction regulation capabilities of multi-energy storage devices in power systems.
In [12], a new flexible supply-demand balance analysis system for multi-energy systems was proposed considering the spatial correlation modeling and time sequence connection of component states. Reference [13] proposed an economic dispatch model for multi-energy systems based on marginal prices that enhanced the multi-energy complementary regulation capability of multi-energy systems by reducing the regulation cost of multi-energy units.
EVs can play a flexible regulatory role in the power system with their schedulable potential [14]. Reference [15] considered charging uncertainty and energy satisfaction while modeling EVs, and took EVs to be the main flexible resources to participate in the economic dispatch of the power system. However, under that study’s scheduling architecture, the power system dispatch center needed to process a large amount of EV user data and perform power system optimization scheduling, resulting in complex and heavy computational tasks. Considering the small battery capacity and low charging and discharging power of a single EV, the data volume of EV users is large. Reference [16] proposed a charging-station-based electric vehicle scheduling strategy based on game theory. In the proposed strategy, the charging time of electric vehicles was planned with the goal of minimizing the imbalance between supply and demand in the power grid.
At present, the literature provides some theoretical support for energy regulation in multi-energy grids, but it has not fully considered the response willingness and uncertainty of electric vehicles [17] and the dynamic zoning coordination of multi-energy grids. There is still great room for improvement in optimizing the coordination of energy regulation demand in multi-energy grids [18].
This article proposes a dynamic zoning coordination model for energy regulation demand in multi-energy grids, taking into account the willingness of electric vehicles to respond and the uncertainty of grid source, load, and storage. Firstly, considering the uncertainty of electric vehicle response willingness and new energy sources, loads, and multi-energy storage, a source load storage uncertainty model is established. Then, the energy balance correlation between the adjacent nodes of a multi-energy power system network is measured according to the characteristic index of multi-energy balance correlation measurement, and a regional division model of multi-energy balance based on a high-order Markov random field of multi-energy balance correlation is established. Then, by studying the high-order topological structure prior model and Markov random field model of multi-energy balance characteristics, the dynamic division model of multi-energy balance area and its solution algorithm are proposed. Finally, the effectiveness of the proposed model in this paper is verified by constructing a simulation of multi-energy balance zoning characteristics and optimizing the energy regulation demand of multi-energy power systems.
2. Source, Load, and Storage Uncertainty Model
2.1. Uncertainty Model of Electric Vehicles
- (1)
- EV Energy Boundary Model
The feasible range of charging and discharging for EVs can be described by their energy and power boundaries, that is , the feasible set representing all possible charge and discharge trajectories. The corresponding electricity and power boundaries are represented as follows:
where is the sequential number of the electric vehicle, and are the electric quantity and power of the EV at time t, respectively, is the initial battery level when the EV is connected to the network, is the battery level when the EV is off the grid, and are the rated capacity and initial SOC of the EV, respectively, and are the upper and lower boundaries of the electric quantity and power of the EV at time t, and are the times when EV enters and leaves the network, respectively, is the maximum value of EV power, is the minimum threshold of battery capacity to prevent the excessive discharge of the EV, and are the rated charging power and discharge power of the EV, and and are the charging efficiency and discharge efficiency of the EV.
- (2)
- Uncertainty Model of Electric Vehicle Response
In practice, the uncertainty of EV users’ response behavior is caused by factors such as travel habits and sensitivity to incentive levels [19]. Taking into account this uncertainty, the schematic diagram of EV users’ willingness to respond is shown in Figure 1. The black solid line in the figure represents the EV user response willingness curve based on consumer psychology principles, and the area in the figure can be divided into the dead zone, linear zone, and saturation zone as the incentive price changes. The red dashed line represents the maximum fluctuation curve of EV response willingness.
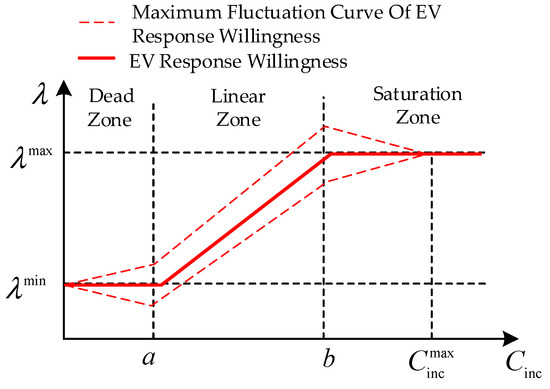
Figure 1.
Schematic diagram of the uncertainty in EV user response intention.
From Figure 1, it can be seen that in the dead zone and linear zone, when the incentive level is not high enough, the response uncertainty mainly depends on non-economic factors. EV users’ willingness to respond increases with an increase in incentive prices, and the response uncertainty also increases in this situation. In the saturation zone, the incentive level is sufficiently attractive to users, and the response uncertainty is mainly determined by economic factors. As the incentive level increases, the response willingness has reached its upper limit, but the response uncertainty gradually decreases to zero.
EV users’ willingness to respond and response bias are calculated thus:
Here, is the willingness of EV users to respond under incentive compensation , and . The larger the value of is, the stronger the user’s willingness to respond becomes. is the maximum fluctuation range in response to willingness, a and b are the excitation levels for the dead zone inflection points and saturation zone inflection points, respectively, is the upper limit of the incentive level, and are the maximum and minimum response willingness coefficients of users, respectively, and , , and are constant coefficients.
2.2. Energy Uncertainty Model for Renewable Energy Sources
- (1)
- Energy Uncertainty Model of Wind Power Supply
Assuming that the uncertainty of energy output for each wind farm station in the multi-energy grid follows a normal distribution [20], the wind power energy output characteristics considering uncertainty can be expressed thus:
where is the energy output of the wind power generation system within a time interval , is the wind power output under the condition that the wind speed in the wind farm is higher than the inlet wind speed and lower than the rated wind speed, is the wind power output when the wind speed in the wind farm is higher than the rated wind speed and lower than the cutout wind speed, is the uncertainty of wind power output when the wind speed inside the wind farm is higher than the wind speed inside the wind farm and lower than the rated wind speed, is the uncertainty of wind power output when the wind speed in the wind farm is higher than the rated wind speed and lower than the cutout wind speed, is the moment when the wind speed in the wind farm is higher than the start of the wind speed, is the moment when the wind speed in the wind farm is higher than the start time of the rated wind speed, and is the moment when the wind speed in the electric field is higher than the start time of the cutting wind speed.
The probability distribution function of the wind power output uncertainties and can be expressed thus:
where and represent the maximum uncertainties of wind power output under different wind speed conditions.
- (2)
- Energy Uncertainty Model of Photovoltaic Power Supply
It is assumed that the uncertainty of energy output for photovoltaic power stations in the multi-energy grid follows normal distribution at time intervals . Then, the photovoltaic energy output characteristics considering uncertainty can be expressed thus:
where is the energy output of photovoltaic power generation system over time intervals , is the photovoltaic output power when the solar radiation intensity in the photovoltaic power station is higher than the minimum intensity and lower than the rated intensity, is the photovoltaic output power when the solar radiation intensity in the photovoltaic power station is higher than the rated intensity, is the uncertainty of photovoltaic power output when the solar radiation intensity in a photovoltaic power station is higher than the minimum required intensity and lower than the rated intensity, is the uncertainty of photovoltaic power output when the solar radiation intensity of photovoltaic power station is higher than the rated intensity, is the starting time when the solar radiation intensity in the photovoltaic power station is higher than the minimum required intensity, is the moment when the solar radiation intensity in the photovoltaic power station is higher than the initial rated intensity, is when the solar radiation intensity in the photovoltaic power station is higher than the end of the rated intensity, and is the starting time when the solar radiation intensity in the photovoltaic power station is lower than the minimum required intensity.
The probability distribution function of the energy output uncertainties of the photovoltaic power generation system, and , can be expressed thus:
where and represent the maximum uncertainty of photovoltaic power generation system output under different conditions of solar radiation intensity.
2.3. Load Uncertainty Model
Assuming that the load power consumption uncertainty follows normal distribution in time intervals [21], the energy property considering uncertainty can be expressed thus:
where is the total power demand curve for electric load, electric heating load, and electric hydrogen production load in a multi-energy grid, is the uncertainty of the total power demand of electric load, electric heating load, and electric hydrogen production load in a multi-energy network, and is the total energy demand of electric load, electric heating load, and electric hydrogen production load in the multi-energy power grid.
can satisfy the following probability distribution function:
where , , and represent the uncertainties of electric load, electric heating load and electric hydrogen production load in actual operation, respectively, and , , and represent the maximum uncertainties of electric load, electric heating load, and electric hydrogen production load that may occur in actual operation, respectively.
2.4. Multi-Energy Storage Uncertainty Model
When considering the uncertainty of energy dissipation characteristics, as well as the uncertainty of energy storage and release in the charging and releasing process, within a given time , the charge states of heat storage, electricity storage, and hydrogen storage facilities can be expressed as follows:
where , , and represent the charge states of heat storage, electricity storage, and hydrogen storage facilities at time t, respectively, , , and represent the energy dissipation coefficients of heat, electricity, and hydrogen storage facilities, respectively, , , and represent the uncertainties of the charge states of heat storage, electricity storage, and hydrogen storage facilities corresponding to time t, respectively, , , and represent the energy conversion efficiencies of heat storage, electricity storage, and hydrogen storage facilities within time intervals , respectively, and , , and represent the state variables of heat, electricity, and hydrogen storage facilities within time intervals , respectively. When , , and are equal to +1, heat storage, electricity storage, and hydrogen storage facilities operate in a charged state. When , , and are equal to −1, heat storage, electricity storage, and hydrogen storage facilities operate in a state of discharge. , , and represent the charging and discharging powers of heat, electricity, and hydrogen storage facilities, respectively.
In the above equation, the probability distribution of actual charge state deviations , , and of electric, thermal, and hydrogen energy storage facilities, respectively, in the multi-energy power system can be described thus:
where , , and represent the maximum uncertainties of the charge states of heat storage, electricity storage, and hydrogen storage facilities in multi-energy power system at time t, respectively.
3. Multi-Node Multi-Energy Correlation Measure with Higher-Order Markov Random Field Model (MMCM-HMRF)
In order to achieve partitioned energy coordination in multi-energy grids, this section studies the description method of heterogeneous energy balance in multi-energy grids and proposes a multivariate multi-energy flow intensity measurement method based on the Multi-energy Correlation Measure (MCM) feature index.
Then, the MMCM-HMRF model based on the Markov Random Field (MRF) [22] is established. This model can achieve the quantitative description of the multivariate topological structure relationship between adjacent nodes in multi-energy power systems, reflecting the energy balance characteristics.
3.1. Multi-Energy Correlation Measure Model (MCM)
The set of state variables for multi-energy injection or consumption at nodes in a multi-energy power system can be described thus:
where represent the electricity, heat, and hydrogen energy injection values or consumption value of node in the multi-energy power system and is the total number of nodes in the multi-energy power system.
Suppose represent the state variables of multi-energy energy interaction between any two adjacent nodes in the network. The more energy interaction there is between two adjacent nodes and , the stronger the multi-energy energy correlation between nodes and will be. The multi-energy energy balance correlation between two adjacent nodes can be defined as shown below:
where represents the Euclidean distance between the two adjacent nodes of the multi-energy power system network and the multi-energy energy injection or consumption state variable , .
The index matrix of is depicted below:
is a symmetric and non-negative energy balance correlation matrix. This matrix transforms the correlation degree matrix of the energy balance relationship between adjacent nodes in a multi-energy power system network into a multi-variable high-order multi-energy energy state variable matrix. Based on the index of the multi-energy energy state variable, a high-order multi-energy energy balance correlation constraint of the energy balance relationship between adjacent nodes in the network is established, so as to introduce the high-order topological spatial correlation of the energy balance relationship between adjacent nodes in the multi-energy power system network, which in turn will achieve a better expression of the local spatial characteristics of multi-energy state variables.
3.2. MMCM-HMRF Model Based on MRF
In order to measure the multi-energy balance correlation of adjacent nodes in a multi-energy power system, firstly, the Euclidean Distance between nodes and is calculated, and the energy balance correlation between adjacent nodes is normalized, so that . The normalization function is as follows:
where represents the Euclidean distance between adjacent nodes in a multi-energy power system and is the normalized scaling parameter such that the smaller the value of is, the smaller the correlation of energy balance between adjacent nodes in the multi-energy power system network will be at the same distance.
The Euclidean distance measurement vector of the local region of the multi-energy power system can be calculated thus:
In order to convert the multi-energy energy balance correlation between adjacent nodes in a multi-energy power system network into a connection strength, is converted into an adjacency strength measurement vector, , by using the power adjacency function. The power adjacency function is defined as follows:
where represents the adjacency matrix weight of between adjacent nodes in a multi-energy power system network. , the power adjacency parameter between adjacent nodes in a multi-energy power system network, can enhance the connection strength of adjacent nodes in a strongly correlated multi-energy power system network.
Therefore, the adjacency matrix enhances the multi-energy energy balance correlation of strongly correlated multi-energy power system nodes, and effectively maintains the continuity of expression information of adjacent nodes in the multi-energy power system network. The adjacency strength measurement vector of the local region of the multi-energy power system established with multi-energy energy balance characteristics is expressed as follows:
Let the high-order topological space prior of the local region of the multi-energy power system be expressed thus:
where , , , and represent adjacent nodes of which have energy interaction in MRF.
The higher order prior energy term based on is defined as follows:
where represents the prior energy of the higher-order topological structure in the local region and represents the connection strength of the nodes and .
4. Multi-Energy Power Grid Partition Model Based on Energy Balance Demand
On the basis of the MMCM-HMRF model established earlier, this section studies the energy balance demand characteristics of the multi-energy power grid and establishes a second-order MRF model for the equilibrium state of multi-energy regions. Then, a second-order MRF model for the equilibrium state of multi-energy regions is established, and a dynamic partitioning method for multi-energy balance demand based on the Weighted Gaussian Mixture Model (WGMM) model is proposed.
4.1. Second-Order MRF Model for Equilibrium States of Multi-Energy Regions
Before establishing the second-order MRF model for the multi-energy power grid, it is necessary to study the probability characteristics of regional energy balance states in the multi-energy power grid. This section analyzes the energy balance status of nodes in the multi-energy power grid and establishes a Weighted Gaussian Mixture Model (WGMM) that can reflect the consistency of label classification for different types of energy forms [23].
For node in a multi-energy power grid area, the set of adjacent node state variables with energy interaction is defined as , such that:
The WGMM likelihood model consistent with the label classification of the node energy balance state of the multi-energy power system and different energy forms is:
where represents the label classification parameter of the node’s energy balance state and its different energy forms, , and are the mean and variance of the distribution for the l-th label classification, , represents the total number of labels for multi-energy energy balance region division, and is the normalization function. When , is the number of multi-energy power system nodes in the region. is a weight function containing spatial information.
Next, a second-order MRF model for the equilibrium state of multi-energy regions is established. In local region of the multi-energy power system network, label field of the multi-energy energy imbalance classification is an MRF based on the multi-energy energy balance state within the region. The label field is described by the prior model, and the second-order prior model based on the multi-energy energy imbalance region in the multi-energy power system network is obtained as follows:
where is the normalized constant of the multi-energy energy imbalance probability, is the multi-energy imbalance probability parameter, and is a function such that:
In local region of the multi-energy power system, when the center energy balance label is not equal to the adjacent energy balance label , punishment is administered thus:
The penalty value is 0 only if and are equal. Therefore, the second-order prior energy model for the multi-energy unbalanced region in the multi-energy power grid is as follows:
As can be seen from the above equation, in local region of the multi-energy power system network, when labels of more network nodes in the region tend to be consistent, the penalty value tends to 0. For the local area of the multi-energy power system with different kinds of tags, the inconsistency penalty value increases with an increase in the number of inconsistent values of nodes or expected tags of energy imbalance. This kind of regional category consistency constraint can effectively improve the edge effect of the multi-energy energy balance region division results, and it is robust to the interference of the multi-energy energy balance characteristic noise or texture signal.
4.2. Dynamic Partitioning Solution for Multi-Energy Power Grid Based on Energy Balance Demand
Based on the established WGMM model and the second-order MRF model of the multi-energy region equilibrium state, the network can be divided into regions according to the energy balance requirements. A power grid division model is established as follows:
where represents the likelihood energy of local area consistency in the multi-energy power grid, represents the second-order prior energy, represents the prior energy of the higher-order topological structure, and .
The process of dividing the power grid into regions based on energy balance requirements, which is done to solve the optimal estimated label field , can be expressed thus:
The steps for dividing the power grid into regions based on energy balance requirements are as follows:
Step 1: Input the set of state variables of nodes in the multi-energy power system . Given that the number of classification labels, the mean and variance of , and are randomly initialized, the prior parameter is given by an experiment where .
Step 2: Calculate the higher-order topological structure prior energy of the local area of the multi-energy network based on the pre-partition results of the multi-energy network region .
Step 3: Calculate the mean and variance of WGMM model label distribution in the local region .
Step 4: For each multi-energy power system node, calculate the energy allocated to the label in its local area: .
Step 5: Calculate the global energy . If is a small constant, then and the algorithm terminates, outputting the optimal label field . Otherwise, go back to Step 2 to continue the process of iteration.
5. Example Analysis
This section establishes a simulation system based on the actual operating data of the Liaoning power grid, the multi-energy power system topology structure that includes flexible adjustment resources such as new energy sources represented by wind and solar power generation, electric heat storage, electric hydrogen storage and hydrogen fuel cells, chemical battery energy storage, thermal power and hydropower, and other traditional synchronous power sources, as shown in Figure 2, there are 30 multi-energy nodes in the power grid. In Figure 2, nodes 1, 2, and 3 are new energy nodes, and nodes 3, 4, and 5 are electric heat storage nodes, electric hydrogen storage and fuel cell nodes, and chemical cell nodes, respectively. Nodes 13 and 27, 23, and 22 are thermal power, hydropower, and gas power generation nodes, respectively. It is assumed that the central control center is located at six nodes—6, 7, 8, 17, 18, and 27—with 200 electric vehicles in each area.
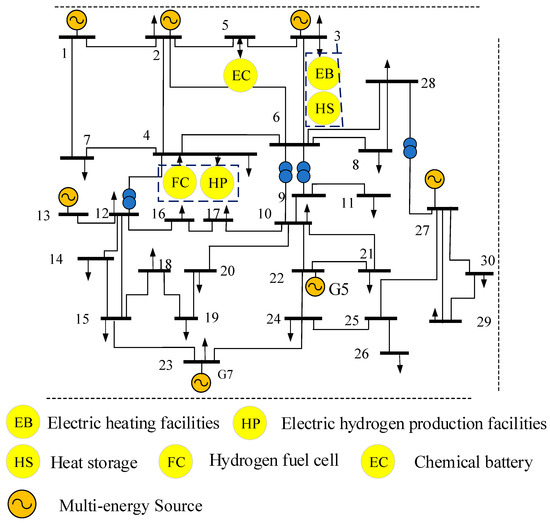
Figure 2.
Topology of the new energy power system.
According to the topology structure in Figure 2, with reference to the actual power supply and load situation of the power grid, the simulation example parameters are set as shown in Table 1 and Table 2. The typical new energy power output, load, and energy storage power curves of the system are shown in Figure 3 and Figure 4, and the uncertainty curves of the power supply, load, energy storage, and electric vehicle in the system are shown in Figure 4.

Table 1.
Parameter table of multi-energy power system.

Table 2.
Electric Vehicle Parameter Table.
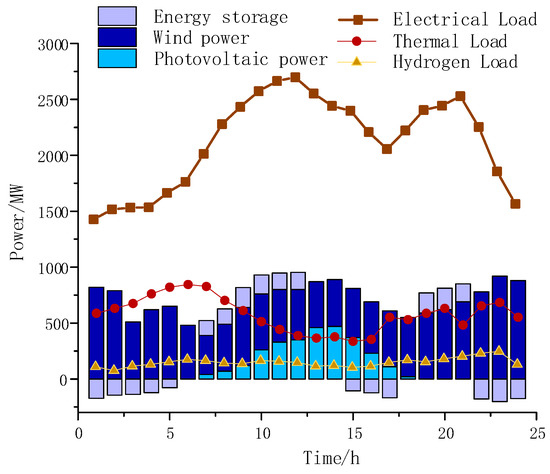
Figure 3.
Typical new energy power output, load, and energy storage power curve of the system.
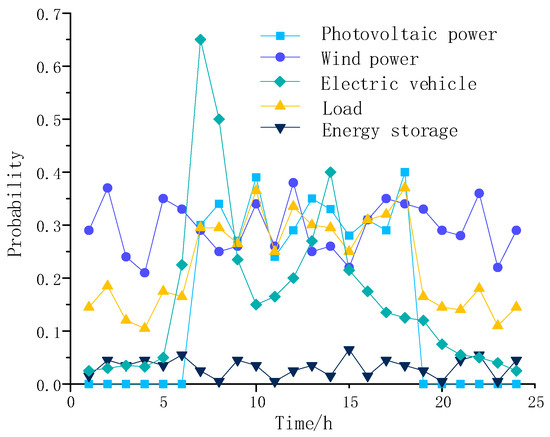
Figure 4.
Uncertainty distribution curve of typical new energy power output, load, energy storage, and electric vehicle response in the system.
5.1. Simulation Analysis of Multi-Energy Power Grid Partition
The following is a simulation verification of the dynamic partitioning method for energy balance in multi-energy networks that is proposed in this article. Before solving the partitioning problem, the pre-partitioning results of the multi-energy network are shown in Figure 5.
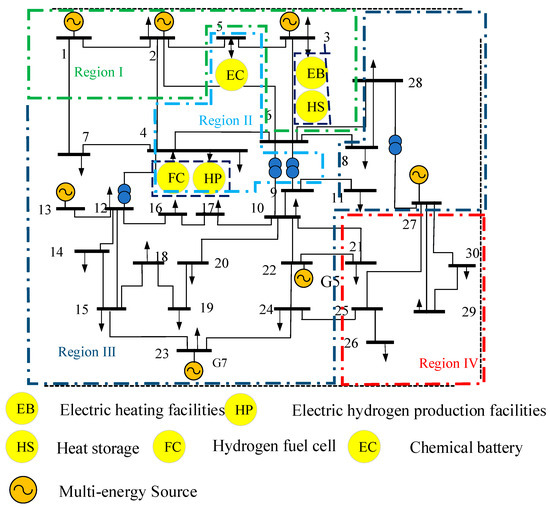
Figure 5.
Pre-partition result of the multi-energy power grid.
The energy balance zoning optimization model established in this article is used to solve the zoning problem. Based on the pre-partitioning results shown in Figure 5, combined with the system source, load, and storage operating states and uncertainties shown in Figure 3 and Figure 4, the multi-energy system is partitioned according to the energy balance adjustment requirements. The result of the multi-energy power grid partition is shown in Figure 6.
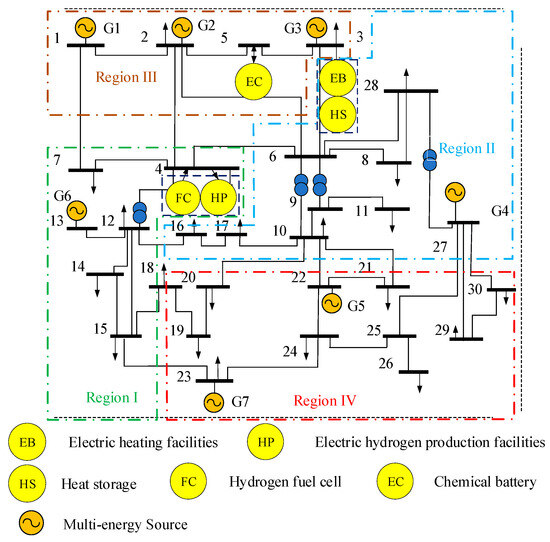
Figure 6.
Partition result of the multi-energy power grid.
Due to the configuration of heat storage, electricity storage, and hydrogen storage facilities at certain nodes of a multi-energy power system, the energy balance regulation capabilities for different types of energy in different regions of the power grid are also different. The characteristic of energy balance regulation in multi-energy power systems determines that when optimizing and scheduling multi-energy flexible resource peak shaving, it is necessary to fully consider the distribution characteristics of multi-energy loads, multi-energy storage, and new energy sources in the power grid in order to effectively improve the efficiency and economy of multi-energy peak shaving.
5.2. Energy Balance Analysis of Multi-Energy Power Grid under Partitioned Operation
Based on the energy supply and demand situation, and its uncertainty characteristics in the systems shown in Figure 3 and Figure 4 combined with the power grid pre-partitioning results shown in Figure 5, the corresponding peak shaving capacity curves of the multi-energy power grid can be obtained as shown in Figure 7, Figure 8 and Figure 9.
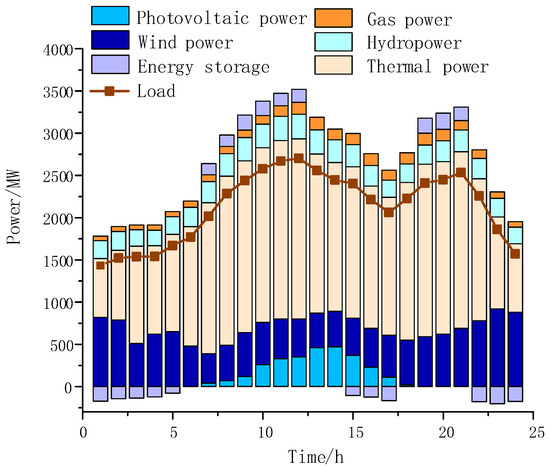
Figure 7.
Peak shaving capacity allocation of electric energy.
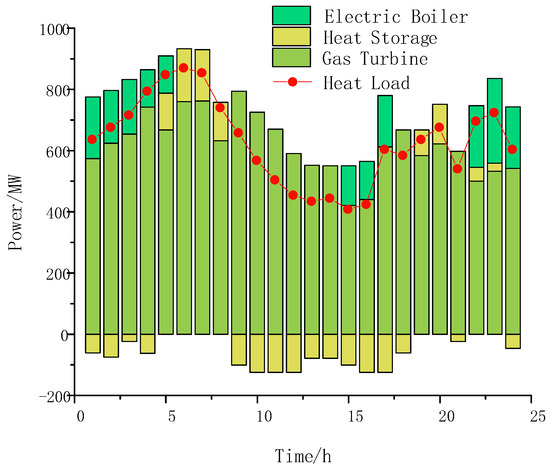
Figure 8.
Peak shaving capacity allocation of thermal energy.
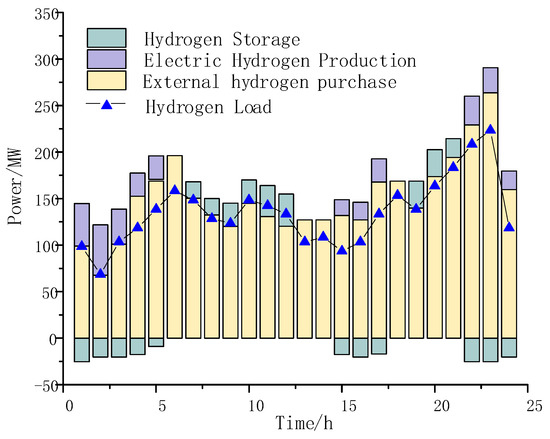
Figure 9.
Peak shaving capacity allocation of hydrogen energy.
From Figure 7, Figure 8 and Figure 9, it can be seen that in order to ensure a high level of power balance in a multi-energy power grid under high uncertainties, it is necessary to configure more flexible resource adjustment units when scheduling plans. At the same time, the reserved adjustment capacity of each flexible resource adjustment unit is also relatively large. At this point, in order to cope with a higher proportion of new energy and with uncertainty, the total adjustment cost of the power grid is high. The large proportion of traditional energy supply methods also brings significant pressure to the improvement of the system’s carbon reduction capacity.
Based on the energy balance partitioning results of the multi-energy power grid shown in Figure 6, the allocation of flexible resource peak shaving capacity in the network after partitioning optimization is shown in Figure 10, Figure 11 and Figure 12.
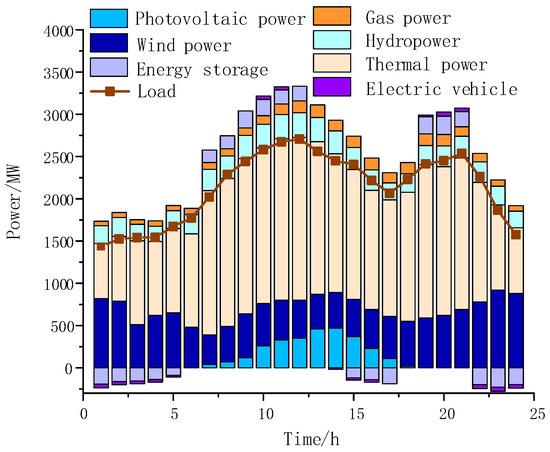
Figure 10.
Peak shaving capacity allocation of electric energy after power grid partitioning.
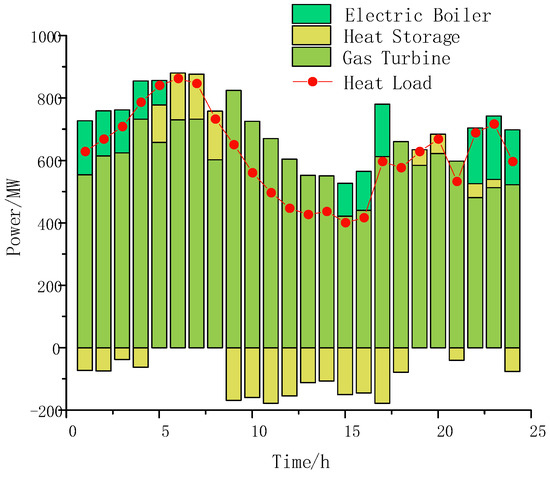
Figure 11.
Peak shaving capacity allocation of thermal energy after power grid partitioning.
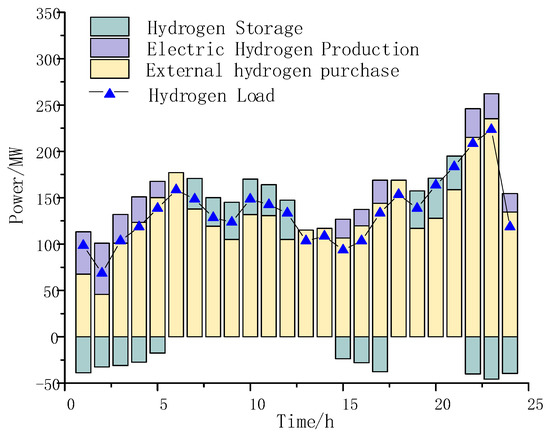
Figure 12.
Peak shaving capacity allocation of hydrogen energy after power grid partitioning.
From Figure 10, Figure 11 and Figure 12, it can be seen that the adjustment depth of the multi-energy conversion device in the optimized network significantly increases throughout the day. The peak shaving reserve capacity of various energy sources decreases by varying degrees throughout all energy supply periods. Overall, the proportion of capacity allocation for traditional energy supply units in these figures has decreased.
Therefore, allocating the peak shaving capacity of a multi-energy power grid based on the optimized partitioning results can effectively coordinate the complementary characteristics of multi-energy regulation resources in different regions or nodes of the system. Furthermore, the regulatory potential of energy conversion equipment is fully utilized in such a scenario, effectively reducing the proportion of traditional energy supply methods and peak shaving capacity and improving the utilization rate of renewable energy. Moreover, after partition optimization, the system can coordinate and dispatch multiple energy sources and storages across the entire network based on the different types of energy regulation characteristics in different regions, effectively reducing the overall peak shaving demand of the entire network.
6. Conclusions
This article proposes a dynamic partitioning model for energy balance in multi-energy power grids that considers the willingness of electric vehicles to respond, and the uncertainties of source, load and storage, to address the significant differences in power and energy balance at different time and spatial scales in multi-energy power grids.
This model is based on a prior model of higher-order topology structure for multi-energy interaction, and can divide the network into regions according to the energy balance requirements of the multi-energy network in consideration. To verify the effectiveness of this model, this paper constructed a simulation model based on actual operating power grid data. The simulation results indicate that:
- (1)
- The energy balance zoning method proposed in this article can fully consider the uncertainties of source, load, and storage in the network and quickly and accurately identify local areas of the multi-energy grid where energy imbalance exists. Furthermore, it can optimize the partitioning of multi-energy networks to achieve the peak shaving optimization of different energy forms and maximize energy utilization.
- (2)
- After partitioning the multi-energy power grid based on the energy balance requirements, the complementary coordination ability between multiple types of energy equipment in the multi-energy network can be fully utilized, effectively reducing the startup mode and peak shaving capacity of traditional energy supply units and improving the utilization rate of renewable energy.
- (3)
- After optimizing the demand for multi-energy balance regulation, the system can coordinate and dispatch the load and storage of multiple energy sources in the entire network based on the different types of energy regulation characteristics in different regions, effectively reducing the total peak shaving demand of the entire network and thus achieving the efficient and stable operation of the multi-energy grid.
Author Contributions
This article was written by S.Q., who carried out the design and data analysis of the main research. K.Z. led the writing of the article, Z.C. (Zhuo Chen) and Y.M. proofread all the drafts, and Z.C. (Zhe Chen) gave guidance to the paper. All authors have made contributions to the writing and revision of the article, and have made suggestions for improvement to ensure that the article can accurately express complex research results. All authors have read and agreed to the published version of the manuscript.
Funding
This research was funded by the National Key Research and Development Program of China (No. 2017YFB0902100).
Data Availability Statement
The simulation analysis part of this article is based on real operating power grid data, and for confidentiality reasons, the data in this article will not be disclosed.
Conflicts of Interest
The authors declare no conflict of interest.
References
- Wang, R.; Ma, D.; Li, M.-J.; Sun, Q.; Zhang, H.; Wang, P. Accurate Current Sharing and Voltage Regulation in Hybrid Wind/Solar Systems: An Adaptive Dynamic Programming Approach. IEEE Trans. Consum. Electron. 2022, 68, 261–272. [Google Scholar] [CrossRef]
- Rui, W.; Qiuye, S.; Dazhong, M.; Xuguang, H. Line Impedance Cooperative Stability Region Identification Method for Grid-Tied Inverters Under Weak Grids. IEEE Trans. Smart Grid 2020, 11, 2856–2866. [Google Scholar] [CrossRef]
- Cesena, E.A.M.; Mancarella, P. Energy Systems Integration in Smart Districts: Robust Optimisation of Multi-Energy Flows in Integrated Electricity, Heat and Gas Networks. IEEE Trans. Smart Grid 2019, 10, 1122–1131. [Google Scholar] [CrossRef]
- Rui, W.; Qiuye, S.; Pinjia, Z.; Yonghao, G.; Dehao, Q.; Peng, W. Reduced-Order Transfer Function Model of the Droop-Controlled Inverter via Jordan Continued-Fraction Expansion. IEEE Trans. Energy Convers. 2020, 35, 1585–1595. [Google Scholar] [CrossRef]
- Huang, W.; Zhang, N.; Yang, J.; Wang, Y.; Kang, C. Optimal Configuration Planning of Multi-Energy Systems Considering Distributed Renewable Energy. IEEE Trans. Smart Grid 2019, 10, 1452–1464. [Google Scholar] [CrossRef]
- Yunshou, M.; Jiekang, W.; Ruidong, W.; Zhihong, C.; Ran, Z.; Lingmin, C.; Wenjie, Z. A Collaborative Demand-Controlled Operation Strategy for a Multi-Energy System. IEEE Access 2021, 9, 80571–80581. [Google Scholar] [CrossRef]
- Damavandi, M.Y.; Bahramara, S.; Moghaddam, M.P.; Haghifam, M.-R.; Shafie-Khah, M.; Catalao, J.P.S. Bi-level approach for modeling multi-energy players’ behavior in a multi-energy system. In Proceedings of the 2015 IEEE Eindhoven PowerTech, Eindhoven, The Netherlands, 29 June–2 July 2015; pp. 1–6. [Google Scholar] [CrossRef]
- Bschorer, S.; Kuschke, M.; Strunz, K. Object-oriented modeling for planning and control of multi-energy systems. CSEE J. Power Energy Syst. 2019, 5, 355–364. [Google Scholar]
- Yan, N.; Zhong, Y.; Li, X.; Wang, Y.; Su, L.; Jiang, W.; Zhou, J. Energy Management Method of Electricity Heat Hydrogen Multi-Coupling System for Retired Power Battery Echelon Utilization in Microgrids. IEEE Trans. Appl. Supercond. 2021, 31, 0604605. [Google Scholar] [CrossRef]
- Zhou, X.; Sang, M.; Bao, M.; Wang, S.; Cui, W.; Ye, C.; Ding, Y. Exploiting Integrated Demand Response for Operating Reserve Provision Considering Rebound Effects. IEEE Access 2022, 10, 15151–15162. [Google Scholar] [CrossRef]
- Greening, B.; Braunholtz-Speight, T.; Wood, R.; Freer, M. Batteries and beyond: Multi-vector energy storage as a tool to decarbonise energy services. Front. Energy Res. 2023, 10, 1109997. [Google Scholar] [CrossRef]
- Yang, H.; Li, M.; Jiang, Z.; Zhang, P. Multi-Time Scale Optimal Scheduling of Regional Integrated Energy Systems Considering Integrated Demand Response. IEEE Access 2020, 8, 5080–5090. [Google Scholar] [CrossRef]
- Jin, H.; Teng, Y.; Zhang, T.; Wang, Z.; Deng, B. A locational Marginal Price-Based Partition Optimal Economic Dispatch Model of Multi-Energy Systems. Front. Energy Res. 2021, 9, 694983. [Google Scholar] [CrossRef]
- López, V.; Jove, E.; Gato, F.Z.; Pinto-Santos, F.; Piñón-Pazos, A.J.; Casteleiro-Roca, J.-L.; Quintian, H.; Calvo-Rolle, J.L. Intelligent Model for Power Cells State of Charge Forecasting in EV. Processes 2022, 10, 1406. [Google Scholar] [CrossRef]
- Wang, P.; Xu, J.; Yan, Q.; Lin, H. A two level scheduling optimization model for building microgrids considering demand response and uncertainties of flexible load resources. Electr. Power Constr. 2022, 43, 128–140. [Google Scholar]
- Jawale, S.A.; Singh, S.K.; Singh, P.; Kolhe, M.L. Priority Wise Electric Vehicle Charging for Grid Load Minimization. Processes 2022, 10, 1898. [Google Scholar] [CrossRef]
- Chen, X.; Jia, Y.; Tong, X.; Li, Z. Research on Pedestrian Detection and DeepSort Tracking in Front of Intelligent Vehicle Based on Deep Learning. Sustainability 2022, 14, 9281. [Google Scholar] [CrossRef]
- Wang, R.; Sun, Q.; Hu, W.; Li, Y.; Ma, D.; Wang, P. SoC-Based Droop Coefficients Stability Region Analysis of the Battery for Stand-Alone Supply Systems with Constant Power Loads. IEEE Trans. Power Electron. 2021, 36, 7866–7879. [Google Scholar] [CrossRef]
- Cao, Y.; Wang, T.; Kaiwartya, O.; Min, G.; Ahmad, N.; Abdullah, A.H. An EV Charging Management System Concerning Drivers’ Trip Duration and Mobility Uncertainty. IEEE Trans. Syst. Man, Cybern. Syst. 2018, 48, 596–607. [Google Scholar] [CrossRef]
- Zhang, X.; Chen, Y.; Wang, Y.; Ding, R.; Zheng, Y.; Wang, Y.; Zha, X.; Cheng, X. Reactive Voltage Partitioning Method for the Power Grid With Comprehensive Consideration of Wind Power Fluctuation and Uncertainty. IEEE Access 2020, 8, 124514–124525. [Google Scholar] [CrossRef]
- Alanazi, M.S. A Modified Teaching—Learning-Based Optimization for Dynamic Economic Load Dispatch Considering Both Wind Power and Load Demand Uncertainties With Operational Constraints. IEEE Access 2021, 9, 101665–101680. [Google Scholar] [CrossRef]
- Descombes, X.; Morris, R.; Zerubia, J.; Berthod, M. Estimation of Markov random field prior parameters using Markov chain Monte Carlo maximum likelihood. IEEE Trans. Image Process. 1999, 8, 954–963. [Google Scholar] [CrossRef] [PubMed]
- Bahari, M.H.; Dehak, N.; Van Hamme, H.; Burget, L.; Ali, A.M.; Glass, J. Non-Negative Factor Analysis of Gaussian Mixture Model Weight Adaptation for Language and Dialect Recognition. IEEE/ACM Trans. Audio, Speech, Lang. Process. 2014, 22, 1117–1129. [Google Scholar] [CrossRef]
Disclaimer/Publisher’s Note: The statements, opinions and data contained in all publications are solely those of the individual author(s) and contributor(s) and not of MDPI and/or the editor(s). MDPI and/or the editor(s) disclaim responsibility for any injury to people or property resulting from any ideas, methods, instructions or products referred to in the content. |
© 2023 by the authors. Licensee MDPI, Basel, Switzerland. This article is an open access article distributed under the terms and conditions of the Creative Commons Attribution (CC BY) license (https://creativecommons.org/licenses/by/4.0/).