Article

Improved Fault Classification for Predictive Maintenance in Industrial IoT Based on AutoML: A Case Study of Ball-Bearing Faults

1
Control and Systems Engineering Department, University of Technology, Baghdad 10001, Iraq
2
Production Engineering and Metallurgy, University of Technology, Baghdad 10001, Iraq
3
School of Physics, Maths, and Computing, The University of Western Australia, Perth, WA 6907, Australia
*
Author to whom correspondence should be addressed.
Processes 2023, 11(5), 1507; https://doi.org/10.3390/pr11051507
Submission received: 27 March 2023 / Revised: 7 May 2023 / Accepted: 9 May 2023 / Published: 15 May 2023

Abstract

:
The growing complexity of data derived from Industrial Internet of Things (IIoT) systems presents substantial challenges for traditional machine-learning techniques, which struggle to effectively manage the needs of predictive maintenance applications. Automated machine-learning (AutoML) techniques present a promising solution by streamlining the machine-learning process, reducing the necessity for manual hyperparameter tuning and computational resources, thereby positioning themselves as a potentially transformative innovation in the Industry 4.0 era. This research introduces two distinct models: AutoML, employing PyCaret, and Auto Deep Neural Network (AutoDNN), utilizing AutoKeras, both aimed at accurately identifying various types of faults in ball bearings. The proposed models were evaluated using the Case Western Reserve University (CWRU) bearing faults dataset, and the results showed a notable performance in terms of achieving high accuracy, recall, precision, and F1 score on the testing and validation sets. Compared to recent studies, the proposed AutoML models demonstrated superior performance, surpassing alternative approaches even when they utilized a larger number of features, thus highlighting the effectiveness of the proposed methodology. This research offers valuable insights for those interested in harnessing the potential of AutoML techniques in IIoT applications, with implications for industries such as manufacturing and energy. By automating the machine-learning process, AutoML models can help decrease the time and cost related to predictive maintenance, which is crucial for industries where unplanned downtime can lead to substantial financial losses.

1. Introduction

The Internet of Things (IoT) has revolutionized several industries, including manufacturing, by enabling the integration of physical and digital systems to enhance real-time services [1,2]. This development has paved the way for Industry 4.0, which is propelled by IoT and artificial intelligence (AI) [3]. A key advantage of automated industrial systems within Industry 4.0 is the substantial growth in the volume of data that can be gathered from sensors, transceiver devices, and data storage systems [4,5]. This data can be processed and analyzed to yield valuable insights regarding equipment performance, thus facilitating a transition towards predictive maintenance (PdM) [6,7]. AI techniques can be employed to automatically extract information from collected historical data, which in turn can improve maintenance procedures and boost operational sustainability [8,9]. In this context, PdM is gaining prominence across various industries, owing to its potential to decrease maintenance expenses and prolong the service life of equipment [10,11]. AI tools such as machine learning (ML) have the potential to further improve industrial systems by enhancing decision-making capabilities in real-time scenarios [12]. ML is a field of study that empowers computers to learn without explicit programming. It leverages computational techniques to extract information directly from data, bypassing the need for predefined equations or models. Therefore, the integration of AI and IoT technologies, such as ML and PdM, can play a significant role in improving industrial systems’ overall efficiency and sustainability in Industry 4.0 [3,7].
Rolling-element bearings (REBs) are a prime example of components that require diligent PdM, as they are susceptible to various damages caused by the harsh operating conditions they endure, such as high speed, heavy load, extreme temperatures, and contamination. An unexpected bearing fault can lead to substantial financial losses and catastrophic failures, resulting in a breakdown of an entire mechanical system. Consequently, conducting an REB fault diagnosis is essential for preventing accidents and ensuring safe operation [13].
This paper aims to enhance the maintenance process of REBs by automating the detection and classification of possible faults that may occur during operation. AutoML models were proposed to provide a user-friendly methodology for non-expert users in the manufacturing industry. Such models streamline the selection of machine-learning algorithms or deep neural network architecture that is most suitable for a given dataset and task. Thus, they greatly reduce the need for human intervention and expertise.
The rest paper is ordered as follows: Section 2 provides a literature review of the related works. Section 3 introduces the categories of maintenance management and focuses on PdM. Section 4 describes the proposed methodology. Section 5 presents an overview of the used dataset. Section 6 discusses the experimental results. Finally, Section 7 lists the conclusions.

2. Related Works

In recent years, several studies have utilized ML models to reduce downtime which ultimately results in improving the efficiency of production processes. These studies can be grouped into three main categories, which are summarized in this section. The first category focuses on using ML for PdM, where algorithms are used to predict equipment failures before they actually occur. The second category investigates the utilization of AutoML techniques. AutoML automates model selection, hyperparameter tuning, and feature engineering. This allows non-experts to build high-performance models with slight effort. AutoML facilitates early detection of equipment failures. This early detection reduces downtime, and improves productivity in PdM. Incorporating AutoML with IoT systems allows predictive decision-making and real-time monitoring, which make it a crucial tool for Industry 4.0. [14,15,16]. Finally, the third category investigates the application of ML in the CWRU bearing faults dataset, which is widely used for benchmarking PdM algorithms.
Focusing on the first category, a PdM approach aimed at diagnosing critical failures in medical equipment was proposed in [17]. The approach relied on understanding the physics of failure, real-time IoT data collection, and ML for fault prediction. The approach was applied to a case study of a Vitros-Immunoassay analyzer and proved to provide significant cost savings and a short investment payback period. However, it is limited to certain failure modes and parameters and requires sufficient data for accurate predictions. Lee et al. [9] discussed the use of AI-based algorithms for monitoring the cutting tool wear and spindle motor bearing failures where the support vector machine (SVM) and artificial neural network (ANN) methods were used. Another study in [18] presented a machine-learning approach based on random forest for the maintenance of electric motors. The system was tested on a real industry example, and preliminary results showed high accuracy in predicting different machine states. Nasser and Al-Khazraji [19] proposed a hybrid convolution neural network and long short-term memory networks (CNN-LSTM) approach for fault prediction and diagnosis. In [20], a deep learning model called causal augmented convolution network (CaConvNet) is proposed for long-sequence time-series prediction. While the model outperformed its counterparts in the literature, it faced limitations such as a complex architecture that can result in extended training durations and increased computational expenses.
In comparison to the aforementioned studies, the proposed work aims to apply AutoML to develop a PdM model. The approach intends to optimize the ML pipeline, including feature selection, algorithm selection, and hyperparameter tuning, to enhance the model’s accuracy and reduce the time and effort required to develop the model.
Numerous recent studies have emerged in the field of PdM utilizing AutoML. Leite et al. [21] presented a model for real-time fault detection and diagnosis (RT-FDD) in discrete manufacturing machines (DMMs), which compared 16 ML classification algorithms such as Extra Trees and Random Forest. Tornede et al. [22] proposed a remaining useful lifetime (RUL) estimation as a co-operative coevolutionary algorithm. Cinar et al. [23] implemented a new PdM system using a set of key performance indicators (KPIs) and metrics for enhancing performance-monitoring processes. In [24], the study explored the potential of using AutoML on real-world data. Garouani et al. [25] presented a framework of AutoML for researchers aiming to engage industry 4.0 with the field of smart manufacturing. Finally, in [26], the researchers analyzed the features of the constant current (CC) and constant voltage (CV) phases for making the life prediction and capacity estimation of lithium-ion batteries (LIBs).
For the third category, this work aims to improve the diagnostic process and manage failures more effectively. To this end, AutoML approach is utilized for failure prediction in REBs. AutoML automates the section and tunning of ML models that are most suitable for a given dataset and task [27]. Several ML algorithms based on extracted features from the vibration dataset of the CWRU Laboratory were used for various fault classifications [28]. Some recent and related studies were used for comparative analysis with this work. Wen et al. [29] developed a new deep transfer learning (DTL) method for fault diagnosis. The work in [30] demonstrated the effectiveness of combining signal-processing methods with ML techniques. The work presented by Sharma et al. [31] aimed to detect and classify faults in various industries. Five different algorithms were used, and their performance was compared on different datasets. In [32], the use of fusion models and algorithms for multisource sensing data was investigated, and only four features were utilized. Jian et al. [33] proposed a one-dimensional fusion neural network (OFNN) method for the intelligent diagnosis of faults, which was applied with a wide kernel and combined with the Dempster–Shafer evidence theory. The work in [34] utilized some ensemble-learning algorithms, including gradient-boosting classifiers, bagging, and extra tree, as diagnostic techniques. Wen et al. [35] presented the transfer CNN based on ResNet-50 with the depth of 51 convolutional layers. Wang et al. [36] introduced a CNN model which constructed a signal-to-image conversion method based on fault bearing vibration characteristics propagating along the space. Han and Jeong [37] proposed a weighted arithmetic mean CNN ensemble model to improve the stability of CNN models. The study in [38] showed that ML models can effectively diagnose REB faults. The study found that the k-nearest neighbors (k-NN) and SVM classifiers performed the best, using specific frequency-domain and time-domain features. However, the study used an imbalanced dataset which could potentially bias the classification results. Rajput et al. [39] developed a method called fuzzy convolution neural network (FCNN). While the method accurately diagnosed faults in rotating parts and successfully classified different types of faults, it faced difficulties in detecting outer-race faults due to imbalanced data.
To ensure unbiased results, the current study used a balancing technique to overcome this challenge.
According to [40], a medium Gaussian SVM was proposed. The study utilized vibration signals collected on-site, extracted features, and clustered and classified them for motor health classification. Different Gaussian kernel functions were analyzed for their impact on SVM performance. The study identified a limitation of the medium Gaussian SVM, which was reduced performance on high-dimensional data and sensitivity to the choice of hyperparameters. In this paper, it is assumed that the features extracted by Lin [40] are available and that the feature-engineering process was already performed. Despite recent studies primarily focusing on advancing PdM processes and integrating smart sensors into critical instruments and machinery used in manufacturing plants, there is still room for improvement in the journey toward the Industry 4.0 revolution in line with the IoT concept. ML algorithms have played a crucial role in developing accurate models for PdM. However, some challenges persist, such as high computational costs and redundant model information, while minimizing human intervention. In response to these issues, adopting AutoML algorithms, which embody a pipeline model that automatically fine-tunes hyperparameters, presents a promising solution. The primary contributions of this study are as follows:
i.
Development of AutoML-based prediction algorithms (PyCaret and AutoKeras) for application on REB fault datasets;
ii.
Design of a preprocessing algorithm to enhance the prediction process’s performance;
iii.
Conducting of a comparison study between the proposed prediction algorithms;
iv.
Comparative analysis of the models proposed in this research against prior works to showcase their effectiveness in addressing the same case study.

3. Predictive Maintenance

Among the different categories of maintenance management policies, PdM is recognized as the most recent and holds substantial value in comparison to traditional policies [41]. According to the literature, these policies can be classified into three primary categories based on the strategies used [42]:
  • Corrective maintenance, also known as run-to-failure (R2F), is a straightforward strategy that involves addressing equipment issues only when they cease to function, often necessitating the replacement or repair of specific components.
  • Preventive maintenance (PvM) is a scheduled maintenance strategy carried out periodically at predetermined intervals. While this approach is effective in preventing equipment failure, it may also result in unnecessary costs for corrective maintenance.
  • PdM is a strategy that involves continuous system monitoring to anticipate potential failures using a combination of machine-learning techniques, integrity factors, engineering approaches, and statistical inference methods. Zonta et al. [43] define PdM as models that rely on historical data and domain knowledge, enabling advanced failure anticipation using statistical or machine-learning algorithms. This approach ultimately improves decision making related to maintenance activities and helps prevent downtime. The evolution of IoT, sensing technology, and AI has facilitated a shift in maintenance strategies from R2F to PvM, and, finally, to PdM [44].

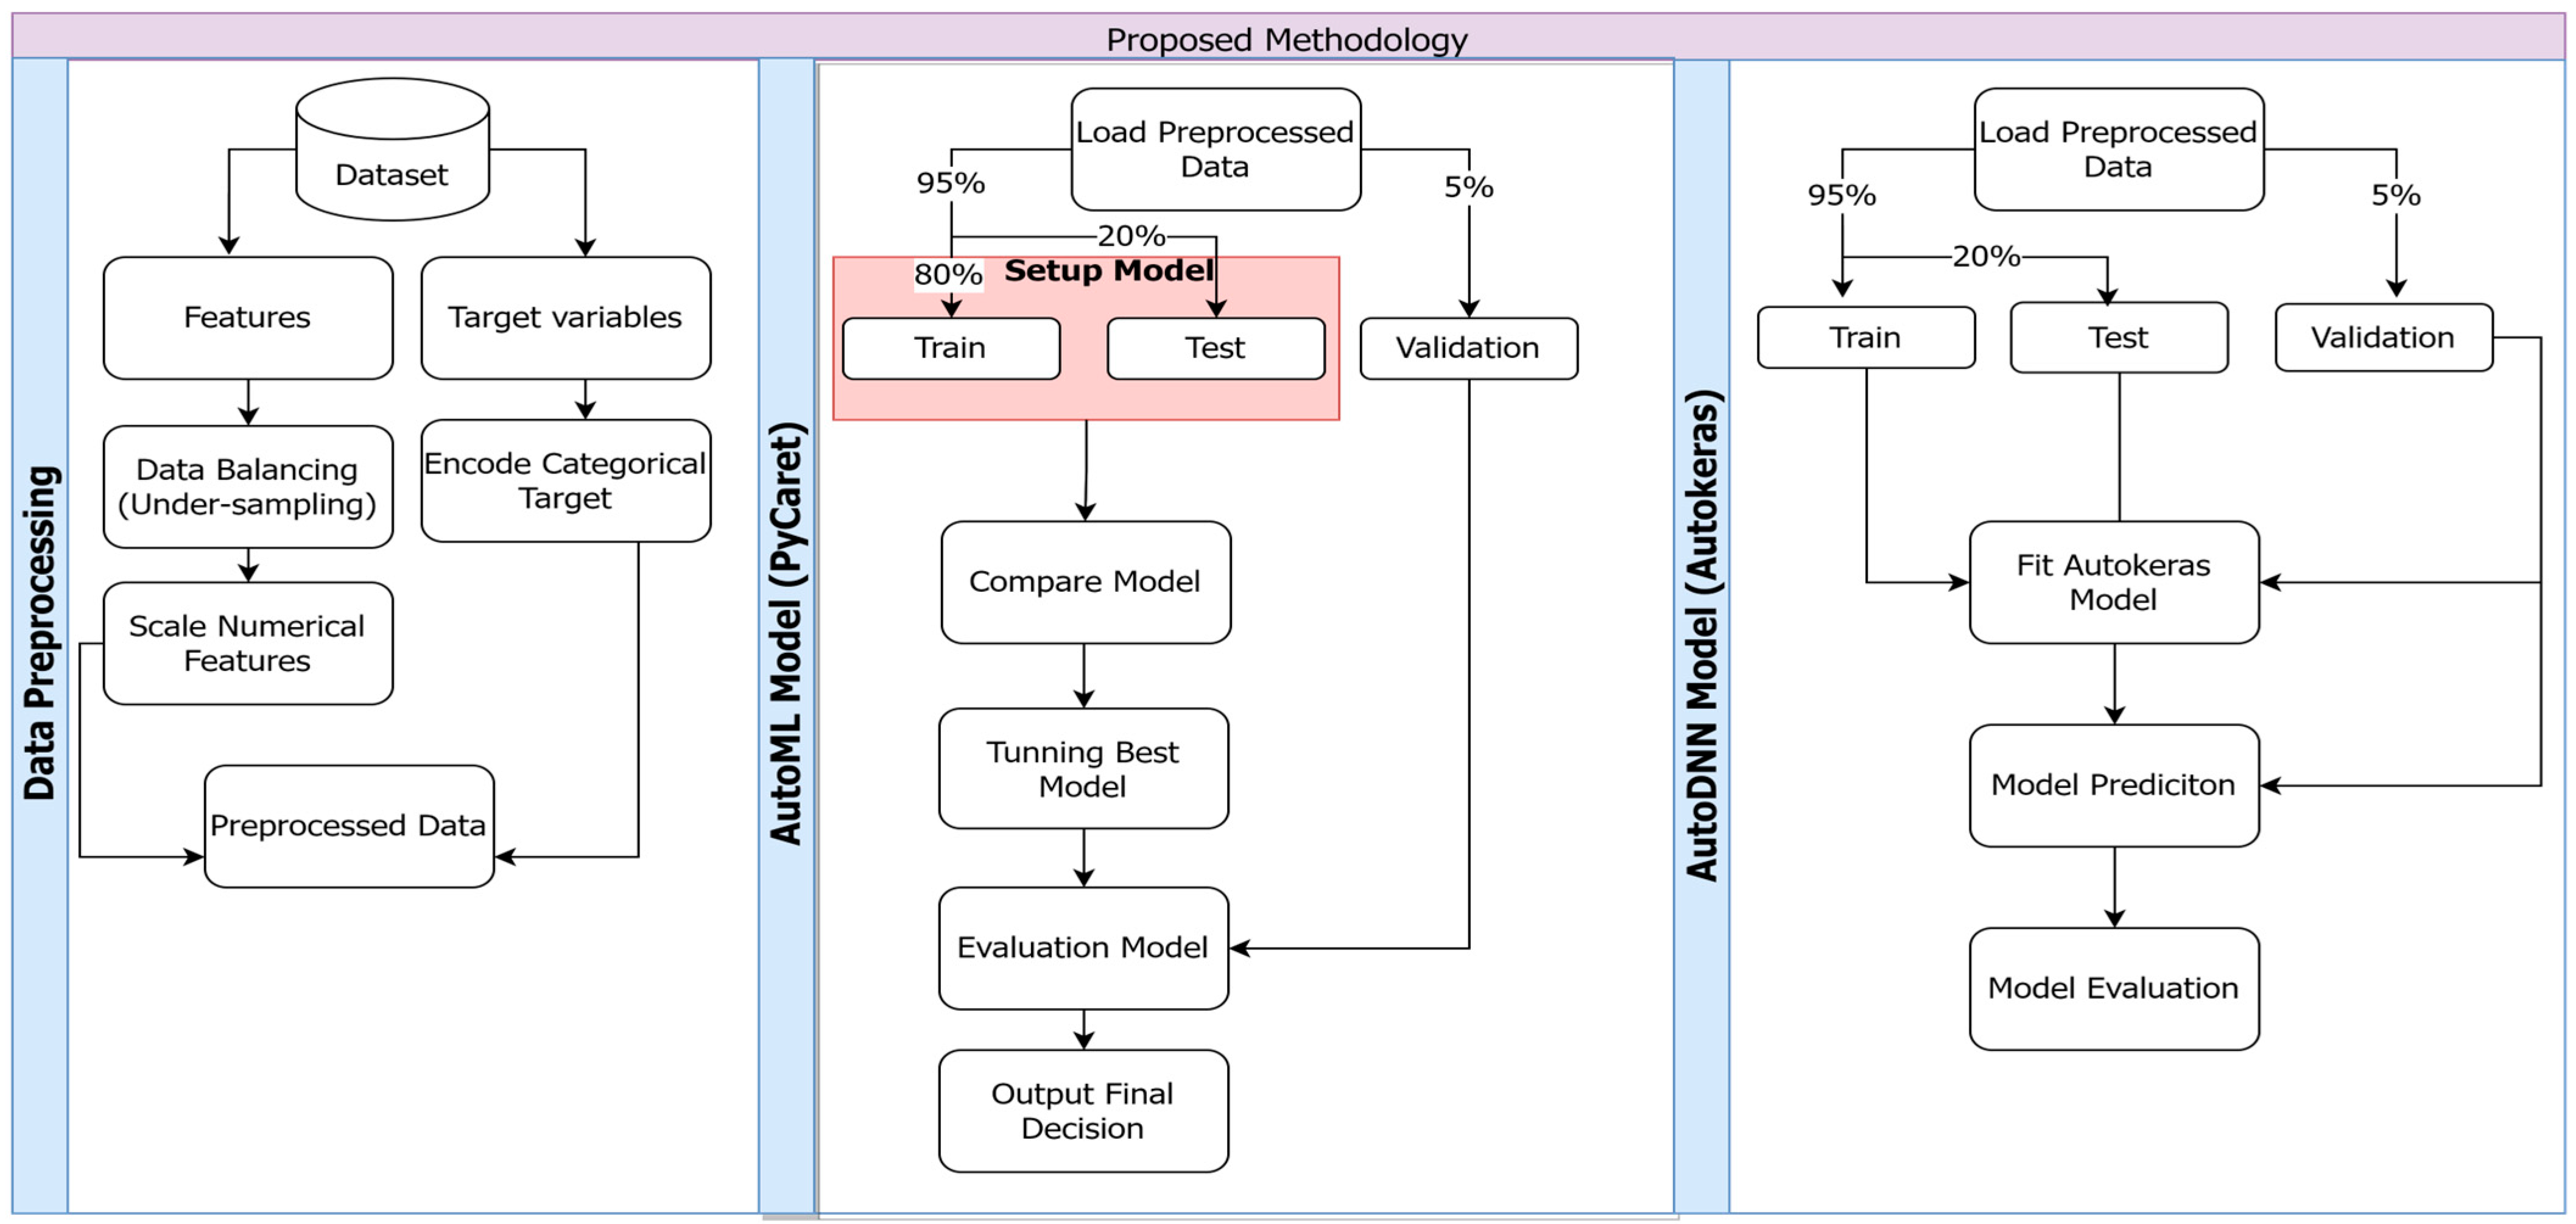
4. Proposed Methodology

This study involves developing a PdM model with the goal of improving maintenance strategies and minimizing the impact of equipment malfunctions in an Industry 4.0 context. The methodology flowchart, depicted in Figure 1, illustrates the general workflow of the study. The process begins with loading the data, followed by a data-preprocessing phase that prepares the dataset for model application. Next, two different AutoML models, PyCaret and AutoKeras, are employed. PyCaret is utilized to develop an efficient ML model based on the training dataset, while AutoKeras is used to construct a deep neural network model. During the prediction phase, the data are divided into two sets: one for testing and the other for validation with unseen data. Finally, a comparison is made using specific evaluation metrics to identify the best-performing model, ultimately leading to the selection of the PdM model that excelled in the classification problem of the adopted case study. It is important to highlight that in this work, the data-preprocessing step—which includes data sampling, balancing, and encoding categorical data—is carried out before training the models. The capability to perform preprocessing is possessed by both models. However, the decision was made to have preprocessing executed separately to ensure compatibility, maintain consistency, and, ultimately, enhance performance. Figure 2 presents a detailed overview of the modeling phase, depicting the several steps involved in training both PyCaret and AutoKeras models.

4.1. Data Preprocessing

The dataset employed in this study comprises nine features that were derived from the original vibration data, representing 10 categories of labels, as provided by [40]. The dataset consists of 230 labels for each category, yielding a total of 2300 data points. The proposed methodology involves conducting data preprocessing to prepare the dataset for modeling. This process aims to ensure the accuracy and reliability of ML models in predicting equipment failures. Given that the dataset already contains extracted features, the preprocessing primarily involves the normalization, balancing, and encoding of the categorical data. Normalization is applied to numerical features to scale them to a common range, which is essential for ML models that rely on distance measures. Data balancing is performed to avoid bias towards the majority class, which could result in poor performance when detecting the minority class. Numerous studies have demonstrated that normalization and data balancing significantly improve the performance in various applications, including PdM (e.g., [45,46]). The categorical target variable is encoded to facilitate its use in ML algorithms. Algorithm 1 outlines the process of preparing the dataset for modeling by performing data preprocessing. This results in a preprocessed dataset that is ready to be used as input for either the PyCaret or AutoKeras models.
Algorithm 1 Data Preprocessing.
Input: CWRU dataset (d), input feature columns (f), output target (t)
Output: Preprocessed dataset (pd)
  1.Normalize: Feature normalization (d)
  2.Xf
  3.Yt
  4.Xn ← normalize(X)
  5.Balance: Dataset balancing (Xbal,Ybal)
  6.Xbal,Ybal ← balance(Xn, Y)
  7.Map: Mapping categorical target from 0 to 9
  8.ymap ← map(Ybal)
  9.Split: Splitting dataset into training, validation, and test sets (sd)
  10.X_train_val, X_test, y_train_val, y_test(Xbal, ymap, test_size = 0.05)
  11.X_train, X_val, y_train, y_val(X_train_val, y_train_val, test_size = 0.2)
  12.Return pd ← (X_train, y_train, X_val, y_val, X_test, y_test)

4.2. AutoML (PyCaret) Model

The primary objective of this model is to identify and prevent equipment failures by analyzing real-time data collected from the system. Utilizing the power of AutoML, the model employs a range of ML techniques and optimization algorithms to understand and adapt to the system’s behavior, ultimately enhancing the accuracy and efficiency of the maintenance process. By incorporating the capacity to learn and adapt from past experiences, this model seeks to minimize the time and resources required for maintenance tasks, leading to cost savings and improved productivity. PyCaret is a machine-learning library that requires few lines of code and makes the machine-learning processes more streamlined by automating tasks such as data preparation, model selection, hyperparameter tuning, and deployment. It supports various machine-learning tasks and offers a user-friendly interface for data visualization and model interpretation [46,47,48]. In this research, the power of the PyCaret library for constructing and evaluating ML models to predict equipment failures is demonstrated. In this model, the compare function was used to evaluate a wide range of advanced ML algorithms automatically. To assess the model’s generalization ability, the dataset was divided into three subsets. A portion of 5% was reserved for validation to simulate the model’s performance on unseen data. The remaining 95% was then divided into the 80% training set and 15% testing set to ensure the model was trained on a diverse and sufficient dataset. An automated process was employed for selecting the best algorithm and tuning its hyperparameters. This process entailed evaluating various models on the training set and choosing the best-performing one based on evaluation metrics. The selected model was further optimized by tuning its hyperparameters using cross-validation on the training set. Finally, the model’s performance was assessed on the test and validation sets with the optimized hyperparameters, and the results were compared to those obtained from the non-tuned model.

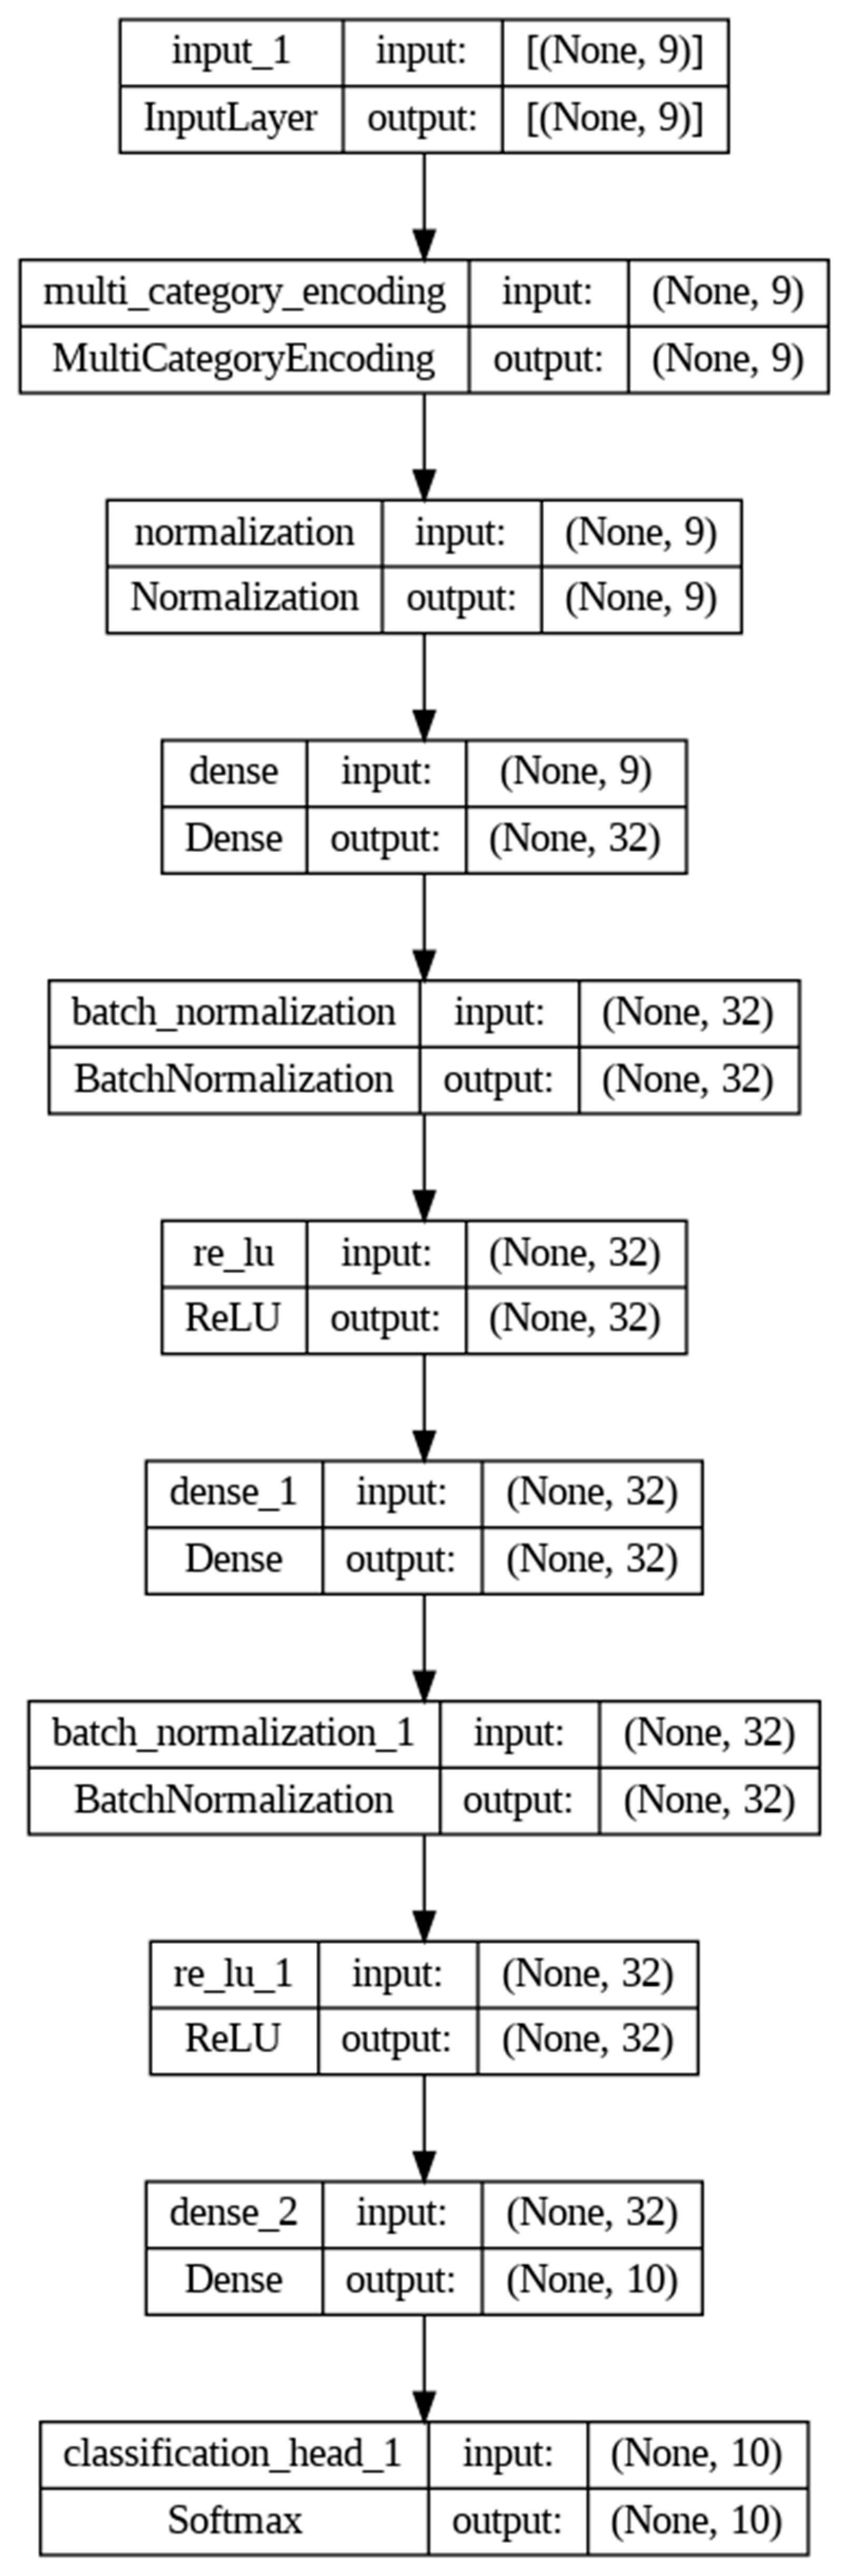
4.3. AutoDNN (AutoKeras) Model

AutoKeras automates the selection of optimal hyperparameters and network architecture for a given dataset, saving significant time and effort. It also simplifies the process of data preparation and model selection by providing built-in neural network models and preprocessing techniques [49,50]. The model was initialized with a maximum of 15 trials and trained for 32 epochs.
Algorithm 2 outlines the essential steps for selecting the best PdM model, which is based on a comparison of accuracy (acc), precision (prec), recall (rec), F1 score (f1), and confusion matrix (cm).
Algorithm 2 Best Model Selection.
Input: Preprocessed dataset (pd), AutoML and AutoDNN models
Output: Best Auto Predictive Maintenance Model (bAutoM)
  1.Train and evaluate AutoML Models:
  2.  AutoML train_ AutoML (X_train, y_train)
  3.AutoML _metrics evaluate_model (AutoML, X_val, y_val)
  4.Train and evaluate AutoDNN Model
  5.AutoDNNtrain_AutoDNN(X_train, y_train)
  6.AutoDNN _metrics = evaluate_model(AutoDNN, X_val, y_val)
  7.Model selection based on evaluation metrics (em):
  8.begin
  9.  em(acc, prec, rec, f1,cm)
  10.Best_evaluation_metrics (best_em)
  11.BAutoMNone
  12.best_em[0, 0, 0, 0, None]
  13.for i in range (len(em)):
  14.  if AutoML metrics[i] > AutoDNN_metrics[i]
  15.     if AutoML_metrics[i] > best_em[i]
  16.     BAutoMAutoMl
  17.     end if
  18.  end if
  19.  else if
  20.   AutoDNN_metrics[i] > best_em[i]
  21.  BAutoMAutoDNN
  22.  end if
  23.end for
  24.Return BAutoM
  25.end

5. Case Study

Due to rapid advancements in science and technology, electric machines are widely used in manufacturing applications. Consequently, these machines often operate under unfavorable conditions, such as excessive loads and humidity, necessitating maintenance to prevent motor breakdowns. Key components to consider in the maintenance process include stators, shafts, rotors, and bearings of rotating machines [51].
Bearings are crucial rolling elements in machines, and any changes in their health conditions, such as operating under varying loads, directly impact the efficiency, performance, lifespan, and stability of the machines [52]. Figure 3 depicts the components of an REB, which include the inner race (IR), outer race (OR), ball, and cage [53,54].
As illustrated in Figure 4, the test system comprises a 2 hp motor, a torque transducer/encoder, a dynamometer, and control electronics. The fault test is implemented at the fan-end bearing to support the motor shaft. The CWRU dataset includes vibration data collected using accelerometers attached to both the drive end and fan end of the motor housing. In some experiments, an additional accelerometer was also attached to the motor base plate for support. A 16-channel digital audio tape (DAT) recorder was used for data collection [55].
Vibration signals contain valuable information about the health of the equipment. By extracting features such as the maximum value (max: measure of the highest magnitude of the signals), minimum value (min: measure of the lowest magnitude of the signals), mean (measure of the central tendency of the signals), standard deviation (sd: measure of the spread of the signals), root mean square (rms: measure of the average magnitude of the signals), skewness (measure of the symmetry of the signals), kurtosis (measure of the peakedness of the signals), crest factor (measure of the peak-to-peak magnitude of the signals), and form factor (measure of the shape of the signals) from these signals, it is possible to identify patterns that may indicate potential equipment failures. These features provide information about the level, variability, symmetry, peakedness, and shape of the signals, and can be used to train ML models for PdM tasks. In addition to these features, other characteristics of the signals such as frequency, time, and waveform can also be analyzed to improve the accuracy. The specific features that will be most effective for a given task will depend on the characteristics of the equipment and the data available [56].
Figure 4. CWRU bearing system [55].
Processes 11 01507 g004
The dataset comprises a large collection of vibration signals from bearings subjected to various fault conditions. In total, it contains 10,000 fault conditions, with each fault condition represented by 230 vibration signals. The fault conditions are categorized by fault type and severity. The fault types are inner-race faults, outer-race faults, and ball faults. The fault severity levels are small, medium, and large. In addition to the fault conditions, the dataset also contains normal conditions. The normal conditions represent bearings without any faults. Table 1 provides a summary of the fault and normal conditions. The table includes the types of faults, levels of severity, and the corresponding abbreviations used [36].
The objective of this work is to develop a classification model that recognizes the provided nine types of faults as classes. A tenth class called "Normal" is included to represent a healthy bearing with no faults. This class serves as a reference for comparison with the other fault classes and it has no specific fault size. The data for the Normal class was collected from the same locations as the data for the other fault classes, which are the drive end, the fan end, and the base [57].

6. Results and Analysis

In this section, the performance of the two proposed models is analyzed, and the impact of hyperparameter tuning on the results is assessed using both the testing and validation sets.

6.1. Data Preparation Process

The initial dataset was suffering from imbalances issues, as the majority of samples belonged to the Normal class. The Random Under Sampler was applied to address this imbalance. Afterward, the data were normalized by the Robust Scaler, which scales the features using statistics that are robust to outliers. Finally, categorical values were mapped to numerical values using dictionary mapping. Table 2 summarizes the steps involved in the data-preprocessing process used in this research.

6.2. AutoML and AutoDNN Validation Models

In the PyCaret model, the preprocessed data were used as input, and the setup function provided by the PyCaret library was applied. The resulting configuration parameters are illustrated in Table 3.
The compare function was used to train and evaluate multiple machine-learning algorithms using predefined metrics, including accuracy, recall, precision, and F1 score. These metrics can be defined and calculated as follows [58,59]:
Accuracy is defined as the number of correct predictions made by the model over the total number of predictions. It can be represented as:
Accuracy = (TP + TN)/(TP + TN + FP + FN)
where TP (true positive) represents the number of positive cases correctly classified as positive, while FP (false positive) refers to the number of negative cases wrongly classified as positive. Similarly, FN (false negative) corresponds to the number of positive cases mistakenly classified as negative, and TN (true negative) indicates the number of negative cases correctly identified as negative.
The Recall metric measures the model’s ability to accurately identify all positive cases. It is defined as the number of true positive predictions made by the model over the total number of actual positive and it can be calculated by:
Recall = TP/(TP + FN)
Precision measures the model’s ability in identifying positive cases correctly. It is defined as the number of true positive predictions over the total number of positive predictions, and it can be calculated as:
Prec.= TP/(TP + FP)
Finally, the F1 score is a metric that balances the harmonic mean of recall and precision, as follows:
F1 = 2 × (Precision × Recall)/(Precision + Recall)
A confusion matrix is a table that summarizes the performance of a given machine-learning classification model based on a set of test data. It indicates the TP, TN, FP, and FN for each class label. The matrix is built by comparing the predicted class labels generated by the model with the actual class labels in the test dataset. The rows represent the actual class labels, whilst the columns represent the predicted class labels. A correctly classified sample is a true positive or true negative, while a misclassified sample is a false positive or false negative. The confusion matrix presents a comprehensive examination of the model’s performance across all classes and can be applied to calculate other metrics such as accuracy, precision, and recall.
Table 4 presents the results of the compare model function for the top five machine-learning algorithms. Random forest (RF) achieved the best performance, followed by gradient-boosting classifier (GBC), extra trees (ET), light gradient-boosting machine (LightGBM), and finally, extreme gradient boosting (XGBoost). In general, the evaluated models achieved high accuracy, in the range of 95.94% to 96.34%. The recall scores were also high, where all models achieved values greater than 95%. The RF model had the highest value of 96.34%. Precision scores were from 96.12% to 96.52%, and the F1 score was the highest for the RF model at 96.32%. For the computational time, the XGBoost model was the fastest, with 0.0640 s training time (TT), on the other hand, the GBC model was the slowest, with 0.9490 s TT. The RF classifier was the best-performing model among those evaluated.
The next step was to fine-tune the best model (RF model) using PyCaret’s tune model function. The auto-tuning process optimizes the hyperparameters of the model to further improve its performance. The result of the auto-tuning process is shown in Table 5, which displays the performance metrics of the model on each fold of the cross-validation.
The tuned RF model showed a slight improvement in performance with accuracy, recall, precision, and F1 score of 96.40%, 96.40%, 96.58%, and 96.37%, respectively. The standard deviation values for these metrics were low, ranging from 0.0126% to 0.0131%, as displayed in Table 5. The performance of the model on the testing set, as measured by the predict model function, was excellent, with an accuracy, recall, and F1 score of 99.70%.
For the AutoKeras model, Figure 5 shows a histogram displaying the performance metrics for the testing sets associated with different failure types in the proposed AutoDNN model. The x-axis represents the different failure types, numbered from 0 to 9, and the y-axis denotes the score, measured in terms of precision, recall, and F1 score. The plot indicates that the F1 score for most failure types is relatively high, with scores ranging from 83% to 100%. However, the precision score for failure type 4 (OR_014_6_1) is relatively low at 78%, and the recall score for failure type 7 (Ball_014_1) is also relatively low at 83%. The weighted average score for the performance metrics, in addition to the total accuracy, is 95%.
The architecture of the AutoDNN model generated by AutoKeras is illustrated in Figure 6. The model comprises an input layer that accepts data with nine features. The input data undergoes processing via a multi-category encoding layer for data preprocessing, followed by a normalization layer to ensure that all inputs have a consistent scale. The processed data is then fed into two dense layers, each with 32 neurons. Batch normalization and rectified linear unit (ReLU) activation are applied between the dense layers. The output layer consists of a dense layer with 10 neurons, followed by a softmax activation layer for classification.

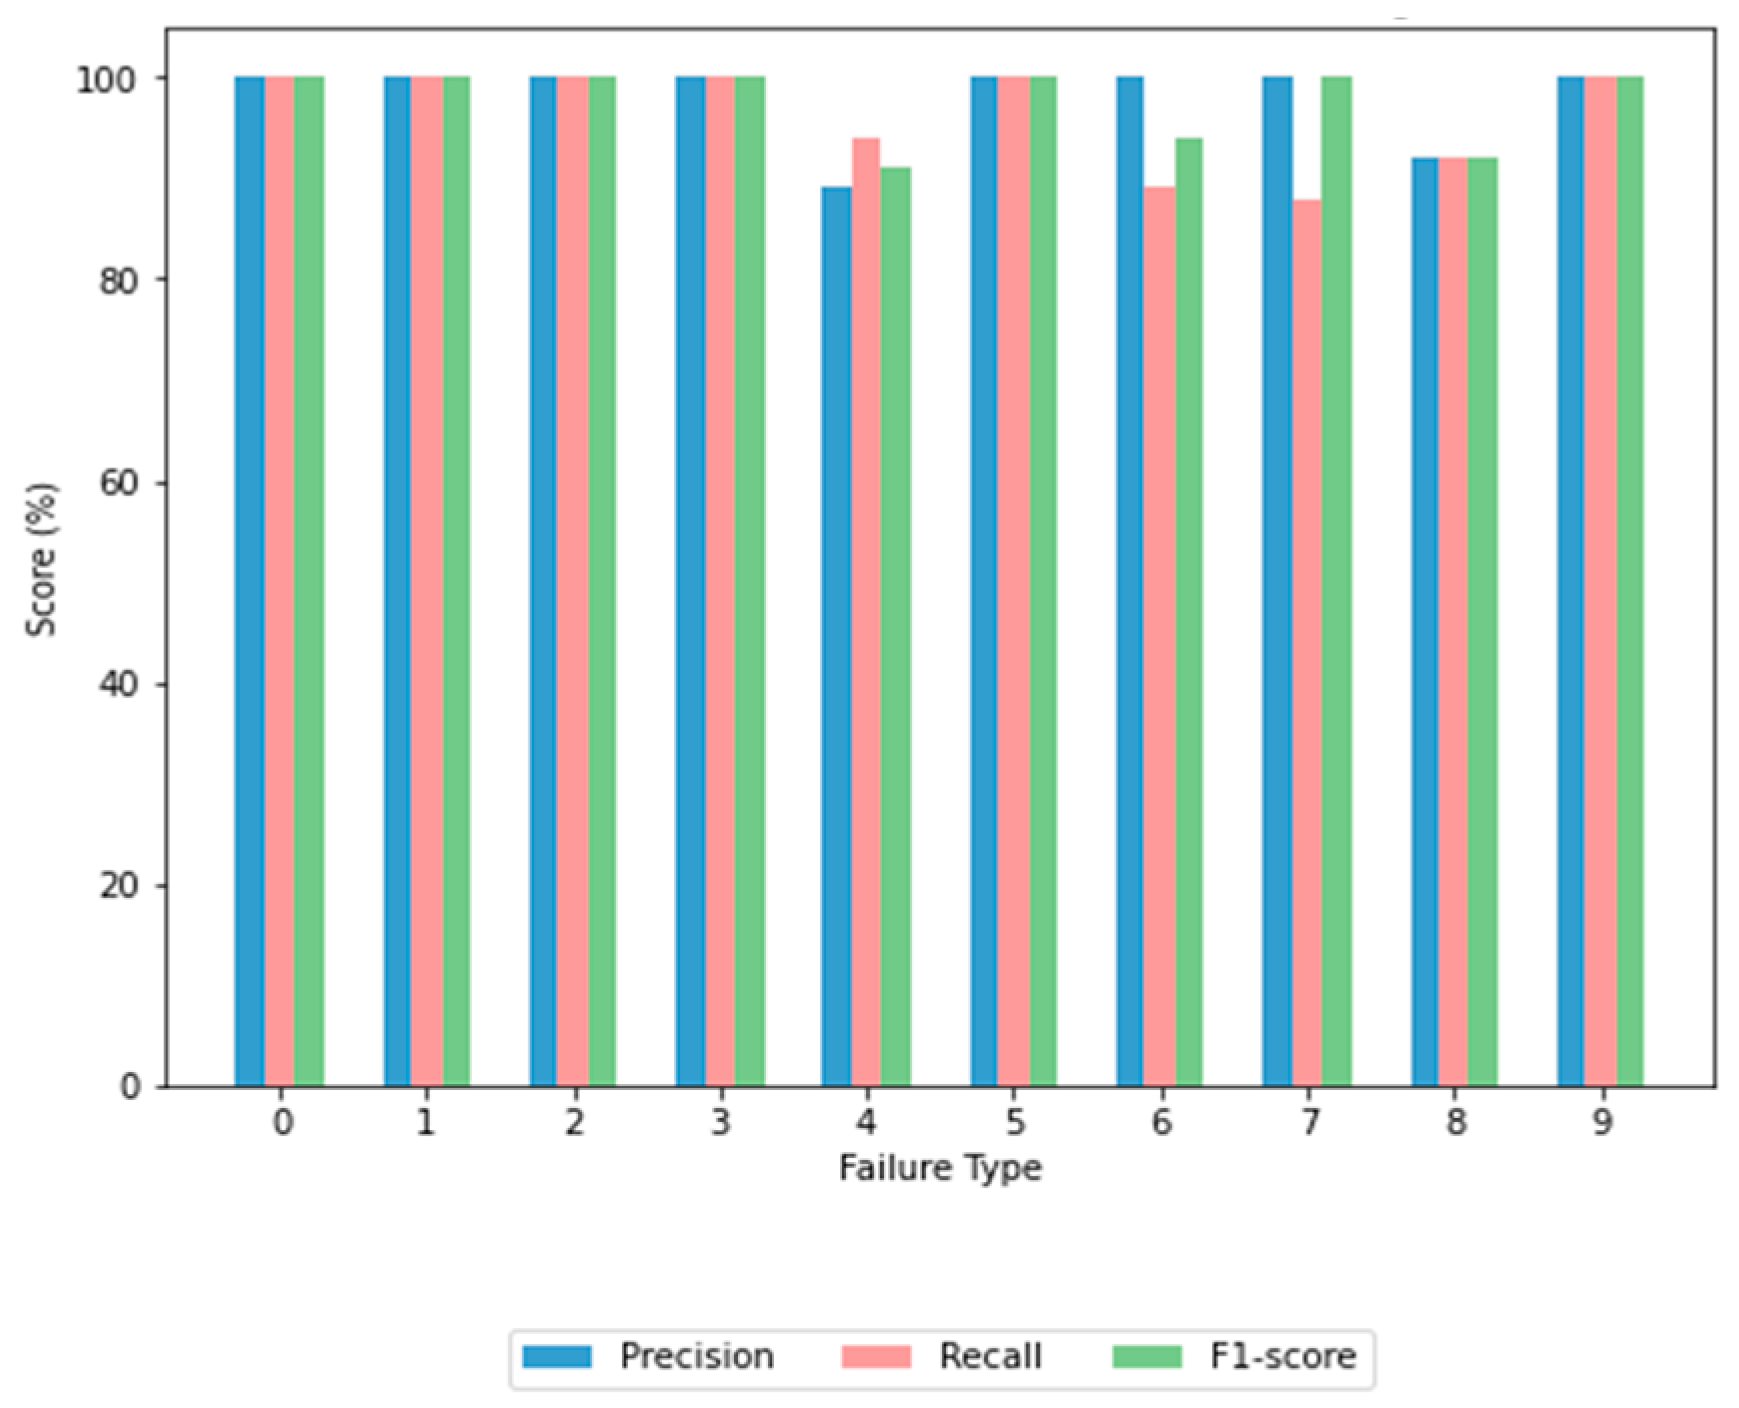
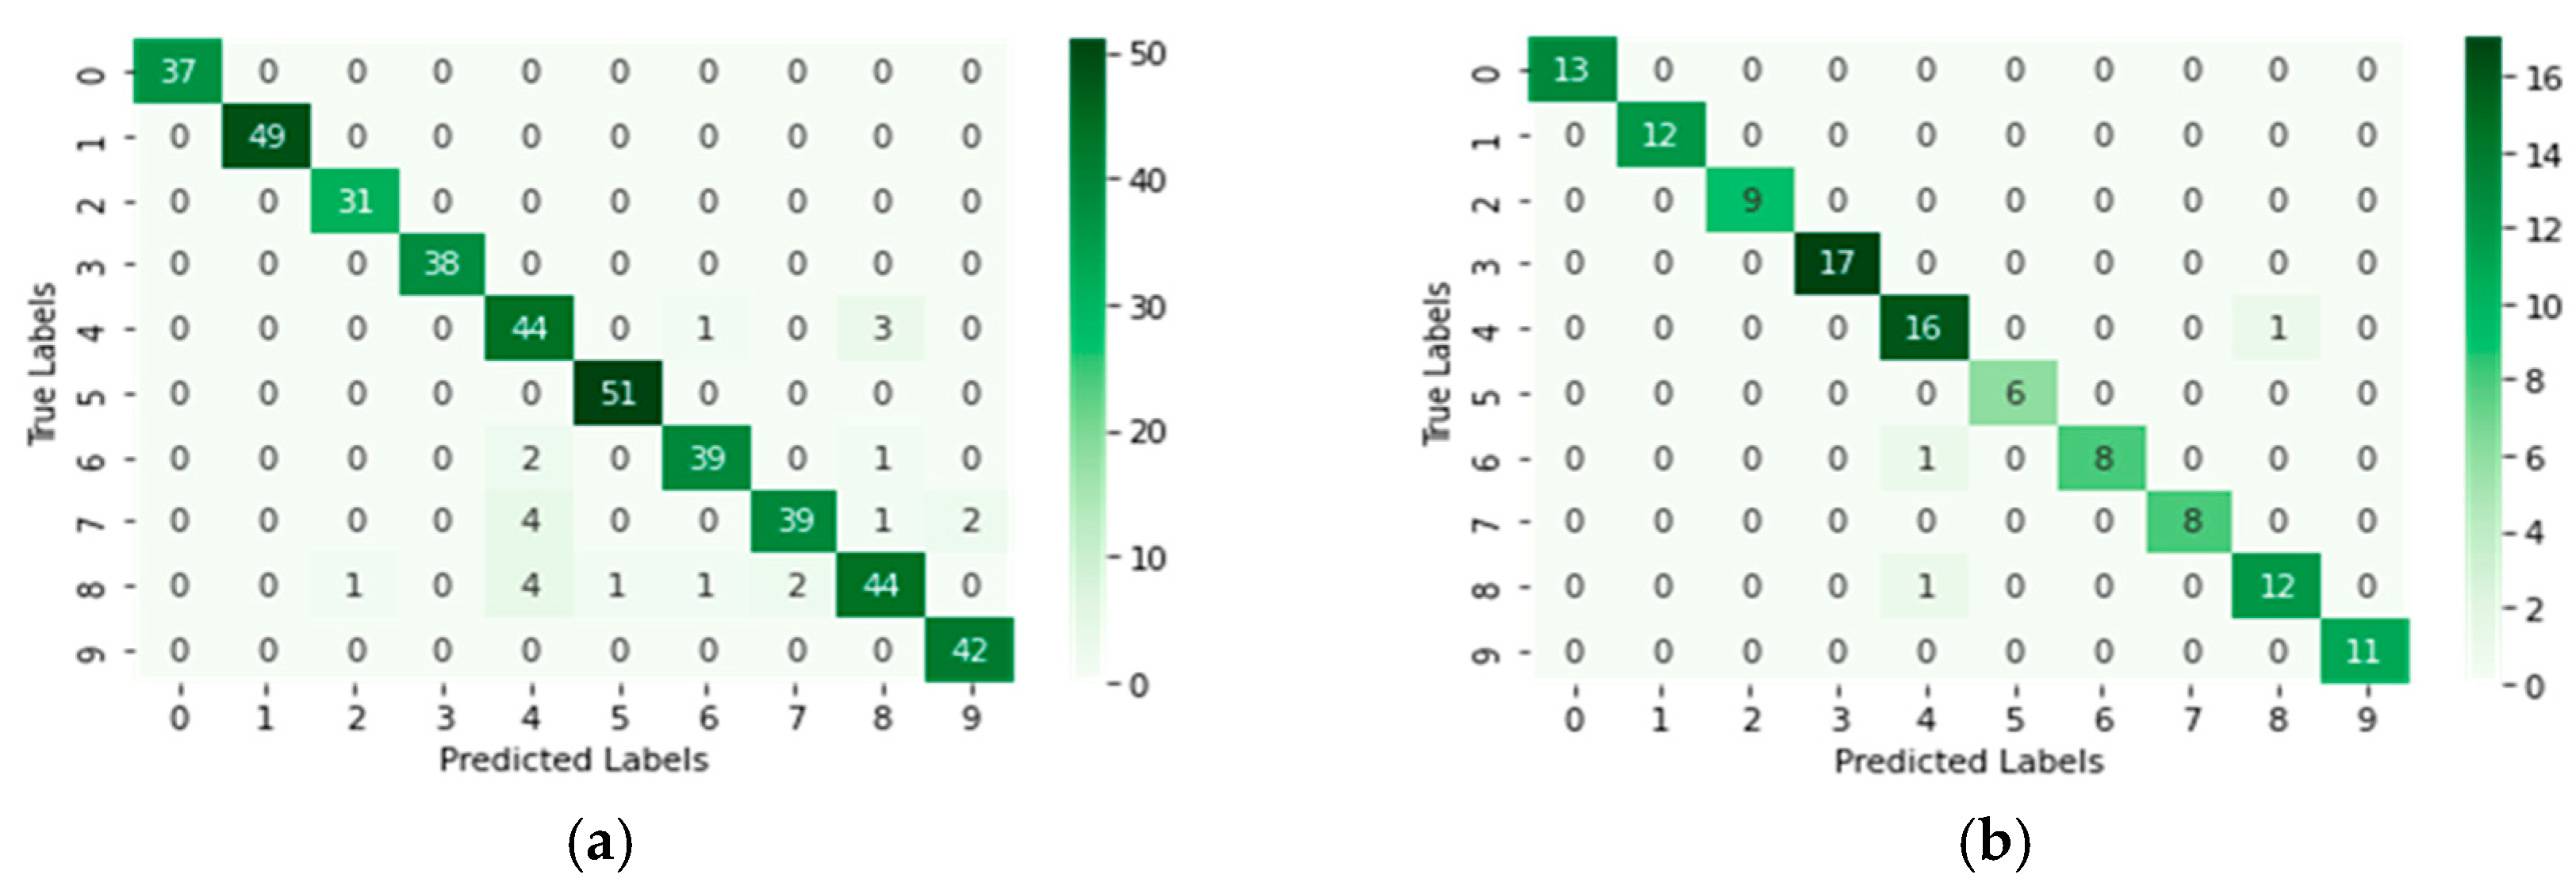
6.3. Model Evaluation

In Figure 7, the feature importance plot generated by the PyCaret evaluate model function indicates that the standard deviation (sd) feature has the highest importance in predicting fault diagnosis, followed by the root mean square (rms) and mean features. The remaining features, including kurtosis, minimum, maximum, form factor, crest factor, and skewness, have relatively lower importance. Interestingly, the skewness feature is the least important among them. These results suggest that prioritizing the sd, rms, and mean features may lead to better classification performance.
The performance of the proposed AutoDNN model, as presented in Figure 8, demonstrates superior results on validation sets compared to testing sets. The overall weighted average score, comprising total accuracy, reaches 97%, exceeding the corresponding score of 95% for testing sets. Upon closer examination of individual failure types, the F1 scores are generally high, ranging from 91% to 100%. However, there are few exceptions where the precision score for failure type 4 is relatively lower at 89%, and failure type 7 displays a comparatively lower recall score of 88%. Notably, these scores are only marginally inferior to those obtained for the same failure types on the testing sets.
The confusion matrices in Figure 9 show that the PyCaret model performed better before tuning. The best RF model predicted all failure types accurately, while the tuned RF model had misclassifications for failure types 2, 4, 5, 6, 7, and 8. Despite this, the tuned RF model still achieved a good F1 score of 96.37% on the testing set.
The confusion matrices of the AutoKeras model in Figure 10 show exceptional performance, accurately predicting the majority of the classes. The testing and validation confusion matrices were identical, indicating that the model did not overfit the training data. For both sets, all classes except class 4 had perfect precision and recall scores. However, for class 4, the precision was 89% for the validation set and 82% for the testing set, and the recall was 94% for the testing set.

6.4. Results Discussion

Figure 11 shows the comparison between the two proposed AutoML models on both testing and validation sets. The first plot displays the performance on the testing set, where the PyCaret model achieves an impressive score of 99.70% for all metrics. In contrast, the AutoKeras model has slightly lower scores of around 95%. The second plot displays the performance on the validation set. The best model (RF model) scores 95.60% for all metrics, while the AutoDNN model outperforms with a score of 97%.
Table 6 presents a summary of the performance of various ML models employed for fault classification in ball bearings, including the proposed AutoML models and traditional machine-learning methods from previous studies. The proposed AutoML model (PyCaret) utilizing the best machine-learning model (random forest) achieved an impressive accuracy of 99.70% on the testing sets and 95.60% on the validation sets, using only nine features. Comparatively, the best results achieved by other studies are those from Wang et al. [36] with a CNN achieving 99.92% accuracy using four features, and Rajput et al. [39] with a Fuzzy-CNN achieving 99.87% accuracy using 16 features. The CNN and Fuzzy-CNN models may have slightly higher accuracy, but the proposed AutoML model has several advantages that make it a more attractive choice. One of the primary benefits of AutoML models is their ability to automate the entire machine-learning process, including data preprocessing, model selection, and hyperparameter tuning. On the other hand, the CNN and Fuzzy-CNN machine-learning methods demand significant manual effort, including feature engineering and meticulous selection of layers, number of neurons, kernels, pooling size, and activation functions.
Furthermore, the design of Fuzzy-CNN models with effective fuzzy rules and membership functions requires expert knowledge of fuzzy logic. This necessitates a significant amount of domain knowledge of the application in question and its data. Thus, the need for highly skilled professionals and human intervention is greatly increased. While it is true that CNN and Fuzzy-CNN models may have slightly higher accuracy, the AutoML is more perforable due to its ease of use and automation ability. In addition, the Fuzzy-CNN model developed in [39] achieved a comparable accuracy level, but with a considerably larger feature set. This indicates that the proposed AutoML model may provide a more efficient and effective solution. By using fewer features, the AutoML model streamlines the process, potentially leading to faster training and reduced computational resources without sacrificing accuracy. The proposed AutoDNN model (AutoKeras) demonstrates competitive performance, achieving an accuracy of 95.00% on the testing sets and 97.00% on the validation sets. While this model does not surpass the CNN model in [36] or the Fuzzy-CNN model in [39] in terms of accuracy, it still significantly outperforms the majority of other methods presented in the table. Consequently, the AutoDNN model (AutoKeras) offers a valuable alternative for those seeking a reliable and efficient machine-learning solution with less effort.
Table 6. Summary of results comparison with recent relevant studies.
AuthorMethodAccuracy (%)Number of Features
Lin [40]Medium Gaussian SVM96.009
Coarse Gaussian SVM93.60
Fine Gaussian SVM89.60
rms
sd
72.60
71.30
Haung et al. [32] (training set of 75%)back-propagation neural network (BPNN)91.604
radial basis function neural network (RBFNN)83.60
wavelet neural network (WNN) 84.80
Wang et al. [36]CNN99.924
Fulgencio et al. [38]SVM84.7016
CNN90.6016
Rajput et al. [39]Fuzzy-CNN99.8716
Proposed AutoML model (PyCaret)Best ML:RF (testing sets)99.709
Best ML:RF (validation sets)95.60
Proposed AutoDNN model (AutoKeras)AutoDNN (testing sets)95.00
AutoDNN (validation Sets)97.00

7. Conclusions

This study focused on developing an automated approach for accurately classifying different types of faults in industrial IoT ball bearings using the CWRU dataset. The study aimed to investigate the potential of AutoML techniques for predictive maintenance while minimizing the need for manual hyperparameter tuning. The experimental results demonstrated that both the proposed AutoML and AutoDNN models effectively achieved accurate fault classification. Remarkably, the top-performing AutoML model attained an impressive 99.7% accuracy, recall, precision, and F1 score on the testing sets, with random forest emerging as the best algorithm. However, the proposed AutoDNN model displays better accuracy on the validation set, scoring 97% as opposed to AutoML’s 95.60%. The study underscores the benefits of employing AutoML techniques, enabling non-experts in the industry to handle predictive maintenance tasks more efficiently. Consequently, AutoML offers advantages such as automation, improved accuracy, and reduced resource requirements. Future work could explore integrating advanced feature-engineering techniques and domain knowledge to further enhance the model’s performance.

Author Contributions

Conceptualization, R.H.H., H.N.H. and A.M.H.; data curation, R.H.H. and H.N.H.; formal analysis, R.H.H. and H.N.H.; investigation, R.H.H. and H.N.H.; methodology, R.H.H., H.N.H. and A.M.H.; resources, R.H.H. and H.N.H.; software, R.H.H. and H.N.H.; supervision, A.J.H. and A.A.-J.; validation, A.J.H. and A.A.-J.; visualization, R.H.H. and H.N.H.; writing—original draft, R.H.H., H.N.H. and A.M.H.; writing—review & editing, A.J.H. and A.A.-J. All authors have read and agreed to the published version of the manuscript.

Funding

This research received no external funding.

Institutional Review Board Statement

Not applicable.

Informed Consent Statement

Not applicable.

Data Availability Statement

Not applicable.

Conflicts of Interest

The authors declare no conflict of interest.

References

  1. Nasser:, A.R.; Hasan, A.M.; Humaidi, A.J.; Alkhayyat, A.; Alzubaidi, L.; Fadhel, M.A.; Santamaría, J.; Duan, Y. IoT and Cloud Computing in Health-Care: A New Wearable Device and Cloud-Based Deep Learning Algorithm for Monitoring of Diabetes. Electronics 2021, 10, 2719. [Google Scholar] [CrossRef]
  2. Alwan, N.F.; Al-Nuaimi, M.K. The Role and Important of Internet of Things in Building Sustainable City. Eng. Technol. J. 2018, 36, 22–29. [Google Scholar] [CrossRef]
  3. Nasser, A.R.; Azar, A.T.; Humaidi, A.J.; Al-Mhdawi, A.K.; Ibraheem, I.K. Intelligent Fault Detection and Identification Approach for Analog Electronic Circuits Based on Fuzzy Logic Classifier. Electronics 2021, 10, 2888. [Google Scholar] [CrossRef]
  4. Cao, Q.; Zanni-Merk, C.; Samet, A.; Reich, C.; Beuvron, F.D.B.D.; Beckmann, A.; Giannetti, C. KSPMI: A Knowledge-based System for Predictive Maintenance in Industry 4.0. Robot. Comput. Manuf. 2021, 74, 102281. [Google Scholar] [CrossRef]
  5. Natesha, B.; Guddeti, R.M.R. Fog-based intelligent machine malfunction monitoring system for industry 4.0. IEEE Trans. Actions Ind. Inform. 2021, 17, 7923–7932. [Google Scholar]
  6. Al-Khazraji, H.; Nasser, A.R.; Hasan, A.M.; Al Mhdawi, A.K.; Al-Raweshidy, H.; Humaidi, A.J. Aircraft Engines Remaining Useful Life Prediction Based on A Hybrid Model of Autoencoder and Deep Belief Network. IEEE Access 2022, 10, 82156–82163. [Google Scholar] [CrossRef]
  7. Cardoso, D.; Ferreira, L. Application of Predictive Maintenance Concepts Using Artificial Intelligence Tools. Appl. Sci. 2020, 11, 18. [Google Scholar] [CrossRef]
  8. Turner, S.; Jassin, S.S.; Hassan, A.K. Optimizing artificial neural networks using LevyChaotic mapping on Wolf Pack optimization algorithm for detect driving sleepiness. Iraqi J. Comput. Commun. Control Syst. Eng. (IJCCCE) 2022, 22, 128–136. [Google Scholar]
  9. Lee, W.J.; Wu, H.; Yun, H.; Kim, H.; Jun, M.B.; Sutherland, J.W. Predictive Maintenance of Machine Tool Systems Using Artificial Intelligence Techniques Applied to Machine Condition Data. Procedia CIRP 2019, 80, 506–511. [Google Scholar] [CrossRef]
  10. Abood, A.M.; Nasser, A.R.; Al-Khazraji, H. Predictive Maintenance of Electromechanical Systems Using Deep Learning Algorithms: Review. Ing. Syst. Inf. 2022, 27, 1009–1017. [Google Scholar] [CrossRef]
  11. Ayvaz, S.; Alpay, K. Predictive maintenance system for production lines in manufacturing: A machine learning approach using IoT data in real-time. Expert Syst. Appl. 2021, 173, 114598. [Google Scholar] [CrossRef]
  12. Fadhil, H.M.; Abdullah, M.N.; Younis, M.I. A Framework for Predicting Airfare Prices Using Machine Learning. Iraqi J. Comput. Commun. Control Syst. Eng. 2022, 22, 81–96. [Google Scholar] [CrossRef]
  13. Li, Y.; Wang, X.; Si, S.; Huang, S. Entropy Based Fault Classification Using the Case Western Reserve University Data: A Benchmark Study. IEEE Trans. Reliab. 2019, 69, 754–767. [Google Scholar] [CrossRef]
  14. Zhang, W.; Yang, D.; Wang, H. Data-Driven Methods for Predictive Maintenance of Industrial Equipment: A Survey. IEEE Syst. J. 2019, 13, 2213–2227. [Google Scholar] [CrossRef]
  15. Tornede, T.; Tornede, A.; Wever, M.; Mohr, F. Automl for Predictive Maintenance: One Tool to Rul Them All, in IoT Streams for Data-Driven Predictive Maintenance and IoT, Edge, and Mobile for Embedded Machine Learning; Springer: Berlin/Heidelberg, Germany, 2020; pp. 106–118. [Google Scholar]
  16. Ferreira, L.; Pilastri, A.; Romano, F.; Cortez, P. Using supervised and one-class automated machine learning for predictive maintenance. Appl. Soft Comput. 2022, 131, 109820. [Google Scholar] [CrossRef]
  17. Shamayleh, A.; Awad, M.; Farhat, J. IoT Based Predictive Maintenance Management of Medical Equipment. J. Med. Syst. 2020, 44, 1–12. [Google Scholar] [CrossRef]
  18. Paolanti, M.; Romeo, L.; Felicetti, A.; Mancini, A.; Frontoni, E.; Loncarski, J. Machine Learning approach for Predictive Maintenance in Industry 4.0. In Proceedings of the 2018 14th IEEE/ASME International Conference on Mechatronic and Embedded Systems and Applications (MESA), Oulu, Finland, 2–4 July 2018; pp. 1–6. [Google Scholar] [CrossRef]
  19. Nasser, A.; Al-Khazraji, H. A hybrid of convolutional neural network and long short-term memory network approach to predictive maintenance. Int. J. Electr. Comput. Eng. (IJECE) 2022, 12, 721–730. [Google Scholar] [CrossRef]
  20. Ayodeji, A.; Wang, Z.; Wang, W.; Qin, W.; Yang, C.; Xu, S.; Liu, X. Causal augmented ConvNet: A temporal memory dilated convolution model for long-sequence time series prediction. ISA Trans. 2022, 123, 200–217. [Google Scholar] [CrossRef]
  21. Leite, D.; Martins, A.; Rativa, D.; De Oliveira, J.F.L.; Maciel, A.M.A. An Automated Machine Learning Approach for Real-Time Fault Detection and Diagnosis. Sensors 2022, 22, 6138. [Google Scholar] [CrossRef]
  22. Tornede, T.; Tornede, A.; Wever, M.; Hüllermeier, E. Coevolution of remaining useful lifetime estimation pipelines for automated predictive maintenance. In Proceedings of the GECCO ’21: Genetic and Evolutionary Computation Conference, Lille, France, 10–14 July 2021; pp. 368–376. [Google Scholar] [CrossRef]
  23. Cinar, E.; Kalay, S.; Saricicek, I. A Predictive Maintenance System Design and Implementation for Intelligent Manufacturing. Machines 2022, 10, 1006. [Google Scholar] [CrossRef]
  24. Ferreira, L.; Pilastri, A.; Sousa, V.; Romano, F.; Cortez, P. Prediction of Maintenance Equipment Failures Using Automated Machine Learning. In Proceedings of the International Conference on Intelligent Data Engineering and Automated Learning, Manchester, UK, 25–27 November 2021; Springer: Berlin/Heidelberg, Germany, 2021. [Google Scholar]
  25. Garouani, M.; Ahmad, A.; Bouneffa, M.; Hamlich, M.; Bourguin, G.; Lewandowski, A. Towards Meta-Learning Based Data Analytics to Better Assist the Domain Experts in Industry 4.0. In Artificial Intelligence in Data and Big Data Processing, Proceedings of the International Conference on Artificial Intelligence and Big Data in Digital Era, Ho Chi Minh, Vietnam, 18–19 December 2021; Springer: Berlin/Heidelberg, Germany, 2022. [Google Scholar] [CrossRef]
  26. Luo, C.; Zhang, Z.; Qiao, D.; Lai, X.; Li, Y.; Wang, S. Life Prediction under Charging Process of Lithium-Ion Batteries Based on AutoML. Energies 2022, 15, 4594. [Google Scholar] [CrossRef]
  27. Escalante, H.J.; Tu, W.-W.; Guyon, I.; Silver, D.L.; Viegas, E.; Chen, Y.; Dai, W.; Yang, Q. AutoML @ NeurIPS 2018 Challenge: Design and Results; Springer: Berlin/Heidelberg, Germany, 2019; pp. 209–229. [Google Scholar] [CrossRef]
  28. Loparo, K.; Case Western Reserve University Bearing Data Center. Bearings Vibration Data Sets; Case Western Reserve University: Cleveland, OH, USA, 2012; pp. 22–28. [Google Scholar]
  29. Wen, L.; Gao, L.; Li, X. A New Deep Transfer Learning Based on Sparse Auto-Encoder for Fault Diagnosis. IEEE Trans. Syst. Man Cybern. Syst. 2019, 49, 136–144. [Google Scholar] [CrossRef]
  30. Magar, R.; Ghule, L.; Li, J.; Zhao, Y.; Farimani, A.B. FaultNet: A Deep Convolutional Neural Network for Bearing Fault Classification. IEEE Access 2021, 9, 25189–25199. [Google Scholar] [CrossRef]
  31. Sharma, N.; Sidana, T.; Singhal, S.; Jindal, S. Predictive Maintenance: Comparative Study of Machine Learning Algorithms for Fault Diagnosis. In Proceedings of the International Conference on Innovative Computing & Communication (ICICC), Delhi, India, 19–20 February 2022. [Google Scholar]
  32. Huang, M.; Liu, Z.; Tao, Y. Mechanical fault diagnosis and prediction in IoT based on multi-source sensing data fusion. Simul. Model. Pract. Theory 2019, 102, 101981. [Google Scholar] [CrossRef]
  33. Jian, X.; Li, W.; Guo, X.; Wang, R. Fault Diagnosis of Motor Bearings Based on a One-Dimensional Fusion Neural Network. Sensors 2019, 19, 122. [Google Scholar] [CrossRef]
  34. Gangavva, C.; Mangai, J.A. An Investigation of Ensemble Learning Algorithms for Fault Diagnosis of Roller Bearing. In Advances in Parallel Computing Algorithms, Tools and Paradigms; IOS Press: Amsterdam, The Netherlands, 2022; pp. 117–125. [Google Scholar] [CrossRef]
  35. Wen, L.; Li, X.; Gao, L. A transfer convolutional neural network for fault diagnosis based on ResNet-50. Neural Comput. Appl. 2019, 32, 6111–6124. [Google Scholar] [CrossRef]
  36. Wang, J.; Wang, D.; Wang, S.; Li, W.; Song, K. Fault Diagnosis of Bearings Based on Multi-Sensor Information Fusion and 2D Convolutional Neural Network. IEEE Access 2021, 9, 23717–23725. [Google Scholar] [CrossRef]
  37. Han, S.; Jeong, J. An Weighted CNN Ensemble Model with Small Amount of Data for Bearing Fault Diagnosis. Procedia Comput. Sci. 2020, 175, 88–95. [Google Scholar] [CrossRef]
  38. Cascales-Fulgencio, D.; Quiles-Cucarella, E.; García-Moreno, E. Computation and Statistical Analysis of Bearings’ Time-and Frequency-Domain Features Enhanced Using Cepstrum Pre-Whitening: A ML-and DL-Based Classification. Appl. Sci. 2022, 12, 10882. [Google Scholar] [CrossRef]
  39. Rajput, D.S.; Meena, G.; Acharya, M.; Mohbey, K.K. Fault prediction using fuzzy convolution neural network on IoT environment with heterogeneous sensing data fusion. Meas. Sensors 2023, 26, 100701. [Google Scholar] [CrossRef]
  40. Lin, S.-L. Application of Machine Learning to a Medium Gaussian Support Vector Machine in the Diagnosis of Motor Bearing Faults. Electronics 2021, 10, 2266. [Google Scholar] [CrossRef]
  41. Selcuk, S. Predictive maintenance, its implementation and latest trends. Proc. Inst. Mech. Eng. Part B J. Eng. Manuf. 2017, 231, 1670–1679. [Google Scholar] [CrossRef]
  42. Carvalho, T.P.; Soares, F.A.A.M.N.; Vita, R.; Francisco, R.D.P.; Basto, J.P.; Alcalá, S.G.S. A systematic literature review of machine learning methods applied to predictive maintenance. Comput. Ind. Eng. 2019, 137, 106024. [Google Scholar] [CrossRef]
  43. Zonta, T.; da Costa, C.A.; da Rosa Righi, R.; de Lima, M.J.; da Trindade, E.S.; Li, G.P. Predictive maintenance in the Industry 4.0: A systematic literature review. Comput. Ind. Eng. 2020, 150, 106889. [Google Scholar] [CrossRef]
  44. Ran, Y.; Zhou, X.; Lin, P.; Wen, Y.; Deng, R. A survey of predictive maintenance: Systems, purposes and approaches. arXiv 2019, preprint. arXiv:1912.07383. [Google Scholar]
  45. Qian, G.; Liu, J. A comparative study of deep learning-based fault diagnosis methods for rotating machines in nuclear power plants. Ann. Nucl. Energy 2022, 178, 109334. [Google Scholar] [CrossRef]
  46. Gain, U.; Hotti, V. Low-code AutoML-augmented data pipeline–a review and experiments. J. Phys. Conf. Ser. 2021, 1828, 012015. [Google Scholar] [CrossRef]
  47. Demidova, L.A. Recurrent Neural Networks’ Configurations in the Predictive Maintenance Problems. IOP Conf. Series Mater. Sci. Eng. 2020, 714, 012005. [Google Scholar] [CrossRef]
  48. Hu, X.; Ban, Y.; Nascetti, A. Uni-Temporal Multispectral Imagery for Burned Area Mapping with Deep Learning. Remote Sens. 2021, 13, 1509. [Google Scholar] [CrossRef]
  49. Jin, H.; Song, Q.; Hu, X. Auto-keras: An efficient neural architecture search system. In Proceedings of the 25th Acm Sigkdd International Conference on Knowledge Discovery & Data Mining, New York, NY, USA, 4–8 August 2019. [Google Scholar]
  50. Singh, D.; Pant, P.K.; Pant, H.; Dobhal, D.C. Robust Automated Machine Learning (AutoML) System for Early Stage Hepatic Disease Detection. In Intelligent Data Communication Technologies and Internet of Things: Proceedings of ICICI 2020, Coimbatore, India, 27–28 August 2020; Springer: Berlin/Heidelberg, Germany, 2021. [Google Scholar]
  51. Boudiaf, A.; Moussaoui, A.; Dahane, A.; Atoui, I. A Comparative Study of Various Methods of Bearing Faults Diagnosis Using the Case Western Reserve University Data. J. Fail. Anal. Prev. 2016, 16, 271–284. [Google Scholar] [CrossRef]
  52. Zhang, S.; Zhang, S.; Wang, B.; Thomas, G. Habetler Deep learning algorithms for bearing fault diagnostics—A comprehensive review. IEEE Access 2020, 8, 29857–29881. [Google Scholar] [CrossRef]
  53. Li, S.-Y.; Gu, K.-R. Smart Fault-Detection Machine for Ball-Bearing System with Chaotic Mapping Strategy. Sensors 2019, 19, 2178. [Google Scholar] [CrossRef] [PubMed]
  54. Saidi, L.; Ben Ali, J.; Fnaiech, F. Application of higher order spectral features and support vector machines for bearing faults classification. ISA Trans. 2015, 54, 193–206. [Google Scholar] [CrossRef]
  55. Liu, C.; Tan, J.; Huang, Z. Fault Diagnosis of Rolling Element Bearings Based on Adaptive Mode Extraction. Machines 2022, 10, 260. [Google Scholar] [CrossRef]
  56. Neupane, D.; Seok, J. Bearing Fault Detection and Diagnosis Using Case Western Reserve University Dataset with Deep Learning Approaches: A Review. IEEE Access 2020, 8, 93155–93178. [Google Scholar] [CrossRef]
  57. Xu, Y.; Li, Z.; Wang, S.; Li, W.; Sarkodie-Gyan, T.; Feng, S. A Hybrid Deep-Learning Model for Fault Diagnosis of Rolling Bearings. Measurement 2021, 169, 108502. [Google Scholar] [CrossRef]
  58. Simeone, O. A Brief Introduction to Machine Learning for Engineers. Found. Trends® Signal Process. 2018, 12, 200–431. [Google Scholar] [CrossRef]
  59. Raschka, S. Python Machine Learning; Packt Publishing Ltd.: Birmingham, UK, 2015. [Google Scholar]
Figure 1. General proposed methodology flowchart.
Processes 11 01507 g001
Figure 2. Detailed overview of the modeling phase.
Processes 11 01507 g002
Figure 3. REB: exploded and geometric view [54].
Processes 11 01507 g003
Figure 5. Performance of proposed AutoDNN model on testing sets.
Processes 11 01507 g005
Figure 6. Proposed AutoDNN model architecture generated by the AutoKeras model.
Processes 11 01507 g006
Figure 7. Feature importance generated by Pycaret’s evaluate model function.
Processes 11 01507 g007
Figure 8. Performance of proposed AutoDNN model on validation sets.
Processes 11 01507 g008
Figure 9. Confusion matrix of the best AutoML model: (a) random forest classifier before tuning; and (b) random forest classifier after tuning.
Processes 11 01507 g009
Figure 10. Confusion matrices of the AutoDNN model: (a) testing sets; and (b) validation sets.
Processes 11 01507 g010
Figure 11. Performance comparison between the two proposed models: (a) testing sets; and (b) validation sets.
Processes 11 01507 g011
Table 1. Fault conditions in the CWRU bearing dataset.
Fault TypeSeverityDescriptionAbbreviation
Inner raceSmall (7 mils)Fault in the inner race of the bearingIR_007_1
Medium (14 mils)IR_014_1
Large (21 mils)IR_021_1
Outer raceSmall (7 mils)Fault in the outer race of the bearingOR_007_6_1
Medium (14 mils)OR_014_6_1
Large (21 mils)OR_021_6_1
BallSmall (7 mils)Fault in the balls of the bearingBall_007_1
Medium (14 mils)Ball_014_1
Large (21 mils)Ball_021_1
Table 2. Preprocessing operations applied on the fault classification dataset.
Preprocessing OperationDetails
Data BalancingRandom Under Sampler
NormalizationRobust Scaler
EncodingCategorical mapping
‘IR_007_1’: 0, ‘IR_014_1’: 1, ‘IR_021_1’: 2,
‘OR_007_6_1’: 3, ‘OR_014_6_1’: 4, ‘OR_021_6_1’: 5,
‘Ball_007_1’: 6, ‘Ball_014_1’: 7, ‘Ball_021_1’: 8,
‘Normal_1’: 9
Table 3. AutoML (PyCaret) model configuration summary.
DescriptionValue
Session id8337
Targetfault
Target type Multiclass
Original data shape (2185, 10)
Transformed data shape (2185, 10)
Transformed train set shape (1748, 10)
Transformed test set shape (437, 10)
Numeric features 9
Number of folds10
Table 4. Results of compare model function in PyCaret for the top five ML algorithms.
ModelAccuracy (%)Recall (%)Prec. (%)F1 (%)TT (S)
RF96.3496.3496.5196.320.1610
GBC96.2896.2896.5296.280.9490
ET96.2396.2396.4396.22 0.1670
LightGBM96.1796.1796.36 96.160.3560
XGBoost95.9495.9496.1295.920.0640
Table 5. Performance metrics of auto-tuned RF algorithm.
Fold No.Accuracy (%) Recall (%)Prec. (%)F1 (%)
096.5796.5796.8496.60
194.86 94.86 95.1594.88
296.5796.5796.9896.61
396.5796.5797.0096.55
498.8698.8698.8998.86
597.7197.7197.7497.70
694.2994.2994.2394.14
796.0096.0096.20 95.99
897.1397.1397.1297.11
995.4095.40 95.6495.24
Mean96.4096.40 96.5896.37
Std.0.01280.01280.01260.0131
Disclaimer/Publisher’s Note: The statements, opinions and data contained in all publications are solely those of the individual author(s) and contributor(s) and not of MDPI and/or the editor(s). MDPI and/or the editor(s) disclaim responsibility for any injury to people or property resulting from any ideas, methods, instructions or products referred to in the content.

