Article

Fuzzy Logic Regional Landslide Susceptibility Multi-Field Information Map Representation Analysis Method Constrained by Spatial Characteristics of Mining Factors in Mining Areas

School of Mining Engineering, Taiyuan University of Technology, Taiyuan 030024, China
*
Authors to whom correspondence should be addressed.
Processes 2023, 11(4), 985; https://doi.org/10.3390/pr11040985
Submission received: 31 January 2023 / Revised: 21 March 2023 / Accepted: 21 March 2023 / Published: 23 March 2023

Abstract

:
Landslide susceptibility analysis has become a necessary means of pre-disaster portal positioning and scientific early warning. How can an effective zoning model of landslide susceptibility be established to examine the important factors affecting landslide development in coal mine areas? Focusing on the need for a reliability analysis of landslide susceptibility in coal mine areas, landslide cataloging and environmental factor data were used as objects, combined with the knowledge of landslide mechanisms, disaster environmental factors and the spatial correlation of landslide disasters, the frequent landslide area of Jiumine in the main part of Xishan Coalfield was selected as the research area, and more than 50 influencing factors were collected and calculated. Eighteen factors with correlation coefficients of less than 0.3 were selected, and a landslide susceptibility analysis method combining the spatial characteristics of landslide factors and the heuristic fuzzy logic model was proposed. The influence of the fuzzy logic model on the accuracy of landslide susceptibility analysis results under different constraint modes was tested. The model is a mixture of knowledge-driven and data-driven models, and is compared with information model and SVM. Experimental results show that the proposed method is feasible and reliable, and improves the accuracy of model results.

1. Introduction

Landslides in the Shanxi coal mining area are a typical geological disaster phenomenon; they occur every year, thus directly threatening the development of mining areas, villagers, roads and vehicles, and having a significant and universal impact.
When the topographic conditions of an area are similar or not much different from the area where a landslide occurs, the area is considered to be a landslide-prone area. This theory believes that the instability of landslides is composed of a series of complex interrelated topographic parameters, such as the lithology and rock structure, erosion conditions and contact relationship with the overlying soil layer, the physical properties of the overlying soil layer, the slope of the slope and its external morphology, hydrological conditions, vegetation cover conditions, land use types and interaction of human activities. Scene analysis of landslide disasters is a spatial cognition process and is used to elucidate unperceived scene information to guide early warning and forecast disasters. The focus of landslide susceptibility evaluation is to study landslide factors in highly sensitive areas. Factors such as the topography, geological background, hydrogeology, historical records of landslide activities, engineering geological characterization of slippery or potential slippery bodies, sliding mechanism and scale of slippery or potential slippery bodies, shear mechanism and strength of fracture surfaces, stability evaluation, deformation and migration distance evaluation, should usually be considered. If the inducing or triggering factors of landslides are not considered, human engineering behavior, rainfall (or flooding, climatic conditions) and seismic factors should be excluded. Therefore, many evaluation factors of landslide susceptibility can be divided into topography, slope geometry, geological background, landslide survival environment and other categories [1].
At present, the most commonly used landslide susceptibility analysis methods generally include the deterministic model, knowledge-driven model and data-driven model. In terms of research based on deterministic models, Yang [2] conducted a detailed investigation of landslides and fissures in a coal mine area in Shaanxi Province, China, and studied the accumulation of landslides and fissures under the influence of subsidence, which helped to clarify the spatiotemporal evolution of slow sedimentation and its impact on loess landslides in coal mining areas. Jiang [3] used Geo-Studio software to calculate the slope safety factors in different states for measurement. The SHALSTAB model established by Montgomertry and Dietrich [4] in the 1990s was used to predict the northwest loess region and the southeast region where seasonal rainfall was more affected, and shallow landslides were more developed. Based on the SHALSTAB model, Pack et al. [5] applied the hydrological distribution model based on the Digital Elevation Model (DEM) to construct a SINMAP model. This model is mainly suitable for situations in which the landslide type is relatively simple, and the basic physical properties of the research object are quite uniform. This method relies on the laws of physics and can be used to analyze the main factors, but it has high requirements on parameters and is limited to small-scale areas.
The second is the knowledge-driven type, including the fuzzy logic method, fuzzy comprehensive evaluation method, analytic hierarchy process and expert system method. It needs the support of a landslide disaster mechanism, and is strongly influenced by the subjectivity of experts. It is difficult to flexibly cope with different research areas and disaster scenarios.
The third is the data-driven type, which is mainly based on statistical analysis theory, including information quantity analysis, support vector machine, random forest, artificial neural network and multivariate statistical analysis. Pal and Chowdhuri [6] used the frequency ratio method to map the susceptibility of landslides, and discovered the main parameters that caused the frequent occurrence of landslides in the Lacon River basin, the main branch of the Tista River in the Sikkim Himalayas. Chowdhuri et al. [7] proposed that the BRT-RF model is an effective way to improve the accuracy of LS prediction. Tian et al. [8] evaluated the susceptibility of geological disasters in Guangdong Province based on the deterministic coefficient (CF) model and the LR regression model. Through objective mathematical analysis and nonlinear characteristics, the accuracy of the calculation and analysis results is guaranteed, but a large number of observation samples with good global spatial representation are required, and the disaster mechanism of landslides cannot be deeply explored. The analysis results are thus easily under-fitted or over-fitted.
With the development of the geographic information system and the 3S (remote sensing, RS; geography information systems, GIS; global positioning systems, GPS) and artificial intelligence (AI) technology in the field of computer applications, research on landslide susceptibility has advanced. Landslide cataloging has become more efficient and accurate, the evaluation factor system (considering the contribution of factors) has become more reasonable and more intelligent models have been developed for application in studies on landslide susceptibility. In the data-intensive computing era, the landslide susceptibility analysis method, combining knowledge-driven and data-driven models, has received much attention. Ruidas et al. [9,10] combined SVR (support vector regression) with meta-heuristic algorithms such as PSO (particle swarm optimization) and GOA (grasshopper optimization algorithm) to construct a new GIS-based integrated model (SVR-PSO and SVR-GOA) for flash flood sensitive mapping (FFSM) in the Gandhiswari River basin in West Bengal, India.
In this study, we evaluated landslide susceptibility in mining areas, and mainly verified the applicability and accuracy of the knowledge-driven model plus data-driven model in coal mining, which is a new attempt. This paper hopes that through the analysis of the landslide body of the Shanxi coal mine, it will obtain a regular understanding of the formation mechanism of geological disasters such as landslides induced by the collapse of the goaf area, and provide guidance opinions with certain reference values for related research, which have a practical application significance.

2. Research Data

2.1. Study Area

The Xishan Coalfield is an important coking coal base in China and is one of the six major coalfields in Shanxi Province (Datong, Ningwu, Hedong, Xishan, Huoxi and Qinshui) [11]. It is located at the eastern foot of the Luliang Mountains in central Shanxi Province and west of Taiyuan City, about 15 km adjacent to the southeast of the Taiyuan-Jinzhong Basin, across the borders of Jiancao District, Wanberlin District, Jinyuan District, Loufan County, Qingxu County, Gujiao City, Jiaocheng County and Wenshui County of Lvliang City. The Xishan Coalfield (111°50′~112°40′ E and 37°50′~38°10′ N) is 68 km long from north to south, 36 km wide from east to west, and has a coal-bearing area of 1800 km2. The nine mines of the headquarters of Xishan Coal and Electricity Group are located in the north-central part of the coalfield. It is affiliated with the Xishan Coal and Electricity (Group) Co., Ltd. (Taiyuan, China) under the jurisdiction of Shanxi Coking Coal Group Co., Ltd. (Taiyuan, China). The nine mining areas for the headquarters of the Xishan Coal and Electricity Group are divided into two parts: the Qianshan mining area and the Gujiao mining area. Four pairs of mines are under the jurisdiction of Qianshan Mine: Baijiazhuang Mine, Duerping Mine, Guandi Mine and Ximing Mine. The Gujiao mining area has jurisdiction over five pairs of mines: Xiqu Mine, Zhenchengdi Mine, Malan Mine, Dongqu Mine and Tunlan Mine. The nine mines in the headquarters are Guandi Mine, Baijiazhuang Mine, Duerping Mine, Ximing Mine, Malan Mine, Xiqu Mine, Zhenchengdi Mine, Dongqu Mine and Tunlan Mine.
For the influencing factors of landslides, A factor of safety (static) for translational landslide:
FS = c + γ m γ ω Hcos 2 α tan φ γ Hsin α cos α
A factor of safety (pseudo-static-considering earthquake):
FS = c + γ Hcos 2 α γ Hkcos α sin α γ ω h ω cos 2 α tan φ γ Hsin α cos α + γ Hkcos 2 α

2.2. Data Resource

Landslide susceptibility analysis was conducted based on landslide geospatial datasets. The integrity and quality of the datasets directly affect the accuracy and reliability of the results of landslide susceptibility evaluation. According to the evaluation purpose, we divided the influencing factors into five categories: mining area factors, topographic factors, geological factors, hydrological factors, and other environmental factors. Mining area factors included goaf distance, mining disturbance and ground collapse density; terrain factors included elevation, slope, slope aspect and curvature; hydrological factors included various water body indices; geological factors included stratum lithology, fault distance, earthquake and earthquake peak acceleration; other environmental factors included annual precipitation, the normalized vegetation index, the building index, land use, road distance and river distance. The landslide catalog was obtained by remote sensing interpretation from the Shanxi Provincial Geological Hazard Environmental Monitoring Center. In total, 163 landslide disaster points were identified. All landslide disaster data were converted into a specific data format, and finally, spatial point data were generated (Figure 1). The geographical coordinates of the central points of the geological disaster represent their location. GIS software was used to establish a landslide catalog database, and QGIS was used for data visualization, management, editing and analysis, and the production of printed maps. Through the integration of GRASS, it supports powerful analysis functions, can run on Linux, Unix, Mac OSX and Windows systems, and supports a variety of vector, grid and database formats and functions, as shown in Table 1.
The experimental data in this study were characterized by diversification. DEM was based on the resampling of the 5 m resolution data generated by the UAV to a resolution of 30 m. All data were spatially preprocessed in this study and unified following the Beijing 1954 coordinates. The data consisted of continuous and discrete variables for the landslide disaster environmental evaluation factors. The discrete evaluation factors were classified and quantified, the continuous evaluation factors were classified and converted into discrete factors, and the input model was unified.

2.3. Selection Method of Landslide Susceptibility Evaluation Factors

2.3.1. Qualitative and Quantitative Methods

Different condition factors contribute unequally to the evolution of regional landslides [12,13,14,15,16]. Spatial characteristics and susceptibility analysis depend on the selection of landslide susceptibility evaluation factors. The geographical environment of disasters, the characteristics of landslides, the formation conditions and the influencing factors in different regions differ considerably. Therefore, to construct a landslide susceptibility evaluation factor set, the core disaster-prone factors in the disaster environment should be selected and flexibly based on the characteristics of the natural geographical environment and data acquisition in the study area.
To improve the efficiency and accuracy of the landslide susceptibility evaluation model, factors that strongly affect the development of landslides should be selected based on the following principles:
  • Inheritance: relevant experience in selecting impact factors in previous studies.
  • Scientific: selecting the disaster factors that play a key role in the occurrence of landslide disasters to make the selection of factors more scientific and reasonable.
  • Independence: when selecting evaluation factors, influence factors with low correlation and high independence should be selected to avoid the overlapping and crossing of factors.
  • Practicality: the selected evaluation factors should be meaningful, easy to obtain and process, and concise and maneuverable. One should also be able to collect data corresponding to these factors and standardize and quantify them for performing statistical analyses.

2.3.2. Pearson’s Correlation Coefficient

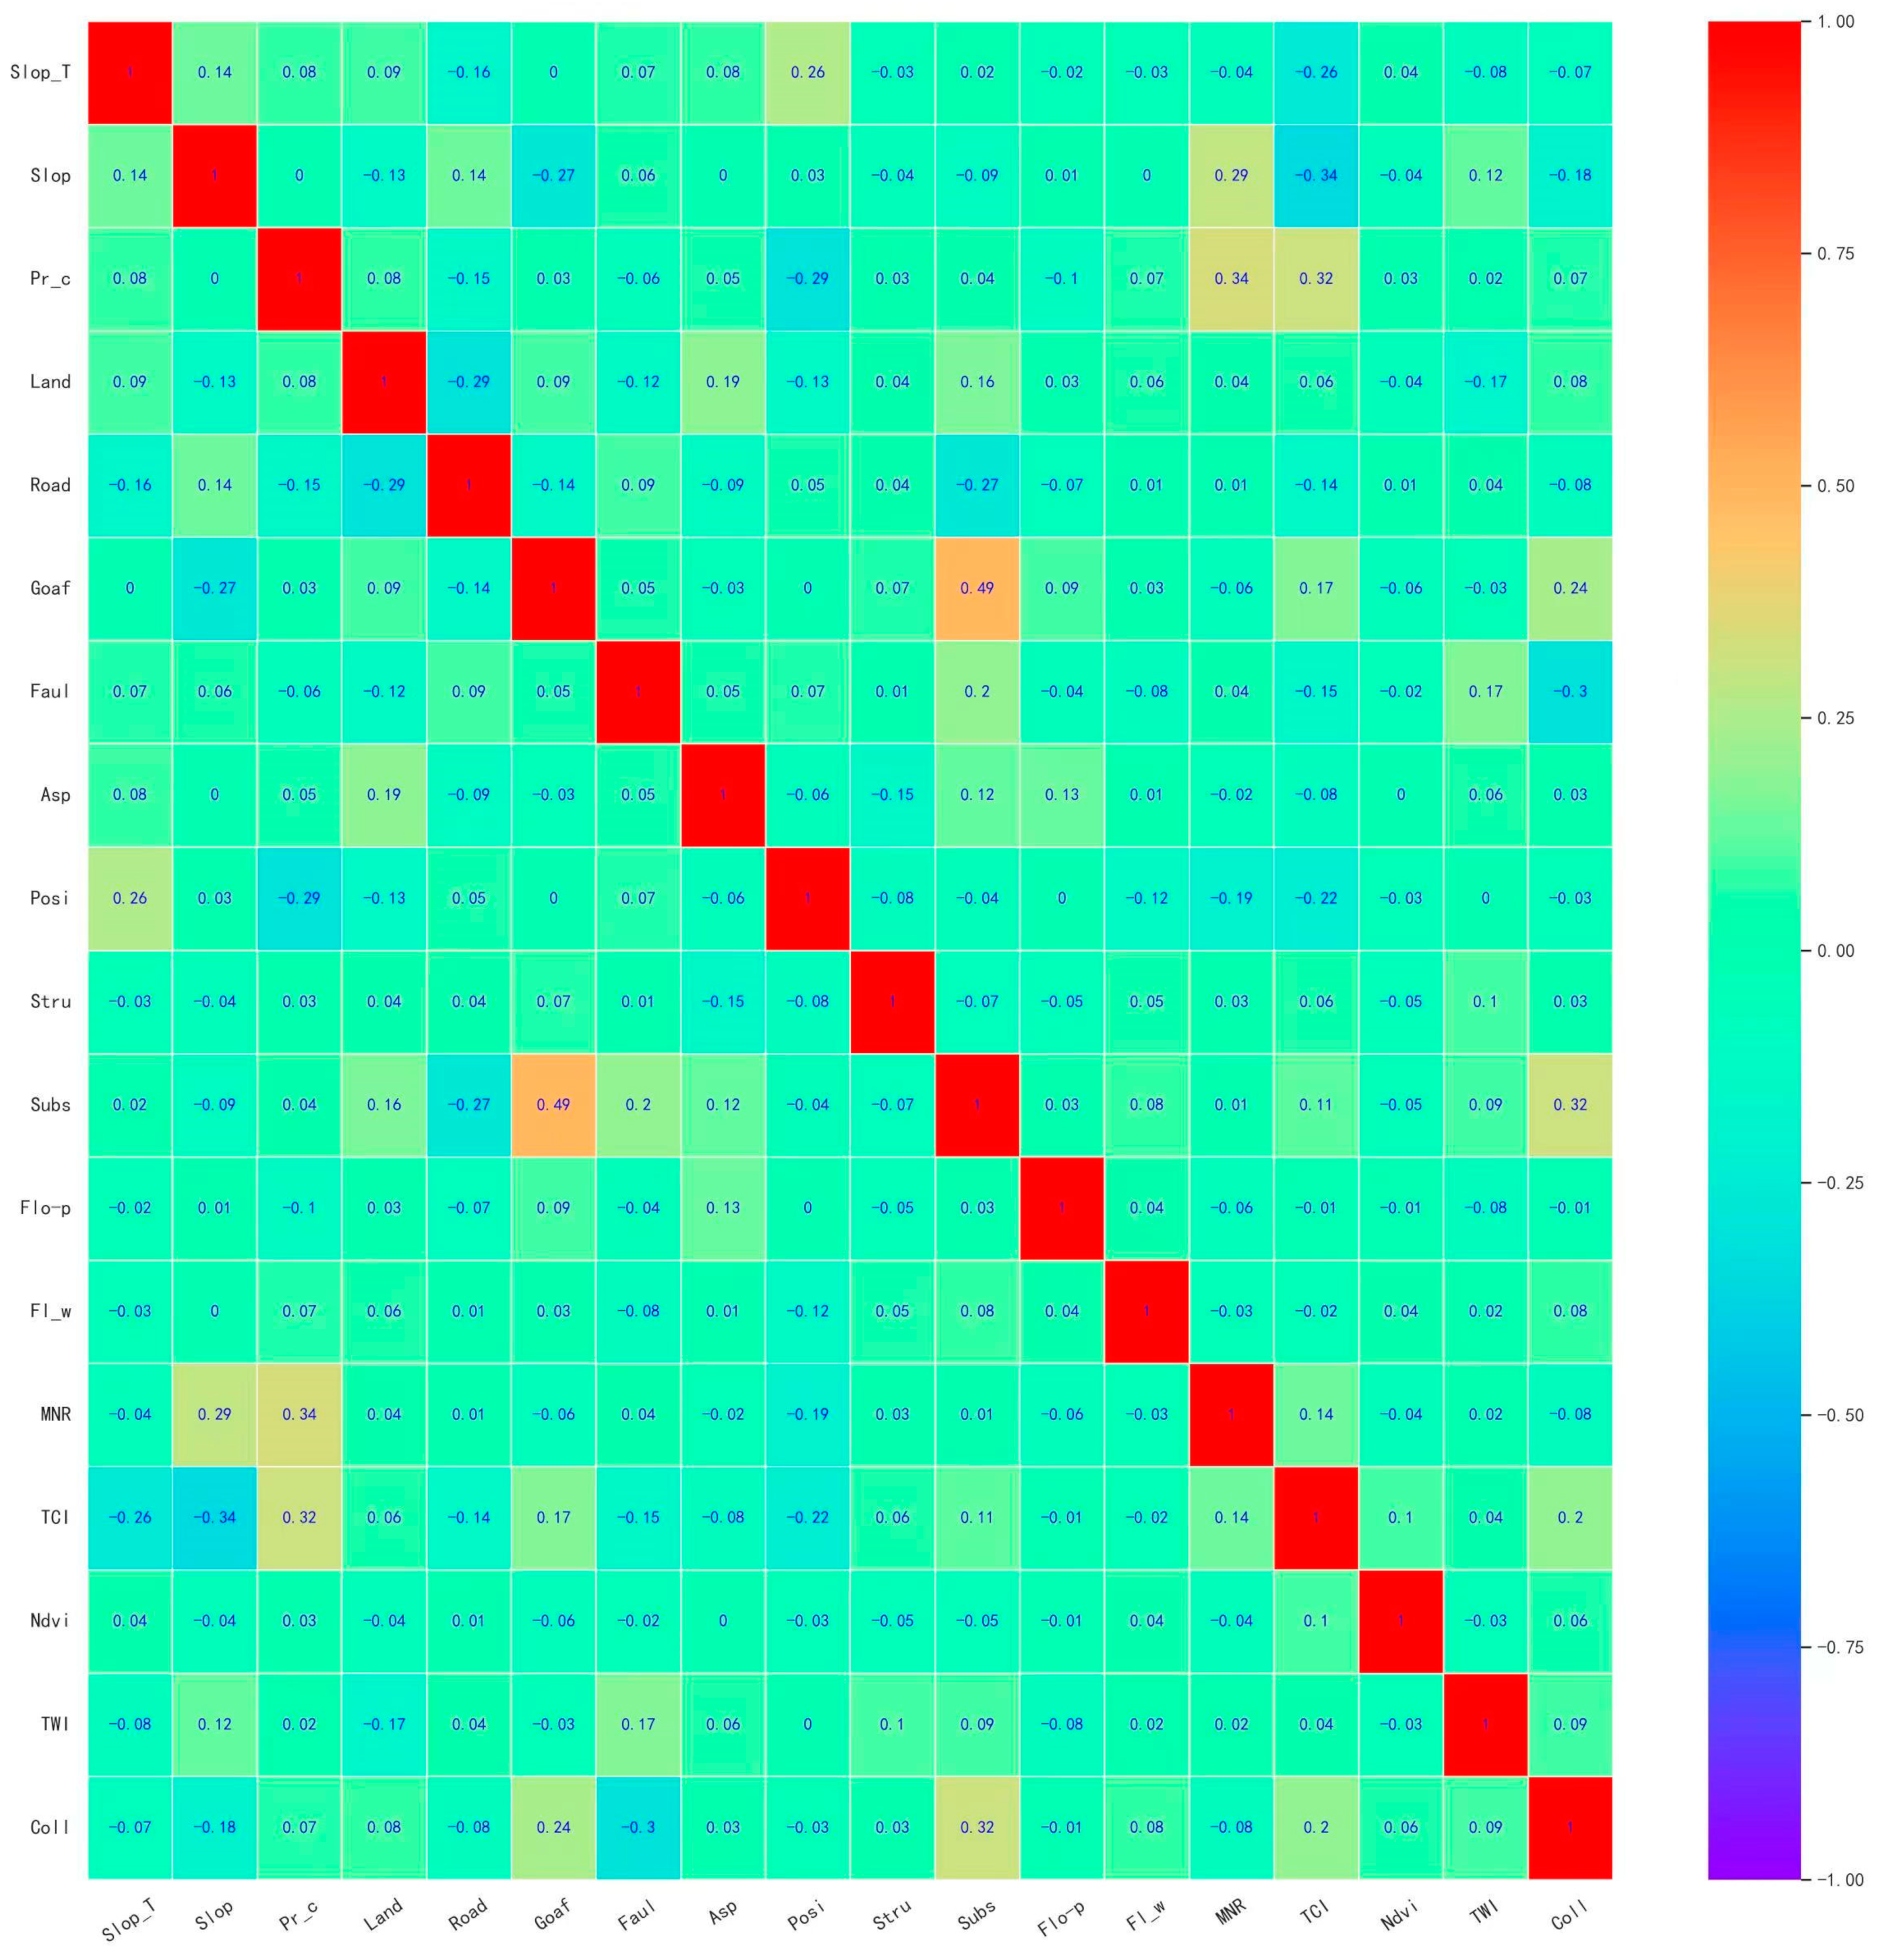
The landslide-dominant factors are generally selected based on the degree of correlation between factors and landslides, as well as the degree of collinearity between factors. A single qualitative selection principle is highly subjective and cannot remove redundant evaluation factors effectively. When selecting factors, whether the factors satisfy the principle of independence needs to be confirmed. In this study, Pearson’s correlation analysis was performed to eliminate factors with high correlation, and 54 influencing factors were selected for determining the correlation coefficient; a correlation coefficient below 0.3 was selected. We used 18 factors as model input factors (Figure 2 and Table 2).

2.4. Influencing Factors and Quantitative Classification of Landslides in Mining Areas

2.4.1. Profile Curvature

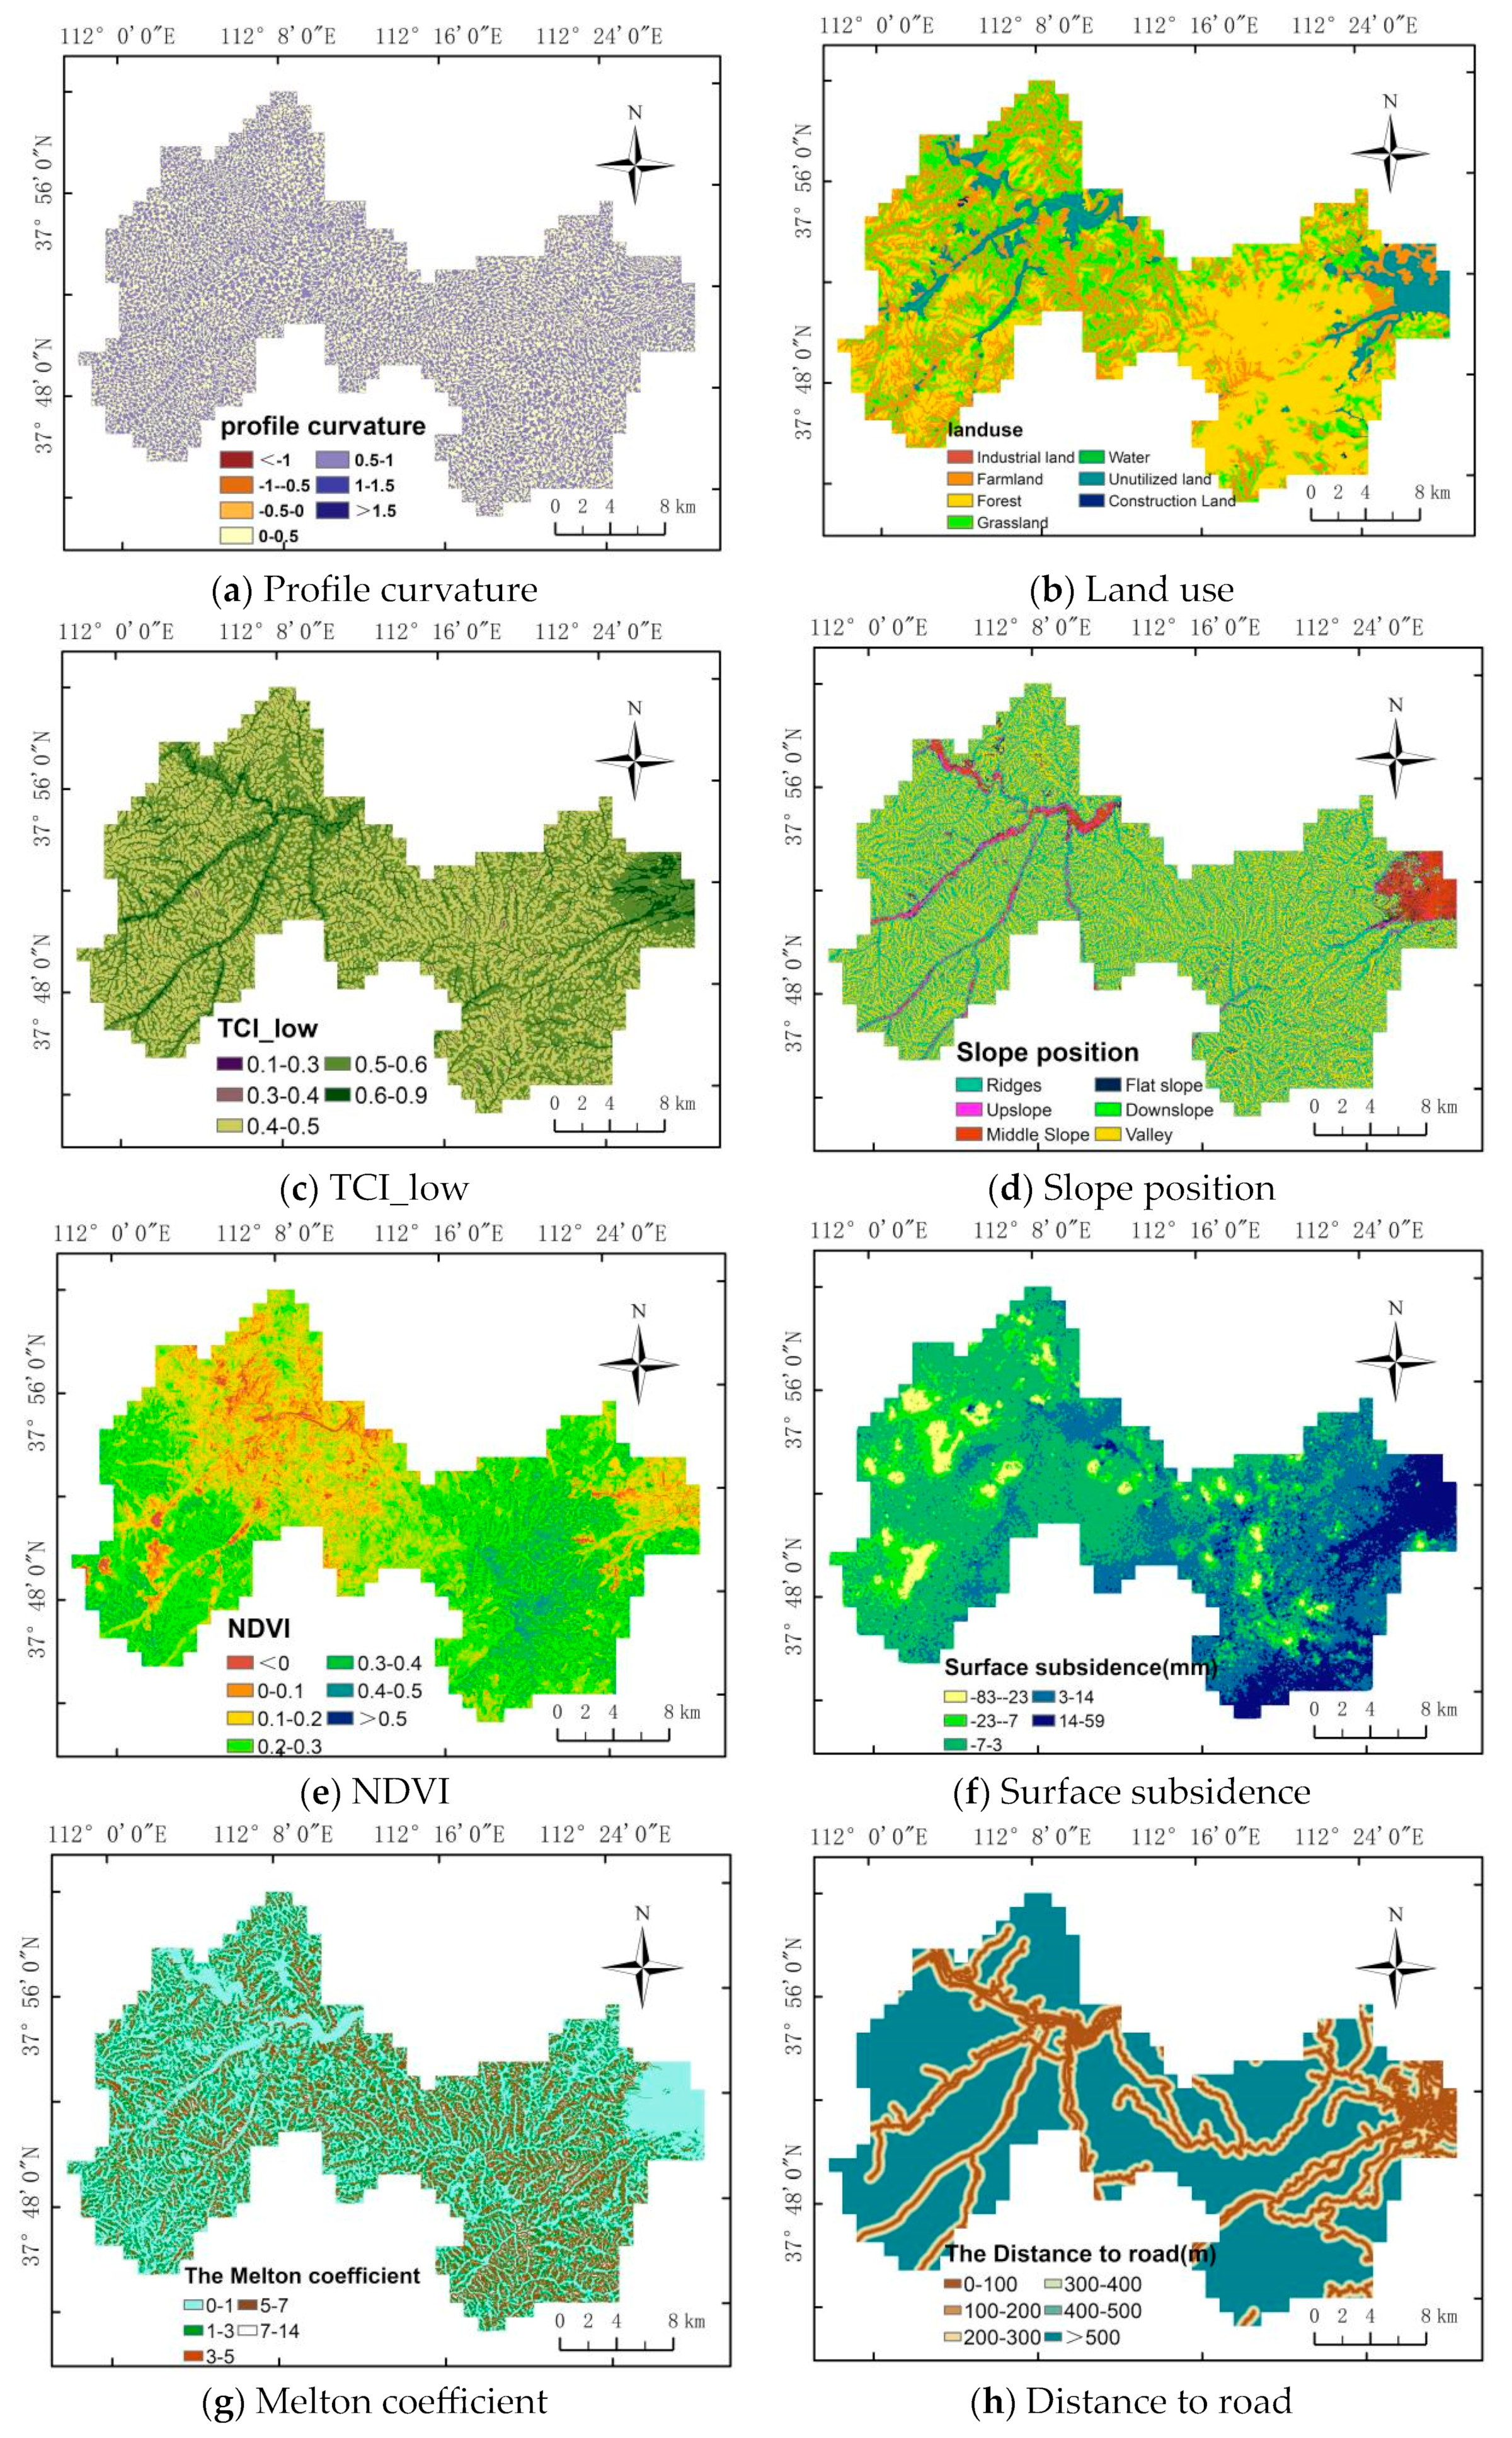
The curvature of the ground can reflect the structure and form of the terrain to a certain extent [17,18]. Places with a large curvature generally have alternating ridges and valleys. In these areas, the relative height difference is large, the terrain is steep, and geological disasters, such as landslides, are more likely to occur. On the contrary, areas with a small curvature have relatively flat terrain with a more stable structure, which decreases the probability of the occurrence of geological disasters. We used the profile curvature in this study. The section curvature value considers “0” as the dividing line, which can be divided into a concave slope, straight slope and convex slope. Landslides are concentrated in the concave or convex areas, where human activities and landslides form more sedimentary materials (Figure 3a).

2.4.2. Land Use

Different land use types have different probabilities of landslides as they show different degrees of human disturbance and damage to the rock and soil layers. Some land use types are conducive to slope stabilization and reduce landslide occurrence, while others disrupt the stability of the slope and cause damage to the slope body. Factors such as slope loading and surface structure play a key role, and they also influence the reactivation of ancient landslides and the development of landslides. In areas with a soft surface structure and other aspects, the chances of ancient landslide resurrection and slope instability are high; additionally, landslides might be directly induced in such areas (Figure 3b).

2.4.3. Terrain Classification Index for Lowlands (TCI_Low)

TCI_Low can provide a lot of information on the terrain, especially in shallow slope areas. Rocks and soils with a higher TCI_Low are generally found in lower altitude areas and have a higher water-holding capacity, which increases the chances of landslides (Figure 3c).

2.4.4. Slope Position

The slope position in different parts of the slope surface (ridge, upslope, middle slope, flat slope, downhill slope and valley) has different topographic and geomorphological characteristics. Different parts of the lithology and hydrogeology along with many other factors also show different characteristics. The slope position strongly influences many disaster-related computational models. There are generally more disaster points distributed in ridges and valleys and fewer disaster points in flat areas (Figure 3d).

2.4.5. NDVI

Generally, vegetation has a stable maintenance effect on the detrital soil required for the development of landslides. Higher vegetation coverage decreases the frequency of landslides. However, areas with high vegetation coverage accelerate the formation of high-speed and long-distance landslides (Figure 3e).

2.4.6. Mining Subsidence

Underground mining changes the original stress balance state of overlying rocks and the surface slope, which causes surface subsidence and provides dynamic conditions for mountain instability. Dynamic conditions are the inducing factors, which superimpose, influence and synergize with topographic and material conditions to promote landslides (Figure 3f).

2.4.7. The Melton Coefficient

The Melton coefficient is an index related to flow accumulation and is used to measure the roughness and mean slope of a basin. It reflects the dynamics of the catchment and its susceptibility to landslides and is widely used to investigate landslides. A higher Melton coefficient indicates a higher frequency of landslides in the region. Hence, it is very informative in studies on landslides (Figure 3g).

2.4.8. Road

Road construction can change regional geological conditions, cause slope instability and lead to landslides (Figure 3h).

2.4.9. Topographic Wetness Index (TWI)

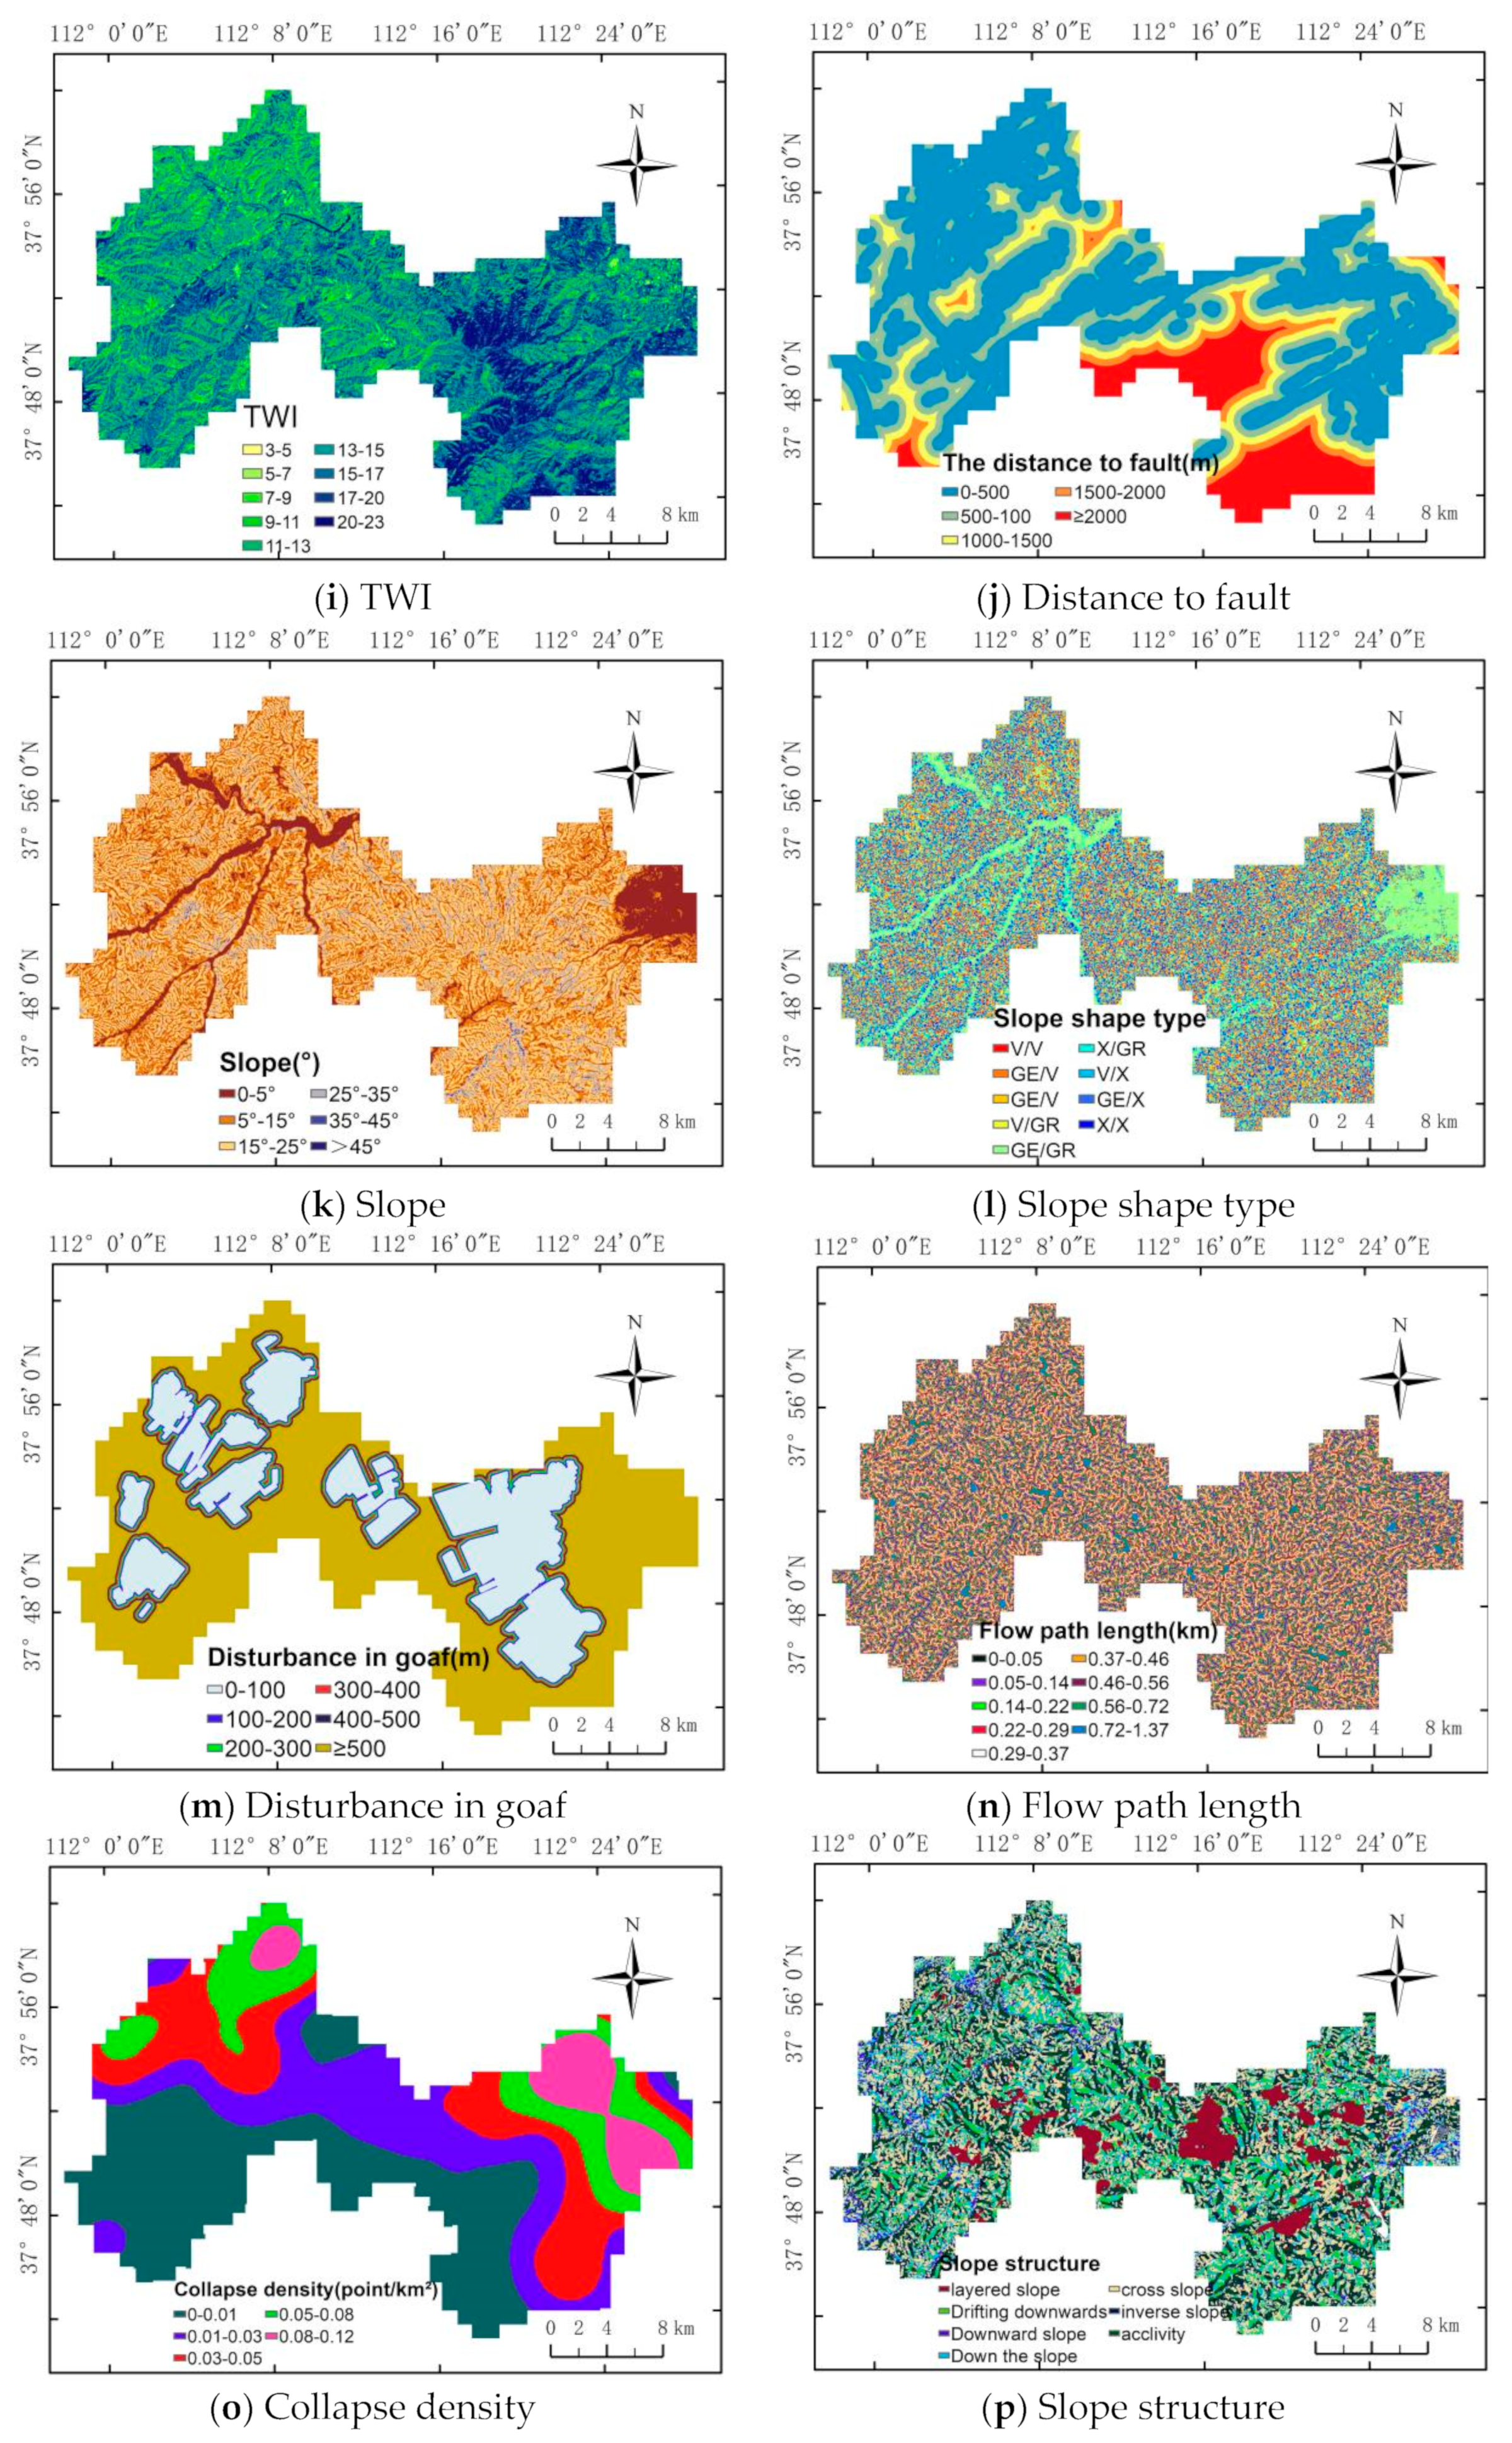
The TWI is often used to quantify the effect of topography on hydrological processes. The content and distribution of water in the rock and soil mass affect the rock and soil mass and the vegetation on the surface of the slope, thus affecting the occurrence of landslides. The TWI is smaller at ridges and summits and larger at valleys. Higher values of the TWI indicate greater chances of landslides (Figure 3i).

2.4.10. Fault

Many broken zones develop easily on both sides of the fault zone structure. They form weak structural planes of landslides, which cause the rocks to break and decrease the stability of the slope. The chances of landslides are higher closer to the fault zone structure (Figure 3j).

2.4.11. Slope

The slope gradient differentially influences the stress distribution, surface runoff, groundwater level, accumulation of loose slope deposits and human engineering activities on the slope body. Thus, it affects the overall stability of the slope body. The steeper the slope, the easier it is to slide down the slope. However, after the slope reaches the critical value, the accumulation of soil and other loose materials decreases, and human activities also decrease, showing a trend of decreasing landslides (Figure 3k).

2.4.12. Slope Shape Type

The curvature represents the convex and concave shapes of the slope. Generally, a linear slope has a larger slope and a greater slope height, and it is less prone to landslides. Convex slopes generally have gentle upper slopes and steeper lower slopes, which increases the chances of landslides. A concave slope is relatively stable, the lower part has a certain supporting effect on the upper part, and thus, it is generally not easy to develop landslides in areas with concave slopes. However, if the lower part of the slope is washed and soaked by rainwater for a long time, the stability of the lower slope decreases, and the area becomes landslide prone. Therefore, by arranging and combining the two kinds of curvatures, i.e., plane curvature and section curvature, the slope morphology can be divided into nine types, concave/concave (V/V), elongated/concave (GE/V), convex/concave (X/V), concave/flat (V/GR), elongated/flat (GE/GR), convex/flat (X/GR), concave/convex (V/X), elongated/convex (GE/X) and convex/convex (X/X) (Figure 3l).

2.4.13. The Disturbance in Goaf

The goaf area of the nine mines in the headquarters of Xishan Coalfield accounted for 23.59%. Underground coal mining forms a mined-out area, which undergoes complex dynamic deformation of alternating “stretching-compression”. When the deformation exceeds the mechanical strength of the rock in the weak zone, the slope body loses its support. Valley slopes can be formed easily by landslides under gravity. The range of landslides is generally related to the position of the goaf, and the occurrence of some landslides in the mining area mainly depends on the control of the goaf (Figure 3m).

2.4.14. Flow Path Length

The flow path length characterizes the aggregation time of the river water. The flow path is long in most areas, and the distance in which the water flows directly affects the speed of the ground runoff on the ridge line in the area with a small flow path length. Thus, the erosive force on the ground rock and soil mass is affected by the flow path length (Figure 3n).

2.4.15. Collapse Density

The density of ground collapse strongly affects the occurrence of geological disasters. The ground subsidence significantly decreases the stability of the mine surface and increases the occurrence of landslides (Figure 3o).

2.4.16. Slope Structure

In this study, the slope structure was classified according to landslide stability. Based on previous studies, the slope structure was divided into nine types by studying the relationship between the four major factors of regional stratigraphic dip, including the angle, inclination, slope and slope aspect. The types of slopes included layered slope, drifting slope, downward slope, down the slope, cross slope, inverse slope and acclivity. The structure of the slope controls the strength of landslides, and different slope structures increase the chances of different types of landslides (Figure 3p).

2.4.17. Slope Aspect

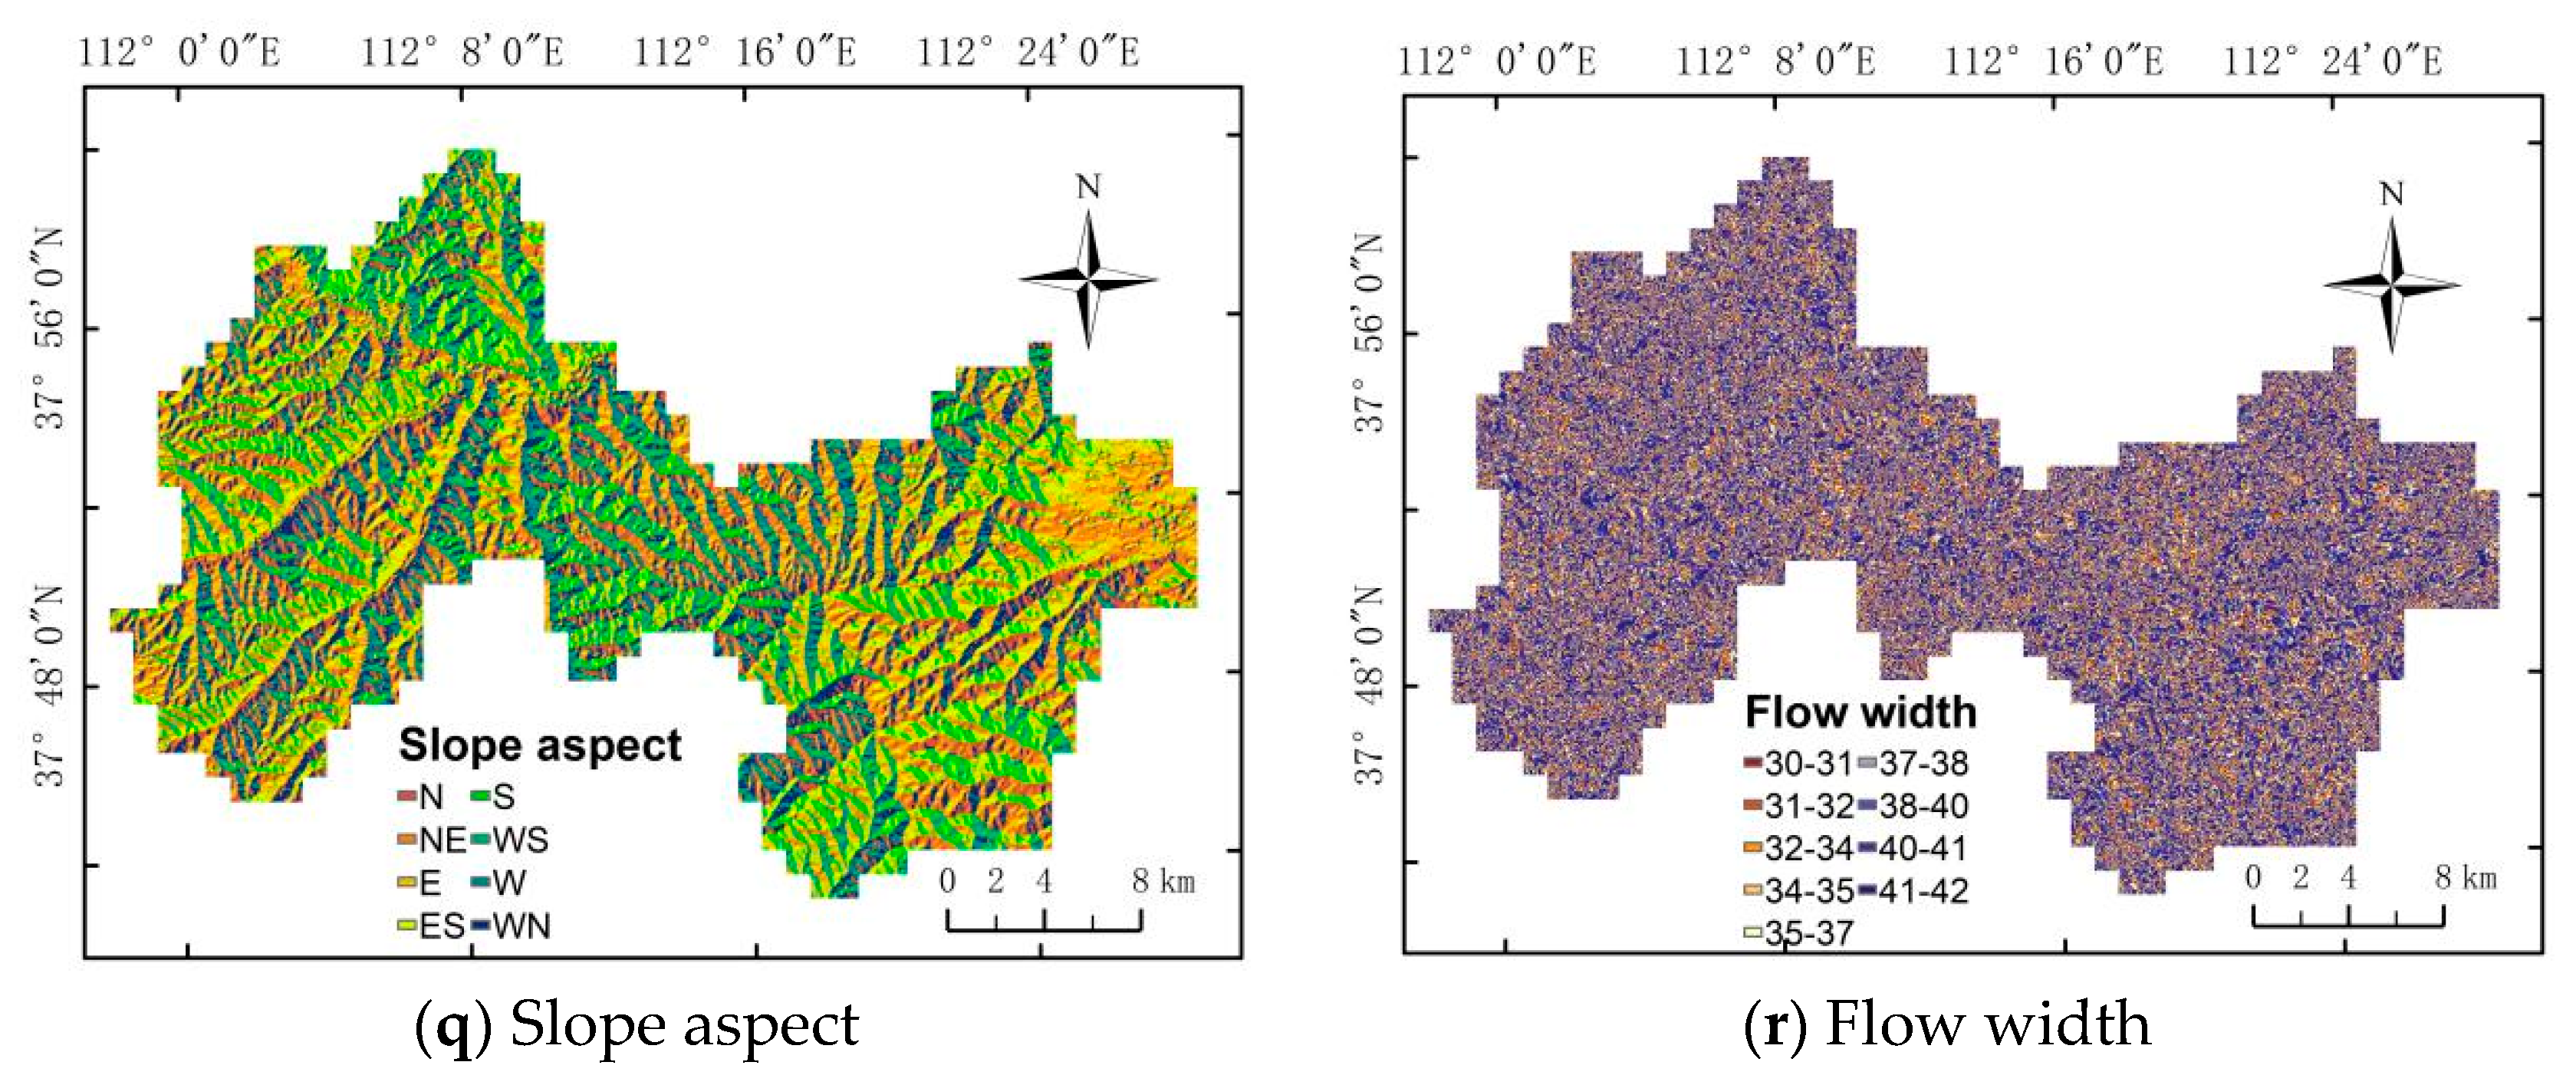
The environmental factors, such as light and temperature, differ between slopes. These factors affect other factors, such as evaporation and vegetation cover. Under the combined action of these factors, the soil moisture content and soil properties are affected. Changes in soil properties affect the occurrence of landslides (Figure 3q).

2.4.18. Flow Width

The influence of the width of the river on geological hazards is significant. The undercut effect of the river width is relatively weak, and the effect of the erosion of flowing water on the slope foot on both sides is also weakened. The impact on the formation of geological disasters is not obvious. For a narrow river, the erosion of the river and the lateral erosion are strong, which significantly affects the stability of the valley slope.
In this study, 163 landslide disaster points were included in the dataset. According to the requirements of the experiment, non-disaster negative sample points were constructed, the 500 m buffer zone and river waters of historical landslide disaster points were ignored and 164 non-disaster point data were generated by performing 1:1 random sampling. Then, random selection and cross-validation were performed to extract 70% of the sample data for analyzing the training model and 30% for testing the accuracy of the validation model. In this study, we quantitatively classified the 18 impact factors after screening.

3. Methodology

3.1. Fuzzy Logic Model of Mining Area Factor Constraints

Quantitative Description of Spatial Characteristics and Laws of Landslide Disaster Environmental Factors

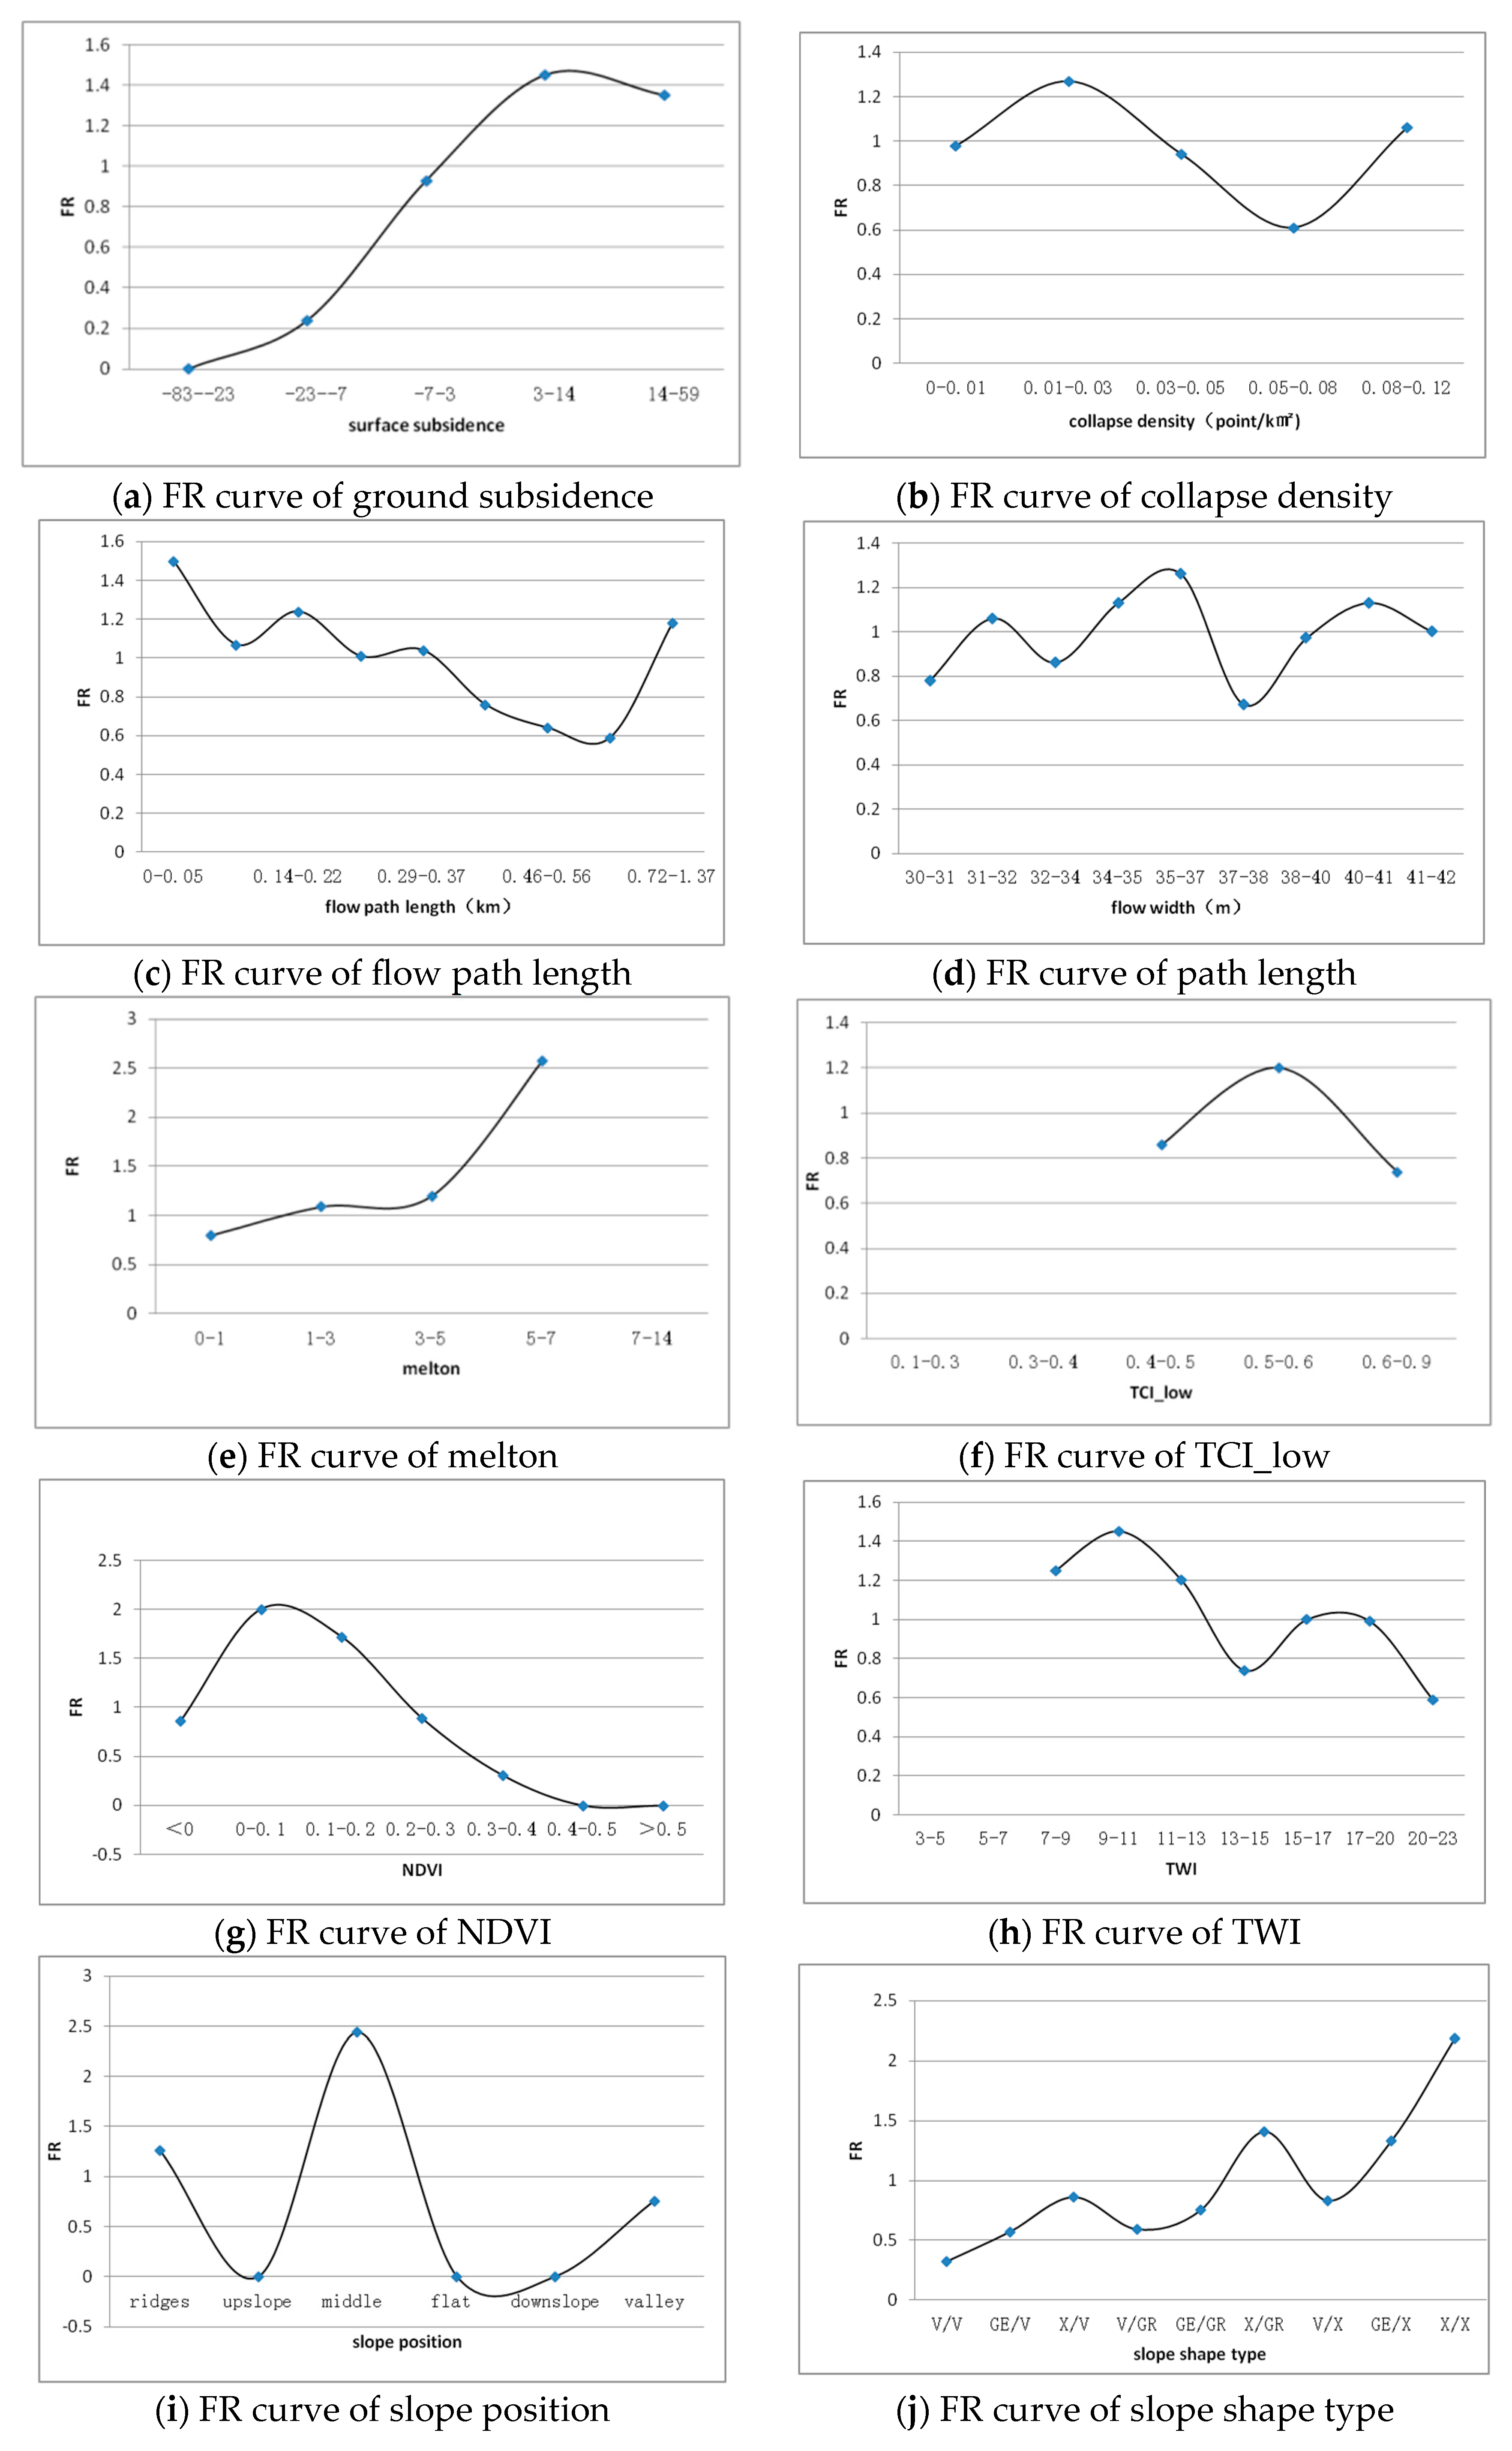
The landslide frequency ratio (FR) can be used as an objective reference for constructing the fuzzy mapping relationship between disaster environmental factors and landslide susceptibility. It can be used to characterize the law of landslide development and evolution in each classification of factors. According to the first law of geography proposed by Tobler [19], “All things are related, but nearby things are more related than distant things”. The probability of landslide disasters is similar in areas with similar geological conditions. The model links the spatial distribution characteristics of disaster points in the study area with different levels of disaster-causing factors to evaluate landslide susceptibility in the study area. The accuracy of the FR model mainly depends on the classification level of each disaster-causing factor. Information entropy can be used to measure the validity and reliability of the statistical results of sample data [20,21]. It is widely used to determine the weights in multiple comprehensive evaluations of natural disasters, such as debris flow, sandstorms, droughts, floods and environmental quality evaluation. It is an open system that exchanges matter and energy with the surroundings. Thus, the information entropy theory can be used to measure and describe material and energy exchange processes. The information entropy of a landslide refers to the contribution of various factors to the occurrence and development of the landslide. The entropy weight obtained by calculating the entropy represents the relative contribution of the internal evaluation factors of the landslide disaster event system [22]. The information entropy (Ei) is inversely proportional to the entropy weight (WEi); a smaller information entropy indicates greater information certainty in the sample data representing the landslide disaster environmental factor and greater stability of the relative entropy weight (WEi). This suggests that the disaster environmental factors contribute more to the occurrence of landslides [23].
The formulae for calculating the landslide frequency ratio, information entropy and entropy weight are as follows:
F R i j = N i / N S i / S
W E i = 1 E i i = 1 n ( 1 E i )
K = 1 / ln ( k i )
E i = K j = 1 k P i j ln ( P i j )
P i j = F R i j j = 1 k F R i j
Here, N and S represent the total number of landslide units in the study area and the total area of the study site, respectively. Ni and Si represent the number of landslide units and the area under the classified area distributed in the specific classification category of the disaster environment factor (ui). Pij represents the susceptibility evaluation factor of the ith landslide. The landslide probability density of a specific category at the jth level is usually approximated by the historical landslide frequency ratio FRij. The information entropy Ei is calculated from the historical landslide hazard distribution probability Pij, where K represents a constant term determined by the value of the graded category Ki of each landslide susceptibility evaluation factor.
To analyze the effects of the 18 factors on the development of landslides, we plotted the landslide frequency ratio curves (Figure 4) and ranked the information entropy weights to measure the contribution to landslides. The horizontal axis indicates the rank of each factor. The vertical axis represents the landslide frequency ratio, as shown in Table 3.

3.2. Fuzzy Logic Theory

The fuzzy logic theory was proposed by the American mathematician Zadeh [24] and is an extension of classical set theory. Because it can be used to study uncertain things and solve ambiguity problems, researchers have used it widely in various fields of image recognition, artificial intelligence, medical diagnosis, geological evaluation, psychology and philosophy, and have achieved remarkable results. Fuzzy logic is mostly used to express qualitative knowledge and experience with unclear boundaries [25]. Fuzzy set theory expresses fuzzy objects mathematically and makes up for the deficiency of binary logic when describing the fuzzy inclusion relationship between elements and sets. The advantage of fuzzy logic is that it can deal with fuzzy propositions, induce fuzzy conditions based on natural language, use fuzzy language rules, model objects with fuzzy concepts and obtain approximate fuzzy conclusions by reasoning. Compared to the classical set, for any set A, any element u of U in the universe of discourse, either A or does not belong to ∉A. A set can also be defined by its characteristic function:
C A ( u ) = 1 ,   u A 0 ,   u A
According to the fuzzy set, the elements in the universe can “partially belong” to set A. The degree to which an element belongs to set A is called the membership degree, and fuzzy sets can be defined by the membership function. The definition of a fuzzy set can be expressed as follows: if there is a common set U, any mapping f from U to the [0, 1] interval can determine a fuzzy subset of U, which is called fuzzy set A in the universe of discourse. The mapping f is called the membership function of the fuzzy set. For the last element u of U, f(u) represents the membership degree of u to the fuzzy set. It can also be represented as A(u). The degree of membership indicates the degree. The higher the degree of u belonging to A, and vice versa, the lower the degree of u belonging to A.

3.2.1. Constructing the Membership Function of Environmental Factors of Landslide Hazards in the Study Area

The fuzzy mapping of the factors for evaluating landslide susceptibility can be used to express the nonlinear relationship between landslide hazard environmental factors and landslide hazard environment spatial susceptibility by constructing a fuzzy membership function. It converts the eigenvalues of the evaluation factors in the landslide hazard environment into landslide spatial susceptibility. The fuzzy membership function is applied to the landslide susceptibility analysis, and the input variable is defined as the regional landslide susceptibility evaluation factor set U = {u1, u2…ui…un}. ui represents the characteristics of a single landslide susceptibility evaluation factor set; the output variable F = {f1, f2…fi…fn}. The landslide susceptibility fuzzy membership degree set fi is the single landslide susceptibility fuzzy set transformed by evaluation factor mapping. The membership function hi(x) is the corresponding rule to fuzzify the input factor eigenvalue ui to the landslide-sensitive fuzzy set fi. The fuzzy mapping process is as follows:
h i ( x ) : u i f i             f i = y / y = h i ( x ) , x u i   H ( x ) : U F           u i U , f i F , h i ( x ) H ( x )
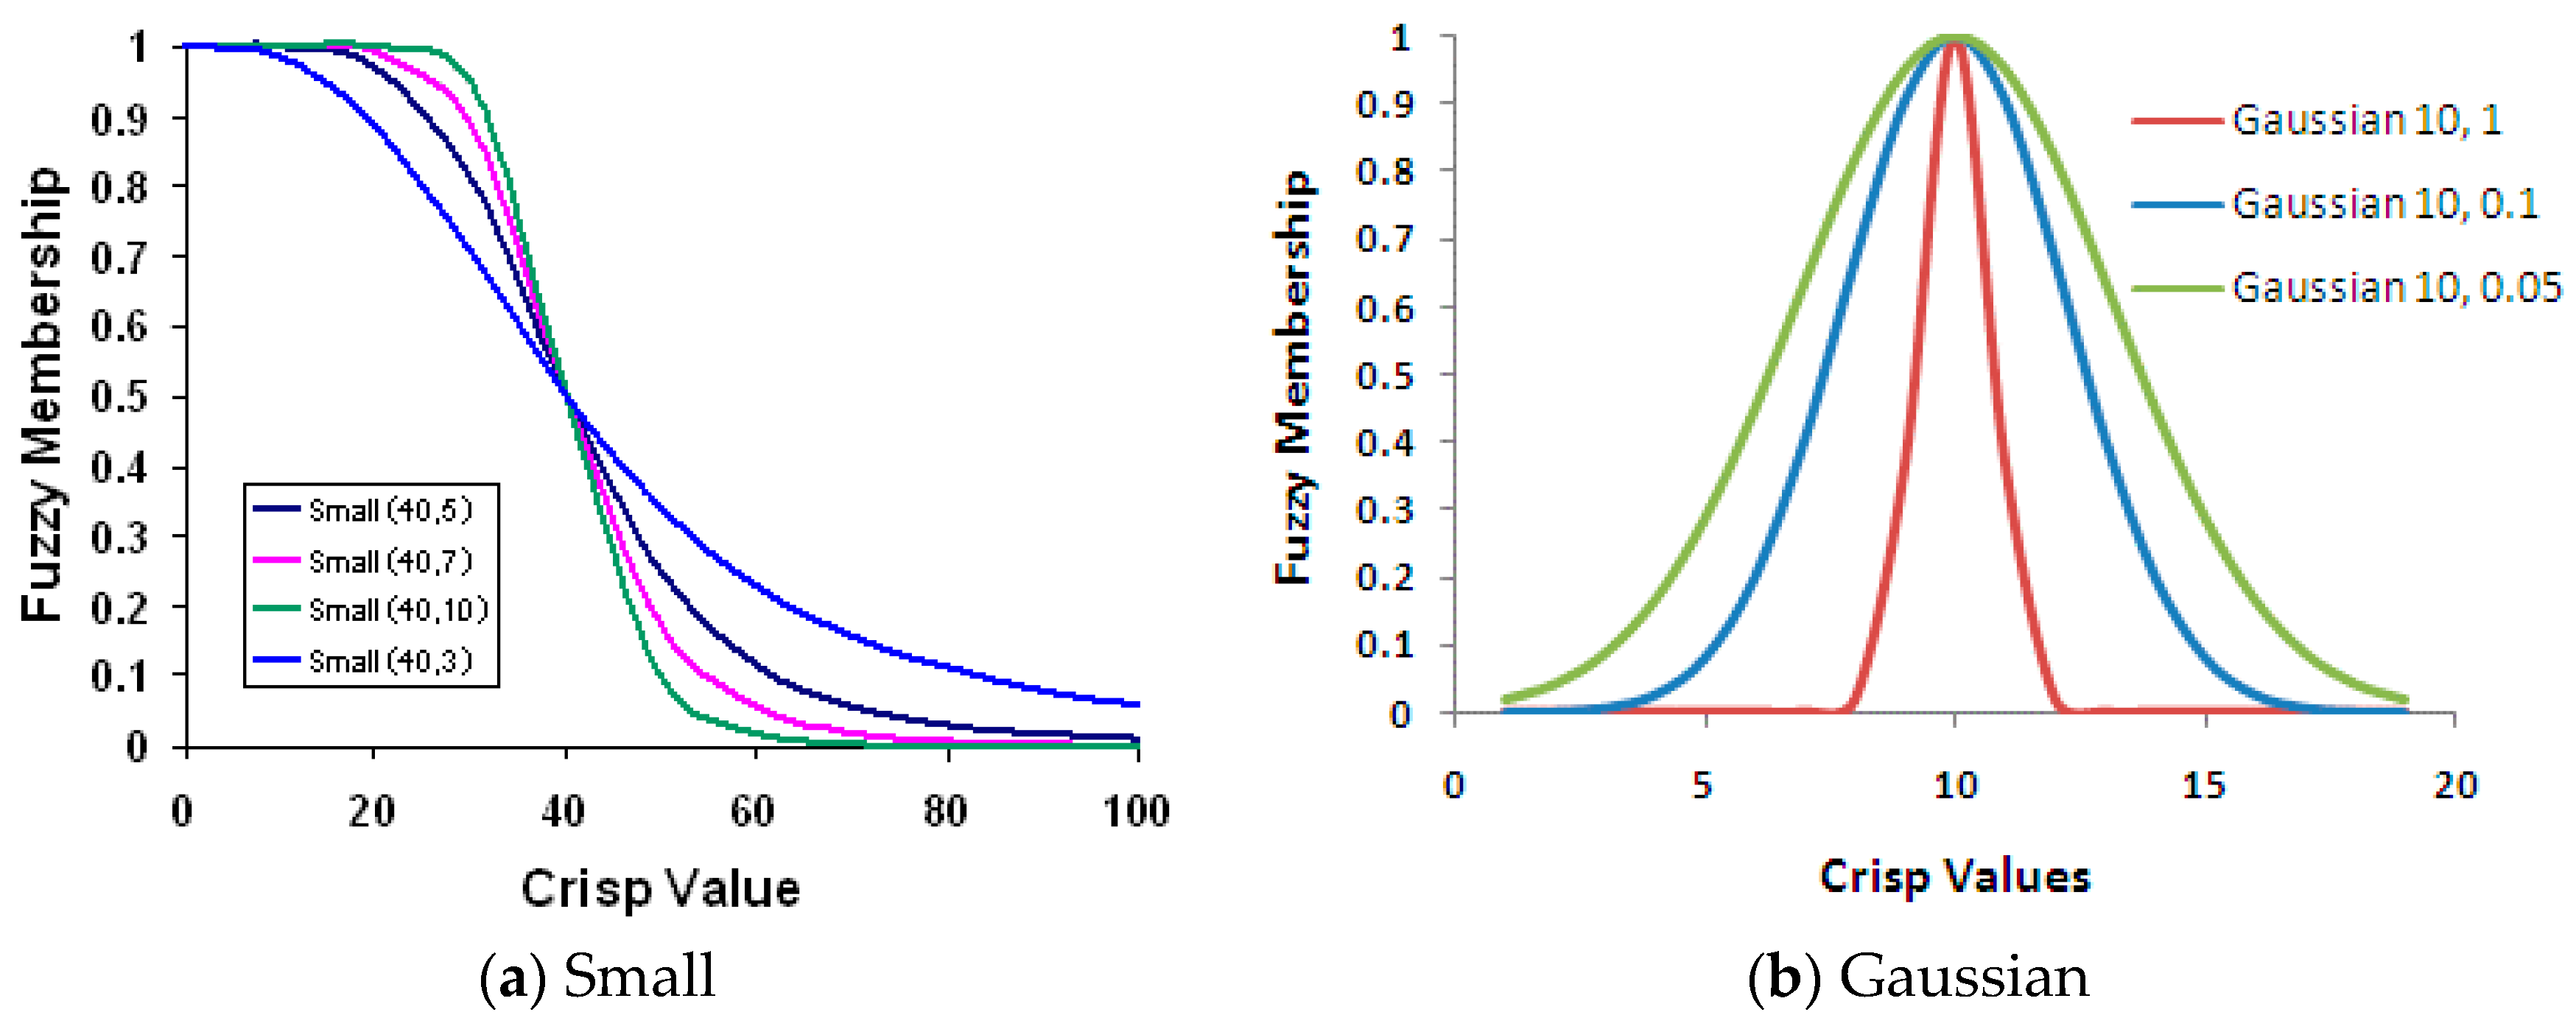
When the degree of membership y is 1, it indicates that the environmental state condition x of the evaluation factor is extremely favorable for the development of landslides, and it belongs to the landslide spatially sensitive set. When the membership degree y is 0, it indicates that under the environmental state condition x, the probability of landslide development is extremely small, and it is not a part of the landslide spatially sensitive set. For the environmental state conditions that are difficult to determine, the membership degree is between 0 and 1. The larger the membership degree y after transforming the evaluation factor, the higher the landslide spatial susceptibility. For each disaster environmental factor in the regional geographical environment, a fuzzy membership function suitable for its characteristic spatial law needs to be constructed. Therefore, multiple fuzzy membership functions form a set of membership functions. The fuzzy membership function used in the fuzzy system can be summarized as Fuzzy Gaussian, Fuzzy Large and Fuzzy Small (Figure 5). Fuzzy Large showed a positive correlation and an increasing trend. When the state value of the landslide susceptibility evaluation factor x is large, the probability of landslide occurrence is high, and the membership degree y gradually increases and tends to 1. Fuzzy Small has a negative correlation and a decreasing trend. When the state value x of the landslide susceptibility evaluation factor is large, the probability of landslide occurrence is small, and the membership degree y gradually decreases and tends to 0. Fuzzy Gaussian is suitable for a certain state of the landslide susceptibility evaluation factor. When x = x0, the probability of landslide occurrence is extremely high, and the membership degree y(x) = 1. When it deviates from this state value, the probability of landslide occurrence decreases, and the membership degree y tends to 0.

3.2.2. Membership Function Type and Construction Basis of Evaluation Factors

The membership function extracts the fuzzy relationship in natural language based on expert knowledge and expresses it mathematically. There is no general mathematical theorem for selecting the membership function. The membership function constructed by pure knowledge rules is highly dependent on prior knowledge of landslides. However, knowledge and experience might be insufficient, and researchers can make mistakes, leading to inaccurate judgments. Pure data-driven landslide susceptibility evaluation factor characteristic law expression depends on the number and quality of samples. When the effective information on sample data is insufficient, the results of statistical indicators might have noise interference. We constructed the membership function of the evaluation factor in this study, as shown in Table 4.
Fuzzy logic models have certain advantages, including the ability to combine similar datasets in nested sequences before the final combination, simultaneous input of continuous and discrete data and extensive integration into the GIS software. The disadvantage is that the output is a “likelihood”, which cannot be compared to the probability produced by classical statistics. Unlike some machine learning methods, the assumptions represented by the blur stack must not only fit the data but also fit prior knowledge. A fuzzy logic analysis is very important for cataloging landslides that have significant spatial deviations. Only based on a comprehensive analysis of the mechanism of occurrence of landslides in mining areas can the dominant factors of landslide occurrence be determined through classical statistical laws and constraints imposed to obtain landslide susceptibility. Sex charts are objective, accurate and detailed.
F G ( f ) L 1 + f R S P ( f ) L 2 G ( f i ) = 1 i = 1 n ( 1 f i ) r × i = 1 n ( f i ) 1 r P ( f i ) = i = 1 n ( f i )
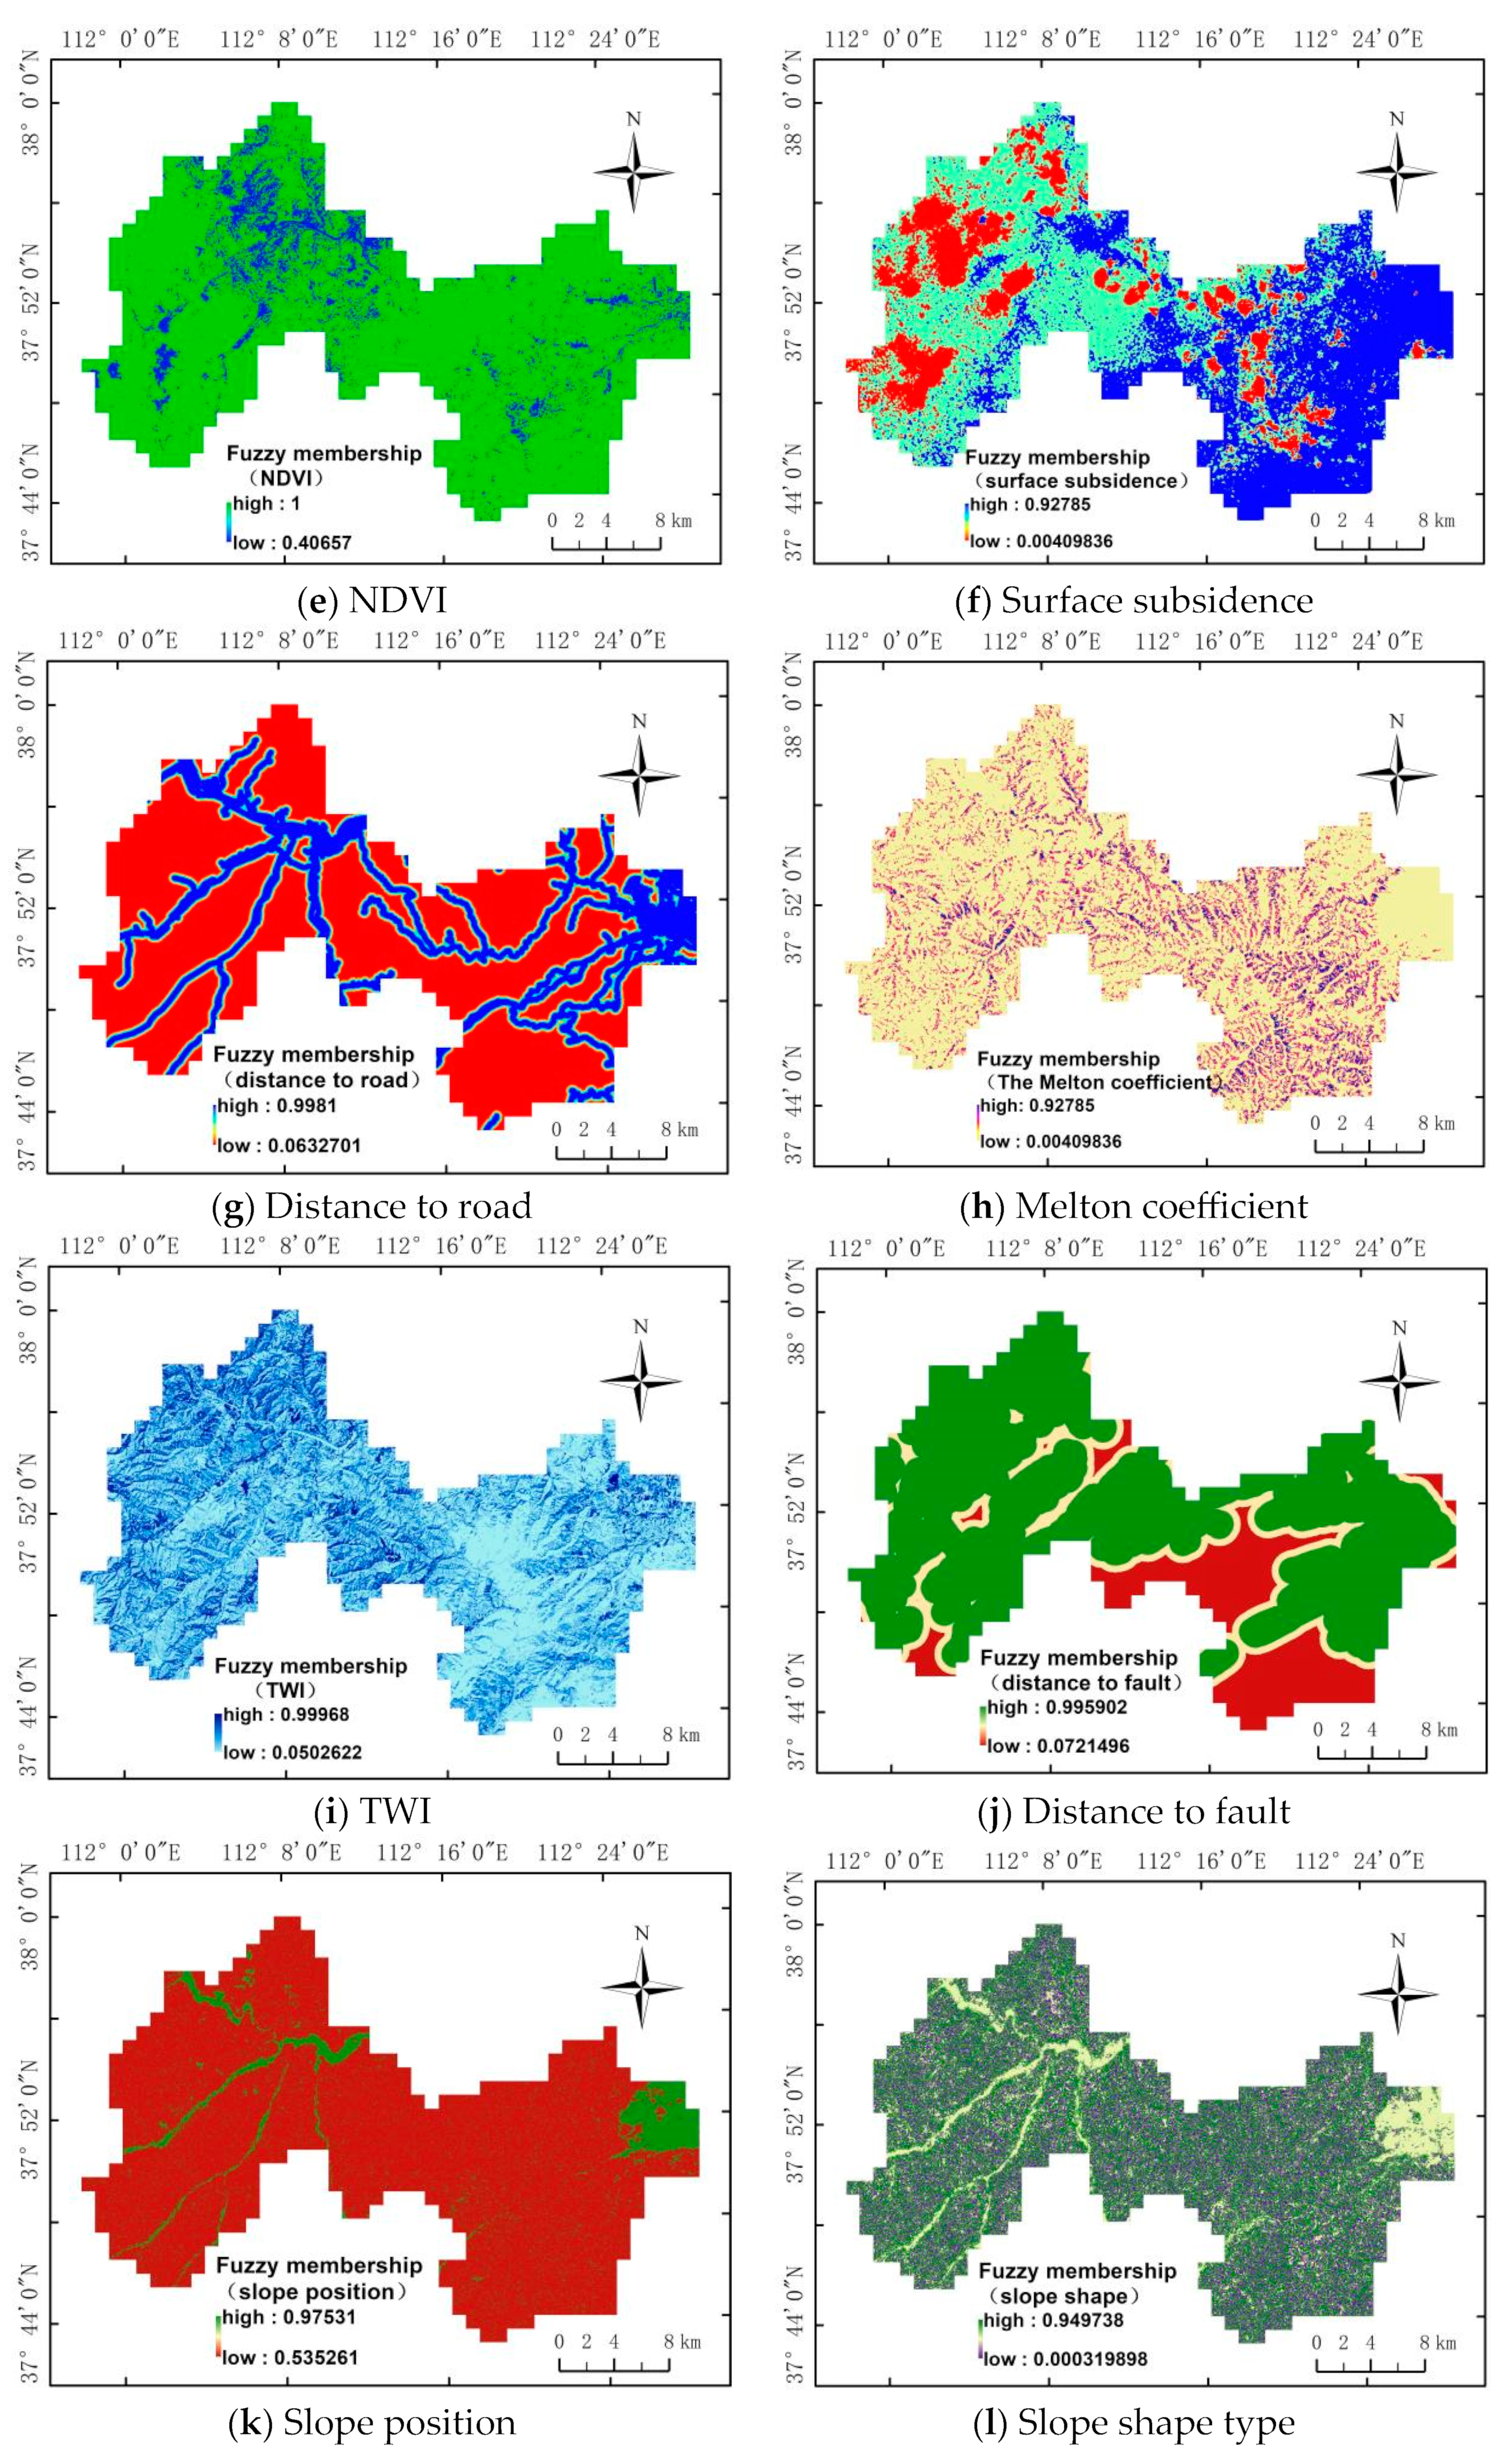
Based on statistical laws and landslide knowledge mechanism laws, a fuzzy membership function was constructed for each factor, and the layer of landslide disaster environmental factors was fuzzy-transformed to obtain the landslide-sensitive fuzzy set layer corresponding to each factor.
The fuzzy set layer of landslide susceptibility is shown in Figure 6.

3.2.3. Landslide Susceptibility Fuzzy Set Hierarchical Superposition Based on Mining Factor Constraints

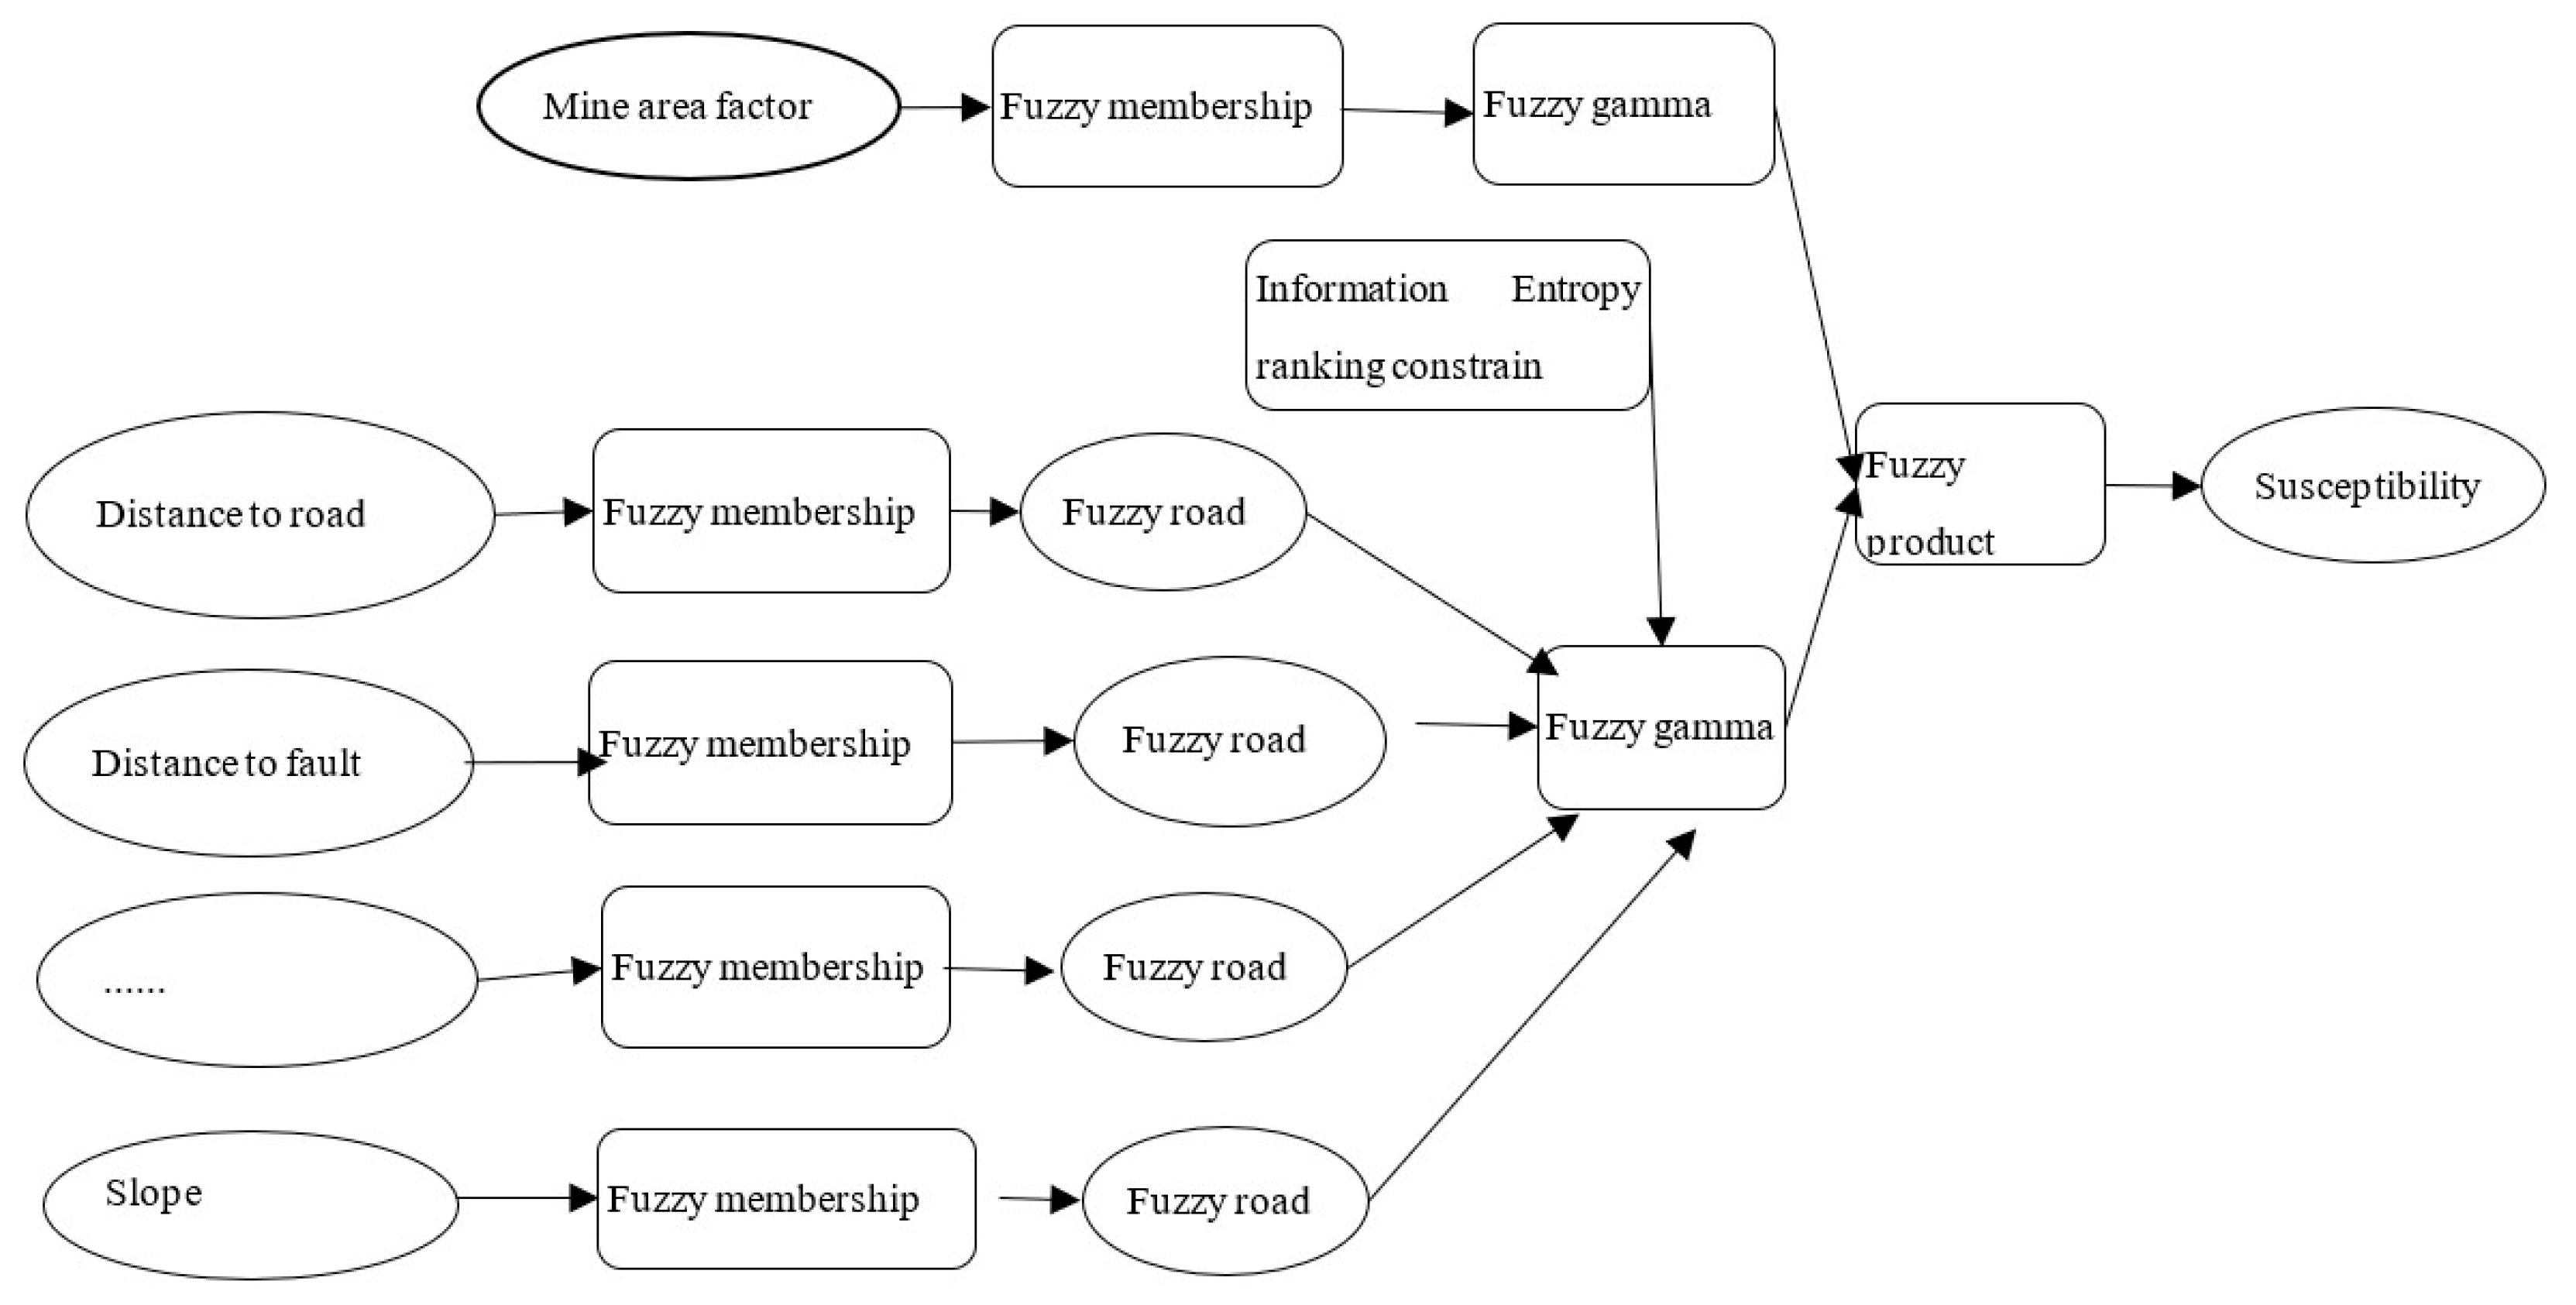
The fuzzy superposition reasoning of landslide susceptibility is based on the analysis of the intersection between the multi-criteria and multi-factor comprehensive effects in uncertain events such as landslides. In the improved fuzzy logic analysis, the concept of mining factor constraints was proposed, and the landslide susceptibility analysis was conducted using the nonlinear superposition method. In this study, the entropy weight of each factor was calculated based on the actual disaster environment in the study area. If the contribution value of the mining area factor was ranked first, the gamma superposition result did not need to be constrained. Therefore, the mining area factor was required to carry out a hierarchical constraint mode. The evaluation factor was used as the key constraint factor, and the susceptibility analysis was conducted by combining Fuzzy Gamma and Fuzzy Product, two nonlinear superposition operators. The susceptibility value of the constraint factor was used to adjust the susceptibility value in the local area and reduce the multi-factor comprehensive evaluation process and misclassification in omissions. In this study, a new landslide-sensitive zone was drawn for the mining area factor constraints, and the model results were tested. However, as the constraint factor data participating in the fuzzy hierarchical superposition process increased, the difference in contribution between various disaster factors decreased. The problem of the regional comprehensive landslide susceptibility results being averaged could not be avoided, and it tended to be an unconstrained mode. There were certain restrictions on the number of factors to choose from. In this study, we conducted analyses with one factor, two factors and unconstrained three factors; the processing steps are shown in Figure 7.

3.3. Information Model

The information content model can be used to measure the susceptibility of the research object by converting the data into quantifiable information content values (Table 5). In this study, by calculating the corresponding information content values of the factor classes, a landslide susceptibility model was constructed based on the information content model involving the nine mines of the headquarters of Xishan Coalfield. Information volume involves measuring the effective information generated by the occurrence of specific events and eliminating uncertainty. Many factors affect landslide disasters. In various disaster-pregnancy environments, the magnitude and nature of the various factors are different for different landslides, and there is always an “optimal combination of factors”. According to information prediction, the occurrence of landslides is related to the quantity and quality of information obtained in the prediction process, and it is measured based on the information content. The higher the information content, the smaller the uncertainty in the occurrence of the event, indicating higher landslide susceptibility. The information model was first applied to geological hazard assessment in a study by Westen et al. [26] and was later widely used in landslide-susceptibility analyses. In the landslide susceptibility analysis, the probability of landslide occurrence is predicted by estimating the information content of each type of landslide hazard environmental factor, and then, the information content of the single factor is superimposed and combined to obtain comprehensive information on the occurrence of regional landslides. The relevant calculations are shown in Equation (9):
I i = i = 1 n I ( u i , h ) = i = 1 n log 2 ( N i / N S i / S )
Here, h represents the quantitative category of the landslide susceptibility evaluation factor, I(ui, h) represents the amount of information carried by the ui classification category h of the evaluation factor, Ni represents the number of landslide units distributed in this category, N represents the total number of landslide units, Si represents the area occupied by this category in the evaluation factor ui of the study area and S represents the total area covered in the study area, which is the comprehensive information amount of each evaluation factor in the evaluation unit. The information analysis model determines the actual situation of the deformed or damaged area and the influencing factors of geological disasters, calculates the influence value of each influencing factor on the failure deformation and uses it as a quantitative index of zoning. The information analysis model not only provides a quantitative reflection, but it can also evaluate the susceptibility of geological disasters.

3.4. Support Vector Machine Model

Based on the structural risk minimization principle and VC dimension theory of statistical learning theory, another machine learning method called SVM was developed. The SVM model is based on different types of basic functions to transform linearly inseparable data into high-dimensional space and find a hyperplane in the high-dimensional space to analyze linearly separable data patterns [27,28]. SVM can convert a nonlinear problem into a linear one in a high-dimensional space by nonlinear transformation and then find the optimal classification surface in the transformed high-dimensional space. SVM solves the problem of mapping from a low dimensional input space to a high dimensional feature space by introducing the kernel function. In this study, the kernel function of the Radial basis function (RBF) was used, and the algorithm formula that was used was as follows:
K x i , x j = e γ x i x j 2  
The γ of the kernel function is a parameter that needs to be optimized when building the model to increase the fitting accuracy [29,30].

4. Results and Discussion

4.1. Susceptibility Mapping Analysis

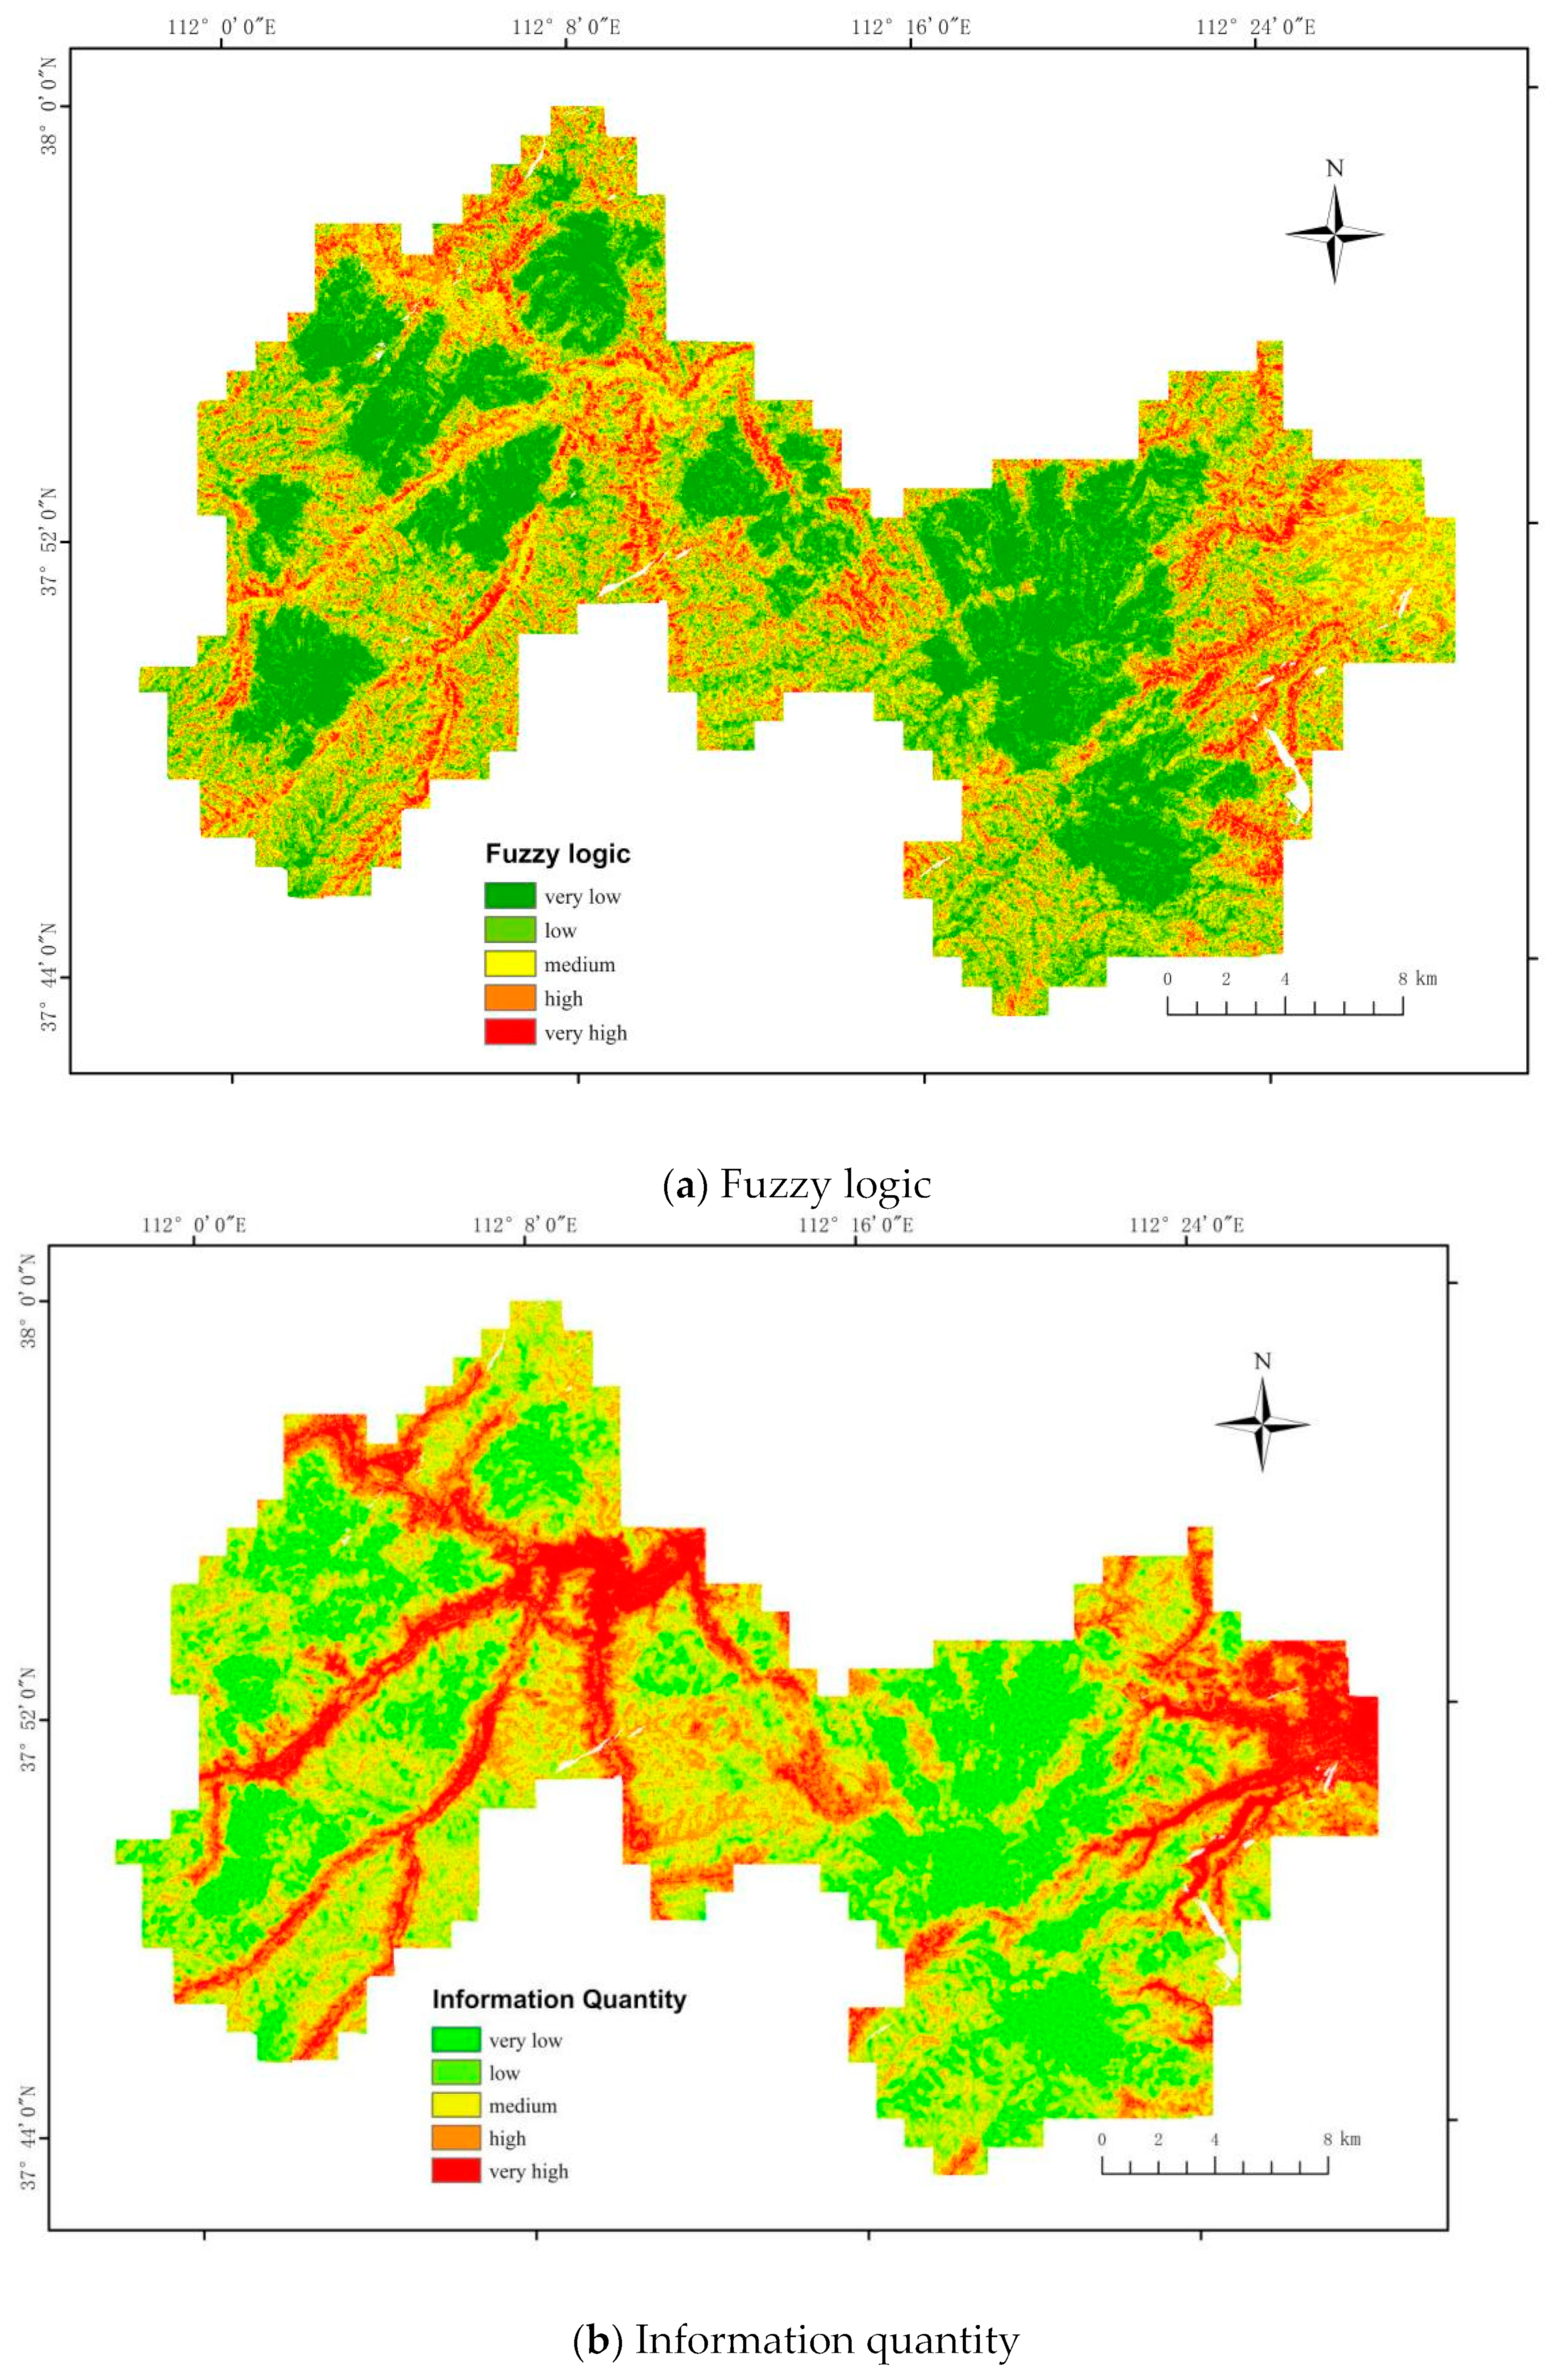
The study area covered 724,596 pixels, which were converted into point type and mapped by the ArcGIS platform. Using the Jenks Natural Breaks algorithm, the three landslide susceptibility indices were reclassified into five susceptibility levels, as shown in Figure 8.
Following the landslide susceptibility classification standard of No. 9 Coal Mine in the headquarters of Xishan Coalfield, three landslide susceptibility maps were obtained and converted into a grid format. The three landslide susceptibility prediction (LSP) maps drawn by the three models are shown in Figure 8. The three algorithms had higher LSP scores in the Duerping mining area of Guandi in the Gujiao mining area and on both sides of the river. The intensity of coal mining activities in this area, along with the dense distribution of rivers, aggravated the instability of the slopes. Areas with higher ground slump densities in the coal mine LSP had higher scores.

4.2. Evaluation of Model Accuracy and Comparative Analysis of Model Results

4.2.1. ROC Curve

The ROC curve is a simple and intuitive index for evaluating the performance of a model. A larger area under the curve (AUC) indicates higher model accuracy. In this experiment, the quality of the model can be judged through the test data set: if it is found through the learning curve that the model works better on the training data set and not well on the test data set, the model is deemed to be overfitting, and the parameters need to be adjusted to obtain the model again, and then tested again; this process was repeated, finally obtaining the best model; the three methods were then calculated and tested based on the verification dataset. The ROC curves of the three methods are shown in Figure 9. The AUCs of the three methods were all above 0.7 and had a certain predictive value. The fuzzy logic model constrained by information entropy proposed in this study was verified. The AUC reached 0.734, which confirmed the reliability and accuracy of the method.
A model can be used for susceptibility partitioning if it is higher than 0.70 in the validation stage; the AUC values of the three models were all higher than 0.70, indicating that the three models were suitable for the susceptibility assessment of the mining areas. The AUC for the information model was 0.858, the fuzzy logic of the mining factor constraint was 0.734, and the SVM was 0.707, indicating that all three models were suitable for the susceptibility evaluation of the mining area landslide. The river system in the study area was well developed, and the roads were along both sides of the river. The study area was 652 square kilometers. The study area was moderate, and the number of landslides caused by mining in the mining area was small and large; thus, the amount of information showed a good effect.

4.2.2. Spatial Accuracy Analysis

To further assess the evaluation performance of the three methods, the landslide points and the landslide-sensitive areas predicted by the three models were superimposed and analyzed; the results are presented in Table 6. We found that (1) the landslide susceptibility of the region was generally low-to-medium, and the area under this susceptibility level accounted for more than 65% of the study area. (2) The results of the susceptibility assessment of the occurrence of landslides in the Benbu Nine Coal Mine were valid. (3) The number of landslides predicted by the fuzzy logic model constrained by the mining factors accounted for 44% of the total landslides in the medium, low and lower sensitive areas, which was higher than that of the information model, and 14% and 7.4% of the SVM model, indicating that the generalization performance of the SVM model was better than that of the information model and fuzzy logic. (4) The number of landslides per unit area in the extremely low-risk area in the SVM model was lower than that of the information model and mining area factor constraints. The number of landslides per unit area in high-risk and extremely high-risk areas was significantly more than that determined by the information model and fuzzy logic model, which further showed that the three models were suitable for landslide susceptibility evaluation in mining areas, and each model had certain advantages. The quantitative model was more accurate in predicting the occurrence of landslides in mining areas than the other models.

5. Conclusions

The geological and environmental conditions, landslide development laws, distribution characteristics, formation conditions and influencing factors of mining areas are quite different from those of other areas. When evaluating the susceptibility of landslides for specific areas, the factors related to the formation of landslides under the conditions of the mining area should be highlighted. The knowledge of landslide mechanisms is very important to identify the factors that play a leading role in landslides in mining areas. For fully utilizing the geological data of the study area, a reasonable model should be selected according to the scale of the mining area and the evaluation accuracy requirements. In this study, the knowledge-driven model plus data-driven model was experimentally evaluated. The correlation between the factors that influence landslides generally shows information redundancy in the prediction results of the model. Because the fuzzy logic model for the factor constraints of the mining area in this study initially de-correlated the influencing factors through Pearson’s correlation analysis and then performed factor classification, the landslide frequency ratio, information entropy and entropy weight were similarly calculated. They were then measured according to the size of the entropy weight. The structure showed that the mining area landslide susceptibility spatial characteristics were highlighted after the factor constraints of the mining area were adopted, which made the model evaluation more reasonable. Compared to the knowledge-driven information model and the data-driven SVM model, the knowledge-driven model plus data-driven fuzzy logic model with mining factor constraints performed better in spatial prediction. This model can be used to accurately determine the ability of factor importance variables for mining landslides. Of course, the research in this paper also has certain shortcomings. There is no fixed standard for the selection and determination of landslide-influencing factors. The susceptibility evaluation system established in this paper will inevitably have omissions and deficiencies. How to reasonably determine a specific area landslide evaluation factor system should be the focus of further research. The landslide susceptibility analysis results of the improved fuzzy logic model were compared with the calculation results of the information volume and support vector machine regression model. The AUC value performance of the landslide susceptibility prediction results in this paper is slightly higher than the two, and it has the advantages of independent sample data quality and quantity, simple and fast calculation. In this paper, the research on landslide disaster prevention is limited to static landslide susceptibility analysis, and the occurrence of landslides is closely related to external dynamic inducing factors such as rainfalls, mining disturbances and road excavations. The next step can be to introduce inducing factors to dynamically evaluate and analyze landslide prediction on the basis of static disaster-prone environmental factors.

Author Contributions

Conceptualization, Y.Z. and J.Z.; data curation, L.D.; formal analysis, Y.Z.; investigation, Y.Z.; methodology, Y.Z.; project administration, J.Z.; resources, Y.Z.; software, Y.Z.; supervision, Y.Z.; validation, Y.Z. and J.Z.; visualization, J.Z.; writing—original draft, Y.Z.; writing—review and editing, J.Z. All authors have read and agreed to the published version of the manuscript.

Funding

This research has been supported by the Natural Science Foundation of China (42171424) and National Key Research and Development Program of China (No. 2018YFB0505402).

Institutional Review Board Statement

Not applicable.

Informed Consent Statement

Not applicable.

Data Availability Statement

The data presented in this study are available on request from the corresponding author.

Conflicts of Interest

The authors declare that the research was conducted in the absence of any commercial or financial relationships that could be construed as a potential conflict of interest.

References

  1. Xu, S.L. Study on Dynamic Landslide Susceptibility Mapping Based on Multi-Source Remote Sensing Imagery. Ph.D. Thesis, China University of Geosciences, Wuhan, China, 2018. [Google Scholar]
  2. Yang, D.; Qiu, H.; Ma, S.; Liu, Z.; Du, C.; Zhu, Y.; Cao, M. Slow surface subsidence and its impact on shallow loess landslides in a coal mining area. Catena 2022, 209, 105830. [Google Scholar] [CrossRef]
  3. Jiang, S.; Li, J.; Zhang, S.; Gu, Q.; Lu, C.; Liu, H. Landslide risk prediction by using GBRT algorithm: Application of artificial intelligence in disaster prevention of energy mining. Process Saf. Environ. Prot. 2022, 166, 384–392. [Google Scholar] [CrossRef]
  4. Montgomery, D.R.; Dietrich, W.E. A physically based model for the topographic control on shallow landsliding. Water Resour. Res. 1994, 30, 1153–1171. [Google Scholar] [CrossRef]
  5. Pack, R.T.; Tarboton, D.G.; Goodwin, C.N. The SINMAP Approach to Terrain Stability Mapping. In Proceedings of the 8th Congress of the International Association of Engineering Geology, Vancouver, BC, Canada, 21–25 September 1998; Available online: https://digitalcommons.usu.edu/cee_facpub/2583 (accessed on 21 September 1998).
  6. Pal, S.C.; Chowdhuri, I. GIS-based spatial prediction of landslide susceptibility using frequency ratio model of Lachung River basin, North Sikkim, India. SN Appl. Sci. 2019, 1, 416. [Google Scholar] [CrossRef] [Green Version]
  7. Chowdhuri, I.; Pal, S.C.; Chakrabortty, R.; Malik, S.; Das, B.; Roy, P. Torrential rainfall-induced landslide susceptibility assessment using machine learning and statistical methods of eastern Himalaya. Nat. Hazards 2021, 107, 697–722. [Google Scholar] [CrossRef]
  8. Tian, C.S.; Liu, X.L.; Wang, J. Geohazard susceptibility assessment based on CF model and logistic regression models in Guangdong. Hydrogeol. Eng. Geol. 2016, 43, 154–161. [Google Scholar] [CrossRef]
  9. Ruidas, D.; Chakrabortty, R.; Islam, A.R.M.T.; Saha, A.; Pal, S.C. A novel hybrid of meta-optimization approach for flash flood-susceptibility assessment in a monsoon-dominated watershed, Eastern India. Environ. Earth Sci. 2022, 81, 145. [Google Scholar] [CrossRef]
  10. Ruidas, D.; Pal, S.C.; Islam, A.R.M.T.; Saha, A. Characterization of groundwater potential zones in water-scarce hardrock regions using data driven model. Environ. Earth Sci. 2021, 80, 809. [Google Scholar] [CrossRef]
  11. Su, Q.; Zhang, J.; Zhao, S.; Wang, L.; Liu, J.; Guo, J. Comparative Assessment of Three Nonlinear Approaches for Landslide Susceptibility Mapping in a Coal Mine Area. ISPRS Int. J. Geo-Inf. 2017, 6, 228. [Google Scholar] [CrossRef] [Green Version]
  12. Zhang, L.; Huang, M.; Li, M.; Lu, S.; Yuan, X.; Li, J. Experimental Study on Evolution of Fracture Network and Permeability Characteristics of Bituminous Coal Under Repeated Mining Effect. Nat. Resour. Res. 2021, 31, 463–486. [Google Scholar] [CrossRef]
  13. Zhou, G.; Song, B.; Liang, P.; Xu, J.; Yue, T. Voids Filling of DEM with Multiattention Generative Adversarial Network Model. Remote Sens. 2022, 14, 1206. [Google Scholar] [CrossRef]
  14. Li, J.; Lin, Y.; Nguyen, X.; Zhuang, X.; Li, B.; Querol, X.; Moreno, N.; Cordoba, P. Enrichment of strategic metals in the Upper Triassic coal from the Nui Hong open pit mine, Thai Nguyen Coalfield, NE Vietnam. Ore Geol. Rev. 2023, 153, 105301. [Google Scholar] [CrossRef]
  15. Chen, W.; Peng, J.; Hong, H.; Shahabi, H.; Pradhan, B.; Liu, J.; Zhu, A.-X.; Pei, X.; Duan, Z. Landslide susceptibility modelling using GIS-based machine learning techniques for Chongren County, Jiangxi Province, China. Sci. Total Environ. 2018, 626, 1121–1135. [Google Scholar] [CrossRef]
  16. Guo, Z.; Shi, Y.; Huang, F.; Fan, X.; Huang, J. Landslide susceptibility zonation method based on C5.0 decision tree and K-means cluster algorithms to improve the efficiency of risk management. Geosci. Front. 2021, 12, 101249. [Google Scholar] [CrossRef]
  17. Zhou, G.; Deng, R.; Zhou, X.; Long, S.; Li, W.; Lin, G.; Li, X. Gaussian Inflection Point Selection for LiDAR Hidden Echo Signal Decomposition. IEEE Geosci. Remote Sens. Lett. 2021, 19, 6502705. [Google Scholar] [CrossRef]
  18. Zhang, Y.; Luo, J.; Li, J.; Mao, D.; Zhang, Y.; Huang, Y.; Yang, J. Fast Inverse-Scattering Reconstruction for Airborne High-Squint Radar Imagery Based on Doppler Centroid Compensation. IEEE Trans. Geosci. Remote Sens. 2021, 60, 5205517. [Google Scholar] [CrossRef]
  19. Tobler, W.R. A Computer Movie Simulating Urban Growth in the Detroit Region. Econ. Geogr. 1970, 46, 234–240. [Google Scholar] [CrossRef]
  20. Van Westen, C.J.; Rengers, N.; Terlien, M.T.J.; Soeters, R. Prediction of the occurrence of slope instability phenomenal through GIS-based hazard zonation. Int. J. Earth Sci. 1997, 86, 404–414. [Google Scholar] [CrossRef]
  21. Chen, W.; Chai, H.; Zhao, Z.; Wang, Q.; Hong, H. Landslide susceptibility mapping based on GIS and support vector machine models for the Qianyang County, China. Environ. Earth Sci. 2016, 75, 474. [Google Scholar] [CrossRef]
  22. Su, Q.; Zhao, S.; Guo, J. Numerical modeling and classification of surface landslide hazard Susceptibility in Huoxi Coal Mine. J. Geo-Inf. Sci. 2017, 19, 1613–1622. [Google Scholar] [CrossRef]
  23. Zadeh, L.A. Fuzzy sets. Inf. Control 1965, 8, 338–353. [Google Scholar] [CrossRef] [Green Version]
  24. Vapnik, V.; Levin, E.; Le Cun, Y. Measuring the VC-Dimension of a Learning Machine. Neural Comput. 1994, 6, 851–876. [Google Scholar] [CrossRef]
  25. Huang, F.; Yin, K.; Jiang, S.; Huang, J.; Cao, Z. Landslide susceptibility evaluation based on cluster analysis and support vector machine. J. Rock Mech. Eng. 2018, 37, 156–167. [Google Scholar] [CrossRef]
  26. Dan, L.; Fengbao, Y.; Hong, W.; Dawei, L.; Xiaofeng, H. Vegetation classification method based on C5. 0 decision tree with multiple classifiers. Acta Graph. Sin. 2017, 38, 722–728. [Google Scholar] [CrossRef]
  27. Stanley, T.; Kirschbaum, D.B. A heuristic approach to global landslide susceptibility mapping. Nat. Hazards 2017, 87, 145–164. [Google Scholar] [CrossRef] [Green Version]
  28. Moayedi, H.; Mehrabi, M.; Mosallanezhad, M.; Rashid, A.S.A.; Pradhan, B. Modification of landslide susceptibility mapping using optimized PSO-ANN technique. Eng. Comput. 2019, 35, 967–984. [Google Scholar] [CrossRef]
  29. Pourghasemi, H.R.; Yansari, Z.T.; Panagos, P.; Pradhan, B. Analysis and evaluation of landslide susceptibility: A review on articles published during 2005–2016 (periods of 2005–2012 and 2013–2016). Arab. J. Geosci. 2018, 11, 193. [Google Scholar] [CrossRef]
  30. Fang, Z.; Wang, Y.; Peng, L.; Hong, H. A comparative study of heterogeneous ensemble-learning techniques for landslide susceptibility mapping. Int. J. Geogr. Inf. Sci. 2020, 35, 321–347. [Google Scholar] [CrossRef]
Figure 1. The distribution of the geological hazards sites in the study area.
Processes 11 00985 g001
Figure 2. Pearson’s correlation coefficient plot; the bar on the right indicates decreasing strength of correlation from red to blue.
Processes 11 00985 g002
Figure 3. Fuzzy membership layer.
Processes 11 00985 g003aProcesses 11 00985 g003bProcesses 11 00985 g003c
Figure 4. The landslide frequency ratio curve.
Processes 11 00985 g004aProcesses 11 00985 g004b
Figure 5. Fuzzy membership function.
Processes 11 00985 g005aProcesses 11 00985 g005b
Figure 6. Fuzzy membership.
Processes 11 00985 g006aProcesses 11 00985 g006bProcesses 11 00985 g006c
Figure 7. Flow chart (from left to right).
Processes 11 00985 g007
Figure 8. Landslide susceptibility classification standards in the Xishan Mine area.
Processes 11 00985 g008aProcesses 11 00985 g008b
Figure 9. ROC and AUC for the three landslide susceptibility models.
Processes 11 00985 g009
Table 1. The main data and data source.
Data NameData SourceTypePrecision
Historical LandslidesShanxi Provincial Geological Hazard Environmental Monitoring CenterData tablePoint Data (scale)
DEMHomemadeRaster5 m
Geological dataGeological drawings of Xishan Coal and Electricity Geology OfficeVector1:50,000
Land useProvided by the National Natural Science Foundation of China project teamRaster30 m
Satellite imageryDroneRaster0.5 m
Annual rainfallNational Meteorological Science Data CenterData table30 m
RiversPaper map of Xishan Coal and Electricity Geology OfficeVector1:50,000
RoadPaper map of Xishan Coal Point Geology OfficeVector1:50,000
FaultPaper drawing of Xishan Coalfield Geology OfficeVector1:10,000
Mining areaPaper drawing of Xishan Coalfield Geology OfficeVector1:10,000
Boundary of the study areaPaper drawing of Xishan Coalfield Geology OfficeVector1:5000
Seismic dataShanxi Seismological BureauData sheet or grid25 m
Various indicesGeospatial data cloud satellite imagery rasterRaster30 m
Stratigraphic lithologyPaper drawings of Xishan Coalfield Geology OfficeVector1:50,000
Groundwater levelPaper drawing of Hydrology Department of Xishan Coal and Electricity Geology OfficeVector1:50,000
Water-bearing rock formationPaper drawings of the hydrology department of the Xishan Coal and Power GeologyVector1:50,000
Table 2. The correlation coefficients for the pairwise correlations between 18 condition factors (%).
Slop_TSlopPr_cLandRoadGoafFaulAspPosiStruSubsFlo-pFl_wMNRTCINdviTWIColl
Slop_T1.00
Slop0.141.00
Pr_c0.080.001.00
Land0.09−0.130.081.00
Road−0.160.14−0.15−0.291.00
Goaf0.00−0.270.030.09−0.141.00
Faul0.070.06−0.06−0.120.090.051.00
Asp0.080.000.050.19−0.09−0.030.051.00
Posi0.260.03−0.29−0.130.050.000.07−0.061.00
Stru−0.03−0.040.030.040.040.070.01−0.15−0.081.00
Subs0.02−0.090.040.16−0.270.490.200.12−0.04−0.071.00
Flo-p−0.020.01−0.100.03−0.070.09−0.040.130.00−0.050.031.00
Fl_w−0.030.000.070.060.010.03−0.080.01−0.120.050.080.041.00
MNR−0.040.290.340.040.01−0.060.04−0.02−0.190.030.01−0.06−0.031.00
TCI−0.26−0.340.320.06−0.140.17−0.15−0.08−0.220.060.11−0.01−0.020.141.00
Ndvi0.04−0.040.03−0.040.01−0.06−0.020.00−0.03−0.05−0.05−0.010.04−0.040.101.00
TWI−0.080.120.02−0.170.04−0.030.170.060.000.100.09−0.080.020.020.04−0.031.00
Coll−0.07−0.180.070.08−0.080.24−0.300.03−0.030.030.32−0.010.08−0.080.200.060.091.00
Note: In Table 2, the 18 landslide condition factors (slope shape type, slope, profile curvature, land use type, distance to road, coal mine goaf disturbance, distance to fault, aspect, slope position, the models of slope structure, land subsidence, flow path length, flow width, Melton ruggedness number, terrain classification for lowlands, NDVI, topographic wetness index and ground collapse density) are shorted and represented by Slop_T, Slop, Pr-c, Land, Road, Goaf, Faul, Asp, Posi, Stru, Subs, Fl_p, Fl_w, MNR, TCI, Ndvi, TWI and Coll, respectively.
Table 3. The information value and ranking of the influence factor.
Conditional FactorClassification (Ki)FRInformation EntropyEntropy WeightGeologic Ranking
Slope0°–5°0.40.930.02411
5°–15°1.06
15°–25°1.1
25°–35°1.06
35°–45°2.13
45°–90°0
Slope shape typeV/V0.320.9370.02112
GE/V0.57
X/V0.86
V/GR0.59
GE/GR0.75
X/GR1.41
V/X0.83
GE/X1.33
X/X2.19
Disturbance in goaf0–1000.250.950.01713
100–2000.81
200–3000.83
300–4000.78
400–5001.87
≥5001.37
Profile curve<−100.7740.0756
−1–0.50
−0.5–00
0–0.51.47
0.5–1.00.58
1.0–1.51.67
>1.50
Land useIndustrial land00.6470.1193
Farmland1.01
Forest0.41
Grassland0.77
Water4.82
Construction land3.95
Unutilized land0
Aspect (°)N1.20.9910.00316
NE0.77
E0.88
ES1.12
S1.23
WS0.92
WS0.76
WN1.16
Slope positionRidges1.260.5520.1522
Unslope0
Middle slope2.44
Flat slope0
Downslope0
Valley0.76
Ground subsidence (mm/year)−83–2300.5200.1621
−23–70.24
−7–30.93
3–141.45
14–591.35
Collaspe density (point/km2)0–0.010.980.9840.00515
0.01–0.031.27
0.03–0.050.94
0.05–0.080.61
0.08–0.121.06
Flow path length0–0.051.50.9820.00614
0.05–0.141.07
0.14–0.221.24
0.22–0.291.01
0.29–0.371.04
0.37–0.460.76
0.46–0.560.64
0.56–0.720.59
0.72–1.371.18
Flow width30–310.780.9920.00217
31–321.06
32–340.86
34–351.13
35–371.26
37–380.67
38–400.97
40–411.13
41–421
Distance to fault0–5000.850.9230.02610
500–10001.39
1000–15001.81
1500–20000.96
≥20000.31
Distance to road0–1003.620.790.0717
100–2002.43
200–3001.67
300–4000.83
400–5000.21
≥5000.18
Slope structureLayered slope0.650.9860.0055
Drifting slope1.35
Downward slope1.14
Down the slope1.32
Cross slope0.84
Inverse slope0.92
Acclivity0.98
Melton0–10.80.7960.0698
1–31.09
3–51.2
5–72.57
7–14
TCI_low0.1–0.3 0.670.1124
0.3–0.4
0.4–0.50.86
0.5–0.61.2
0.6–0.90.74
NDVI<00.860.7490.0855
0–0.12
0.1–0.21.72
0.2–0.30.89
0.3–0.40.31
0.4–0.5
TWI3–5 0.8690.0449
5–7
7–91.25
9–111.45
11–131.2
13–150.74
15–171
17–200.99
20–230.59
Table 4. Construction of evaluation factors.
Construction Basis of Evaluation FactorsMembership FunctionDescription
Statistical Law + Landslide MechanismGauss function
μ ( x ) = e f 1 × ( x f 2 )
The equation includes the variables f1 (spread) and f2 (midpoint). Increasing the divergence makes the fuzzy membership curve steeper. The Gaussian function is useful for classifying around certain values.
Large function
μ ( x ) = 1 1 + ( x f 2 ) f 1
The equation includes f1 (spread) and f2 (midpoint). Increasing the divergence makes the fuzzy membership curve steeper. Larger value functions are useful when larger input values have higher membership.
Small function
μ ( x ) = 1 1 + ( x f 2 ) f 1
The equation includes f1 (spread) and f2 (midpoint). Increasing the divergence makes the fuzzy membership curve steeper; the smaller value function is useful when smaller input values have higher membership.
Table 5. Amount of information.
Conditional FactorClassificationQuantity (Point)Landslide Density (%)Amount of Information
Slope0°–5°80.05−1.32
5°–15°630.390.08
15°–25°700.430.14
25°–35°200.120.09
35°–45°20.011.09
45°–90° 0.00-
Slope shape typeV/V40.02−1.66
GE/V70.04−0.80
X/V180.11−0.22
V/GR90.06−0.75
GE/GR180.11−0.42
X/GR310.190.49
V/X200.12−0.27
GE/X210.130.41
X/X350.211.13
Disturbance in goaf0–100110.07−2.02
100–20050.03−0.30
200–30050.03−0.26
300–40040.02−0.35
400–50060.040.25
≥5001320.810.46
Profile curve<−1 0.00-
−1–0.5 0.00-
−0.5–0 0.00-
0–0.51090.670.56
0.5–1.0500.31−0.79
1.0–1.540.020.74
>1.5 0.00-
Land useIndustrial land 0.00-
Farmland430.260.02
Forest240.15−1.28
Grassland360.22−0.38
Water20.012.27
Construction land580.361.98
Unutilized land 0.00-
Aspect (°)N240.150.26
NE180.11−0.38
E210.13−0.19
ES240.150.17
S230.140.30
WS160.10−0.13
WS140.09−0.40
WN230.140.22
Slope positionRidges1030.630.34
Unslope 0.00-
Middle slope20.011.29
Flat slope 0.00-
Downslope 0.00-
Valley580.36−0.40
Ground subsidence (mm/year)−83–23 0.00-
−23–750.03−2.04
−7–3670.41−0.10
3–14660.400.53
14–59250.150.43
Collapse density (point/km2)0–0.01570.35−0.03
0.01–0.03490.300.34
0.03–0.05300.18−0.08
0.05–0.08130.08−0.71
0.08–0.12140.090.08
Flow path length0–0.0550.030.58
0.05–0.14270.170.09
0.14–0.22400.250.31
0.22–0.29320.200.02
0.29–0.37280.170.05
0.37–0.46160.10−0.39
0.46–0.5690.06−0.64
0.56–0.7240.02−0.76
0.72–1.3720.010.24
Flow width30–31110.07−0.37
31–3280.050.08
32–34140.09−0.21
34–35100.060.18
35–37250.150.33
37–3880.05−0.54
38–40290.18−0.05
40–41280.170.18
41–42300.180.00
Distance to fault0–500730.45−0.23
500–1000470.290.48
1000–1500290.180.85
1500–200080.05−0.05
≥200060.04−1.69
Distance to road0–100830.511.85
100–200320.201.28
200–300200.120.74
300–40080.05−0.27
400–50020.01−2.22
≥500180.11−2.41
Slope structureLayered slope70.04−0.63
Drifting slope220.130.43
Downward slope80.050.19
Down the slope330.200.40
Cross slope430.26−0.25
Inverse slope240.15−0.12
Acclivity260.16−0.03
Melton ruggedness number0–1660.40−0.33
1–3560.340.13
3–5270.170.26
5–7140.091.36
7–14 0.00-
TCI_low0.1–0.3 0.00-
0.3–0.4 0.00-
0.4–0.5650.40−0.21
0.5–0.6900.550.26
0.6–0.980.05−0.44
NDVI<020.01−0.22
0–0.1210.131.00
0.1–0.2680.420.78
0.2–0.3590.36−0.17
0.3–0.4130.08−1.67
0.4–0.5 0.00-
>0.58 0.00-
TWI3–5 0.00-
5–7 0.00-
7–980.050.32
9–11260.160.54
11–13350.210.26
13–15260.16−0.44
15–17350.210.01
17–20250.15−0.01
20–2380.05−0.75
Table 6. The distribution of landslides and the percentage of area under different susceptibility standards.
Susceptibility GradingSensitive Area Area/km2Percent of Total Area/%Number of Landslides/NumberDensity Number Ratio/%Landslides per Unit Area Number/km2
Factor-Constrained Fuzzy LogicInformation ModelSVM ModeFactor-Constrained Fuzzy LogicInformation ModelSVM ModeFactor-Constrained Fuzzy LogicInformation ModelSVM ModeFactor-Constrained Fuzzy LogicInformation ModelSVM ModeFactor-Constrained Fuzzy LogicInformation ModelSVM Mode
Very-low susceptibility area160.75289.6163.90.2470.1370.0984000.025000.0200
Hyposensitive area185.186188.39148.660.2840.2890.22827640.1660.0370.0250.150.030.03
Medium sensitive area168.252183.93187.1320.2580.2820.287411880.2520.110.0490.240.10.04
Highly sensitive area101.151119.3166.260.1550.1830.2555848190.3560.2940.1170.570.40.11
Very sensitive are36.66970.7886.070.0560.1090.13233911320.2020.5580.810.90 1.291.53
Disclaimer/Publisher’s Note: The statements, opinions and data contained in all publications are solely those of the individual author(s) and contributor(s) and not of MDPI and/or the editor(s). MDPI and/or the editor(s) disclaim responsibility for any injury to people or property resulting from any ideas, methods, instructions or products referred to in the content.