Article

Development and Experimental Evaluation of Some Silver Nanoparticles with Antimicrobial Potential

by
Bruno Ștefan Velescu
1,
Marina Ionela Ilie
1,
Anca Ioana Amzăr
1,
Raluca Elisabeta Lupașcu
1,
Ilinca Mihaela Marandiuc
1,
Miruna-Maria Apetroaei
1,
Andreea Letiția Arsene
1,*,
Emilian Ionuț Blejan
1,
Octvian Alexandru Nedea
2,
Toma Fistos
3,
Radu Claudiu Fierăscu
3,
Florica Bărbuceanu
4,
Cristina Țoca
4,
Irina Fierăscu
3,
Denisa Ioana Udeanu
1,
Manuela Ghica
1,
Doina Drăgănescu
1 and
Pavel Călin Cobelschi
5
1
Faculty of Pharmacy, “Carol Davila” University of Medicine and Pharmacy, 6 Traian Vuia Street, 020956 Bucharest, Romania
2
Faculty of Biotechnical Systems Engineering, University Politehnica of Bucharest, Splaiul Independentei 313, 060042 Bucharest, Romania
3
National Institute for Research and Development in Chemistry and Petrochemistry, 060021 Bucharest, Romania
4
National Institute for Diagnosis and Animal Health, 050557 Bucharest, Romania
5
Faculty of Medicine, Transilvania University, 500019 Brașov, Romania
*
Author to whom correspondence should be addressed.
Processes 2023, 11(4), 1212; https://doi.org/10.3390/pr11041212
Submission received: 28 February 2023 / Revised: 4 April 2023 / Accepted: 11 April 2023 / Published: 14 April 2023
(This article belongs to the Special Issue Pharmaceutical Development and Bioavailability Analysis (Volume II))

Abstract

:
By adjusting the synthesis process, silver nanoparticles (AgNp) of various shapes, sizes, and structures can be obtained, all of which have a substantial impact on the biological effect, notably, the regulation of antibacterial activity in the present circumstances of growing bacterial resistance. Due to their relatively small size, nanoparticles may be disseminated evenly throughout the body of the experimental animal, even at low doses, and exert more potent antibacterial activities. Our research was centered on the synthesis, production, and biological evaluation of antibacterial silver nanoparticles. Using the Turkevich method, we were able to effectively synthesize and characterize nanoscale silver particles, with an average crystallite size of 9.49 nm. We examined their acute toxicity and pharmacokinetic characteristics in rats after administering a single dosage. In addition, we evaluated the biological effect of topical AgNp suspension on the progression of burn-type lesions in the experimental animals. The pharmacokinetic profile demonstrated that the plasma concentration of silver nanoparticles, as well as their clearance rate, and dispersion throughout the body, are significantly enhanced in large rodent species. The restorative effect of synthesized silver nanoparticles in the form of a suspension in distilled water was corroborated by the values of the hematological parameters. These results demonstrated an intense stimulation of the cellular and molecular processes of the local immune defense, which has resulted in significantly faster regeneration in the AgNp-treated group.

1. Introduction

Nanomedicine is an emerging field that investigates the potential applications of nanotechnology knowledge and techniques in the areas of disease prevention, treatment, diagnosis, and control. In this regard, silver nanoparticles are particularly significant due to their unique features, ability to form various nanostructures, exceptional range of bactericidal, anticancer, and cicatrizing activities, itscost-effectiveness in production, and being able to be synthesized using physical, chemical, or biological processes that are simple and cost-effective [1].
The adjustment of the synthesis methods enables the production of silver nanoparticles with varying sizes, shapes, and structures—parameters that directly impact the biological effect. Because of their small dimensions, nanoparticles are able to permeate the entire body of the test animal at low doses, while producing more potent antibacterial effects [2,3,4].
The modulation of antimicrobial activity is of the utmost importance in this context, given the prevalence of antibiotic resistance. According to the World Health Organization (WHO), extensive and unregulated use of antibacterial drugs is causing antimicrobial resistance, which in turn causes increased morbidity and death throughout the poor and middle-income nations [5]. Resisting medication can lead to a number of negative outcomes, such as a prolonged treatment plan, higher medical costs, and a slowed or nonexistent recovery timeline. Antibiotic resistance emerged as a major problem during the COVID-19 pandemic, contributing to a rise in mortality and other serious difficulties [6,7]. One definition of “antimicrobial resistance” is the ineffectiveness of commonly used drugs in combating infectious diseases. Restrictive drug uptake, inactivation of the drug, target modification, and active drug efflux are the four main steps in the process of antimicrobial resistance [8,9].
For these reasons, nanomaterials provide alternatives with great potential [10]. It is probable that AgNp and silver ions can work collaboratively to eliminate germs, particularly Gram-negative microorganisms [11,12], and there are at least five mechanisms of silver nanoparticles’ antibacterial action described [13].
The first mechanism involves binding to the cell wall of the bacteria and disrupting the integrity of the cell wall, which causes direct damage to the cell envelope and intracellular constituents [14].
Protein SH-group binding, and the resultant disruption of protein function, is the second mechanism of toxicity [15]. It is explained how the silver can inhibit the enzymes in the bacteria, namely those in the respiratory chain. This results in a decrease in ATP synthesis, an imbalance in the cell’s energy levels, an increase in intracellular reactive oxygen species (ROS), and oxidative stress [16]. In addition, the O2 released by Ag2O-Nps has antimicrobial properties [14].
A third mechanism involves the fact that after AgNp releases the ions, they are transported across the outermost layer of the bacteria by the porin channels and the ion transport proteins. By interacting with the proteins, the silver ions are able to induce oxidative stress [11].
The genotoxic activity of Ag compounds after penetration into a bacterial cell interacts not only with proteins, but also with phosphoric acid residues in the DNA molecules, which is the fourth mechanism of antibacterial action of Ag2O-Nps [17].
The fifth mechanism is photocatalytic activity, which is enhanced by the addition of Ag2O-Nps to the photocatalytic characteristics of other metal Nps. Composites of Ag2O/TiO2-Nps and Ag2O/ZnO-Nps, in particular, exhibit improved photocatalytic activity when compared to TiO2 or ZnO-Nps. Additionally, the photocatalytic activity of Ag2O NPs was observed, with the photocatalytic activity of Ag2O-Nps being improved following conjugation with some pharmacological drugs, such as moxifloxacin [18].
Moreover, it is hypothesized that silver compounds derived from Ag2O-Nps and Ag Nps can also attach to the N7 atom of guanine in DNA, disrupting the replication process and preventing cell proliferation [18].
El-Kahky et al. [19] indicate that AgNp, with dimensions of less than 17 nm, can perforate cell membranes and discharge harmful compounds, resulting in cell death. AgNp’s effectiveness against bacteria is contingent on a variety of conditions. The stability and adsorption pattern of the coating and capping agents on the silver surface govern the nanoparticles’ size. Strong reducing agents that increase reaction rates produce Np with a narrower size range that is smaller and more stable and has better microbial suppression [20]. With storage, aging, or degradation of the capping agent, AgNp may agglomerate, reducing the antibacterial capabilities of the material [11].
A variety of methods, including chemical, photochemical, and electrochemical procedures, can be used to synthesize nanoparticles. Because of their extremely small size, nanoparticles have a high surface area-to-volume ratio, which is particularly useful for antibacterial and antifungal applications [21]. Silver ions can be converted to silver nanoparticles using sodium borohydride, while polyvinyl pyrrolidone (PVP) or polyvinyl alcohol (PVA), among others, are used as capping agents [22]. The Turkevich method, which combines trisodium citrate as both a reducing agent and a capping agent, is an additional well-established technique for reducing silver ions to silver nanoparticles [23]. Trisodium citrate has been demonstrated to act as a reducing agent at temperatures over 60 °C, so for the Turkevich method to succeed, the reaction temperature must be at least equal to this temperature [24].
The purpose of this study was to present the development of small silver nanoparticles using the Turkevich method, to characterize and evaluate their acute toxicity following a single dosage administration, to develop and evaluate the pharmacokinetic profile in rats, and to analyze the influence of topical therapy with AgNp suspension on the evolution of burn-type lesions in experimental animals.
The synthesis and characterization of silver nanoparticles were carried out at the National Research and Development Institute for Chemistry and Petrochemistry (ICECHIM) in Bucharest, with assistance from the National Institute of Physics and Nuclear Engineering Horia Hulubei (IFIN HH), as part of the PN-III Project (P1-1.2-PCCDI-2017-0769) “Development of radiopharmaceuticals and nuclear techniques in oncology for imaging and personalized treatment at the molecular level” acronym ONCORAD contract 64/2018.
The experiments in this chapter were conducted in accordance with the Directive 63/2010/EU of the European Parliament and of the Council of Europe of 22 September 2010 on the protection of animals used for scientific purposes, and in accordance with Law No. 43/2014 on the protection of animals used for scientific purposes, as amended by Law No. 199 of 20 July 2018.
The studies were approved by the “Carol Davila” University of Medicine and Pharmacy’s institutional ethics committee in Bucharest.

2. Synthesis and Characterization of AgNp with Antimicrobial Potential

2.1. Materials and Methods

The Turkevich method was selected to synthesize AgNp because it allows for the nanoparticle size to be adjusted by varying the molar ratio of the silver and citrate salts that are utilized in the reaction, and because it can be easily implemented without the requirement for high reaction temperatures and pressures.
In order to perform the chemical synthesis of AgNp using the Turkevich method, we utilized powdered AgNO3, trisodium citrate dihydrate, and distilled water. The following is a description of the procedure.
We weighed 0.018 g of AgNO3 powder and dissolved it in 100 mL of distilled water, limiting exposure to light by covering the solution with aluminum foil. The solution was brought to a boil under continuous stirring.
We weighed 0.018 g of trisodium citrate dihydrate powder and dissolved it in 25 mL of distilled water. The obtained solution was transferred dropwise over the boiling AgNO3 solution, and the heating was continued until the color changed (to a transparent yellow-brown). After cooling, the nanoparticle suspension was stored in a brown container at 4 °C [25,26].
Nanoparticle solutions in dispersion were analyzed by UV-Vis spectrometry using an Ultra 3660 UV-Vis spectrometer (RIGOL Technologies, Inc., Suzhou, China, optical resolution 0.5 nm) in the wavelength range of 350–650 nm.
X-ray diffraction (XRD) analysis was performed using a Rigaku SmartLab 9 kW diffractometer (operating at 45 kV and 200 mA, CuKα radiation—1.54059 Å), in 2θ/θ scan mode, between 2° and 90° (2θ). Components were identified by a comparison with the ICDD records.
The average crystallite size was determined using the Debye-Scherrer equation (Equation (1)).
D = K × λ β   × cos θ
where D is the average crystallite size (nm), K is a shape factor (approximated to 0.94 for spherical particles), λ is the X-ray wavelength, β is the full width at half the maximum—FWHM), and θ is the Bragg angle.

2.2. Results

The UV-Vis spectrum (Figure 1) confirms the synthesis of Ag nanoparticles, and the position of the characteristic peak suggests particle sizes were below 10 nm [27].

2.3. Discussion

As a preliminary observation, the suspension of nanoparticles is in a highly stable dispersion, making their deposition impossible, even with repeated centrifugation (4000 rpm). By comparing the acquired diffractogram (Figure 2) to the ICDD sheet 01-087-0720 [28], it was possible to identify the characteristic Ag0 peaks, which correspond to the Miller indices (1,1,1) and (2,2,0), despite the fact that the diffractogram did not have an ideal look.
Applying the Debye-Scherrer equation (Equation (1)) to the indices (1,1,1) maximum provides an average crystallite size of 9.49 nm (Figure 3), which agrees closely with the UV-Vis study.
According to the ICP-MS analysis of the suspension of silver nanoparticles, the Ag concentration was 0.103 mg/mL.

3. Acute Toxicity Studies following Single-Dose p.o. Administration of Silver Nanoparticles in Small Rodents

3.1. Introduction

Acute toxicity studies are the first tests undertaken on a new substance with therapeutic potential for humans, and their purpose is to emphasize the adverse reactions that may occur after a single dose is administered. Among the goals of a single-dose acute toxicity test are to determine the estimated intrinsic toxicity of the tested chemical, which is frequently expressed by the LD50, and to acquire information that will aid in the design and selection of the dose for long-term research. The examined animals are monitored for fourteen days [29].
The compounds used in this research are nanoparticles of silver in suspension, as detailed in Section 2.

3.2. Materials and Methods

For the acute toxicity studies, we used a population of 24 male white NMRI mice weighing 38.11 ± 2.71 g. The animals came from the biobase of the “Cantacuzino” National Institute for Medical-Military Research-Development.
During the experiment, the animals had access to food and water “ad libitum”. A thermohygrometer was used to monitor humidity and temperature conditions for the animals. The recorded temperature varied between 20 °C and 22 °C, and the humidity was between 35% and 45%.
The tested compounds are AgNp in the form of a suspension in distilled water, obtained by the Turkevich method, with an average crystal size of 9.49 nm and an Ag concentration of 0.103 mg/mL.
The animals that were brought from the biobase were left for 7 days with food and water “ad libitum” for acclimatization.
After the acclimatization period, the animals were randomized into three groups of eight and then administered p.o. three different and increasing doses, as follows:
  • the mice in Group I received 10 μL/g of AgNp suspension;
  • the mice in Group II received 15 μL/g of AgNp suspension;
  • the mice in Group III received 20 μL/g of AgNp suspension.
The doses administered to the experimental animals are organized in Table 1.
The experiments in this chapter were carried out under the Directive 63/2010/EU of the European Parliament and the Council of Europe of 22 September 2010, on the protection of animals used for scientific purposes, as well as in accordance with Law No. 43/2014 on the protection of animals used for scientific purposes, as amended by Law No. 199 of 20 July 2018.
The institutional ethics of the University of Medicine and Pharmacy “Carol Davila” Bucharest committee approved the studies.
The data are presented as means ± standard deviations. The statistical analysis was performed with the t-student test using the GraphPad software, version 9.2.0. The results of the applied statistical tests showed a confidence interval of 90%.

3.3. Results

3.3.1. Observational Analysis of Animals during the First Eight Hours after Administration of Silver Nanoparticle Suspension

In Group I, the animals exhibited hyperexcitability, hyperreflectivity, agitation, and mild anxiety one hour after injection. These signs of toxicity subsided during the first two hours after the AgNp injection, and the animals displayed a slight sedation for the following six hours.
In Group II, during the first three hours following the administration of the AgNp suspension, the animals displayed a more acute state of agitation, accompanied by hyperexcitability and hyperreflectivity, than those in Group I. The anxious state persisted for the first five hours. During the previous two hours, the animals exhibited signs of sedation.
In Group III, the animals displayed intense agitation as well as aggressive outbursts in the first three hours following the administration. Other harmful effects included feelings of hyperexcitability, hyperreflection, and anxiety. During the last two hours of observation, a state of sedation developed, but not fully, as some animals remained vigilant.
By analyzing the evolution of animal behavior in the three groups, we can conclude that the condition of agitation accompanied by the previously identified specific manifestations appears to be proportionate to the administered dose of AgNp.

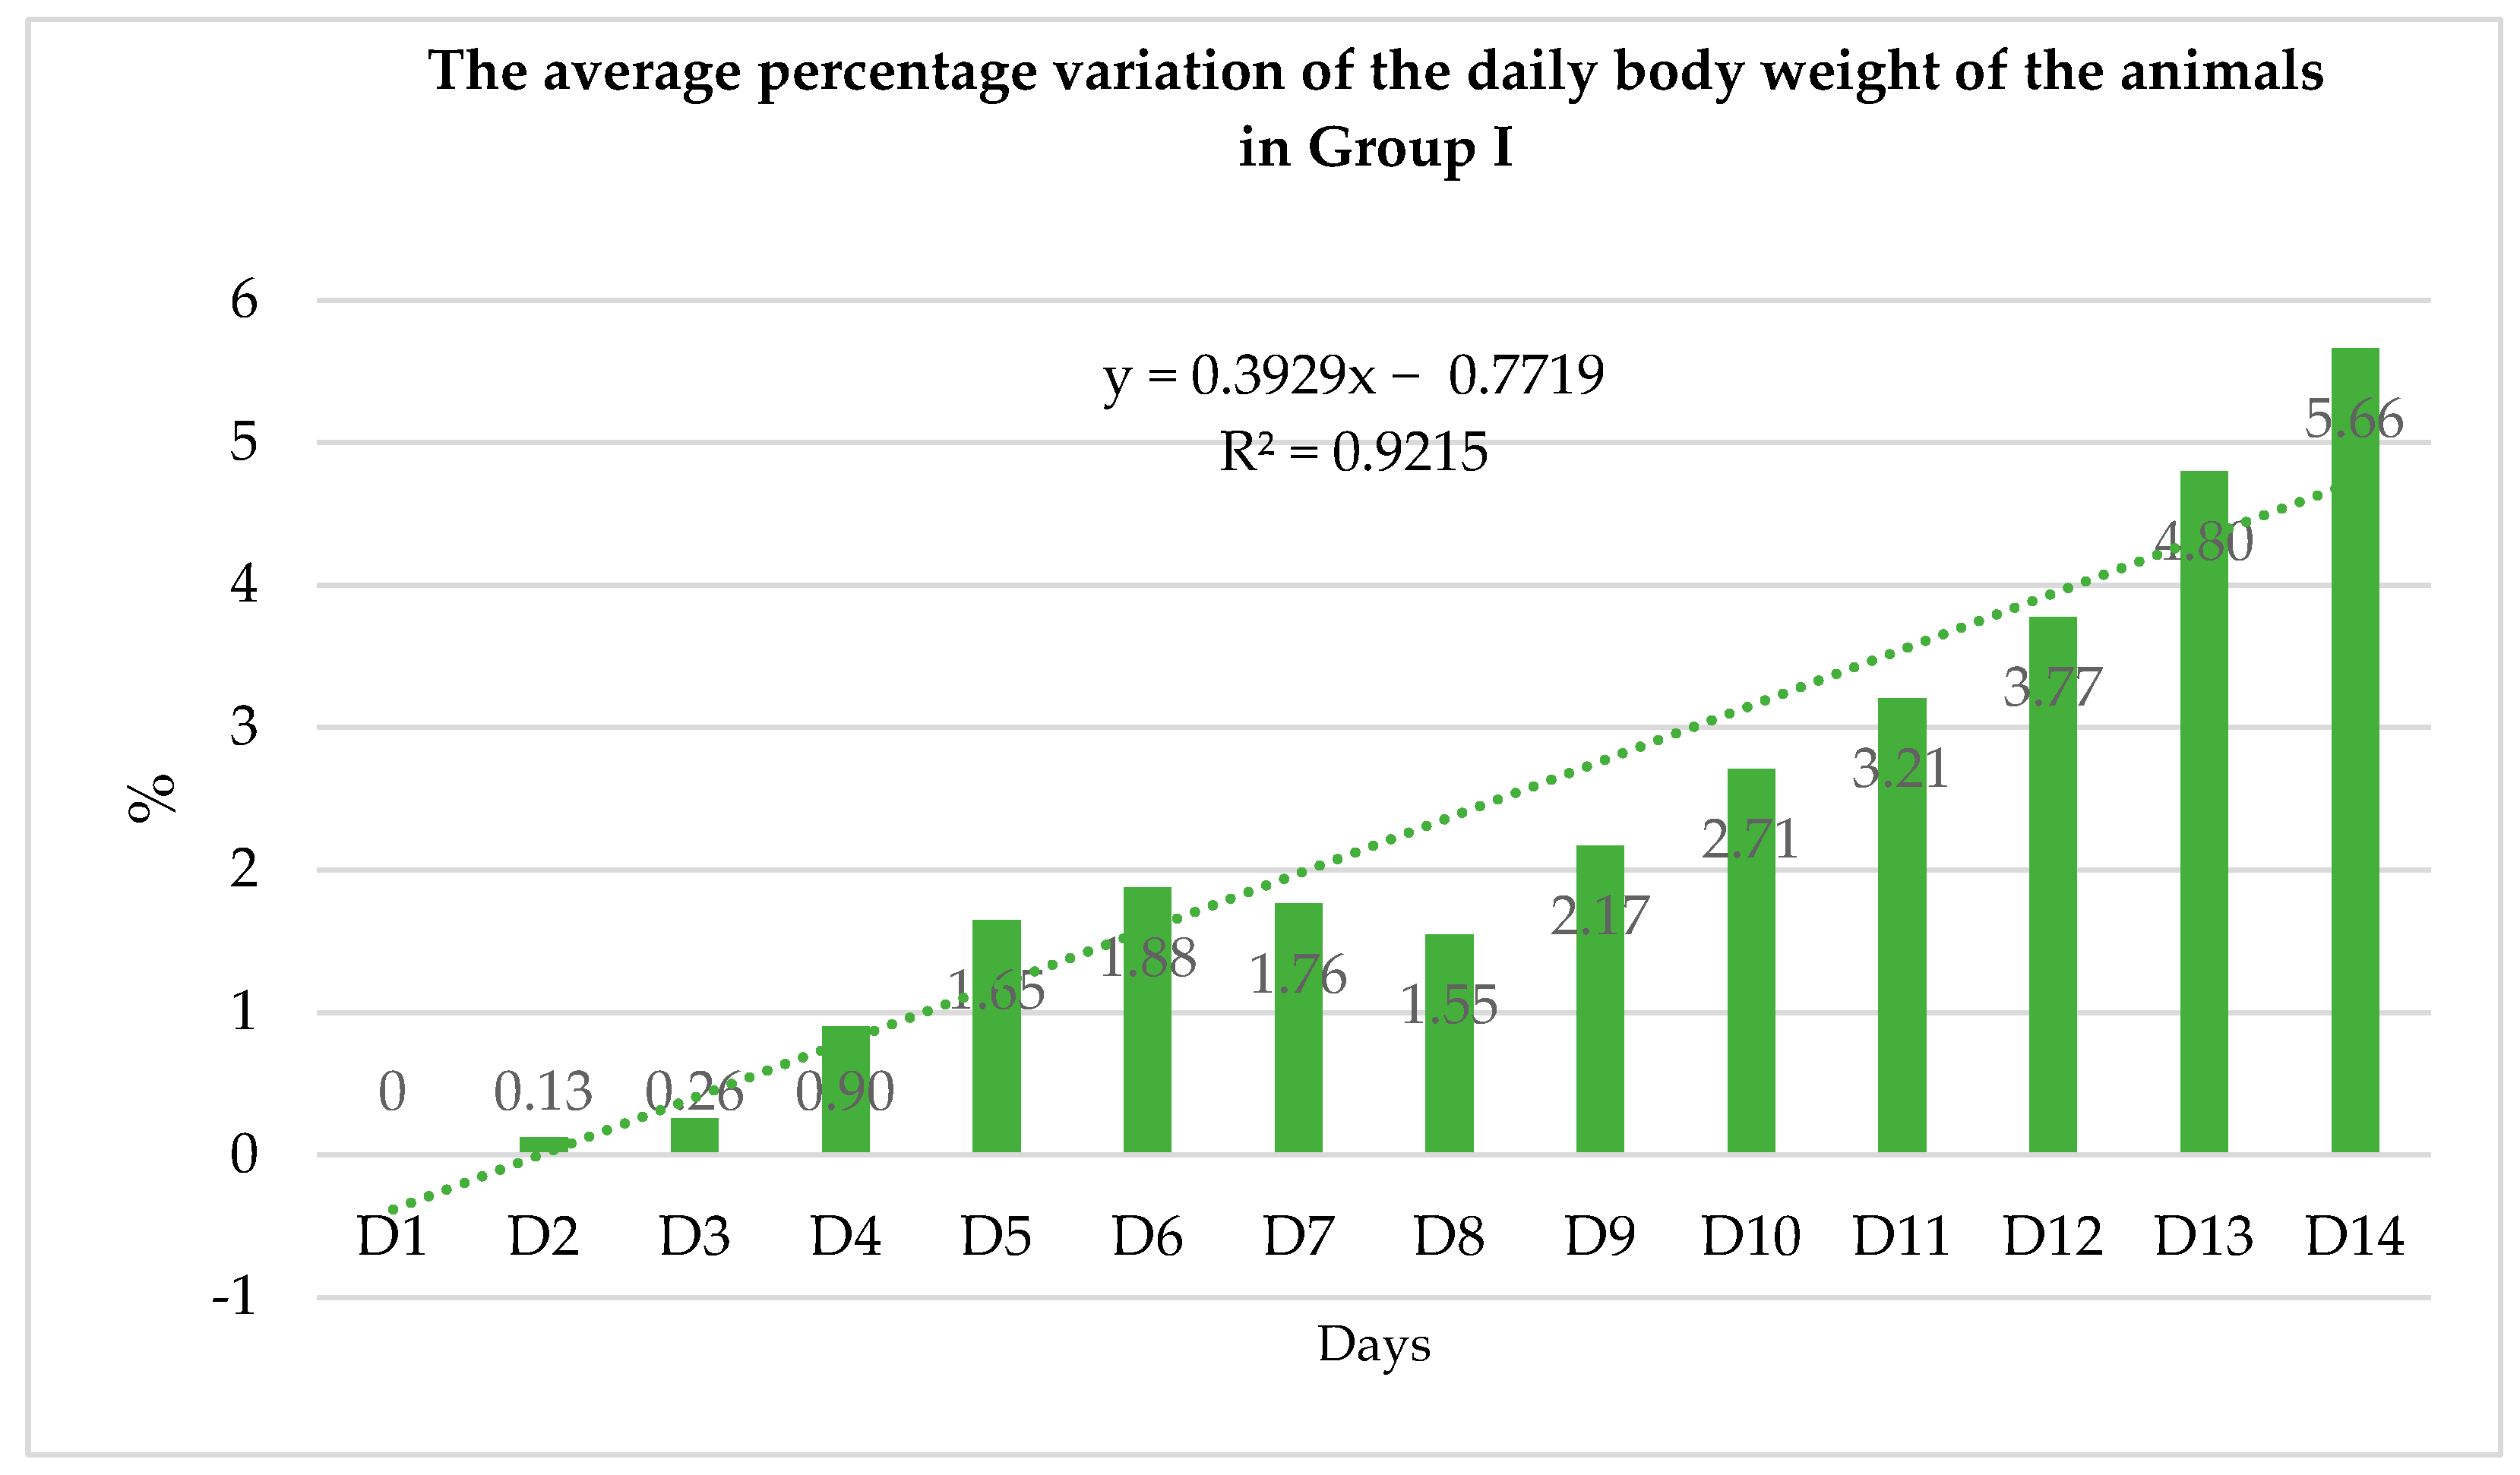
3.3.2. Effects of AgNp on Body Weight Dynamics

For Group I, we administered 0.00103 mg of Ag per gram of body weight. For 14 days, no deadly effect was observed at this dose. The weight of the treated animals increased from the beginning until the end of the experiment, with the exception of days seven and eight, when the average body weight decreased slightly. Figure 4 represents the variation in body weight.
For Group II, we administered 0.001545 mg of Ag per gram of body weight. At this dose, no animal deaths were documented for 14 days. From the beginning until the end of the experiment, the weight of the treated animals followed an upward trend. Figure 5 represents the variation in body weight.
For Group III, we administered 0.00206 mg of Ag per gram of body weight. At this dose, no animal deaths were documented for 14 days. Beginning on day eight, the weight of the treated animals followed an upward trend. The average body weight of the animals decreased from the beginning of the experiment to day seven. Figure 6 and Figure 7 represent the variation in body weight.

3.4. Discussion

Except for Group III, where the trend was a decrease in the first week after administration, the general trend in the evolution of the body weight of the treated animals was in the direction of its increase toward the end of the experiment. In the first 14 days following the administration of the three doses evaluated, no fatal effects were observed. In Figure 8 and Figure 9, the comparative evolution of the average body weight of the three animal groups is illustrated.
During the period of observation, the animals did not exhibit symptoms of diarrheal illness. The rats did not exhibit any changes in their motor behavior, aggressiveness, fur appearance, or mucous discharges after 14 days.
Following the t-student statistical analysis, we observed statistically significant differences in the variation of the animals’ body weight depending on the dose of AgNp administered. Consequently, we observed significantly greater differences between the animals of Group II and the animals of Group III (p < 0.001) than between the animals of Group I and the animals of Group III (p < 0.01). Between Group I and Group II, there are statistically significant differences in the variation of animal body weight according to the dose of AgNp administered (p < 0.05).

4. Studies on the Pharmacokinetics of AgNp after Single-Dose Administration in Rodents

4.1. Introduction

The pharmacological activity of a molecule is directly proportional to its concentration at the site of action, which is dependent on the plasma concentration of the evaluated substance. Consequently, knowledge of the plasma concentration of a substance obtained from animal studies is applicable to therapeutic trials in humans. Oftentimes, rodents are utilized to collect preliminary pharmacokinetic data [30]. The pharmacokinetic parameters of nanoparticles—the sum of essential processes including absorption, distribution, metabolism, and elimination—are useful for evaluating their efficacy and safety. A thorough understanding of their pharmacokinetics is essential for accurate risk assessment and secure biological applications.
Nanoparticle absorption is a complex process that depends on how the particles are administered. Consequently, ingested nanoparticles are absorbed by transcytosis, paracellular transport, and M cell participation, whereas subcutaneous, intramuscular, and inhalation nanoparticles are absorbed by macrophages and lymph [31]. Shape, coating, and size modifications to Ag nanoparticles can enhance their absorption by the cells. The spherical form and coatings such as lactose, PVP, phosphorylcholine, and mannan sulfate (MS) can increase the nanometal absorption. Coated particles also have the unique ability to avoid clearance and remain in circulation longer. Numerous studies have been conducted on nanoparticles ranging in size from 20 nm to 100 nm, with the conclusion that the smaller the particle size, the wider the particle distribution [32]. The liver is believed to be the primary organ for Ag distribution, regardless of the mode of exposure (oral, subcutaneous, intravenous, or inhalation), with the spleen and kidneys being the subsequent organs for Ag storage [31]. Ag nanoparticles are also found in the brain and testicles [33]. A in vivo analysis of the effects of a commercial colloidal silver nanoproduct on various classes of cytochrome P450 enzymes was conducted to examine the metabolism of AgNp (CYP1A2, CYP2C9, CYP2C19, CYP2D6, CYP3A4). Aside from the presence of silver in the serum, no clinically relevant metabolic alterations, or activation of CYP450 enzyme inhibition were seen [34]. Due to the decreased bioavailability of silver nanoparticles, it appears that the majority of AgNp is eliminated through intestinal excretion. Urine was discovered to contain a negligible amount of nanosilver [31]. Larger particles appear resistant to removal by metabolic processes and renal excretion [35] and may remain in the body for more than six months [36]. To deliver their biological effect, nanoparticles must avoid clearance and continue to circulate in the blood. However, once the target organ is reached, nanometals must be eliminated from the remaining organs of the body to prevent accumulation and potential toxicity [32].
This study developed two physiological pharmacokinetic models for previously obtained silver nanoparticles, a murine experimental model, and a large rodent experimental model, to complement the current experimental evidence on the behavior of nanosilver in the animal’s body.

4.2. Matherials and Methods
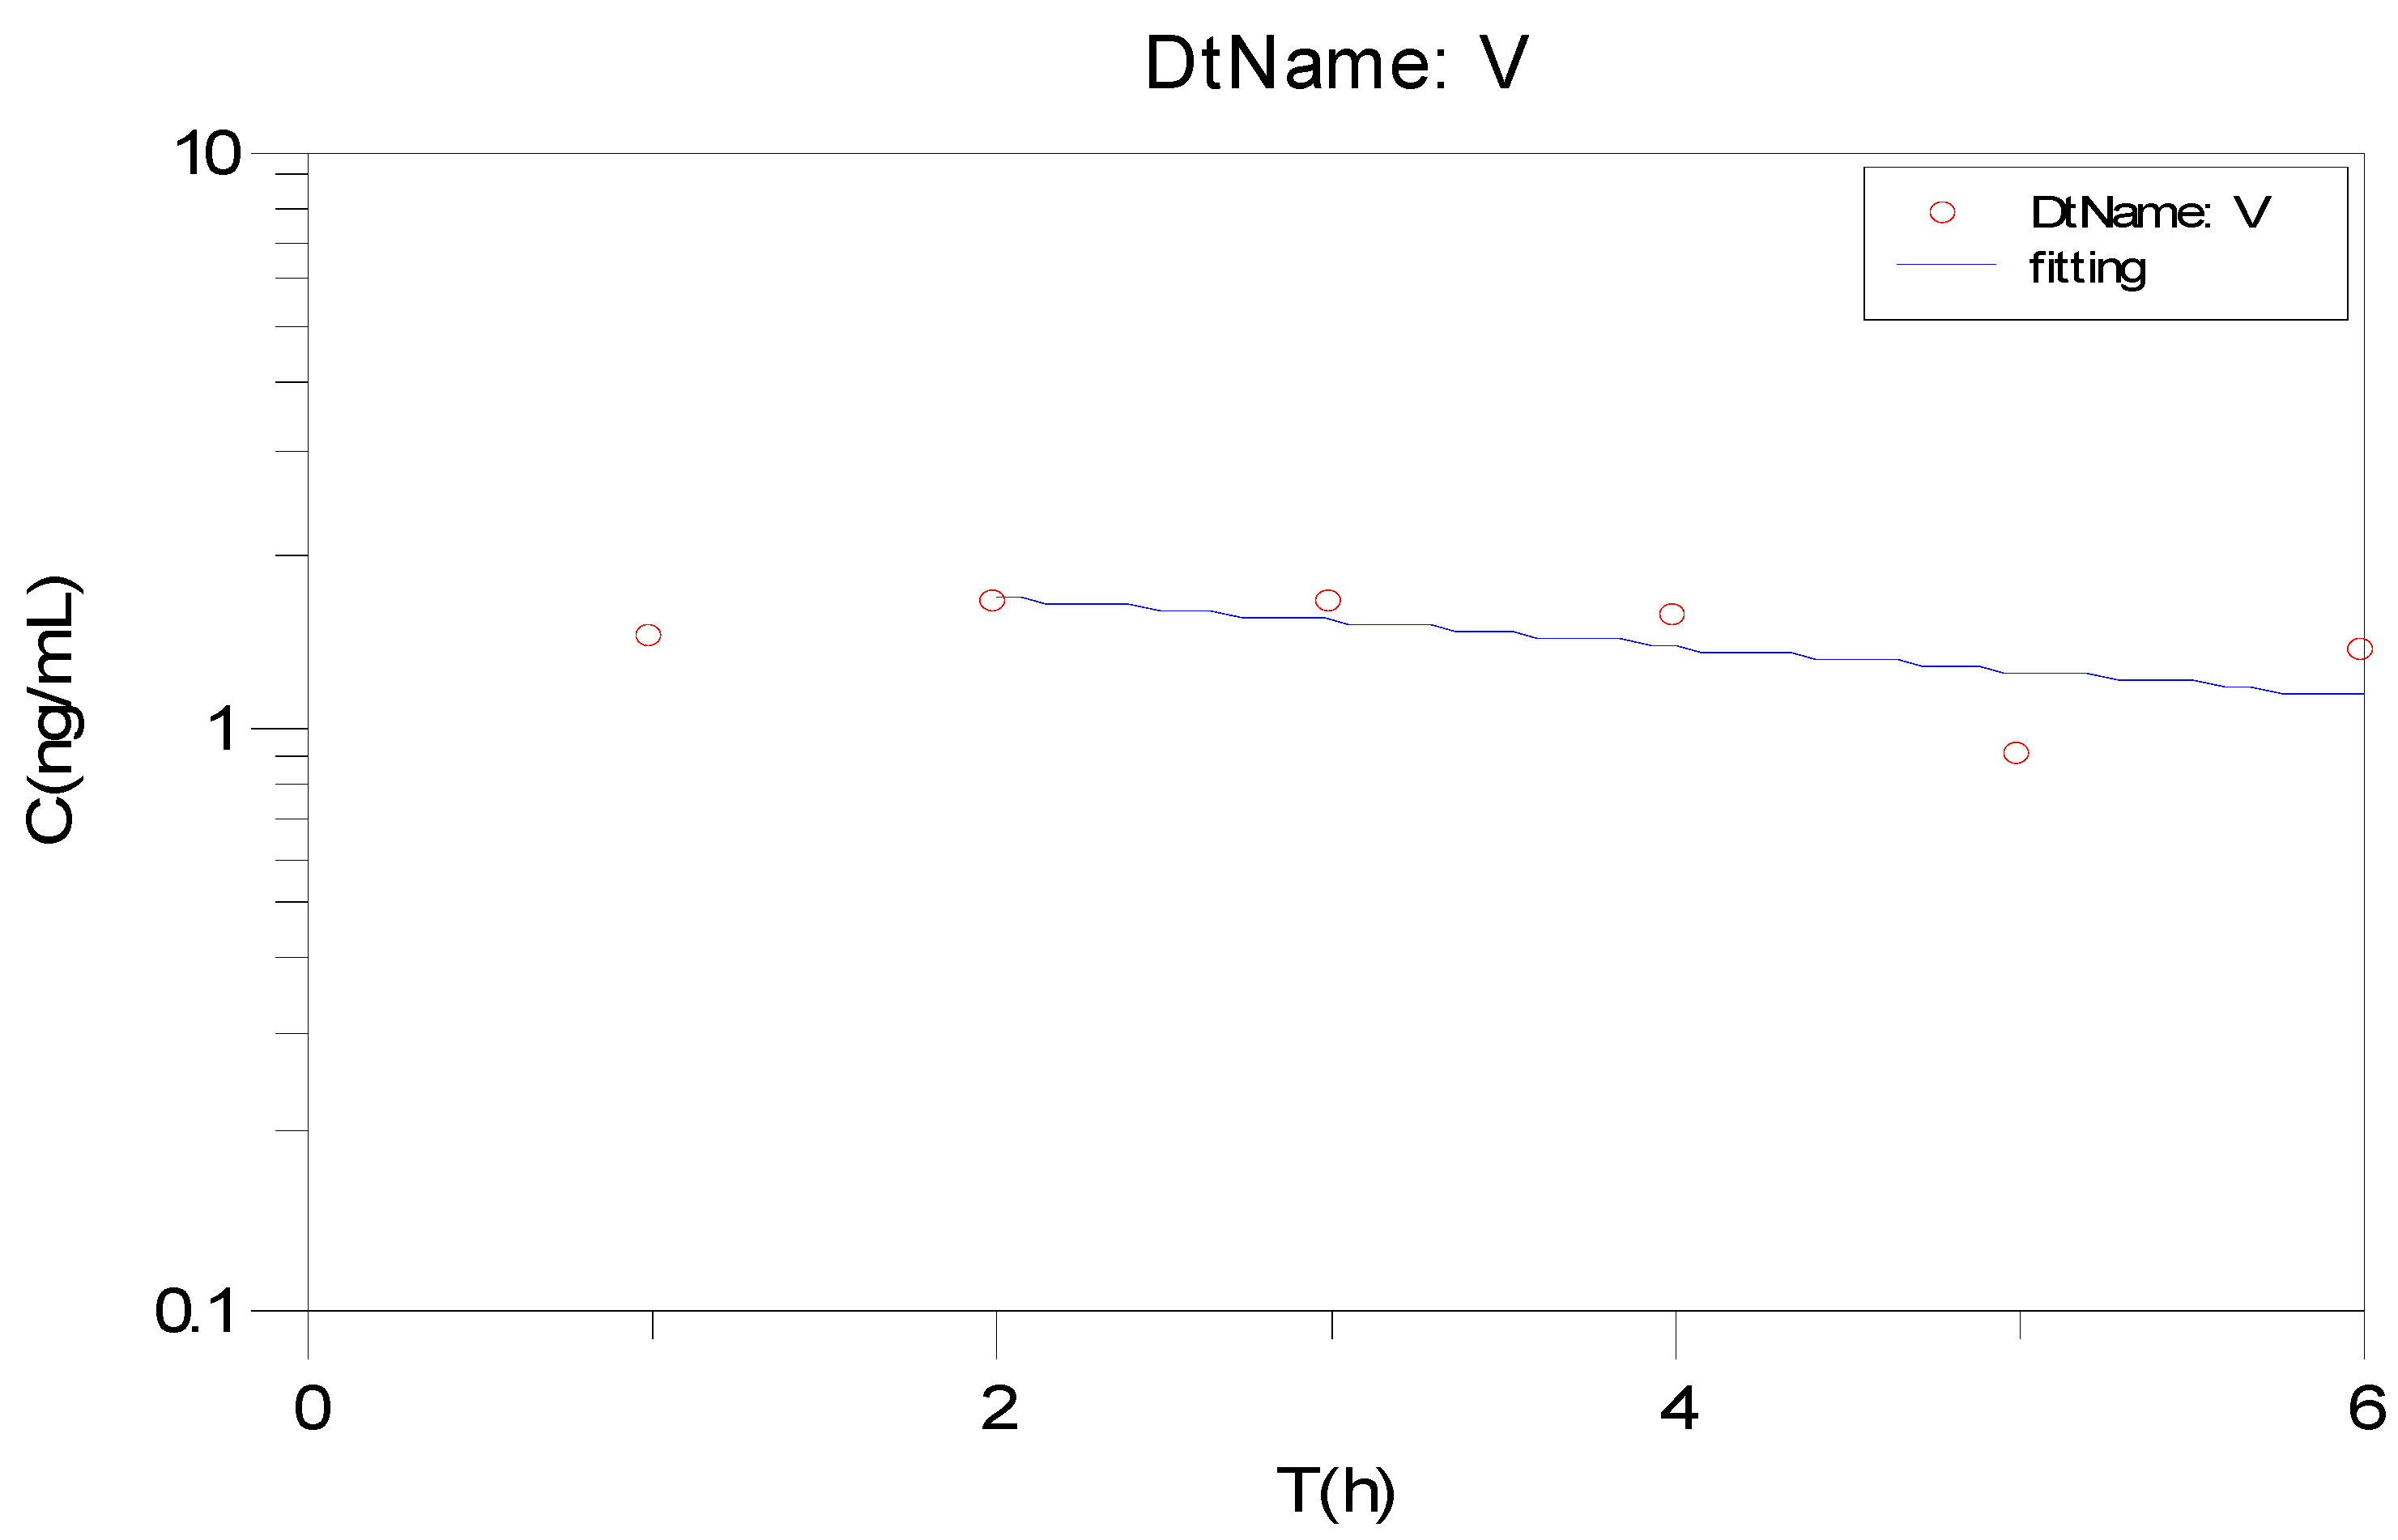
For pharmacokinetic studies, we utilized two rodent species: a group of six male, white NMRI mice (40.16 ± 3.31 g) and a group of six mature male Wistar rats (374.4 ± 25.9 g). The animals originated from the biobase of the “Cantacuzino” National Institute of Medical-Military Research and Development.
The animals that were taken from the biobase were fed and watered “ad libitum” for seven days to facilitate acclimatization. The temperature ranged between 20 °C and 22 °C, and the humidity ranged between 35% and 45%.
The AgNp suspension was administered intraperitoneally in a single dose (Table 1), and blood samples were collected every hour for the first six hours and then after 24 h. Blood samples were collected on Whatman paper and subjected to a digestion process in an HNO3:H2O2 (3:1) mixture for one week to eliminate organic compounds contained in the blood. Following the centrifugation of the obtained samples, 0.5 mL of the supernatant was removed and diluted with 4.5 mL of ultrapure water. The final solutions were analyzed using ICP-MS technology, and the resulting Ag concentrations were utilized for the modeling of the pharmacokinetic profiles in the mice and rats using the Kinetica software, version 3.1. Comparative analyses of pharmacokinetic parameters across species were also conducted using T and F tests in the GraphPad Prism software, version 9.2.0.

4.3. Results

The individual values of Ag0 plasma concentrations detected in the blood samples of the experimental animals are presented in Table 2 and Table 3 and Figure 10 and Figure 11.

4.4. Discussion

By comparing the values of the pharmacokinetic parameters of the two rodent species (Table 4 and Table 5), we can observe similarities between the Tmax parameters (3.60 h vs. 3.20 h), Lz (0.043–1 h vs. 0.048–1 h), T1/2 (21.04 h vs. 19.40 h) and MRT (31.43 h vs. 29.02 h).
Regarding the differences obtained between the pharmacokinetic parameters of the two rodent species (Table 6), meaningful variations were obtained for maximum plasma concentrations (p < 0.01), clearance (p < 0.05), Vz (p < 0.0001) and Vss (p < 0.0001). These results complement previous research comparing AgNp pharmacokinetics between species, or between the two genera of the same species. More specifically, Lee et al. [37] showed that T1/2 is three- to four-times higher in rabbits compared to rats (rodents), and Xue Y. [38] demonstrated that the pharmacokinetic profile of AgNp depends on the sex of the individual, being higher in males compared to females. On the contrary, another study on rats conducted by Boudreau et al. [39] showed that silver distribution and accumulation are significantly higher in female species compared to male species. This discrepancy may be attributable to a female-specific hormonal regulation of the clearance and subsequent accumulation of AgNp. The target organs for AgNp distribution and accumulation are the kidneys, liver, and sections of the gastrointestinal tract, such as the jejunum and colon. Male rats had larger silver levels in the spleen, while female rats had higher silver levels in the kidneys.

5. Influence of Topical Treatment with AgNp Suspension on the Course of Burn-Type Lesions in Experimental Animals

5.1. Introduction

Among metals, silver preparations (silver ions, silver nanoparticles, and silver salts) are increasingly utilized due to their broad antimicrobial applications [40]. They are frequently used in the treatment of burn or eschar-type injuries because silver ions can easily bind to proteins, RNA, and DNA with a much lower risk of triggering resistance mechanisms compared to traditional antimicrobials [41]. Over time, it has been discovered that silver nanoparticles have a strong antibacterial impact against both Gram-negative and Gram-positive bacteria [42]. Silver is also an excellent germicide with hardly any human toxicity [43]. The use of silver nanoparticles in topical ointments to prevent the infection of open wounds and burns is one of the most widespread applications [44].
In this section, we compared the antibacterial and healing properties of silver nanoparticles in distilled water generated by the Turkevich method, with an average crystallite size of 9.49 nm and an Ag concentration of 0.103 mg/mL, to those of silver sulfadiazine.

5.2. Materials and Methods

The equipment utilized consisted of a device with a metal disk that had a diameter of 10 mm, saline, and silver sulfadiazine cream 10 mg/g. The tested compounds were AgNp in the form of a suspension in distilled water, previously obtained by the Turkevich method, with an average crystallite size of 9.49 nm and an Ag concentration of 0.103 mg/mL.
The research involved 22 male Wistar rats from the “Cantacuzino” National Institute of Medical-Military Research and Development. The animals were kept under laboratory conditions, monitoring humidity and temperature using a thermohygrometer. The recorded temperature varied between 20 °C and 22 °C, and the humidity was between 35% and 45%. The animals that were brought from the biobase were left for seven days with food and water “ad libitum” for acclimatization.
The animals had a part of their dorsal fur removed. Subsequently, they were anesthetized with ethyl ether, and a thermal burn injury of low to moderate severity was caused using a particular metal device with a diameter of 10 mm, heated in a saline solution brought to a boil, and held in contact with the dorsal side for 15 to 20 s. The lesions were cleansed with saline, and the animals were separated into three groups according to the following topical treatments:
  • the control group—untreated animals, NaCl (six animals);
  • the reference group—animals treated with silver sulfadiazine cream, SAg (eight animals);
  • the treatment group—animals treated with a suspension of silver nanoparticles, AgNp (eight animals).
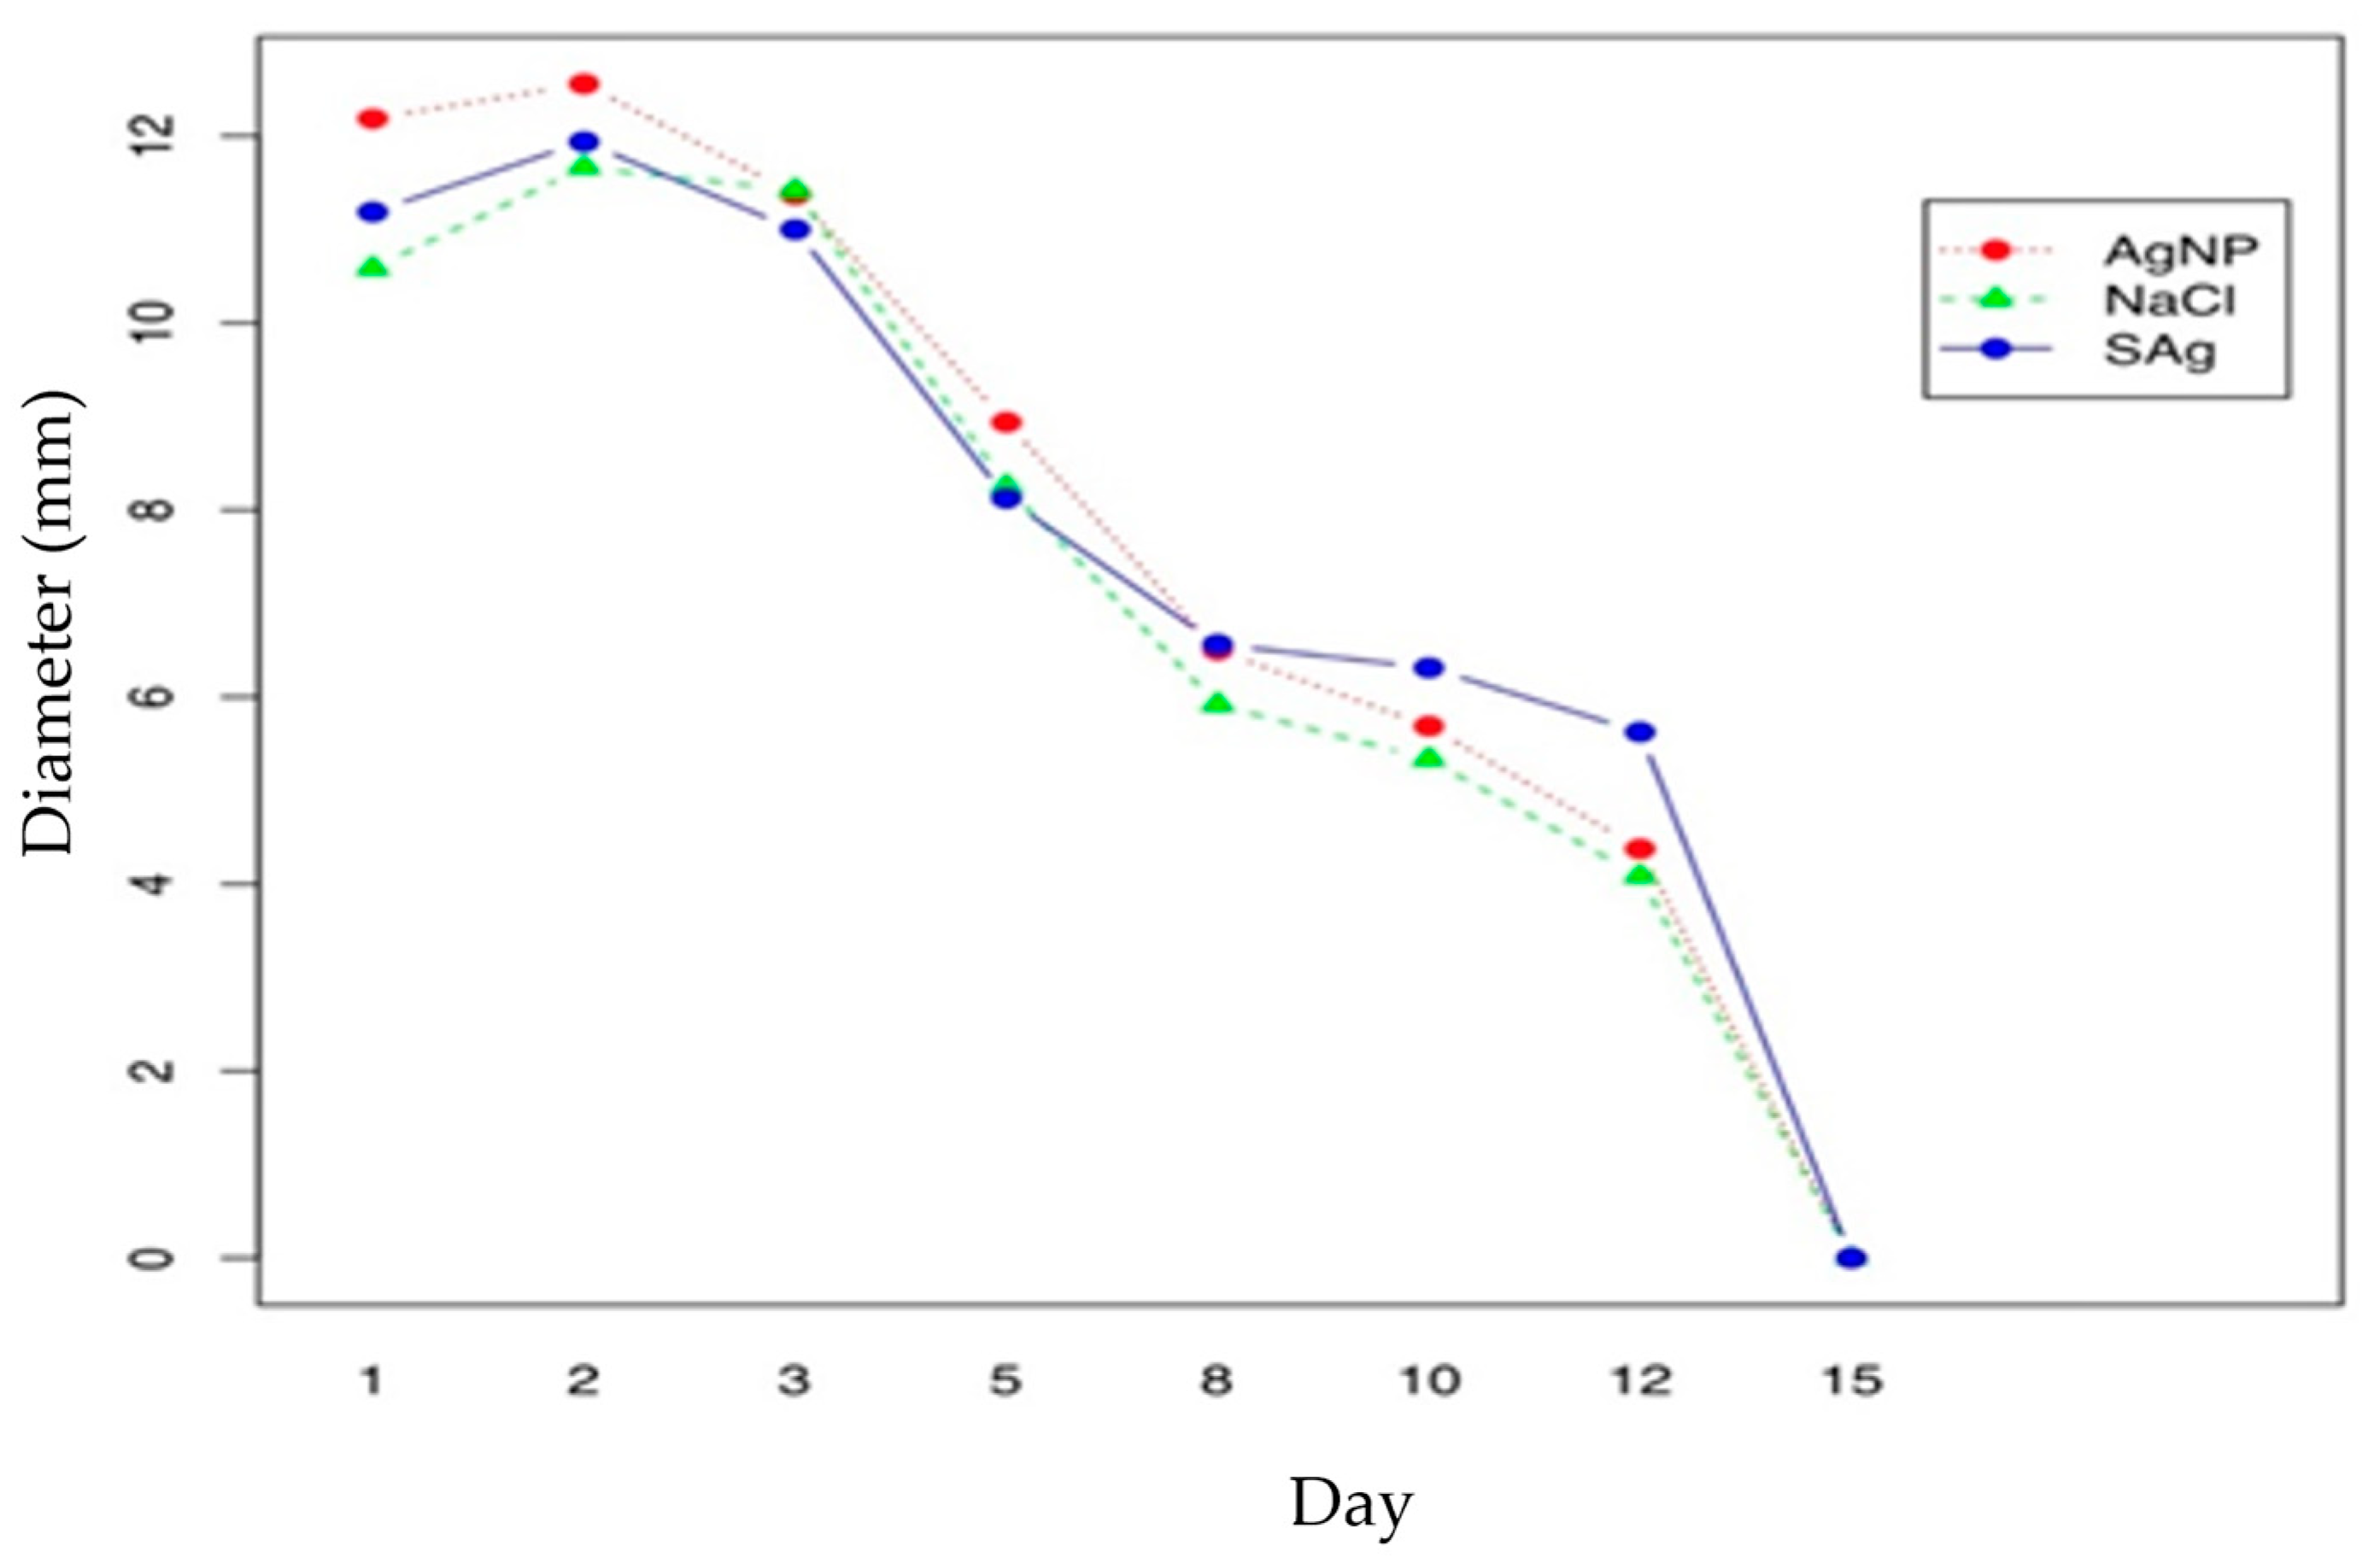
In the untreated control group, wounds were cleansed with a saline solution and wrapped with sterile gauze, which is the standard treatment for burns. In the control group, lesions were covered with sterile gauze, onto which silver sulfadiazine cream was applied. In the treatment group, lesions were covered with sterile gauze impregnated with a previously synthesized AgNp suspension.
The lesions on the animals were treated daily with gauze for the first five days, as previously described. Six days following the removal of the sterile gauze dressings, the lesions were treated until they healed in the majority of the animals by day 15. Every day for 15 days, the condition and appearance of the lesions were assessed. Digital cameras were used to capture the surface morphology of the lesions. The progression of the wound’s mean diameter was measured daily for five days, then on days 8, 10, 12, and 15. The average of three measurements was used to determine the average diameter of the burns. The wounds were observed while they healed in order to compare them to those of the untreated group.
Animals were also monitored for possible topical or systemic adverse reactions following topical treatment. The scarring or wound healing process was calculated according to the equation:
Healing   % = D i D i + 1 D i × 100
where Di is the initial diameter of the lesion determined on day i, and Di+1 is the diameter determined at time i + 1.
The calculated diameter represents the arithmetic mean of the diameters measured from different areas of the lesion.
The wounds were considered healed (diameter = 0 mm) after the shedding of the crust that formed following the experimental wound induction.
The open-source program R, version 3.6.3, was used for statistical analysis. A bifactor ANOVA analysis of variance and post hoc comparisons, notably the Nemenyi Test, were applied to paired data.

5.3. Results

Figure 12 depicts, both visually and quantitatively, the progression of the healing process for the burn-type injuries in all three groups. For each individual group, representative images were chosen. The lesions were not infected in any case. On the second day, we can observe that the lesion treated with silver sulfadiazine did not worsen, and the healing process began without the development of a crust. However, in the case of the group treated with silver nanoparticles, a crust appears on a segment of the lesion’s surface.
In the untreated group, the entire surface of the lesion developed a crust. On the third day of the experiment, the animals treated with SAg exhibited inflammation in the perilesional tissue, but the group treated with AgNp did not. The lesions of the animals treated with silver sulfadiazine exhibited a similar progression to those of the animals treated with AgNp, with the exception of the formation and exfoliation of the crust being visible on day 10 in the AgNp group and on day 12 in the SAg group.
It should be observed that on day 15, healing was complete in the group treated with AgNp, however a scar was still apparent in the group treated with silver sulfadiazine. Although healing occurred more rapidly in the control group, the progression of the healing process was accompanied by inflammation and the development of a substantially larger and harder crust by day five.

5.4. Discussion

Figure 13 shows that the average diameter of the animal lesions decreased with time, with the exception of the first day following the induction of the burn, when the average diameter increased. The development of the lesions in the control group and the reference group were similar.
Following the ANOVA statistical analysis, it was observed that there were no significant differences between the three groups (p > 0.05).
Table 7 illustrates the percentage variation in the healing process from one day to the next, determined using the average daily diameters of each group’s lesions. On the second day of the experiment, the average diameter of the lesions developed the most in the control group. The average diameters increased in the following order by percentage: AgNp < SAg < NaCl (+3.08% < +6.70% < +10.24%). The healing percentages were constantly higher for the AgNp group in comparison to the SAg group.
The healing effect occurred on the third day, with the results indicating that AgNp had a higher percentage of healing from the beginning: AgNp < SAg < NaCl (−9.45% < −7.85% < −2.14%). Between days 8 and 10, the rate of healing was reduced for all groups; despite this, AgNp had the highest healing percentage. We can therefore conclude that, among the three examined groups, AgNp had the strongest therapeutic effect (Figure 14).
A post hoc analysis revealed a greater difference between the first and last dates assessed in the study between the treatment group and the control group (Table 7).

6. Analysis of Hematological Parameters

6.1. Introduction

In the past few years, there has been a huge expansion in the manufacture and utilization of numerous nanostructured materials, including silver nanoparticles. Due to their antibacterial properties, these nanoparticles have been incorporated into a variety of products, including cosmetics, textiles, and pharmaceuticals [45]. Although silver nanoparticles have superior properties to other nanostructured particles, in terms of electrical conductivity, antimicrobial effects, optical properties, and applications in oxidative catalysis, they remain one of the most contentious materials due to their potential toxicity in biological systems [46]. Several factors, including chemistry, surface, size, dosage, and particle administration method, play a crucial role in the harmful mechanisms of nanoparticles in organisms, the consequences of which are still unknown [47]. Kim et al. [48] reported the results of a 29-day study on Sprague-Dawley rats, which showed that the oral administration of 300 mg/kg of silver nanoparticles altered the clinical chemistry and the hematological parameters. In a separate study conducted by M. S. Heydrnejad et al. [49], oral administration of AgNp caused alterations in the blood chemistry and the hepatotoxicity, as evidenced by elevated serum activity levels of both AST and ALT, and histological liver damage, with no significant differences between male and female mice. In addition, Tiwari et al. [50] detected substantial alterations in the hematological parameters (WBC count, platelet count, hemoglobin, and RBC count) in Wistar rats injected intravenously with 40 and 20 mg/kg of AgNp.

6.2. Materials and Methods
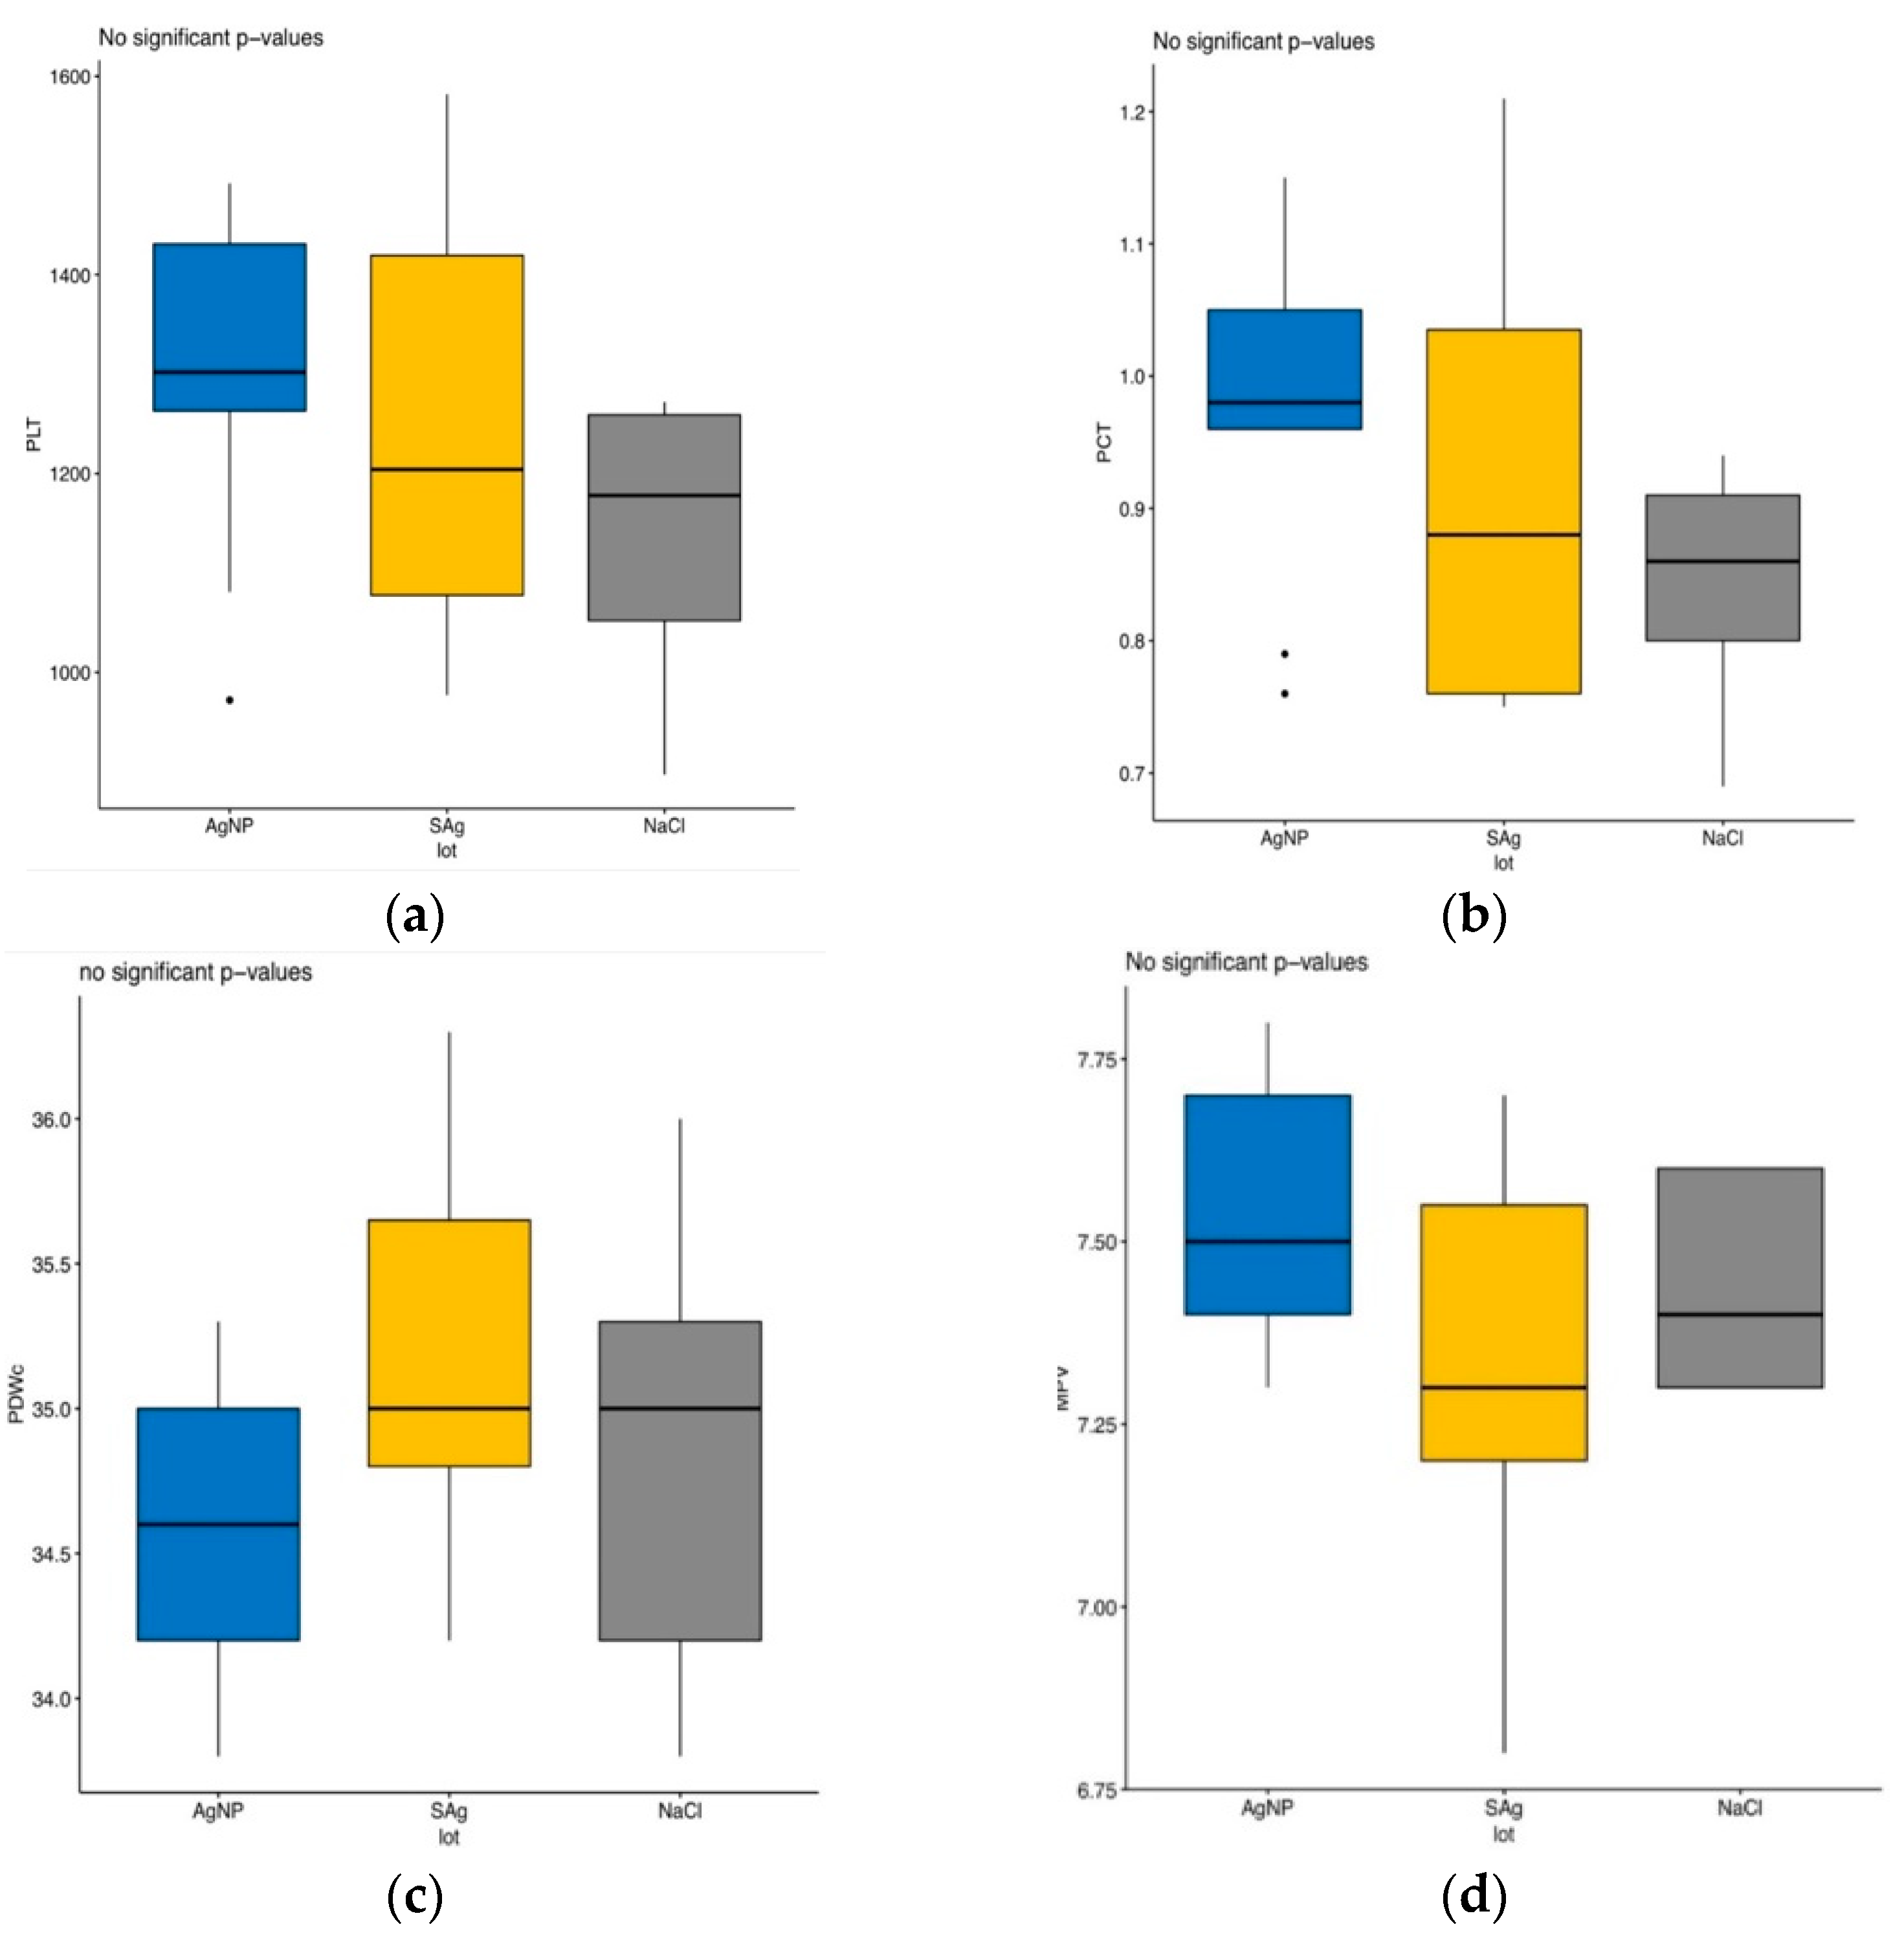
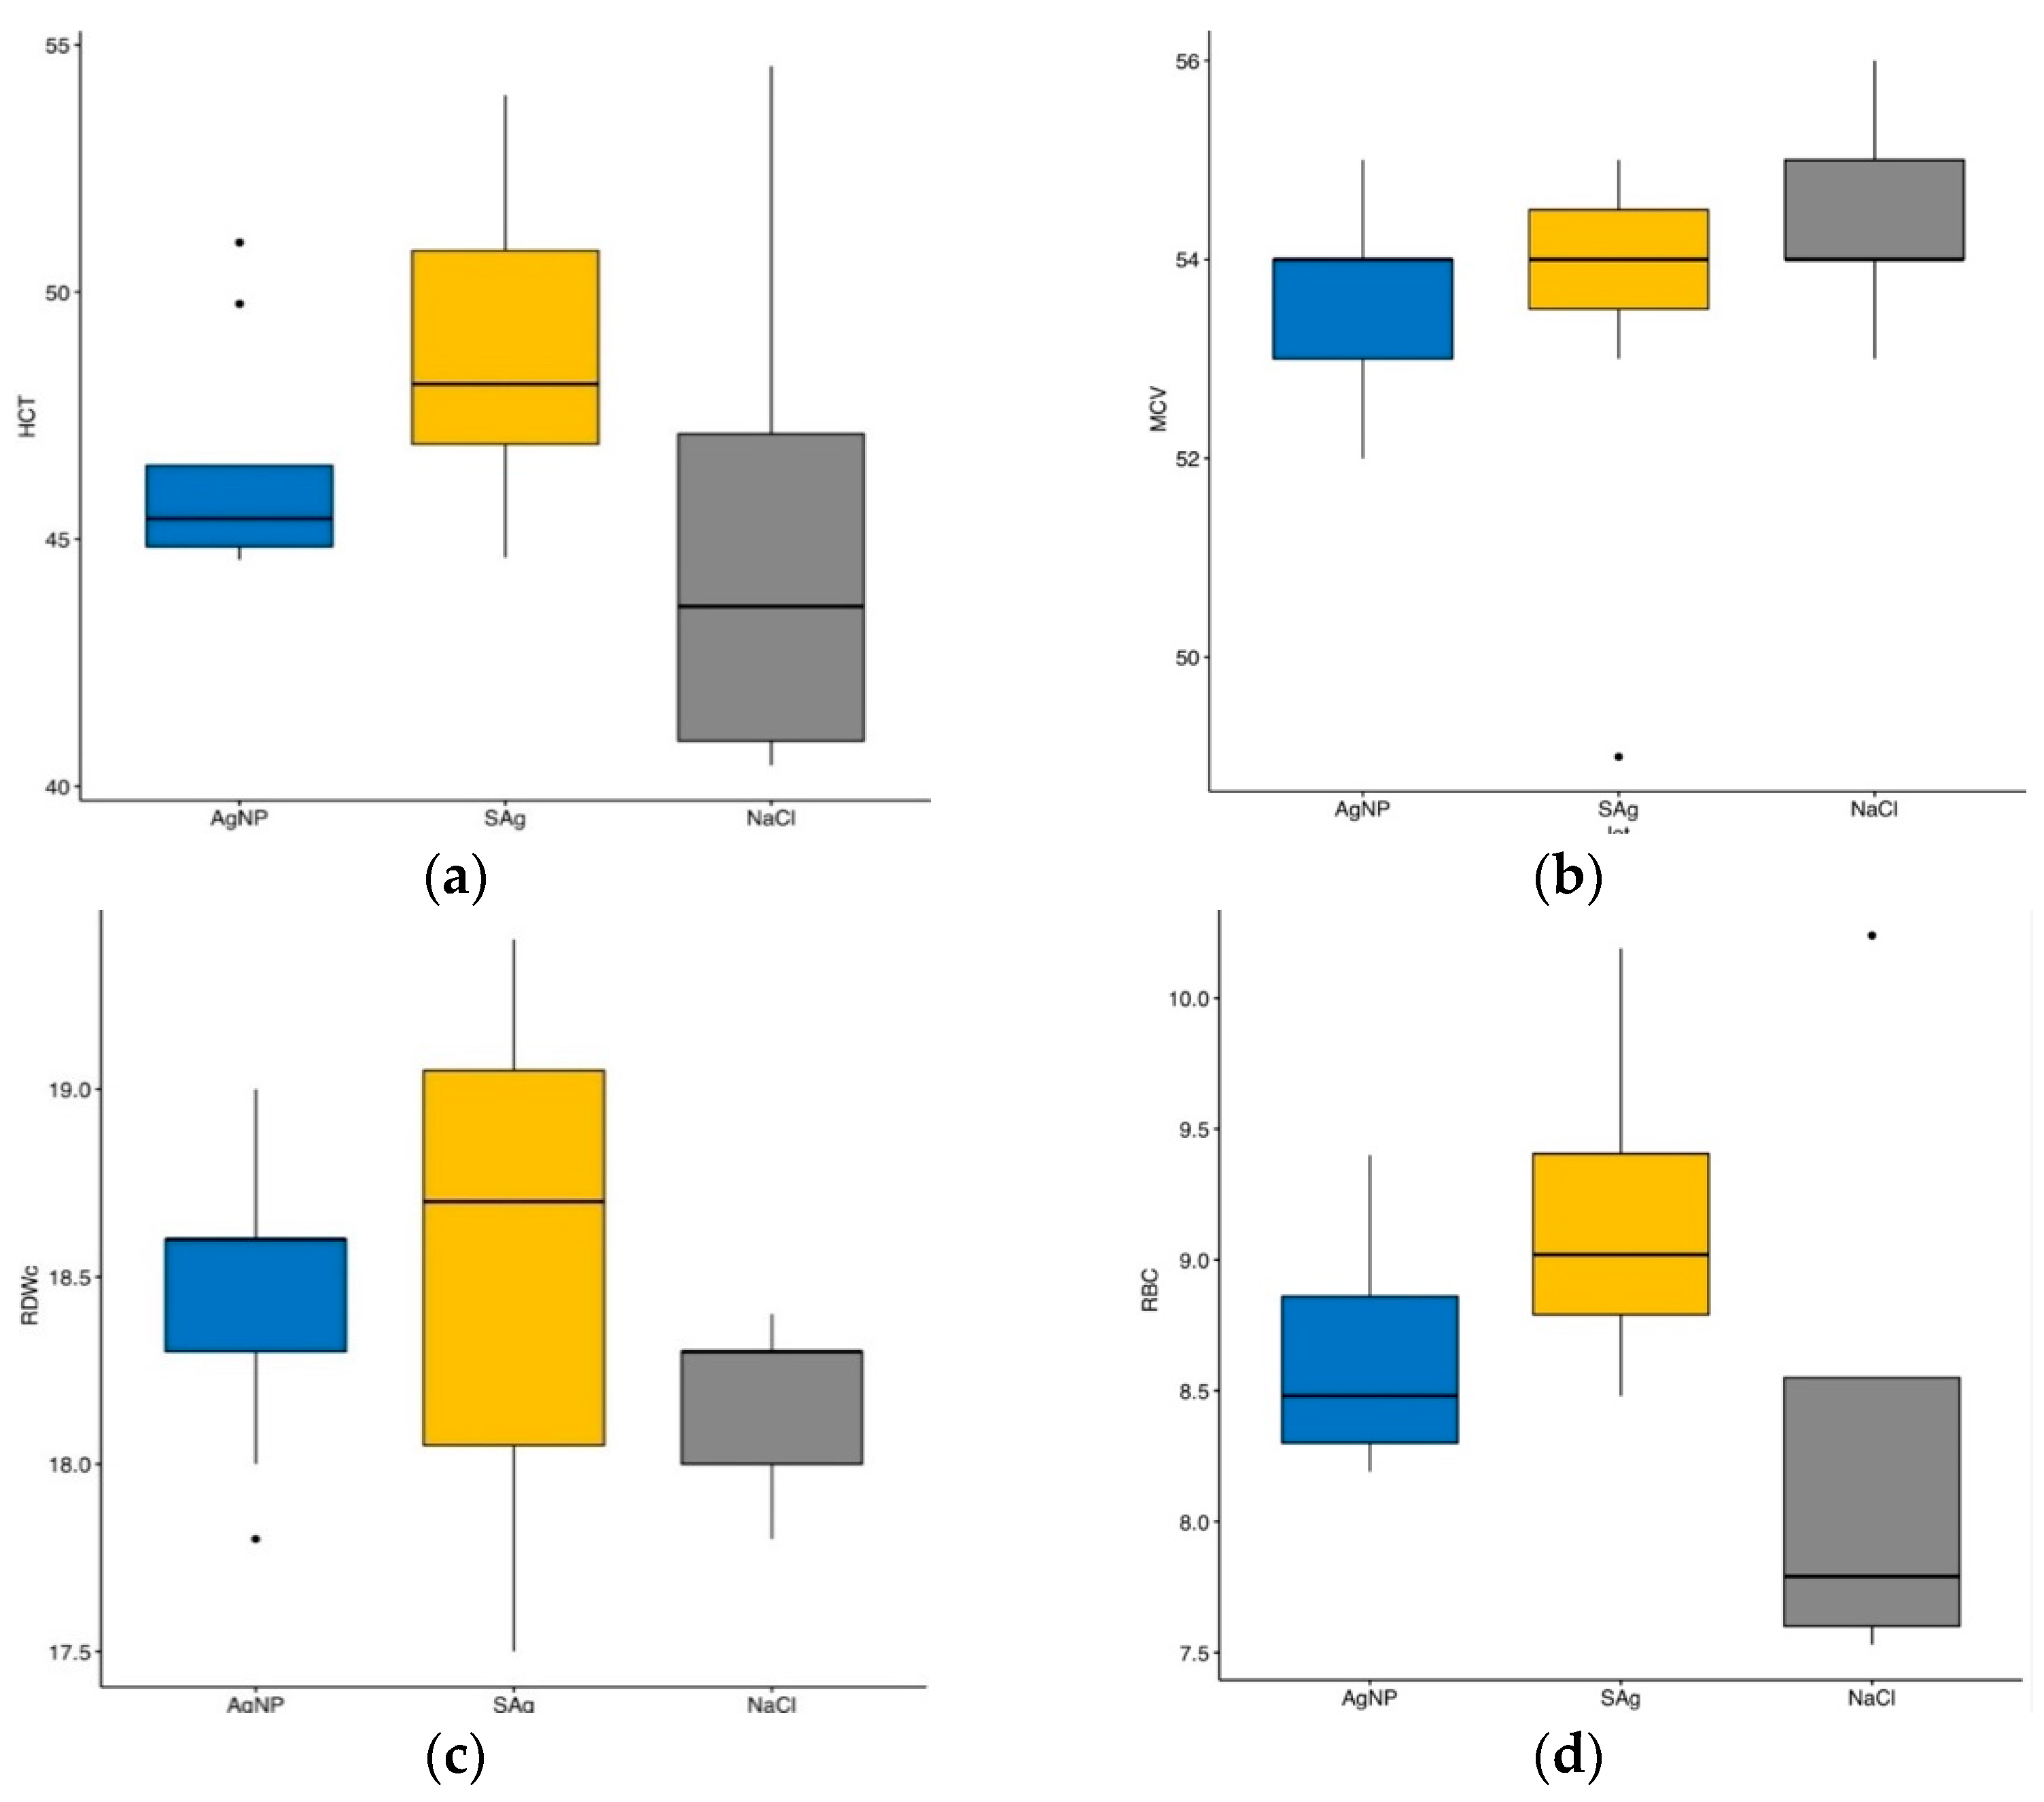
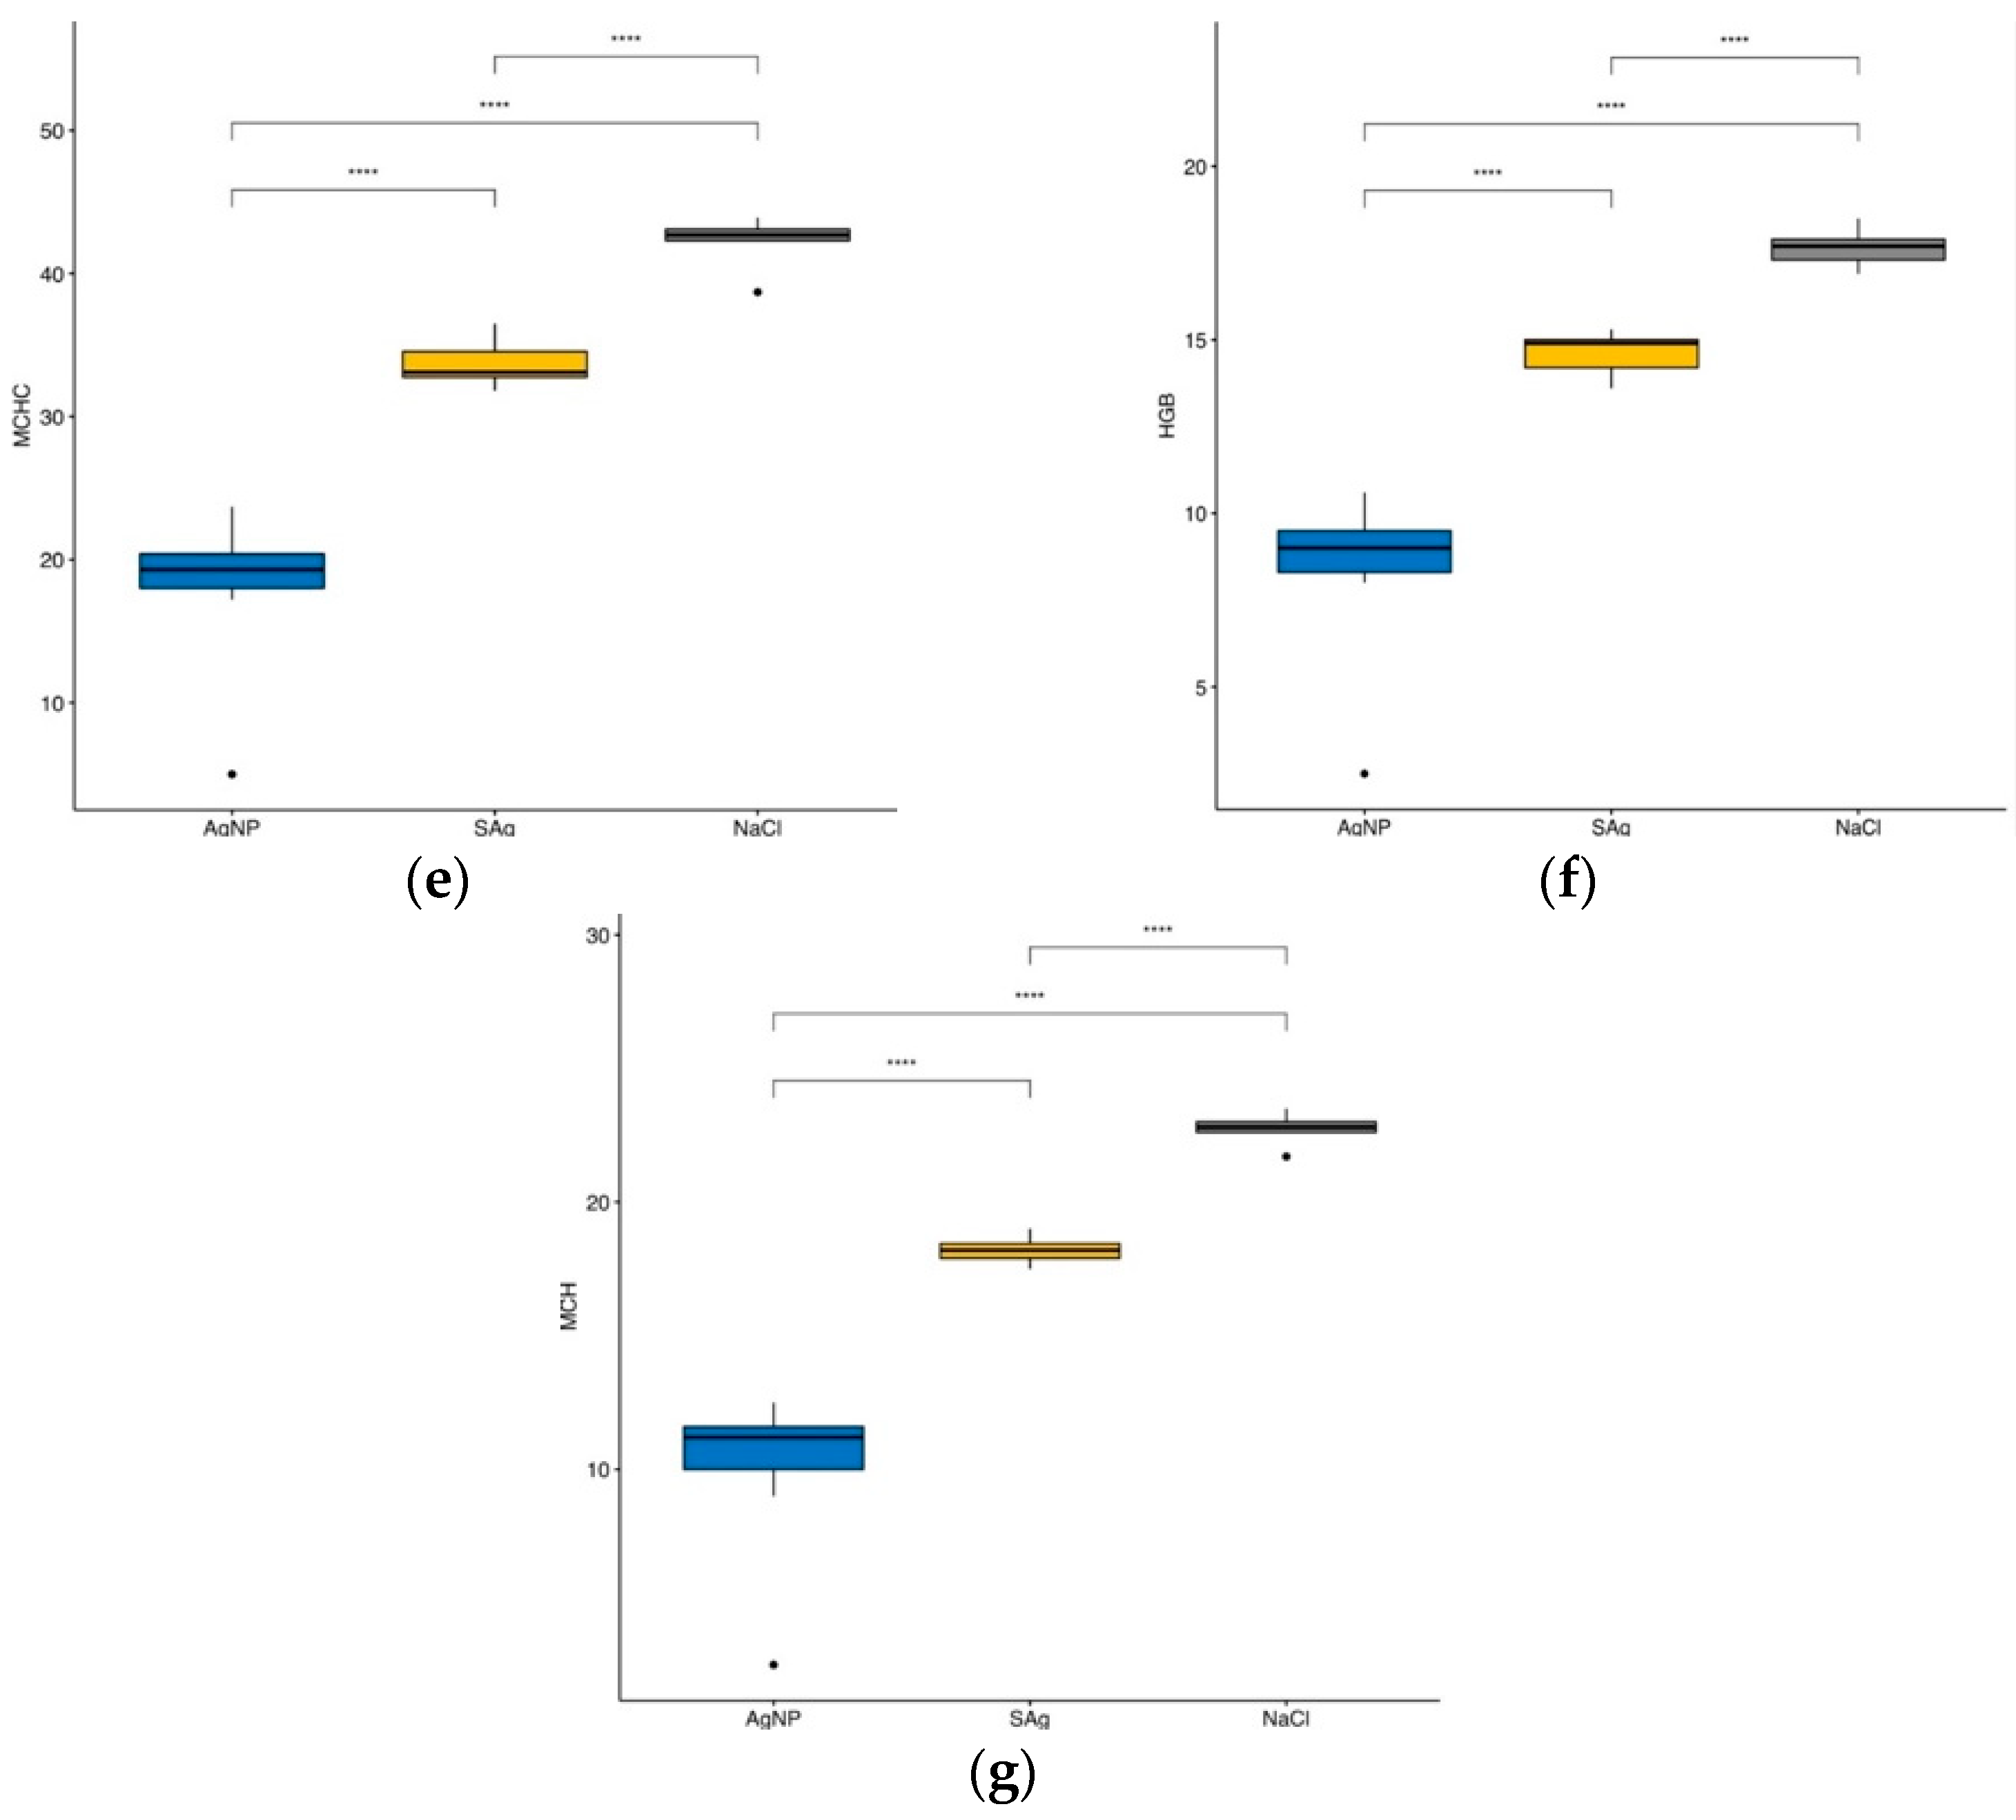
At the completion of the burn model experiment, blood samples were collected from the three examined groups of animals. The following hematological parameters were determined: erythrocyte count (RBC), erythrocyte indices—mean erythrocyte volume (MCV), mean erythrocyte hemoglobin (MCH), mean erythrocyte hemoglobin concentration (MCHC), erythrocyte distribution (RDW), hemoglobin (HGB), hematocrit (HCT), leukocyte count (WBC), leukocyte formula—lymphocyte (LY), monocyte (MI), granulocyte (GR), platelet count (PLT), platelet indices—mean platelet volume (MPV), platelet count (PCT), platelet distribution (PDW). Using the Abacus Junior hematological multianalyzer and specific reagents from Diatron, determinations were performed.
We compared each hematological parameter between the three groups: SAg, NaCl, and AgNp. For the statistical analysis, the means of the three groups were compared. Using the Shapiro-Wilk test and the Levene test for equality of dispersion, the normality of the data-related hypotheses was examined.
If the hypotheses were to be confirmed, the parametric one-factor ANOVA and post-hoc tests were used to identify significant differences, otherwise, the non-parametric Kruskal-Wallis test, followed by the non-parametric post-hoc Wilcoxon test were used. The chosen significance level was 5%.

6.3. Results

The results are shown in Table 8, Table 9 and Table 10 and Figure 15, Figure 16 and Figure 17.
Figure 15 shows that neither the platelet values nor the platelet index values of the three groups of animals in the experiment are statistically different.
In Figure 16a it can be observed that, regarding the percentage of granulocytes in the leukocyte formula, there are statistically significant differences between the groups of animals treated with silver nanoparticles and silver sulfadiazine (p < 0.001), as well as between the control group and the group of animals treated with silver sulfadiazine (p < 0.01).
Comparing the percentage of monocytes in the leukocyte formula among the three groups of animals, we observed statistically significant differences between the AgNp-treated group and the control group (p = 0.038) (Figure 16b). There are statistically significant differences in the number of leukocytes between the group of AgNp-treated animals and the control group (p < 0.01) (Figure 16c).
Figure 16d indicates statistically significant differences (p < 0.001) between the percentages of lymphocytes within the leukocyte formula of the animals in the reference and AgNp groups, as well as between the animals in the control and AgNp groups (p < 0.05).
For the MCHC index, there are statistically significant differences between the animals treated with AgNp and the animals in the reference group (p < 0.0001), as well as between the animals in the control group and the animals treated with AgNp (p < 0.0001). We can also observe statistically significant differences between the reference group and the control group animals (p < 0.0001) (Figure 17e).
Similar to the MCHC index, there are statistically significant differences in hemoglobin values (Figure 17f) between the AgNp-treated animals and the animals in the reference group (p < 0.0001), the AgNp-treated animals and the animals in the control group (p < 0.0001), and between the animals in the control group and the animals in the reference group (p < 0.0001).
In the case of MCH (Figure 17g), there are statistically significant major differences between the AgNp-treated animals and the animals in the control group (p < 0.0001) and between the animals in the control group and the animals in the reference group (p < 0.0001) There are no statistically significant differences between the erythrocyte parameters HCT, MCV, RDWc, and RBC.

6.4. Discussion

Changes in the hematological parameters were calculated as a percentage. Significant variations were observed for leukocytes. The leukocyte count was 10.38% lower in the reference group compared to the control group, and 29% higher in the test group compared to the control group. Compared to the reference group, the white blood cell count is 40.57% higher in the test group.
The percentage of lymphocytes is 13% lower for the test group compared to both the control and reference groups.
The percentage of granulocytes in the leukocyte formula is 23% higher in the AgNp group compared to the control group, and 20% higher compared to the reference group.

7. Discussion

Nanotechnology is a rapidly developing field that examines materials and interactions at the atomic and molecular levels, with dimensions ranging from 0.1 to 100 nm. The nanoparticles’ reduced size and changes in the physical and chemical characteristics, as compared to their macromolecular equivalents, provide several possibilities for modern medicine [51]. Metallic silver, silver nitrate, and silver sulfadiazine have all been used for centuries to treat burns, wounds, and a variety of bacterial infections, albeit their use has waned significantly since the development of effective antibiotics [52]. The prevalence of multidrug-resistant bacteria is increasing in hospitals and in the general population. In this way, antibiotic resistance is a major public health concern [53] because it raises the risk of death and illness from the most common types of bacterial infections [54]. The misuse of antibiotics has been linked to the development of resistance genes [55], hence cutting back on antibiotic use is an important first step in combating resistance [56]. Newly found antibiotic resistance [57] highlights the need to address the root cause of this problem, which is the widespread misuse of antibiotics. Non-traditional antimicrobials are of major interest since alternative therapies are essential in the modern environment.
In this study, we synthesized silver nanoparticles with sizes below 10 nm. Physico-chemical studies confirmed the following:
  • the size of the nanoparticles in suspension was 9.49 nm;
  • the AgNp suspension was exceptionally stable;
  • the Ag concentration in the suspension was 0.103 mg/mL.
During the acute toxicity studies in laboratory animals, no lethal events were observed at any dose. During the first eight hours after administration of the AgNp suspension, the animals did not show significant motor, vegetative, or behavioral disturbances.
Body weight dynamics showed an upward trend towards the end of the experiment, because AgNp altered the feeding behavior of the animals, and the percentage change in body weight was dose-dependent:
  • the linear metabolic variations were recorded for Group I (0.00103 mg of Ag per gram of body weight, R2 = 0.9215) and Group II (0.001545 mg of Ag per gram of body weight, R2 = 0.9818); it can be stated that the dose administered to Group II of mice resulted in a uniform increase in the body mass of the animals
  • in Group III, which was administered 0.00206 mg of Ag per gram of body weight, the variation was biphasic: on days 1 and 2 of the experiment there was a sharp decrease, but on days 3 to 14, a linear increase (R2 = 0.9838) was observed
The results obtained in this study demonstrate, for the first time, the pharmacokinetic profile of the AgNp administered to the males of two species, both rodents. Tmax, T1/2, MRT (mean residence time), and Lz (terminal elimination rate constant) showed similar values in the two rodent species. Plasma concentration (Cmax) differed significantly between species (p < 0.01), with a twofold difference in rats compared to mice. In terms of clearance efficiency, clearance values differ significantly between the two species (p < 0.05), being six times higher in rats. The volume of the distribution also varies between the species investigated, being significantly lower in the small animal group (p < 0.00001). It can be stated then that the level of plasma AgNp concentration, their clearance efficiency, and their distribution in the body are significantly increased in large rodent species.
Following topical administration of AgNp in an experimental model of induced burns in rats, the healing effect of the tested suspension was progressive, with a decreasing evolution of the mean diameter of the animal lesions.
Silver nanoparticles possess a large number of adaptable properties, which endorse them for a broad range of applications in biomedical research and related fields. Numerous in vitro and in vivo tests have been conducted on AgNp for the purpose of providing information about their toxicity toward certain living organs and tissues [48,49,58,59].
Determinations of hematological parameters showed a statistically significant increase in granulocytes (p < 0.001) in the AgNp group compared to the SAg group (more than 20% in percentage change). This same pattern was observed for leukocytes, which were 40% higher in the AgNp group compared to the SAg group (p < 0.01), which means that there is an intense activation of the cellular and molecular mechanisms of local immune defense, resulting in the more rapid healing seen in the AgNp group.

8. Conclusions

In the current scenario, when microbes have evolved resistance to the vast majority of antimicrobial medications, it is still vital to search for strategies to synthesize novel compounds to address this issue. Antibiotic resistance is becoming a worrisome public health issue, and as a result of the COVID-19 pandemic, it has become increasingly prevalent, resulting in many fatalities due to the ineffectiveness of antimicrobials. The nanotechnology-based production of silver nanoparticles is a topic of considerable importance with several therapeutic applications. In this study, we were able to synthesize and analyze a suspension of silver nanoparticles with an average crystallite size of 9.49 nm. Furthermore, using ICP-MS analysis, we established that the suspension’s silver concentration was 0.103 mg/mL. We evaluated the acute toxicity of the nanoparticle suspension that was produced after a single oral dosage, since recent research demonstrated that silver molecules might have potentially hazardous consequences. Based on the obtained results, an intense stimulation of the cellular and molecular processes of the local immune defense was observed, which resulted in significantly faster regeneration in the AgNp-treated group. Therefore, we may conclude that the development of pharmaceutical forms containing silver nanoparticles might be a new method with very successful performance for the treatment of many skin conditions, therefore replacing conventional antimicrobials.

Author Contributions

Authors with equal contribution with the first author: B.Ș.V., A.L.A. and P.C.C.; M.I.I., A.I.A., R.E.L., I.M.M., M.-M.A., E.I.B., O.A.N., T.F., R.C.F., F.B., C.Ț., I.F., D.I.U., M.G. and D.D. have made an equally important contribution to this paper. All authors have read and agreed to the published version of the manuscript.

Funding

This paper was financially supported by “Carol Davila” University of Medicine and Pharmacy Bucharest, Romania through Contract no. 33PFE/30.12.2021 funded by the Ministry of Research and Innovation within PNCDI III, Program 1—Development of the National RD system, Subprogram 1.2—Institutional Performance—RDI excellence funding projects.

Institutional Review Board Statement

The studies presented in this article have been approved by the Institutional Ethics Committee of the University of Medicine and Pharmacy “Carol Davila” Bucharest. The experiments were conducted in accordance with the Directive 63/2010/EU of the European Parliament and of the Council of Europe of 22 September 2010 on the protection of animals used for scientific purposes, as well as in accordance with Law no. 43/2014 on the protection of animals used for scientific purposes, amended by Law no. 199 of 20 July 2018.

Informed Consent Statement

Not applicable.

Data Availability Statement

Not applicable.

Acknowledgments

T.F., R.C.F. and I.F. also gratefully acknowledges the support of the Ministry of Research, Innovation and Digitization, CCCDI—UEFISCDI, project number PN-III-P4-PCE-2021-0292, within PNCDI III.

Conflicts of Interest

The authors declare no conflict of interest.

References

  1. Almatroudi, A. Silver nanoparticles: Synthesis, characterisation and biomedical applications. Open Life Sci. 2020, 15, 819–839. [Google Scholar] [CrossRef] [PubMed]
  2. Barua, S.; Mitragotri, S. Challenges associated with penetration of nanoparticles across cell and tissue barriers: A review of current status and future prospects. Nano Today 2014, 9, 223–243. [Google Scholar] [CrossRef] [PubMed] [Green Version]
  3. Skomorokhova, E.A.; Sankova, T.P.; Orlov, I.A.; Savelev, A.N.; Magazenkova, D.N.; Pliss, M.G.; Skvortsov, A.N.; Sosnin, I.M.; Kirilenko, D.A.; Grishchuk, I.V.; et al. Size-Dependent Bioactivity of Silver Nanoparticles: Antibacterial Properties, Influence on Copper Status in Mice, and Whole-Body Turnover. Nanotechnol. Sci. Appl. 2020, 13, 137–157. [Google Scholar] [CrossRef] [PubMed]
  4. Sabbagh, F.; Kiarostami, K.; Mahmoudi Khatir, N.; Rezania, S.; Muhamad, I.I. Green synthesis of Mg0.99 Zn0.01O nanoparticles for the fabrication of κ-Carrageenan/NaCMC hydrogel in order to deliver catechin. Polymers 2020, 12, 861. [Google Scholar] [CrossRef] [Green Version]
  5. World Health Organization (WHO). 2020 Antibacterial Agents in Clinical and Preclinical Development: An Overview and Analysis. Available online: https://www.who.int/publications/i/item/9789240021303 (accessed on 8 March 2023).
  6. Mulani, M.S.; Kamble, E.E.; Kumkar, S.N.; Tawre, M.S.; Pardesi, K.R. Emerging Strategies to Combat ESKAPE Pathogens in the Era of Antimicrobial Resistance: A Review. Front. Microbiol. 2019, 10, 539. [Google Scholar] [CrossRef]
  7. Bloukh, S.H.; Edis, Z.; Shaikh, A.A.; Pathan, H.M. A Look Behind the Scenes at COVID-19: National Strategies of Infection Control and Their Impact on Mortality. Int. J. Environ. Res. Public Health 2020, 17, 5616. [Google Scholar] [CrossRef]
  8. Munita, J.M.; Arias, C.A. Mechanisms of Antibiotic Resistance. Microbiol. Spectr. 2016, 4, 34. [Google Scholar] [CrossRef] [Green Version]
  9. Rabiee, N.; Ahmadi, S.; Fatahi, Y.; Rabiee, M.; Bagherzadeh, M.; Dinarvand, R.; Bagheri, B.; Zarrintaj, P.; Saeb, M.R.; Webster, T.J. Nanotechnology-assisted microfluidic systems: From bench to bedside. Nanomedicine 2020, 16, 237–258. [Google Scholar] [CrossRef]
  10. Eleraky, N.E.; Allam, A.; Hassan, S.B.; Omar, M.M. Nanomedicine Fight against Antibacterial Resistance: An Overview of the Recent Pharmaceutical Innovations. Pharmaceutics 2020, 12, 142. [Google Scholar] [CrossRef] [Green Version]
  11. Kędziora, A.; Speruda, M.; Krzyżewska, E.; Rybka, J.; Łukowiak, A.; Bugla-Płoskońska, G. Similarities and Differences between Silver Ions and Silver in Nanoforms as Antibacterial Agents. Int. J. Mol. Sci. 2018, 19, 444. [Google Scholar] [CrossRef] [Green Version]
  12. Hamed, S.M.; Mostafa, A.M.A.; Abdel-Raouf, N.; Ibraheem, I.B.M. Biosynthesis of silver and silver chloride nanoparticles by Parachlorella kessleri SAG 211-11 and evaluation of its nematicidal potential against the root-knot nematode; Meloidogyne incognita. Aust. J. Basic Appl. Sci. 2016, 10, 354–364. [Google Scholar]
  13. Gudkov, S.V.; Serov, D.A.; Astashev, M.E.; Semenova, A.A.; Lisitsyn, A.B. Ag2O Nanoparticles as a Candidate for Antimicrobial Compounds of the New Generation. Pharmaceuticals 2022, 15, 968. [Google Scholar] [CrossRef] [PubMed]
  14. Sullivan, K.T.; Wu, C.; Piekiel, N.W.; Gaskell, K.; Zachariah, M.R. Synthesis and reactivity of nano-Ag2O as an oxidizer for energetic systems yielding antimicrobial products. Combust. Flame 2013, 160, 438–446. [Google Scholar] [CrossRef]
  15. Bruskov, V.I.; Karp, O.E.; Garmash, S.A.; Shtarkman, I.N.; Chernikov, A.V.; Gudkov, S.V. Prolongation of oxidative stress by long-lived reactive protein species induced by X-ray radiation and their genotoxic action. Free. Radic. Res. 2012, 46, 1280–1290. [Google Scholar] [CrossRef] [PubMed]
  16. Gomaa, E.Z. Silver nanoparticles as an antimicrobial agent: A case study on Staphylococcus aureus and Escherichia coli as models for Gram-positive and Gram-negative bacteria. J. Gen. Appl. Microbiol. 2017, 63, 36–43. [Google Scholar] [CrossRef] [Green Version]
  17. Ocsoy, I.; Paret, M.L.; Ocsoy, M.A.; Kunwar, S.; Chen, T.; You, M.; Tan, W. Nanotechnology in Plant Disease Management: DNA-Directed Silver Nanoparticles on Graphene Oxide as an Antibacterial against Xanthomonas perforans. ACS Nano 2013, 7, 8972–8980. [Google Scholar] [CrossRef] [Green Version]
  18. Allahverdiyev, A.M.; Abamor, E.S.; Bagirova, M.; Rafailovich, M. Antimicrobial effects of TiO2 and Ag2O nanoparticles against drug-resistant bacteria and leishmania parasites. Future Microbiol. 2011, 6, 933–940. [Google Scholar] [CrossRef]
  19. El-Kahky, D.; Attia, M.; Easa, S.M.; Awad, N.M.; Helmy, E.A. Interactive Effects of Biosynthesized Nanocomposites and Their Antimicrobial and Cytotoxic Potentials. Nanomaterials 2021, 11, 903. [Google Scholar] [CrossRef]
  20. Fanoro, O.T.; Oluwafemi, O.S. Bactericidal Antibacterial Mechanism of Plant Synthesized Silver, Gold and Bimetallic Nanoparticles. Pharmaceutics 2020, 12, 1044. [Google Scholar] [CrossRef]
  21. Gurunathan, S.; Kalishwaralal, K.; Vaidyanathan, R.; Venkataraman, D.; Pandian, S.R.K.; Muniyandi, J.; Hariharan, N.; Eom, S.H. Biosynthesis, purification and characterization of silver nanoparticles using Escherichia coli. Colloids Surf. B Biointerfaces 2009, 74, 328–335. [Google Scholar] [CrossRef]
  22. Mavani, K.; Shah, M. Synthesis of Silver Nanoparticles by using Sodium Borohydride as a Reducing Agent. international J. Eng. Res. Technol. 2013, 2, 8648. [Google Scholar] [CrossRef]
  23. Turkevich, J.; Stevenson, P.C.; Hillier, J. A study of the nucleation and growth processes in the synthesis of colloidal gold. Discuss. Faraday Soc. 1951, 11, 55–75. [Google Scholar] [CrossRef]
  24. Ratyakshi, R.P. Chauhan, Colloidal Synthesis of Silver Nano Particles. Asian J. Chem. 2009, 21, 113–116. [Google Scholar]
  25. Fierascu, I.; Fierascu, R.C.; Somoghi, R.; Ion, R.M.; Moanta, A.; Avramescu, S.M. Tuned apatitic materials: Synthesis, characterization and potential antimicrobial applications. Appl. Surf. Sci. 2018, 438, 127–135. [Google Scholar] [CrossRef]
  26. Güzel, R.; Erdal, G. Synthesis of Silver Nanoparticles; InTech: London, UK, 2018. [Google Scholar]
  27. Fierascu, I.B.I.R.; Fierascu, R.C.; Ion, R.M.; Dinu-Pirvu, C.E.; Nuta, D. Characterization and antioxidant activity of phytosynthesised silver nanoparticles using Calendula officinalis extract. Farmacia 2014, 62, 129–136. [Google Scholar]
  28. Fierascu, R.C.; Fierascu, I.; Lungulescu, E.M.; Nicula, N.; Somoghi, R.; Diţu, L.M.; Ungureanu, C.; Sutan, A.N.; Drăghiceanu, O.A.; Paunescu, A.; et al. Phytosynthesis and radiation-assisted methods for obtaining metal nanoparticles. J. Mater. Sci. 2020, 55, 1915–1932. [Google Scholar] [CrossRef]
  29. Faqi, A.S. Chapter 1—Introduction. In A Comprehensive Guide to Toxicology in Preclinical Drug Development; Faqi, A.S., Ed.; Academic Press: Cambridge, MA, USA, 2013; pp. 1–2. [Google Scholar]
  30. Hyung-Gun, K.; Yoon-Gyoon, K.; Aryal, B.; Tae-Hyun, K. A comparative study of the pharmacokinetics of traditional and automated dosing/blood sampling systems using gabapentin. Indian J. Pharmacol. 2011, 43, 262–269. [Google Scholar] [CrossRef] [Green Version]
  31. Mathur, P.; Jha, S.; Ramteke, S.; Jain, N.K. Pharmaceutical aspects of silver nanoparticles. Artif. Cells Nanomed. Biotechnol. 2018, 46 (Suppl. S1), 115–126. [Google Scholar] [CrossRef] [Green Version]
  32. Alalaiwe, A. The clinical pharmacokinetics impact of medical nanometals on drug delivery system. Nanomed. Nanotechnol. Biol. Med. 2019, 17, 47–61. [Google Scholar] [CrossRef]
  33. Van der Zande, M.; Vandebriel, R.J.; Van Doren, E.; Kramer, E.; Rivera, Z.H.; Serrano-Rojero, C.S.; Gremmer, E.R.; Mast, J.; Peters, R.J.B.; Hollman, P.C.H.; et al. Distribution, Elimination, and Toxicity of Silver Nanoparticles and Silver Ions in Rats after 28-Day Oral Exposure. ACS Nano 2012, 6, 7427–7442. [Google Scholar] [CrossRef]
  34. Munger, M.A.; Hadlock, G.; Stoddard, G.; Slawson, M.H.; Wilkins, D.G.; Cox, N.; Rollins, D. Assessing orally bioavailable commercial silver nanoparticle product on human cytochrome P450 enzyme activity. Nanotoxicology 2014, 9, 474–481. [Google Scholar] [CrossRef] [PubMed]
  35. Alkilany, A.M.; Murphy, C.J. Toxicity and cellular uptake of gold nanoparticles: What we have learned so far? J. Nanoparticle Res. 2010, 12, 2313–2333. [Google Scholar] [CrossRef] [Green Version]
  36. Lin, Z.; Monteiro ÄêRiviere, N.A.; Riviere, J.E. Pharmacokinetics of metallic nanoparticles. Wiley Interdisci-Plinary Rev. Nanomed. Nanobiotechnol. 2015, 7, 189–217. [Google Scholar] [CrossRef] [PubMed]
  37. Lee, Y.; Kim, P.; Yoon, J.; Lee, B.; Choi, K.; Kil, K.-H.; Park, K. Serum kinetics, distribution and excretion of silver in rabbits following 28 days after a single intravenous injection of silver nanoparticles. Nanotoxicology 2012, 7, 1120–1130. [Google Scholar] [CrossRef] [PubMed]
  38. Xue, Y.; Zhang, S.; Huang, Y.; Zhang, T.; Liu, X.; Hu, Y. Acute toxic effects and gender-related biokinetics of silver nano-particles following an intravenous injection in mice. J. Appl. Toxicol. 2012, 32, 890–899. [Google Scholar] [CrossRef] [PubMed]
  39. Boudreau, M.D.; Imam, M.S.; Paredes, A.M.; Bryant, M.S.; Cunningham, C.K.; Felton, R.P.; Jones, M.Y.; Davis, K.J.; Olson, G.R. Differential Effects of Silver Nanoparticles and Silver Ions on Tissue Accumulation, Distribution, and Toxicity in the Sprague Dawley Rat Following Daily Oral Gavage Administration for 13 Weeks. Toxicol. Sci. 2016, 150, 131–160. [Google Scholar] [CrossRef] [Green Version]
  40. Shankar, S.; Chorachoo, J.; Jaiswal, L.; Voravuthikunchai, S.P. Effect of reducing agent concentrations and temperature on characteristics and antimicrobial activity of silver nanoparticles. Mater. Lett. 2014, 137, 160–163. [Google Scholar] [CrossRef]
  41. Percival, S.; Bowler, P.; Russell, D. Bacterial resistance to silver in wound care. J. Hosp. Infect. 2005, 60, 1–7. [Google Scholar] [CrossRef]
  42. Jiang, H.; Manolache, S.; Wong, A.C.L.; Denes, F.S. Plasma-enhanced deposition of silver nanoparticles onto polymer and metal surfaces for the generation of antimicrobial characteristics. J. Appl. Polym. Sci. 2004, 93, 1411–1422. [Google Scholar] [CrossRef]
  43. Farooqui, M.D.A.; Chauhan, P.S.; Krishnamoorthy, P.; Shaik, J. Extraction of silver nanoparticles from the left extracts of Clerodendrum incerme. Dig. J. Nanomater Biostruct. 2010, 5, 43–49. [Google Scholar]
  44. Ip, M.; Lui, S.L.; Poon, V.K.M.; Lung, I.; Burd, A. Antimicrobial activities of silver dressings: An in vitro comparison. J. Med. Microbiol. 2006, 55, 59–63. [Google Scholar] [CrossRef] [PubMed] [Green Version]
  45. Kulthong, K.; Srisung, S.; Boonpavanitchakul, K.; Kangwansupamonkon, W.; Maniratanachote, R. Determination of silver nanoparticle release from antibacterial fabrics into artificial sweat. Part Fibre Toxicol. 2010, 7, 8. [Google Scholar] [CrossRef] [Green Version]
  46. Khan, M.A.M.; Kumar, S.; Ahamed, M.; Alrokayan, S.; AlSalhi, M.S. Structural and thermal studies of silver nanoparticles and electrical transport study of their thin films. Nanoscale Res. Lett. 2011, 6, 434. [Google Scholar] [CrossRef] [PubMed] [Green Version]
  47. Espinosa-Cristobal, L.F.; Martinez-Castañon, G.A.; Loyola-Rodriguez, J.P.; Patiño-Marin, N.; Reyes-Macías, J.F.; Vargas-Morales, J.M.; Ruiz, F. Toxicity, distribution, and accumulation of silver nanoparticles in Wistar rats. J. Nanoparticle Res. 2013, 15, 1702. [Google Scholar] [CrossRef]
  48. Kim, Y.S.; Kim, J.S.; Cho, H.S.; Rha, D.S.; Kim, J.M.; Park, J.D.; Choi, B.S.; Lim, R.; Chang, H.K.; Chung, Y.H.; et al. Twenty-eight-day oral toxicity, genotoxicity, and gender-related tissue distribution of silver nanoparticles in Sprague-Dawley rats. Inhal. Toxicol. 2008, 20, 575–583. [Google Scholar] [CrossRef]
  49. Heydrnejad, M.S.; Samani, R.J.; Aghaeivanda, S. Toxic Effects of Silver Nanoparticles on Liver and Some Hematological Parameters in Male and Female Mice (Mus musculus). Biol. Trace Element Res. 2015, 165, 153–158. [Google Scholar] [CrossRef]
  50. Wen, H.; Dan, M.; Yang, Y.; Lyu, J.; Shao, A.; Cheng, X.; Chen, L.; Xu, L. Acute toxicity and genotoxicity of silver nanoparticle in rats. PLoS ONE 2017, 12, e0185554. [Google Scholar] [CrossRef] [Green Version]
  51. Nikolova, M.; Slavchov, R. Nanotechnology in Medicine. In Drug Discovery and Evaluation: Methods in Clinical Pharmacology; Hock, F., Gralinski, M., Eds.; Springer: Cham, Switzerland, 2020; pp. 533–546. [Google Scholar] [CrossRef]
  52. Rai, M.; Yadav, A.; Gade, A. Silver nanoparticles as a new generation of antimicrobials. Biotechnol. Adv. 2009, 27, 76–83. [Google Scholar] [CrossRef]
  53. Klevens, R.M.; Morrison, M.A.; Nadle, J.; Petit, S.; Gershman, K.; Ray, S.; Harrison, L.H.; Lynfield, R.; Dumyati, G.; Townes, J.M.; et al. Invasive methicillin-resistant Staphylococcus aureus infections in the United States. JAMA 2007, 298, 1763–1771. [Google Scholar] [CrossRef] [Green Version]
  54. Walker, B.; Barrett, S.; Polasky, S.; Galaz, V.; Folke, C.; Engström, G.; Ackerman, F.; Arrow, K.; Carpenter, S.; Chopra, K.; et al. Looming global-scale failures and missing institutions. Science 2009, 325, 1345–1346. [Google Scholar] [CrossRef]
  55. D’Costa, V.M.; King, C.E.; Kalan, L.; Morar, M.; Sung, W.W.L.; Schwarz, C.; Froese, D.; Zazula, G.; Calmels, F.; Debruyne, R.; et al. Antibiotic resistance is ancient. Nature 2011, 477, 457–461. [Google Scholar] [CrossRef] [PubMed]
  56. Seppälä, H.; Klaukka, T.; Vuopio-Varkila, J.; Muotiala, A.; Helenius, H.; Lager, K.; Huovinen, P. The effect of changes in the consumption of macrolide antibiotics on erythromycin resistance in group A streptococci in Finland. N. Engl. J. Med. 1997, 337, 441–446. [Google Scholar] [CrossRef] [PubMed]
  57. Long, K.S.; Vester, B. Resistance to linezolid caused by modifications at its binding site on the ribosome. Antimicrob. Agents Chemother. 2012, 56, 603–612. [Google Scholar] [CrossRef] [PubMed] [Green Version]
  58. Imani, M.; Halimi, M.; Khara, H. Effects of silver nanoparticles (AgNPs) on hematological parameters of rainbow trout, Oncorhynchus mykiss. Comp. Clin. Pathol. 2014, 24, 491–495. [Google Scholar] [CrossRef]
  59. Qin, G.; Tang, S.; Li, S.; Lu, H.; Wang, Y.; Zhao, P.; Li, B.; Zhang, J.; Peng, L. Toxicological evaluation of silver nanoparticles and silver nitrate in rats following 28 days of repeated oral exposure. Environ. Toxicol. 2016, 32, 609–618. [Google Scholar] [CrossRef]
Figure 1. UV-Vis spectrum of AgNp.
Processes 11 01212 g001
Figure 2. XRD diffractogram of AgNp suspension.
Processes 11 01212 g002
Figure 3. Synthesized silver nanoparticles observed by Transmission Electron Microscope.
Processes 11 01212 g003
Figure 4. The average percentage variation in daily body weight of animals in Group I (expressed as a percentage and considering the average weights determined for each group over 14 days).
Processes 11 01212 g004
Figure 5. The average percentage variation in daily body weight of animals in Group II (expressed as a percentage and considering the average weights determined for each group over 14 days).
Processes 11 01212 g005
Figure 6. The average percentage variation in daily body weight of animals in Group III (expressed as a percentage and considering the average weights determined for each group over 14 days).
Processes 11 01212 g006
Figure 7. The increased trend of the average percentage variance in the daily body weight of animals in Group III (expressed as a percentage and considering the average weights determined for each group from day 3 to day 14).
Processes 11 01212 g007
Figure 8. The comparative average percentage variation of the daily body weight of the animals in the three groups (expressed as a percentage and considering the average weights determined for each group over 14 days).
Processes 11 01212 g008
Figure 9. The comparative average percentage variation of the daily body weight of the animals in the three groups (expressed as a percentage and considering the average weights determined for each group over 14 days).
Processes 11 01212 g009
Figure 10. The evolution of Ag0 plasma concentration on mice.
Processes 11 01212 g010
Figure 11. The evolution of Ag0 plasma concentration on rats.
Processes 11 01212 g011
Figure 12. Comparative evolution of the scarring process in the case of the three groups (representative images).
Processes 11 01212 g012
Figure 13. The evolution of the average diameter of the lesions about time.
Processes 11 01212 g013
Figure 14. Effect of treatments on burn diameter versus time.
Processes 11 01212 g014
Figure 15. Variation in platelet counts and platelet indices. (a) PLT vari-ation. (b) PCT variation. (c) PDWc vari-ation. (d) MPV var-iation.
Processes 11 01212 g015
Figure 16. Leucocyte and leukocyte count variation. (a) GR variation. (b) MI variation. (c) WBC variation. (d) LY variation. Legend: *—p < 0.05; **—p < 0.01; ***—p < 0.001.
Processes 11 01212 g016
Figure 17. Erythrocyte variation and erythrocyte indices. (a) HCT variation. (b) MCV variation. (c) RDWc variation. (d) RBC variation. (e) MCHC variation. (f) HGB variation. (g) MCH variation. Legend: ****—p < 0.0001.
Processes 11 01212 g017aProcesses 11 01212 g017b
Table 1. Individual doses administered to experimental animals.
S1S2S3S4S5S6S7S8
Group I
10 μL/g
0.35 mL0.41 mL0.37 mL0.36 mL0.39 mL0.39 mL0.37 mL0.43 mL
Weight (g)34.641.136.5136.13938.536.542.6
Group II
15 μL/g
0.52 mL0.57 mL0.57 mL0.59 mL0.58 mL0.57 mL0.59 mL0.61 mL
Weight (g)3538383938.538.339.440.5
Group III
20 μL/g
0.82 mL0.7 mL0.72 mL0.7 mL0.75 mL0.73 mL0.76 mL0.78 mL
Weight (g)4135363537.536.43838.9
Table 2. Ag0 plasma concentrations dosed in blood samples of mice.
A1 (μg/L) A2 (μg/L) A3 (μg/L) A4 (μg/L) A5 (μg/L) Average ± DS (μg/L)
1 h1.1590.5680.6850.4760.8400.746 ± 0.268
2 h0.5500.7010.4140.6060.6280.580 ± 0.107
3 h0.4090.4410.5350.4160.5070.462 ± 0.056
4 h0.4410.5250.4180.5030.6270.503 ± 0.082
5 h0.6140.5890.5010.7570.8730.667 ± 0.147
6 h0.5201.0270.4480.5980.3760.594 ± 0.256
24 h1.0680.4130.3240.3890.3280.504 ± 0.317
Table 3. Ag0 plasma concentrations dosed in blood samples of rats.
B1 (μg/L)B2 (μg/L)B3 (μg/L)B4 (μg/L)B5 (μg/L)Average ± DS (μg/L)
1 h0.9330.6350.5281.6051.4451.029 ± 0.480
2 h1.0810.5360.5681.0661.6530.981 ± 0.458
3 h0.7112.0320.4853.1991.6551.616 ± 1.093
4 h1.1740.6450.4430.9901.5480.960 ± 0.436
5 h1.3240.5340.2440.8600.8880.770 ± 0.407
6 h0.8980.8940.2901.0371.3790.900 ± 0.394
24 h0.4920.5860.3030.5481.8820.762 ± 0.635
Table 4. The pharmacokinetic (pk) parameters determined for the group of mice.
Pk Parameters/MiceA1A2A3A4A5Average ± DS
Cmax (ng/mL)1.161.030.690.760.870.90 ± 0.19
Tmax (h)161553.60 ± 2.41
AUC (μg × h/mL)3.3915.469.6511.89.9510.05 ± 4.38
Lz (h−1)0.10290.03290.02070.03010.03310.043 ± 0.03
T1/2 (h)6.7421.0533.4223.0520.9421.04 ± 9.51
MRT (h)10.130.8548.9135.3931.931.43 ± 13.9
Clearance (mL/h × kg)5.61.531.511.592.382.52 ± 1.76
Vz (mL/kg)54.4446.5972.8252.7871.9459.71 ± 11.93
Vss (mL/kg)56.6147.3173.8656.1775.9861.99 ± 12.40
Legend: Cmax (ng/mL) is the maximum Ag0 plasma concentration; Tmax (h) is the time needed to reach Cmax; AUC (μg × h/mL) is the aria under the curve (drug plasma concentration * time); Lz (h−1) is the terminal elimination rate constant; T1/2 (h) is the half-time; MRT (h) is the mean residence time; Vz (mL/Kg) is the volume of distribution during the terminal phase; Vss (mL/Kg) is the volume of distribution at steady state.
Table 5. The pharmacokinetic (pk) parameters determined for the group of rats.
Pk Parameters/RatsB1B2B3B4B5Average ± DS
Cmax (ng/mL)1.3242.0320.5683.1991.6551.756 ± 0.97
Tmax (h)532333.200 ± 1.1
AUC (μg * h/mL)17.79117.8227.73921.8087.84714.601 ± 6.43
Lz (h−1)0.0440.0250.0210.0490.0990.048 ± 0.03
T1/2 (h)15.8127.3632.7114.117.0419.40 ± 10.42
MRT (h)24.5940.0448.5421.0410.8929.02 ± 15.12
Clearance (mL/h * kg)12.760.9217.9513.0521.0413.14 ± 7.66
Vz (mL/kg)290.9336.37846.82265.56213.61330.66 ± 305.18
Vss (mL/kg)313.6836.9871.04274.55229.12345.06 ± 312.66
Legend: Cmax (ng/mL) is the maximum Ag0 plasma concentration; Tmax (h) is the time needed to reach Cmax; AUC (μg * h/mL) is the aria under the curve (drug plasma concentration * time); Lz (h−1) is the terminal elimination rate constant; T1/2 (h) is the half-time; MRT (h) is the mean residence time; Vz (mL/Kg) is the volume of distribution during the terminal phase; Vss (mL/Kg) is the volume of distribution at steady state.
Table 6. Significant variations in pharmacokinetic parameters between the two species.
CmaxA (ng/mL)CmaxB (ng/mL)ClearanceA
(mL/hxkg)
ClearanceB
(mL/hxkg)
VzA (mL/kg)VzB (mL/kg)VssA (mL/kg)VssB (mL/kg)
1.161.3245.612.764.44290.936.61313.68
1.032.0321.530.926.5936.377.3136.9
0.690.5681.5117.952.82846.823.86871.04
0.763.1991.5913.052.78265.566.17274.55
0.871.6552.3821.041.94213.615.98229.12
p < 0.01p < 0.05p < 0.0001p < 0.0001
Table 7. Percentage evolution of the healing process.
AgNp (%)NaCl (%)SAg (%)
D1–D2+3.08+10.24+6.70
D2–D3−9.45−2.14−7.85
D3–D5−21.43−27.74−26.14
D5–D8−27.27−28.28−19.23
D8–D10−12.50−9.86−3.81
D10–D12−23.08−23.44−10.89
D12–D15−100.00−100.00−100.00
Table 8. Platelet and platelet index values.
GroupPLT (Cells × 103/µL)MPV (fL)PCT (%)PDWc (%)
AgNp1299.78 ± 177.207.53 ± 0.170.98 ± 0.1334.5 ± 0.54
SAg1251 ± 237.737.33 ± 0.310.92 ± 0.1835.2 ± 0.81
NaCl1131.6 ± 157.697.44 ± 0.150.84 ± 0.1034.86 ± 0.88
Table 9. Leucocytes formula.
GroupWBC (Cells × 103/µL)LY (%)MI (%)GR (%)
AgNp5.42 ± 0.9947.82 ± 1.2212.41 ± 0.9737.06 ± 1.37
SAg3.86 ± 0.4054.99 ± 3.2412.64 ± 0.6630.76 ± 1.25
NaCl4.30 ± 0.9355.1 ± 4.4614.5 ± 1.7229.9 ± 4.81
Table 10. Erythrocyte values and erythrocyte indices.
GroupRBC (Cells × 106/µL)HGB (g/dL)HCT (%)MCV (fL)RDWc (%)MCH (pg/Cells)MCHC (g/dL)
AgNp8.65 ± 0.428.39 ± 2.3446.49 ± 2.3353.78 ± 0.9718.46 ± 0.3810.14 ± 2.9818.18 ± 5.31
SAg9.15 ± 0.6014.6 ± 0.6548.89 ± 3.4653.43 ± 2.0718.54 ± 0.7018.2 ± 0.5033.71 ± 1.61
NaCl8.34 ± 1.1417.66 ± 0.6145.34 ± 5.8154.4 ± 1.1418.16 ± 0.2522.72 ± 0.6642.14 ± 2.01
Disclaimer/Publisher’s Note: The statements, opinions and data contained in all publications are solely those of the individual author(s) and contributor(s) and not of MDPI and/or the editor(s). MDPI and/or the editor(s) disclaim responsibility for any injury to people or property resulting from any ideas, methods, instructions or products referred to in the content.

