Abstract
Heat release rate (HRR) is the principal fire characteristic of materials. There are three known methods for the measurement of HRR (based on oxygen consumption, mass loss rate, and combustion products temperature rise). The method based on oxygen consumption is considered to be the reference. However, this method is expensive and for a large part of laboratories and universities unavailable. The simplest method is based on combustion products’ temperature rise. However, this method has a fundamental problem with the temperature dependence of the heat capacity of combustion products and the thermal inertia of the measurement system. This problem has been solved by training neural networks to predict molar heat capacity and the amount of substance (chemical amount) flow rate of combustion products in the cone calorimeter exhaust duct. Data were obtained for six different wood species: birch (Betula verrucosa Ehrh.), oak (Quercus robur L.) spruce (Picea abies (L.) H. Karst.), locust (Robinia pseudoacacia L.), poplar (Populus nigra × P. maximowiczii L.), and willow (Salix alba L.) woods at heat fluxes from 25 to 50 kW m−2 have been used for neural network training. Data from three other wood species iroko (Milicia excelsa (Welw.) C.C. Berg), pine (Pinus sylvestris L.), and paulownia (Paulownia tomentosa (Thunb.) Steud.) woods have been used for testing of trained neural network. The average percentage ratio of the predicted to the true value of HRR (during the test) has been 103.8%. In addition to that, some key average fire characteristics of wood have been determined: critical heat flux 20.7 kW m−2, effective heat of combustion 14.01 MJ kg−1, and the average value of molar heat capacity of combustion products 0.045 kJ mol−1 K−1.
Keywords:
combustion products; fire hazard; heat capacity; heat release rate; neural network; prediction; wood 1. Introduction
According to [1], the heat release rate (HRR) is the most important fire characteristic that quantifies the fire hazard of materials. HRR expresses the amount of heat (in kJ or MJ) released from one square meter of material in one second. HRR is usually expressed in units of kW m−2, which can be converted to a basic SI unit (kJ m−2 s−1). From HRR, it is possible to directly determine or predict virtually all the fire characteristics of materials. Among the basic fire characteristics precisely determined from HRR are mainly total heat release (THR), effective heat of combustion (EHC), maximum average rate of heat emission (MARHE), and fire growth rate index (FIGRA). In addition to the mentioned fire characteristics, almost all other fire characteristics can be estimated from the HRR, especially reaction to fire class, flashover category, flame spread rate, combustion product yields, and many others.
THR is calculated according to Equation (1) and EHC according to Equation (2),
where THR is total heat release per unit surface area (kJ m−2 or MJ m−2), ts is the start time of test (s)—the moment of ignition is usually considered as the test start time, tend is test end time (s), HRR(t) is heat release rate at time t (kW m−2), EHC is effective heat of combustion (kJ kg−1) and TML is total mass loss of the sample per unit surface area (kg m−2). Equations (1) and (2) are generally known.
MARHE is considered to be the maximum value of the average rate of heat emission. The average rate of heat emission and fire growth rate index is computed according to Equations (3) and (4), respectively,
where ARHEi is the average rate of heat emission (kW m−2) at time ti (i denote the summation index and it usually starts at the moment of ignition and ends at the end of the test), Δt is the time increment (s) and FIGRA is fire growth rate index (kW m−2 s−1). Equation (3) is given, e.g., in [2,3]. FIGRA was defined in [4]. The analogy of Equation (4) can be found, for example, in [5]. However, various scientific papers and technical standards present different alternatives for calculating the FIGRA parameter. A detailed procedure for calculating FIGRA by one widely accepted method is given, e.g., EN 13823:2020 + A1:2022 [5]. A more detailed overview of MARHE and FIGRA parameters and their practical applications can be found, e.g., in [6,7,8,9].
The method of estimating other fire characteristics from the HRR is described in the following scientific works [10] (prediction of reaction to fire class), [11,12] (flashover category prediction), [13,14] (flame spread rate prediction) and [15,16] (prediction of combustion products, mainly carbon monoxide yield from released heat). One of the few significant fire characteristics that cannot be estimated from the HRR is initiation characteristics (mainly critical heat flux and ignition temperature) and fire resistance of construction. Nevertheless, a certain relationship exists between the initiation characteristics and the HRR. For example, verification method C/VM2:2014 [17] uses an HRR of 50 kW m−2 as a criterion for flame combustion (the moment when the HRR reaches the value of 50 kW m−2 is considered as flame ignition). Initiation characteristics are discussed in more detail in the following scientific works [18,19,20,21,22,23].
Currently, there are three methods of measuring HRR. The first method is based on knowledge published by Thornton in 1917 [24] and improved by Huggett in 1980 [25]. The cited scientific works show that during the perfect combustion of most organic substances (gaseous, liquid, and solid except metals) 13.1 ± 0.7 kJ of heat is released per gram of oxygen consumed. This method is considered the most accurate (reference). Its only disadvantage is the excessive cost (given mainly by the price of the analyzer and the costs of pre-treatment of the combustion gases before the analyses). For this reason, this method of measurement is unavailable for some universities and research institutes. This problem mainly concerns wood science. Research in wood science is often focused on applications for which it is essential to improve only some properties of wood (e.g., mechanical properties, resistance to biological factors, preparation of transparent wood, etc.), while the other properties (e.g., fire characteristics) remain preserved or at least with no significant deterioration. In these areas of wood science, fire characteristics represent only a secondary issue, and it is often necessary to select those that did not significantly worsen the fire characteristics of the modified material. Creating a less expensive method for measuring HRR would greatly facilitate research in the mentioned areas. Selected areas of wood science, where fire characteristics are only of secondary importance, are described, e.g., in [26,27]. The burning products must be desiccated (moisture free) before entering the combustion product analyzer. Calcium sulfate (CaSO4) is the most common desiccator used, with cobalt(II) chloride (CoCl2) used as a moisture indicator, which according to [28] is carcinogenic. The replacement of this method should, at least in a certain percentage of cases, lead to a reduction in the number of carcinogenic substances used.
In addition, the second and third methods of measuring HRR are common today. The second method is based on the calculation of the HRR from the mass loss rate (MLR) of the investigated material, according to Equation (5),
where MLR is the mass loss rate of an investigated sample (kg s−1) and HRR is the heat release rate in (kW = kJ s−1).
The drawback of this method lies in the fact that the EHC of substances and materials that burn heterogeneously (e.g., wood) and mixtures of substances (e.g., oil and oil distillates) change with time. More details about this issue can be found in a scientific paper [29].
The third method is based on the calculation of the HRR from the temperature of the combustion products, according to Equation (6),
where HRR is the heat release rate (kW m−2), n is the chemical amount flow rate of the combustion products, herein after only chemical amount flow rate (mol s−1), cp is the molar heat capacity of combustion products at constant pressure, hereinafter only molar heat capacity (J mol−1 K−1), tc is the temperature of the combustion products (K) and ta is the ambient temperature (K). Equation (6) is self-evident (the proof follows from the analysis of the units). Various alternatives of this equation can be found in almost all university textbooks of physics, physical chemistry, or thermochemistry.
This method is significantly less demanding on technical equipment than the reference method. However, this method also has three disadvantages that complicate the measurement of the HRR. The first disadvantage is that the exact chemical composition of the combustion products (without the use of a combustion products analyzer) is usually not known and therefore the determination of the heat capacity in Equation (6) is problematic. The second and third disadvantages are the dependence of the molar heat capacity and the chemical amount flow rate on the temperature.
The results of the scientific work [30] show that when wood and wood-based materials are burned in the air, the products of combustion are mostly nitrogen (in fact, it is not a product of combustion, but it is a component of the air, which from a larger part of it passes into combustion products without changing the chemical composition), carbon dioxide and water vapor (other components of wood combustion products are practically negligible from the point of view of the molar heat capacity of the resulting mixture). The dependence of the molar heat capacity of nitrogen, carbon dioxide and water vapor on temperature (within the range of 300 to 1200 K) is shown in Figure 1.
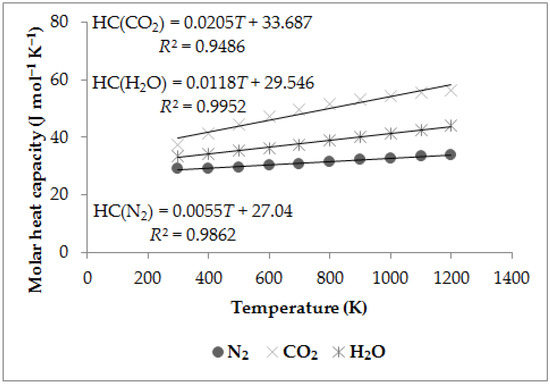
Figure 1.
Dependence of molar heat capacity (HC) of nitrogen, carbon dioxide, and water vapor on temperature (T) in the interval from 300 to 1200 K at constant pressure (the figure was derived from data adapted with permission from. Ref. [31]. 2015, Taylor and Francis Group LLC (Books) US).
The combustion products during a cone calorimeter test can be very well approximated by an ideal gas model (relatively low pressure, typically 98 to 101 kPa, and relatively high temperature, typically 300 to 400 K). The chemical amount flow rate is then calculated from the Equation of state of an ideal gas (7),
where p is the combustion products pressure (Pa), V is the combustion products volume flow rate (m3 s−1), and R is the gas constant (J mol−1 K−1). Therefore, chemical amount flow rate of combustion products can be calculated from their volume flow rate, pressure, and temperature, according to Equation (7). The differences between values calculated according to the state of an ideal gas (in the above-mentioned range of pressure and temperature) and according to the Van der Waals equation for real gas are deep below 1%. Details regarding the chemical amount of gas calculation from volume, pressure, and temperature and coefficients for the Van der Waals equation of real gas can be found, e.g., in [32].
This study aims to design and train the neural network for high-accuracy prediction of the chemical amount flow rate and molar heat capacity of wood combustion products in the cone calorimeter exhaust duct from combustion products temperature rise and time after ignition. Data obtained by the prediction allow HRR calculation according to Equation (6). The second aim is to compute the average values of the chemical amount flow rate and molar heat capacity of the combustion product and subsequently compare the accuracy of HRR computed by Equation (6) from data predicted by the trained neural network and from these average values.
The advantage of applying neural networks is obvious from the scope of the research. The exact chemical composition of combustion products in the cone calorimeter exhaust duct is unknown for all cases (there is no analyzer that determines all components of combustion products). The molar heat capacity of the gas mixture (combustion products) is dependent on the temperature. However, this dependence is different for each component. Therefore, the neural network is an ideal mathematical model for the prediction of this dependence on the gas mixture.
2. Materials and Methods
The heat release rate (HRR) and the temperature of the combustion products were measured together for nine wood species. Data from six tree species were used in the training phase (this phase includes training, validation, and testing of the neural network) and data from three tree species were used in the post-test phase of the trained neural network. In the training phase, samples from three wood species with a thickness of 50 mm were used:
- − Black Locust (Robinia pseudoacacia L.), hereinafter locust wood;
- − Hybrid Poplar J-105 (Populus nigra × P. maximowiczii L.), hereinafter poplar wood;
- − White Willow (Salix alba L.), hereinafter willow wood.
In addition, three wood species with a thickness of 20 mm were used in the training phase:
- − Common Oak (Quercus robur L.), hereinafter oakwood;
- − Norway Spruce (Picea abies (L.) H. Karst.), hereinafter spruce wood;
- − White Birch (Betula verrucosa Ehrh.), hereafter birchwood.
For additional test (post-test phase) three species of wood were used:
- − Iroko wood (Milicia excelsa (Welw.) C.C. Berg), hereinafter iroko wood (20 mm);
- − Scots pine (Pinus sylvestris L.), hereinafter pinewood (20 mm);
- − Paulownia tomentosa (Paulownia tomentosa (Thunb.) Steud.), hereinafter paulownia wood (50 mm).
The basic characteristics of the examined wood samples are in Table 1. Before the test, the wood samples were dried at a temperature of 103 ± 2 °C to a constant mass (0% water content) and then conditioned in a desiccator at a temperature of 22 ± 1 °C for 72 h.

Table 1.
Basic parameters of investigated woods.
Combustion process of wood, like other organic polymers, depends on the sample thickness. Consequently, the two most common sample thickness 20 and 50 mm was used for investigation. This thickness is commonly used in the cone calorimeter test and lies in the interval recommended by ISO 5660-1:2015 [33].
The HRR and the temperature of the combustion products were measured on a cone calorimeter. Both the cone calorimeter and the test procedure and conditions were according to ISO 5660-1:2015 [33]. The combustion products’ temperature and pressure were measured by the NiCr-Ni thermocouple (K type), resp. capacitive pressure sensor in the cone calorimeter exhaust duct during the test. The scheme of the cone calorimeter (with the marking of the place of measurement of the combustion products’ temperature with a thermocouple) is shown in Figure 2. The volume flow of combustion products in the exhaust duct of the cone calorimeter was set to 24 ± 0.5 L s−1. Although the value of the critical heat flux was not used for the training of the neural network, it was determined for a better characterization of the sample. The critical heat flux was determined from time to initiation by the method according to [34].
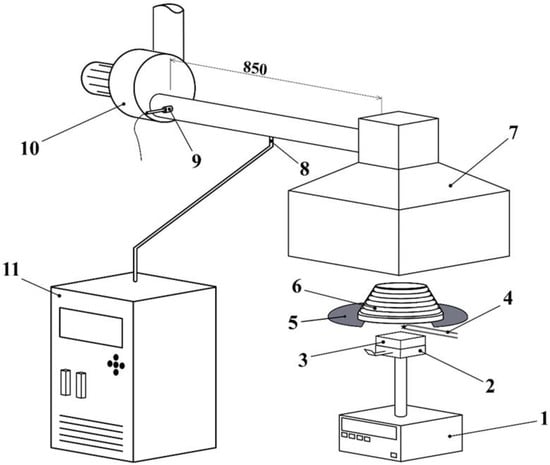
Figure 2.
Scheme of the cone calorimeter with marked thermocouple position. 1: Load cell; 2: sample holder; 3: sample; 4: spark igniter; 5: radiation shield; 6: cone heater; 7: hood; 8: combustion products collection point; 9: thermocouple; 10: adjustable fan; 11: combustion products analyzer.
Locust, poplar, and willow wood samples (50 mm thickness) were measured at heat fluxes of 25, 35, and 50 kW m−2, and birch, oak, and spruce wood samples (20 mm thickness) were measured at heat fluxes of 30 and 50 kW m−2. Wood samples used in the additional test phase were measured at the following heat fluxes: iroko (40 kW m−2), pine (35 kW m−2), and paulownia (25 kW m−2). The tree species and heat fluxes for the additional test were selected to critically verify the accuracy of the trained neural network. Two exotic trees and one coniferous tree were chosen for the additional test, while in the training phase, not a single exotic tree and only one coniferous tree were used. In the additional test phase, a single, previously unapplied heat flux (40 kW m−2) was used.
Chemical amount flow rate of combustion products in the cone calorimeter exhaust duct was calculated according to Equation (7) from combustion products’ temperature and pressure. Molar heat capacity of combustion products was calculated according to Equation (6) from HRR measured by the cone calorimeter and from temperature and chemical amount flow rate of combustion products in the cone calorimeter exhaust duct.
A neural network for prediction of the chemical amount flow rate and molar heat capacity (at constant pressure) has been designed in the MATLAB 2020b software (in the Neural Network Toolbox environment). The structure of the used neural network is shown in Figure 3. The two-layer (hidden layer with twenty sigmoid neurons and an output layer with two linear neurons) feed-forward neural network was used. The Levenberg–Marquardt training algorithm was used. A total of 5415 input data were applied in the training phase, of which 4331 (80%) were used for training and 542 (10%) for both validation and test. The structure of input data for neural network training and data prediction in the trained neural network is shown in Table 2 and Figure 4. A total of 1083 data were used for the additional test.
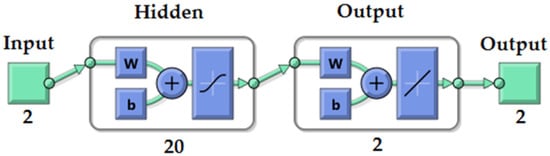
Figure 3.
Structure of used neural network.
Table 2.
Structure of input data for training and prediction by a trained neural network.
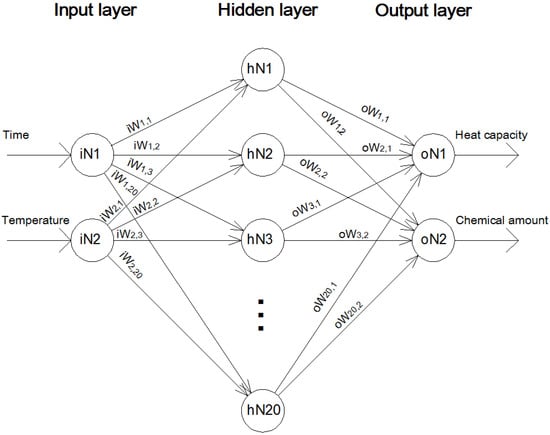
Figure 4.
Structure of used neural network together with data input and output structure (iN1 and iN2 represents neurons in the input layer, hN1 to hN20 represents neurons in the hidden layer, oN1 and oN2 represent neurons in the output layer, iW1,1 to iW2,20 represents link weight between input and hidden layer and oW1,1 to oW20,2 represents link weight between hidden and output layer).
Figure 4 illustrates structure of input and output data of the used neural network. Figure 4 also illustrates structure and theory governing the neural network. The input data together with desired output data are introduced to the neural network during the training phase. The link weights between input and hidden and between hidden and output layers are set up during the training phase. Training algorithm and neuron activation function were described above. In addition to that, trained neural network is available in the (S1 net) file Supplementary Material. All information concerning the structure, algorithm, and individual layers and all data used as input for the network training can be directly given from the available network. More details concerning the data structure and neural network theory can be found, e.g., in [35,36].
The HRR of wood samples used in the additional test phase was modeled in two ways. In the first method, the time to initiation of the samples (within the interval of 1 to 1800 s) and corresponding rise in the temperature of the combustion products in the form of 2-tuples following Table 2 and Figure 4 were used as the input data. Subsequently, the 2-tuples of combustion products’ molar heat capacity (in kJ mol−1 K−1) and combustion products’ chemical amount flow rate (mol s−1) were predicted by the trained neural network. Predicted data were used together with combustion products’ temperature rise to HRR estimation by Equation (6). Value calculated by the Equation (6) was subsequently multiplied by 113.122 constant. This constant considers the sample surface area (0.00884 m2) and recalculates HRR per 1 m2. The results obtained by this model are further denoted as NN_Model.
In the second method, the HRR was calculated from average values of combustion products’ chemical amount flow rate and molar heat capacity and combustion products’ temperature rise according to Equation (6). The results obtained by the second method are further denoted as nct_Model. The difference between NN_Model and nct_Model is therefore that with NN_Model, the molar heat capacity of combustion products and their chemical amount flow rate is predicted for each temperature of combustion products and test time, while nct_Model calculates HRR from the average values of both molar heat capacity and chemical amount flow rate of combustion products.
3. Results and Discussion
Even though the other fire characteristics (besides HRR and combustion products temperature rise) were not used for prediction, or neural network training, for a better characterization of woody plants, their main fire characteristics will also be listed. The average values of the basic fire characteristics of woody plants used in the training phase of the neural network are shown in Table 3. For comparison, the average value of effective heat of combustion of wood and wood-based materials determined from the values published in the scientific work [37] is 17.72 ± 0.87 MJ kg−1. The reason for the difference between this value and the values in Table 3 is the fact that the effective heat of combustion in this study and the cited scientific work were determined by different methods. In this scientific study, the effective heat of combustion was determined from the consumption of oxygen on a cone calorimeter, while in the cited scientific work [37], the effective heat of combustion was determined from the increase in the temperature of water in the calorimetric vessel in an adiabatic bomb calorimeter. It is generally known that the values of effective heat of combustion determined by the adiabatic bomb calorimeter are generally higher than the values determined by the cone calorimeter (the exception is liquids that burn almost perfectly and show almost identical values with both methods). Similar values of effective heat of combustion of wood as in Table 3 are presented in a scientific paper [38] (average value 14.07 ± 0.70 MJ kg−1). Values in Table 3 and the values in the scientific work [38] are very similar since in both cases a similar method of measuring the effective heat of combustion was used. In the cited scientific work, the effective heat of combustion was measured on the OSU Apparatus based on oxygen consumption. The increment of the maximum average rate of heat emission and maximum value of HRR with heat flux is generally known and it is in accordance with scientific works (e.g., Ref. [39]).
Table 3.
Average values of basic fire characteristics of locust, poplar, willow, birch, oak, and spruce wood.
The dependence of the inverse value of ignition time on the heat flux is shown in Figure 5. From this dependence, the value of the critical heat flux of the wood species used in the training phase of the neural network was calculated using the method according to [34]. It follows from Figure 5 that wood (used in the training phase of the neural network) shows a critical heat flux of 20.7 kW m−2. It should be noted that the critical heat flux resulting from Figure 5 is only 15.7 kW m−2, but the method according to [34] recommends dividing this value by the 0.76 constant (representing the heat loss).
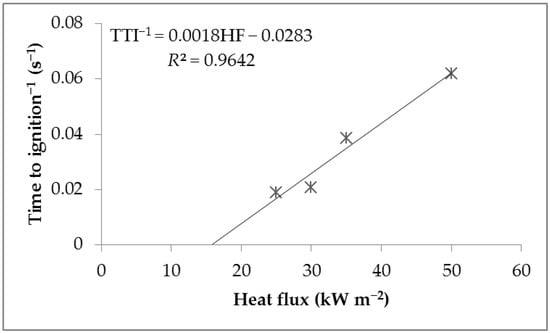
Figure 5.
Dependence of average inverse values of time to ignition (TTI) of locust, poplar, willow, birch, oak, and spruce wood on the heat flux (HF).
The HRR and temperature rise of combustion products (above the ambient temperature) of locust, poplar and willow wood is shown in Figure 6. The HRR and temperature rise of the combustion products of birch, oak, and spruce wood is shown in Figure 7. Data in Figure 6 and Figure 7 are normalized (the ratio of the current value of the heat release rate and the increase in the temperature of the combustion products to the maximum recorded value for each sample is given). It follows that the values on the graph of normalized values are in the interval 0 to 1. Such data normalization shows interrelation between temperature rise and heat release rate during the test time.
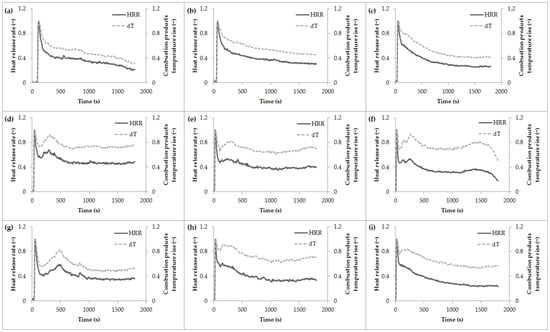
Figure 6.
Normalized values (actual value divided by maximum recorded value for each wood and heat flux) of heat release rate (HRR) and combustion products temperature rise (dT) of: (a) locust wood at 25 kW m−2; (b) locust wood at 35 kW m−2; (c) locust wood at 50 kW m−2; (d) poplar wood at 25 kW m−2; (e) poplar wood at 35 kW m−2; (f) poplar wood at 50 kW m−2; (g) willow wood at 25 kW m−2; (h) willow wood at 35 kW m−2; (i) willow wood at 50 kW m−2.
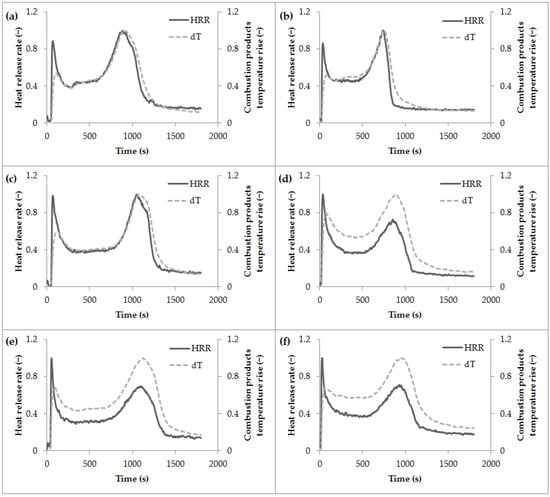
Figure 7.
Normalized values (actual value divided by maximum recorded value for each wood and heat flux) of heat release rate (HRR) and combustion products temperature rise (dT) of: (a) birchwood at 30 kW m−2; (b) birchwood at 50 kW m−2; (c) oakwood at 30 kW m−2; (d) oakwood at 50 kW m−2; (e) spruce wood at 30 kW m−2; (f) spruce wood at 50 kW m−2.
Samples with a thickness of 50 mm show, at the moment of initiation (corresponds roughly to the first local maximum) approximately the same normalized values of the HRR and the increase in the temperature of combustion products (Figure 6). After initiation (until the end of the test), samples with a thickness of 50 mm show higher normalized values of the temperature increase in combustion products than the HRR (Figure 6). This phenomenon is caused by the thermal inertia of the test device (cone calorimeter). Samples with a thickness of 20 mm show a different behavior (Figure 7). These samples show, at the moment of initiation (corresponding approximately to the first local maximum in Figure 7), significantly lower normalized values of the temperature rise of the combustion products compared to the normalized values of the HRR. This fact is probably caused by the short duration of intense flame burning right after initiation. Subsequently (after initiation), the samples of spruce wood and oak wood at 50 kW m−2 (Figure 7) behave similarly to the samples with a thickness of 50 mm (Figure 6), i.e., they show higher normalized values of combustion products temperature increase than normalized values of HRR. A different trend (Figure 7) is shown by samples of birch wood and oak wood at 30 kW m−2. These samples show almost identical normalized values of HRR and temperature rise of combustion products after initiation. These differences between the samples clearly demonstrate that determining the HRR by the temperature increase in the combustion products and their average value of molar heat capacity would probably not achieve high accuracy. Therefore, it would be more correct to use the molar heat capacity of combustion products predicted for actual temperature by a trained neural network. To verify this hypothesis, the HRR values calculated by NN_Model and nct_Model will be compared.
The average molar heat capacities of the combustion products and their chemical amount flow rate in the cone calorimeter exhaust duct are in Table 4.
Table 4.
Average values of molar heat capacity at constant pressure and chemical amount of combustion products flow rate from birch, oak, spruce, locust, poplar, and willow wood in the interval of heat fluxes from 25 to 50 kW m−2.
The molar heat capacity of combustion products (Table 4) is approximately equal to the values in Figure 1. In the nct_Model, the HRR will be calculated from the average values of the molar heat capacity of 0.045 kJ mol−1 K−1 and the chemical amount flow rate of 0.839 mol s−1 of the combustion products.
The regression of target (true value) vs. output (value predicted by the trained neural network) during the training phase (training phase includes training, validation, and testing) is shown in Figure 8. Figure 8 indicates that the trained neural network can predict with remarkably high accuracy the molar heat capacity and the chemical amount flow rate of wood combustion products in the exhaust duct of the cone calorimeter.
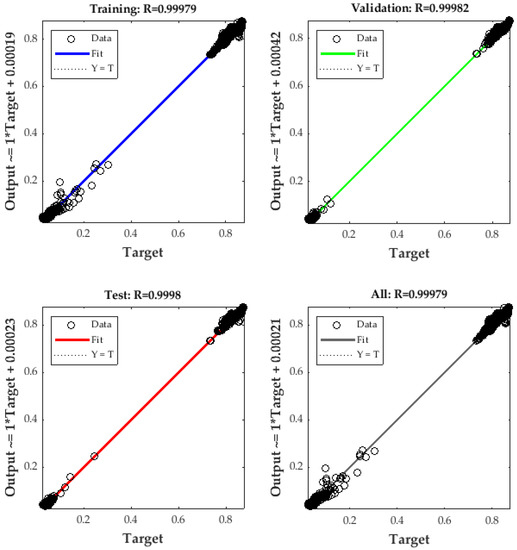
Figure 8.
Regression of target (true value) vs. output (value predicted by the trained neural network) during the training phase.
A total of 542 data (4-tuples in the structure according to Table 2) were used for testing the trained neural network (Figure 8). Although these data were not used for training or validation, they were measured for the same woods that were used for training and validation of the neural network (locust, poplar, willow, birch, oak, and spruce wood). For a reliable verification of the trained neural network, a prediction of the molar heat capacity and chemical amount flow rate in the cone calorimeter exhaust duct of combustion products was made from paulownia wood at 25 kW m−2, pinewood at 35 kW m−2 and iroko wood at 40 kW m−2 (additional test). The data measured for these woods were not used in the training phase. The average percentage ratio of predicted to actual value was used as the criterion for assessing the accuracy of the trained neural network in the phase of the additional test. A value of the percentage ratio of the predicted to the actual value of 100% means that the actual values and the values predicted by the model are identical (a higher value means that the model predicts higher, and a lower value means that the model predicts lower values than the actual). Average percentage ratios of predicted and actual values of HRR, chemical amount flow rate, and molar heat capacity are in Table 5 and Table 6.
Table 5.
The average percentage ratio of predicted to the true value of heat release rate (HRR) from pinewood (at 35 kW m−2), iroko wood (at 40 kW m−2), and paulownia wood (at 25 kW m−2).
Table 6.
The average percentage ratio of predicted to the true value of the chemical amount of combustion products’ flow rate (n) and molar heat capacity of combustion products (c) from pinewood (at 35 kW m−2), iroko wood (at 40 kW m−2) and paulownia wood (at 25 kW m−2).
The average percentage values of the ratios of the predicted to the actual values are 103.9 ± 5.9% and 100.2 ± 22.8% for chemical amount flow rate and molar heat capacity, respectively. These values approximately correspond to the average percentage ratio of the predicted to the actual value of the HRR (103.8 ± 23.08%). These data (together with the data in Table 5 and Table 6) were calculated from raw data in Tables S2 and S3.
HRR from woods used in the additional test; measured by the reference (cone calorimeter) method and predicted by the NN_Model and nct_Model are compared in Figure 9. Visual analysis of Figure 9 indicates that for paulownia wood, NN_Model shows very similar values of the HRR as the reference method (although from approximately 1500 s, the model shows visibly higher values than the reference method). On the other hand, NN_Model shows lower values of the HRR in the phase of the first and second local maxima for both pine and iroko wood. Thus, it seems that the NN_Model slightly underestimates the values of the local maxima of the HRR. A similar problem (slight underestimation of the local maximum) is also shown by the model for calculating the HRR from sample mass loss presented in the scientific work of Parker [40]. Visual analysis of Figure 9 further indicates that the NN_Model predicts the HRR more accurately than the nct_Model. However, a definitive conclusion can only be drawn based on the average percentage ratio of the predicted to the actual value of the HRR (Table 5). The cited Table 5 shows that for pine and iroko wood, the NN_Model shows higher accuracy compared to the nct_Model. On the contrary, for paulownia wood, the accuracy of the nct_Model is apparently higher (Table 5). Comparison of Figure 9c and Table 5, however, proves that the high value of the average percentage ratio predicted to the actual value of the HRR in paulownia wood was caused by only a slight overestimation of the NN_Model in the final phase of the test (time interval between 1500 to 1800 s). Such a slight overestimation in the final phase of the test does not have a significant impact on the test result, or it is necessary to consider it in the prediction.
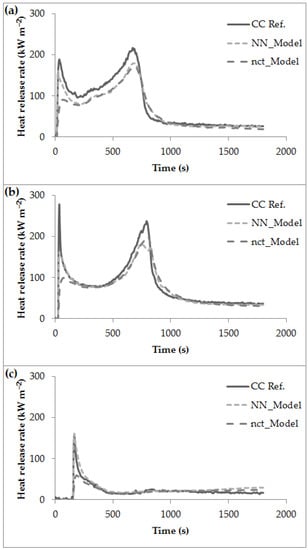
Figure 9.
Heat release rate measured by the cone calorimeter as reference method (CC Ref.), computed from heat capacity, substance amount flow rate of combustion products predicted by trained neural network and combustion products temperature rise (NN_Model) and computed by average heat capacity, substance amount flow rate of combustion products and combustion products temperature rise (nct_Model) from: (a) pinewood; (b) iroko wood; and (c) paulownia wood.
The average percentage ratio (average for all woods in the additional test) of the predicted to the actual value of the HRR for the NN_Model was 103.8 ± 23.08% and for the nct_Model 96.24 ± 20.76% (the high value of the standard deviation is mainly caused by a slight underestimation of local maxima). These values of average percentage ratios enable the application of both models to predict the HRR. The stated percentage values are comparable to the accuracies of neural networks in other applications in fire engineering (especially temperature prediction or identification of the type of burning substance) published in scientific papers [41,42,43].
In addition to visual comparison (Figure 9) and average percentage ratio of the predicted to the true value, the raw data of true and predicted value of HRR, chemical amount flow rate, and molar heat capacity are available in the Supplementary Materials denoted as Table S2 to Table S3.
The described method allows measuring heat release rate in the cone calorimeter (without the needed use of a combustion products analyzer). Due to differences between constructions of various cone calorimeters, calibration is recommended before using the described method. The calibration lies in the action of the methane burner (under equal conditions as described in ISO 5660-1 [33] for C factor determination). Burner output: 5 ± 0.1 kW, time: 5 min, number of repetitions: 3 times. The average temperature during this calibration is measured. This average value is used for tc correction before it is used as input for trained neural network in accordance with Equation (8),
where Tccor is combustion products temperature rise (K) after correction used as an input to the trained neural network, Tcc is combustion products temperature rise (K) before correction, 138.7 is an average temperature rise (K) of combustion products measured by the cone calorimeter used in this study during 5 min acting of methane burner and Tcal is average temperature rise (K) measured by the cone calorimeter (which need to be calibrated) during the 5 min acting of methane burner (K). The calibration purpose is to recalculate temperature rise measured by another device so that it could be used as an input for a neural network in the Supplementary File S1.
4. Conclusions
In this scientific study, a neural network was designed and trained to predict the molar heat capacity (at constant pressure) and the chemical amount flow rate of wood combustion products in the exhaust duct of a cone calorimeter. The neural network was created and trained so that the data on the time after initiation (with a resolution of 1 s) and the increase in the temperature of the combustion products are sufficient for prediction. After training the neural network, it is sufficient to measure the temperature of the combustion products in the exhaust duct of the cone calorimeter (e.g., with a NiCr-Ni thermocouple) and the time after initiation (e.g., with a stopwatch with a resolution of at least 1 s). From the measured and predicted values, it is possible to subsequently calculate the HRR (as a product of the temperature increase in the combustion products, the predicted molar heat capacity of the combustion products, and the predicted chemical amount flow rate of the combustion products).
The accuracy of the thus created and trained neural network was evaluated in the prediction of the molar heat capacity of combustion products and the chemical amount flow rate of combustion products from three types of wood that were not used for training the neural network. The average percentage ratio of predicted to the actual value of molar heat capacity and chemical amount flow rate was 100.2% and 103.9%, respectively. The average percentage ratio of predicted and actual HRR was 103.8%. These values of percentage ratios are valid for additional test data (obtained for three wood species that were not included in the training of the neural network). These data are presented in Tables S2 and S3. These values demonstrate the high accuracy of the trained neural network and the possibility of using it to accurately predict the data needed to calculate the HRR from the increase in temperature of wood combustion products.
The created method has a fundamental benefit, especially for selected areas of wood science in which selected properties of wood (e.g., resistance to biological factors) are improved as a matter of priority, while it is sufficient to avoid significant deterioration of the fire characteristics of the modified material. For these areas of wood science, the created method will mean a significant benefit and will enable a fundamental reduction of costs for research into the fire hazard of wood and wood-based materials.
Supplementary Materials
The following supporting information can be downloaded at: https://www.mdpi.com/article/10.3390/pr11041206/s1; S1 net: Trained neural network; Table S2: Predicted and true values of HRR for iroko, pine and paulownia wood; Table S3: Predicted and true values of n and c for iroko, pine, and paulownia wood.
Author Contributions
Conceptualization, J.M.; methodology, J.M. and P.R.; software, J.M.; validation, J.M., P.R., I.W. and T.Š.; formal analysis, J.M., P.R. and F.M.; investigation, P.R. and F.M.; resources, F.M.; data curation, J.M. and P.R.; writing—original draft preparation, J.M., I.W. and T.Š.; writing—review and editing, All; visualization, J.M. and P.R.; supervision, J.M. and P.R.; project administration, J.M. and P.R; funding acquisition, J.M. and P.R. All authors have read and agreed to the published version of the manuscript.
Funding
This research was funded by the SLOVAK RESEARCH AND DEVELOPMENT AGENCY, grant numbers APVV-16-0223 and APVV-21-0187. This research was also founded by the KEGA Agency, grant number KEGA 016STU-4/2021, and by the VEGA agency, grant number VEGA 1/0678/22.
Data Availability Statement
The data presented in this study are available on request from the corresponding author.
Acknowledgments
This work was supported by the Slovak Research and Development Agency under the contract No. APVV-16-0223 and APVV-21-0187. This work was supported by the KEGA Agency under the contract KEGA 016STU-4/2021. This work was supported by the VEGA agency under the contracts No. VEGA 1/0678/22.
Conflicts of Interest
The authors declare no conflict of interest.
References
- Babrauskas, V.; Peacock, R.D. Heat release rate: The Single Most Important Variable in Fire Hazard. Fire Saf. J. 1992, 18, 255–272. [Google Scholar] [CrossRef]
- Zhang, J. Study of Polyamide 6-Based Nanocomposites, 1st ed. Ph.D. Thesis, Polytechnic University, New York, NY, USA, 2008; 142p. [Google Scholar]
- Marquis, D.; Guillaume, E.; Lesenechal, D. Accuracy (Trueness and Precision) of Cone Calorimeter Tests with and without a Vitiated Air Enclosure. Procedia Eng. 2013, 62, 103–119. [Google Scholar] [CrossRef]
- Sundstrom, B.; Hees, P.; Thureson, P. Results and Analysis from Fire Test of Buildings Products in ISO 9705, the Room/Corner Test: The SBI Research Programme, 1st ed.; SP Swedish National Testing and Research Institute: Boras, Sweden, 1998; p. 74. [Google Scholar]
- EN 13823:2020+A1:2022; Reaction to Fire Tests for Building Products—Building Products Excluding Floorings Exposed to the Thermal Attack by a Single Burning Item, 3rd ed. European Committee for Standardization: Brussels, Belgium, 2020; p. 101.
- Bhoite, S.P.; Kim, J.; Jo, W.; Bhoite, P.H.; Mali, S.S.; Park, K.-H.; Hong, C.K. Understanding the Influence of Gypsum upon a Hybrid Flame Retardant Coating on Expanded Polystyrene Beads. Polymers 2022, 14, 3570. [Google Scholar] [CrossRef] [PubMed]
- De la Cruz, L.G.; Abt, T.; León, N.; Wang, L.; Sánchez-Soto, M. Ice-Template Crosslinked PVA Aerogels Modified with Tannic Acid and Sodium Alginate. Gels 2022, 8, 419. [Google Scholar] [CrossRef] [PubMed]
- Martinka, J. Fire Hazards of Electrical Cables, 1st ed.; Springer Nature: Cham, Switzerland, 2022; p. 102. [Google Scholar]
- Zemła, M.; Prociak, A.; Michałowski, S.; Cabulis, U.; Kirpluks, M.; Simakovs, K. Thermal Insulating Rigid Polyurethane Foams with Bio-Polyol from Rapeseed Oil Modified by Phosphorus Additive and Reactive Flame Retardants. Int. J. Mol. Sci. 2022, 23, 12386. [Google Scholar] [CrossRef]
- Steen-Hansen, A.; Kristoffersen, B. Prediction of fire classification for wood based products. A multivariate statistical approach based on the cone calorimeter. Fire Mater. 2007, 31, 207–223. [Google Scholar] [CrossRef]
- Östman, B.A.-L.; Tsantaridis, L.D. Correlation between Cone Calorimeter Data and Time to Flashover in the Room Fire Test. Fire Mater. 1994, 18, 205–209. [Google Scholar] [CrossRef]
- Kokkala, M.A.; Thomas, P.H.; Karlsson, B. Rate of Heat Release and Ignitability Indices for Surface Linings. Fire Mater. 1993, 17, 209–216. [Google Scholar] [CrossRef]
- Tsai, K.C. Using Cone Calorimeter Data for the Prediction of Upward Flame Spread Rate. J. Therm. Anal. Calorim. 2013, 112, 1601–1606. [Google Scholar] [CrossRef]
- Goransson, U. Using the Cone Calorimeter for Prediction of Flame Spread, 1st ed.; Swedish National Testing and Research Institute: Boras, Sweden, 1991; 22 p. [Google Scholar]
- Ozgen, S.; Caserini, S.; Galante, S.; Giugliano, M.; Angelino, E.; Marongiu, A.; Hugony, F.; Migliavacca, G.; Morreale, C. Emission Factors from Small Scale Appliances Burning Wood and Pellets. Atmos. Environ. 2014, 94, 144–153. [Google Scholar] [CrossRef]
- Martinka, J.; Martinka, F.; Rantuch, P.; Hrušovský, I.; Blinová, L.; Balog, K. Calorific Value and Fire Risk of Selected Fast-growing Wood Species. J. Therm. Anal. Calorim. 2018, 131, 899–906. [Google Scholar] [CrossRef]
- C/VM2:2014; Verification Method: Framework for Fire Safety Design, 1st ed. The Ministry of Business, Innovation and Employment: Wellington, New Zealand, 2014; p. 74.
- Mikkola, E.; Wichman, I.S. On the thermal ignition of combustible materials. Fire Mater. 1989, 14, 87–96. [Google Scholar] [CrossRef]
- Chen, X.J.; Yang, L.Z.; Ji, J.W.; Deng, Z.H. Mathematical Model for Prediction of Pyrolysis and Ignition of Wood under External Heat Flux. Prog. Nat. Sci. Mater. Int. 2002, 12, 874–880. [Google Scholar]
- Babrauskas, V. Ignition Handbook, 1st ed.; Fire Science Publishers: Issaquah, WA, USA, 2003. [Google Scholar]
- Necas, A.; Martinka, J.; Rantuch, P.; Wachter, I.; Stefko, T. Impact of the Electric Cables Installation on the Ignition Parameters of the Spruce Wood Surface. Wood Res. 2021, 66, 732–745. [Google Scholar] [CrossRef]
- Tureková, I.; Ivanovičová, M.; Harangózo, J.; Gašpercová, S.; Marková, I. Experimental Study of the Influence of Selected Factors on the Particle Board Ignition by Radiant Heat Flux. Polymers 2022, 14, 1648. [Google Scholar] [CrossRef] [PubMed]
- Marková, I.; Ivaničová, M.; Osvaldová, L.M.; Harangózo, J.; Tureková, I. Ignition of Wood-Based Boards by Radiant Heat. Forests 2022, 13, 1738. [Google Scholar] [CrossRef]
- Thornton, W.M. The Relation of Oxygen to the Heat of Combustion of Organic Compounds. Philos. Mag. Ser. 6 1917, 33, 196–203. [Google Scholar] [CrossRef]
- Huggett, C. Estimation of Rate of Heat Release by Means of Oxygen Consumption Measurements. Fire Mater. 1980, 4, 61–65. [Google Scholar] [CrossRef]
- Chutturi, M.; Swetha, G.; Yadav, S.M.; Wibowo, E.S.; Sihag, K.; Rangppa, S.M.; Bhuyar, P.; Siengchin, S.; Antov, P.; Kristak, L.; et al. A comprehensive review of the synthesis strategies, properties, and applications of transparent wood as a renewable and sustainable resource. Sci. Total Environ. 2023, 864, 161067. [Google Scholar] [CrossRef]
- Kristak, L.; Ruziak, I.; Tudor, E.M.; Barbu, M.C.; Kain, G.; Roman, R. Thermophysical properties of larch bark composite panels. Polymers 2021, 13, 2287. [Google Scholar] [CrossRef]
- Fisher Scientific Company. Safety Data Sheet of Drierite with Indicator, 6th ed.; Fisher Scientific Company: Fair Lawn, NJ, USA, 2021; 9 p. [Google Scholar]
- Todaro, L.; Rita, A.; Cetera, P.; D’Auria, M. Thermal treatment modifies the calorific value and ash content in some wood species. Fuel 2015, 140, 1–3. [Google Scholar] [CrossRef]
- Bruns, E.A.M.; Krapf, J.; Orasche, Y.; Huang, R.; Zimmermann, L.; Drinovec, G.; Mocnik, L.; El-Haddad, I.; Slowik, J.G.; Dommen, J.; et al. Characterization of Primary and Secondary Wood Combustion Products Generated under Different Burner Loads. Atmos. Chem. Phys. 2015, 15, 2825–2841. [Google Scholar] [CrossRef]
- Haynes, W.M.; Lide, D.R.; Bruno, T.J. CRC Handbook of Chemistry and Physics: A Ready-Reference Book of Chemical and Physical Data, 2015th–2016th; CRC Press: Boca Raton, FL, USA, 2015; 2652p. [Google Scholar]
- Atkins, P.W.; De Paula, J. Atkins’ Physical Chemistry, 8th ed.; W.H. Freeman and Company: New York, NY, USA, 2006; 1053p. [Google Scholar]
- ISO 5660-1:2015; Reaction to Fire Tests. Heat Release, Smoke Production and Mass Loss Rate. Part 1: Heat Release Rate (Cone Calorimeter Method) and Smoke Production Rate (Dynamic Measurement), 3rd ed. International Organization for Standardization: Geneva, Switzerland, 2015; p. 55.
- Spearpoint, M.J.; Quintiere, J.G. Predicting the Piloted Ignition of Wood in the Cone Calorimeter Using an Integral Model—Effect of Species, Grain Orientation and Heat Flux. Fire Saf. J. 2001, 36, 391–415. [Google Scholar] [CrossRef]
- Mensah, R.A.; Xiao, J.; Das, O.; Jiang, L.; Xu, Q.; Okoe Alhassan, M. Application of Adaptive Neuro-Fuzzy Inference System in Flammability Parameter Prediction. Polymers 2020, 12, 122. [Google Scholar] [CrossRef]
- Mensah, R.A.; Jiang, L.; Asante-Okyere, S.; Xu, Q.; Jin, C. Comparative evaluation of the predictability of neural network methods on the flammability characteristics of extruded polystyrene from microscale combustion calorimetry. J. Therm. Anal. Calorim. 2019, 138, 3055–3064. [Google Scholar] [CrossRef]
- Günther, B.; Gebauer, K.; Barkowski, R.; Rosenthal, M.; Bues, C.-T. Calorific value of selected wood species and wood products. Eur. J. Wood Prod. 2012, 70, 755–757. [Google Scholar] [CrossRef]
- Tran, H.C. Experimental data on wood materials. In Heat Release in Fires, 2nd ed.; Babrauskas, V., Grayson, S.J., Eds.; Interscience Communications: London, UK, 2009; pp. 357–372. [Google Scholar]
- Hirschler, M.M. Heat release from plastic materials. In Heat Release in Fires, 2nd ed.; Babrauskas, V., Grayson, S.J., Eds.; Interscience Communications: London, UK, 2009; pp. 375–422. [Google Scholar]
- Parker, W.J. Prediction of the heat release rate from basic measurement. In Heat Release in Fires, 2nd ed.; Babrauskas, V., Grayson, S.J., Eds.; Interscience Communications: London, UK, 2009; pp. 333–356. [Google Scholar]
- Xu, J.; Zhao, J.; Wang, W.; Liu, M. Prediction of Temperature of Tubular Truss under Fire Using Artificial Neural Networks. Fire Saf. J. 2013, 56, 74–80. [Google Scholar] [CrossRef]
- Kou, L.; Wang, X.; Guo, X.; Zhu, J.; Zhang, H. Deep Learning Based Inverse Model for Building Fire Source Location and Intensity Estimation. Fire Saf. J. 2021, 121, 103310. [Google Scholar] [CrossRef]
- Martinka, J.; Necas, A.; Rantuch, P. The Recognition of Selected Burning Liquids by Convolutional Neural Networks under Laboratory Conditions. J. Therm. Anal. Calorim. 2022, 147, 5787–5799. [Google Scholar] [CrossRef]
Disclaimer/Publisher’s Note: The statements, opinions and data contained in all publications are solely those of the individual author(s) and contributor(s) and not of MDPI and/or the editor(s). MDPI and/or the editor(s) disclaim responsibility for any injury to people or property resulting from any ideas, methods, instructions or products referred to in the content. |
© 2023 by the authors. Licensee MDPI, Basel, Switzerland. This article is an open access article distributed under the terms and conditions of the Creative Commons Attribution (CC BY) license (https://creativecommons.org/licenses/by/4.0/).