Abstract
The timely and effective fault diagnosis method is critical to the operation of the air-conditioning system and energy saving of buildings. In this study, a novel fault diagnosis method was proposed. It is combined with the signal demodulation method and machine learning method. The fault signals are demodulated by the demodulation method based on time-frequency analysis and principal component analysis (DPCA). The modulation characteristics of the principal component and DPCA sets with stronger features are obtained. Compared with time domain sets, the correct rate was increased by 16.38%. Then, as a machine learning method, the Visual Geometry Group—Principal Component Analysis (VGG-PCA) model is proposed in this study. The application potential of this model is discussed by using evaluation indexes of fault diagnosis performance and two typical faults of air conditioning systems. Compared with the other two convolution neural network models, the correct rate was increased by 17.1% and 20.32%, and the running time was reduced by 69.25% and 64.53%, respectively. A large number of tests are used to investigate the optimal range of model parameters. This provides the reference and guarantee for further model optimization.
1. Introduction
With the development of the economy and society, the energy consumption of air-conditioning systems has increased. Reducing the energy consumption of the system has become the focus of scholars all over the world. As some studies showed, 15% to 30% of the energy is wasted in commercial buildings due to the failure of the air conditioning system. Typical failures include condenser blockage [1] and spindle wear. The refrigerant in the system will return to the compressor [2] and even burn the motor [3] in these failures. Higher maintenance costs are spent and carbon emissions and energy consumption are increased in this case [4]. It is necessary to develop efficient fault diagnosis strategies for air conditioning systems.
The fault diagnosis methods of air conditioning systems are mainly divided into the quantitative model method, qualitative model method and data-driven method. As a typical data-driven method, Principal Component Analysis (PCA) and neural network (NN) play a leading role in fault diagnosis of air conditioning systems [5]. PCA is a typical linear data dimensionality reduction method in statistics [6,7]. By mapping the original high-dimensional data into a low-dimensional space, data features are extracted, its dimensions are reduced, and calculation efficiency is improved. It is used in the field of signal and fault diagnosis [8]. Liu et al. [9] proposed a statistical method based on PCA and the exponentially-weighted moving average (EWMA) to diagnose the refrigerant filling fault in the variable refrigerant flow (VRF) system. The data from different types of VRF systems are used to verify the effectiveness of the PCA-EWMA method. Song et al. [10] applied PCA to the motor and obtained the modulation characteristics of the motor under normal and fault conditions by demodulating the motor signal. Maha et al. [11] used PCA for feature extraction and data dimensionality reduction of telecom company customer data and evaluated the dimensionality reduction effect. Xu et al. [12] developed a new strategy for centrifugal water chillers by combining the wavelet analysis method and the PCA method. Compared with the traditional strategy, the fault detection rate and accuracy are improved. Guo et al. [13] proposed a new method. The Satizky-Golay method is used to preprocess the data set. To train the PCA model, the data set is used. Fu et al. [14] proposed an expert-based multivariate decoupling method. The fault diagnosis ability of the PCA method is enhanced through expert knowledge, and the new method is verified by a typical air handling process. Song et al. [15,16] applied the PCA method to the field of signal demodulation. The demodulation method based on time-frequency analysis and principal component analysis (DPCA) is proposed. The demodulation accuracy and computational efficiency of the new method are improved. The new method is verified by simulation, centrifugal pump and propeller experiments based on PCA’s feature extraction performance and data dimensionality reduction ability. In this study, the PCA method is applied in the generation of feature sets and the construction of a diagnosis model.
As a typical machine learning [17,18,19] technology, NN has been widely used in various fields [20,21,22,23]. Zhou et al. [2] proposed an online diagnosis method of compressor return liquid fault of VRF system based on a back-propagation neural network, with online diagnosis accuracy up to 99.48%. Qiang et al. [19] tested 25 machine learning models for refrigerant leakage fault, and the extremely randomized trees model has the best performance, with the highest accuracy of 95.73%. Wang et al. [3] proposed a decision tree model to detect and diagnose the return liquid fault of the scroll compressor in the multi-split system. Sun et al. [24] proposed a hybrid fault diagnosis model combining support vector machine (SVM) wavelet denoising and improved maximum correlation and minimum redundancy algorithm. The problem of identifying the refrigerant charging fault is solved in the VRF system. Shi et al. [25] developed an efficient fault diagnosis model. The model is applied in refrigerant charging fault diagnosis of the VRF system to sort features. Han et al. [26] proposed a hybrid diagnosis model based on a genetic algorithm and SVM. The model is applied to diagnose the faults of water chillers. The effectiveness of the hybrid model was proved by evaluating the correct rate, hit rate and false alarm rate. Zhao et al. [27] used pattern recognition in the fault diagnosis of refrigerators, and used the support vector data description method for fault classification. Compared with the PCA method, it has better performance. Yan et al. [28] proposed a hybrid method of the autoregressive model based on the auto-regressive (AR) model and SVM. The new method uses the high-dimensional parameter space constructed by ARX and subdivides the parameter space by SVM. The advantages of the model are verified by experiments. Convolution neural networks (CNN) is a feedforward NN with depth structure. It is robustly processing two-dimensional pictures and has the advantages of local connection and weight sharing. Yan et al. [29] applied CNN to water chillers and compared it with an automated fault detection method based on machine learning. It features a more straightforward structure and better classification precision. Miyata et al. [30] proposed a new method for fault diagnosis of heat source system based on CNN. An accuracy of 98.7% is obtained through training and testing. As a typical CNN method, the Visual Geometry Group (VGG) model has the advantages of local perception and weight sharing with processing two-dimensional images. This study applies the VGG method in the fault diagnosis model to achieve efficient and accurate identification of air-conditioning system faults.
A novel fault diagnosis method based on the Visual Geometry Group—Principal Component Analysis (VGG-PCA) model and the DPCA method is proposed in this paper. It can diagnose air conditioning system faults and reduce the consumption of building energy. The DPCA method is used to strengthen the characteristics of sample sets. Through a large number of experimental data and model evaluation methods, the VGG-PCA model is optimized and evaluated. In Section 1, the DPCA method, VGG-PCA model and evaluation methods are introduced. In Section 2, the experimental platform and relevant parameters used in this study are introduced. In Section 3, the results of the model operation are evaluated. In Section 4, the optimization strategy of model parameters is discussed. Finally, the conclusion is drawn and summarized in Section 5.
2. Research Method
The fault diagnosis strategy structure of air conditioning systems is based on DPCA and machine learning as shown in Figure 1. A fault test was carried out to collect operation data. Then, the data are preprocessed and feature strengthened. To reduce the impact of random error on model training and testing, the loaded data are mixed and standardized. The data are randomly divided into training sets, verification sets and test sets.
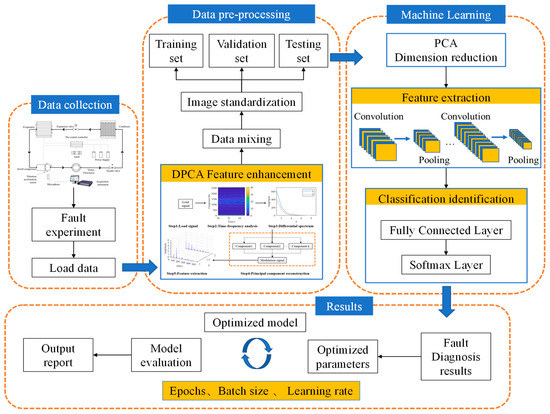
Figure 1.
Fault diagnosis strategy schematic diagram.
With the DPCA method, the data feature is strengthened. The DPCA method can convert the original signal into a time-frequency distribution matrix. Modulation features of signals are enhanced and extracted, and the correct rate of fault diagnosis is improved. Then the fault diagnosis model is established based on machine learning. The learning effect is evaluated by the model evaluation system. For a large number of data and high-dimensional feature variables, the PCA method is added to the model. By the PCA method, the main data features are retained, and the amount of computation and running time is reduced. According to the model evaluation results, the model parameters are adjusted, and the model structure and diagnosis performance are optimized.
2.1. DPCA Method
DPCA is a signal demodulation method, which mainly includes four parts: raw signal acquisition, STFT, PCA, and modulation feature extraction [15]. With the DPCA method, the signal features are enhanced and extracted, the features of fault image samples are more obvious, and the recognition degree of sample sets is improved. The principle of the DPCA method is shown in Figure 2. STFT method is applied to the original signal to obtain the time-frequency distribution function of noise or vibration signal, as shown in Equation (1). As a window function, the Hanning window is selected.
where is the original signal; is a Window function; is a natural constant; is a unit imaginary number.
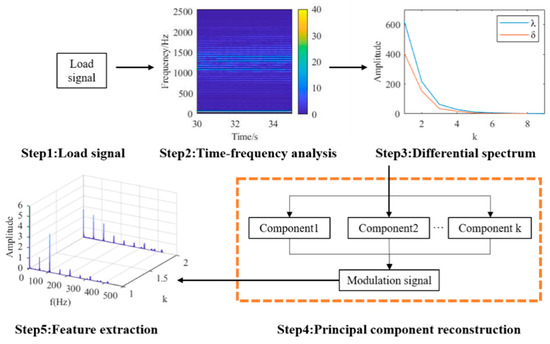
Figure 2.
DPCA method principle schematic diagram.
After the time-frequency distribution function is obtained, the amplitude spectral density function of the modulated signal is solved using Equation (2), and then the time-frequency distribution matrix is obtained, as shown in Equation (3). Through the lowest limiting frequency in Equation (3), the dimension of the time-frequency distribution function is reduced, and the accuracy of feature frequency extraction is improved. The computation and running time of extracting modulation characteristic frequency are reduced.
where is a time-frequency distribution function; is the fast Fourier transform length of a window function.
where is the minimum limiting frequency; is the frequency of the modulated signal.
PCA method is divided into four parts: covariance matrix solution, eigenvalue decomposition, eigenvalue selection, and principal component reconstruction. First, the covariance matrix is calculated according to the time-frequency distribution matrix, as shown in Equation (4).
where represents the covariance operator.
Then the eigenvalues and eigenvectors of the matrix are obtained by the eigenvalue decomposition method, as shown in Equation (5).
where is the eigenvalue matrix and is the eigenvector matrix.
where is the matrix eigenvalue.
where is the matrix characteristic vector.
Then order of eigenvalue is selected according to the difference spectral value. As shown in Equation (8), is the difference spectrum value. It represents the proportion of the energy distribution. The order of the eigenvalue is selected based on the maximum value of the difference spectrum.
where is the order of the characteristic value, is the difference spectrum value.
Finally, the principal component is reconstructed using the selected first K-order eigenvalues and eigenvectors to obtain the principal component modulated signal, as shown in Equation (9). Then the signal is processed with a fast Fourier transform to obtain the characteristic frequency of the modulated signal components. Compared with time-domain images, image features and recognition are enhanced, and the fault diagnosis correct rate is higher. This will be discussed in Section 4.2.
2.2. VGG-PCA Model
CNN is a typical deep feedforward artificial neural network. Inspired by biological perception mechanism, it was proposed in 1998 and widely used in the field of fault diagnosis. CNN has the characteristics of local connection and weight sharing, so the network structure is optimized and the risk of model over-fitting is reduced. The robustness and operational efficiency of processing two-dimensional images are improved. CNN mainly includes a convolution layer, pooling layer, full connection layer and softmax layer. The principle of the convolution layer is shown in Equation (10). As shown in Figure 1, in the fault diagnosis of the air conditioning system, the original signal is processed and the demodulation spectrum is obtained by using the DPCA method. Image features are extracted in the convolution layer. In the pooling layer, features are filtered and dimensioned. The robustness of features and the speed of model calculation are improved. Then, the fault diagnosis is realized by image classification through the full connection layer and the softmax layer.
where is the output matrix size, is the input matrix size, is the convolution kernel size, is the step size, and is the padding.
VGG is a typical CNN model. Compared with other CNN models, the volume of the convolution kernel is smaller, the network structure is deeper, and it possesses better generalization ability. Convergence requires fewer iterations. In fault diagnosis of air conditioning systems, accurate and fast fault identification is important. VGG model has a higher accuracy of fault feature mining and generalization than others. It provides a guarantee for this. Therefore, the VGG model is selected as the machine learning framework in this study. The number of hidden layers is related to the image characteristics of the sample set, the temporal and spatial complexity of the model, and the classification of the sample set. Corresponding to the type of fault, the output node is two. Through empirical methods, the number of hidden layers is selected. The VGG model includes 13 layers of convolution layer, five layers of pooling layer, three layers of full connection layer and one softmax layer, which are responsible for feature extraction and classification tasks. To prevent the model from over-fitting, the PCA method is introduced into the model to reduce the dimension of image features. Applying the PCA method in the model, the main information is retained, the number of features is simplified, and the efficiency of model diagnosis is improved. By analyzing the difference spectral values of two types of fault signals, the number of the principal component in the PCA method is determined to be two. In Section 4.3, the diagnosis results of the VGG-PCA model will be discussed. Referring to the parameter selection strategy proposed in Section 5, the relevant parameters of the model are determined. The learning rate is 0.001, the batch size is 128, the epochs are 20, and the activation function is a Rectified Linear Unit.
2.3. Evaluation Index of Fault Diagnosis Performance
- (1)
- Fault diagnosis correct rate
The correct rate (CR) is the proportion of correctly classified samples to the total samples in the model’s training, verification and testing. It is used to evaluate the overall performance of the fault diagnosis model.
- (2)
- Fault diagnosis loss rate
The loss rate is defined as the degree of deviation between the prediction made by the model and the true value. Negative correlation between loss rate and CR. The loss function selected in this model is sparse categorical cross-entropy, and the fault category label is serial number code.
- (3)
- Fault diagnosis running time
Runtime time is then taken by a fault diagnosis model to complete the diagnosis process, which objectively reflects the efficiency of the model and is closely related to the time complexity of the model.
3. System Description and Fault Experiments
3.1. System Description and Experimental Condition
The experimental platform is composed of an air conditioning system, control system, sensor and signal acquisition system in this paper. The schematic diagram is shown in Figure 3. The parameters of the scroll compressor are shown in Table 1. In the air conditioning system, the R134A refrigerant is filled. To monitor and regulate the refrigerant flow in the system, a needle valve and a vortex flowmeter are arranged in the system. The control system consists of a central controller and a regulating knob. Through the central controller, the system mode (refrigeration and heating) and the air volume of the evaporation tank are controlled. This experiment is a refrigeration condition, and the air volume is in gear one.
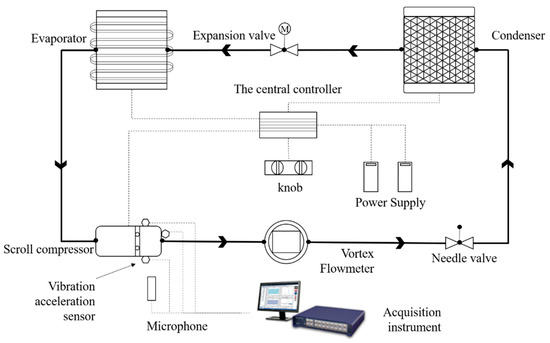
Figure 3.
Experimental platform schematic diagram.

Table 1.
Parameters of scroll compressor.
The sensor and signal acquisition system is composed of a vibration acceleration sensor, noise sensor, notebook computer and data acquisition instrument. Through the vibration acceleration sensor and microphone installed at each position of the compressor, the vibration and noise signals are collected. As a vibration acceleration sensor, PCB PIEZOTRONICS is adopted. Three sensors are arranged in the x, y and z directions of the compressor, with sensitivities of 10.38, 10.23 and 9.94 mV/m/s2. SKC condenser microphone is used as noise sensor. It is arranged beside the scroll compressor with a sensitivity of 51.6 mV/Pa. YIHENG 16-channel data acquisition instrument is used as the acquisition instrument, and the experimental sampling rate is 5120 HZ. Finally, 800 data samples of two faults were collected and divided into three groups. 75% of the samples were used as training sets to train the fault diagnosis model proposed in this study. 25% is taken as test sets, and the comprehensive performance of the model is evaluated by evaluation indicators. In addition, 20% of training sets are selected as validation sets to optimize the model parameters.
3.2. Faults Setup Method
- (1)
- Main shaft wear failure
As the core component and power source of the scroll compressor, the main shaft will wear or even break during improper operation. The operation of scroll compressor and air conditioning system is affected. During this failure test, the faults are simulated by grinding the main shaft.
- (2)
- Condenser blockage fault
The performance of the condenser possesses a significant impact on the operating efficiency of the air conditioning system. The fan of the condenser cools and dissipates heat through air cooling. Improper operation may cause foreign matters to enter the fan and cause blockage. This will cause the refrigerant to return to the compressor in the system, thus causing mechanical failure. The fault is simulated by blocking the fan and reducing its air inlet area in this study.
4. Results and Discussion
All codes run on a notebook computer, operating system 64-bit Windows 10, processor Intel Core i5-7300, running memory 24 G.
4.1. Data Preprocessing
The data preprocessing is composed of four parts in this study: sample sets feature enhancement, data mixing, data normalization, and PCA dimension reduction. Feature frequencies in the original data are extracted by the DPCA method, and sample sets with stronger features are loaded into the VGG-PCA model. Then the data of sample sets are mixed, which can prevent the occurrence of model jitter and over-fitting. To improve the CR of the model and prevent gradient explosion, sample sets are normalized. Through the PCA method, the main features of sample sets are extracted, dimensions of features are reduced. The running time of the model is reduced, and the running efficiency is improved. In Section 4.3, PCA results will be discussed.
4.2. DPCA Method Performance Evaluation
In this study, the feature enhancement method is used for sample sets preprocessing, namely the DPCA method, to compare the impact of different sample sets on the performance of the VGG-PCA model. As a control group, time-domain images are obtained from the same data. Time-domain sets are created and compared with DPCA sets. After training and testing in the VGG-PCA model. PCA results are shown in Figure 4, and the sample distribution range is represented by the ellipse. Through the PCA result of time domain sets. The data sample coincidence rate of the two faults is high, and the two kinds of faults cannot be identified by time domain image. The PCA result of DPCA sets is shown in Figure 4b. The two faults are identified effectively, and the sample coincidence rate is reduced. This offers a guarantee for the VGG-PCA model’s parameter optimization.
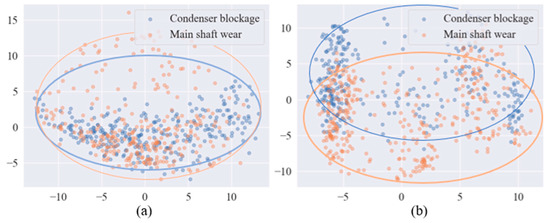
Figure 4.
PCA results of DPCA sets and time domain sets. (a) Time domain set (b) DPCA set.
Through the PCA method, the sample sets dimension is reduced. The model is loaded with two sample sets for training, testing, and verification. Model parameters are described as follows: the loss function is sparse categorical cross-entropy, the model training batch is 128, and the number of training times is 20. The relationship between training CR, validation CR, training loss, validation loss and training times of the two sample sets are shown in Figure 5. The training CR and validation CR of the two sample sets are positively correlated with the training times. DPCA sets are 10% higher than time domain sets in training CR and validation CR. As shown in Figure 5c,d, the training loss and validation loss of the two sample sets are negatively correlated with the training times. Compared with time domain sets, DPCA sets possesses lower training loss and validation loss. With the increase in training times, the loss difference between the two sample sets is increased.
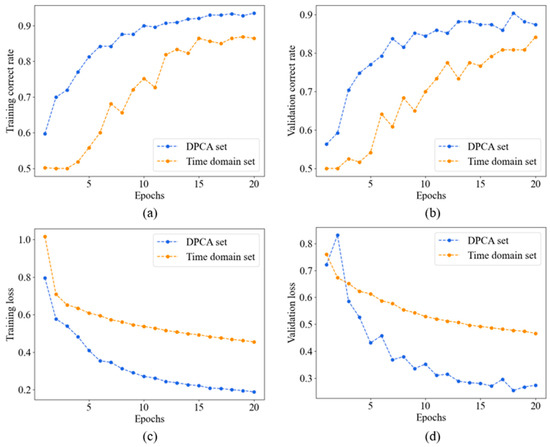
Figure 5.
Training and verification results of DPCA sets and time domain sets. (a) Training CR, (b) validation CR, (c) training loss, (d) validation loss.
After the model diagnosis is completed, the CR and running time are obtained by using the evaluation function. The CR of the model with DPCA sets is 97.76%, and the CR of the model with time domain sets is 84%. The running time is 92.92 and 86.47, respectively. Compared with time domain sets, the CR of the DPCA sets model is 16.38% higher. This shows that the CR of the VGG-PCA model is improved by using the DPCA method.
4.3. VGG-PCA Model Performance Evaluation
In this study, the machine learning method is applied to the fault diagnosis of the air conditioning system, namely the VGG-PCA method. To compare the fault diagnosis performance of different machine learning methods, the VGG16 model and the CNN model are used for fault diagnosis. VGG16 model is a model with 16 weight layers. It was proposed by the Visual Geometry Group of Oxford University and possesses good image classification ability. The CNN model is composed of two convolution layers, two pooling layers and two full connection layers. As a control group, the CNN model has a shallow network structure. This shows the importance of deeper network structures for the performance of the VGG-PCA model. To more clearly compare the diagnostic performance, the parameters of the three models are the same. The learning rate is 0.001, the batch size is 128, the epochs are 20, and the proportion of verification sets in training sets is 20%. The influence of unrelated variables is reduced. The training and verification results of the three models are shown in Figure 6. Compared with VGG16 and CNN models, higher CR and lower loss are owned by the VGG-PCA model, and the model performance is in the leading position in training and testing. As shown in Figure 7, compared with the other two models, the CR of the VGG-PCA model was enhanced by 17.1% and 20.32%, and the running time of 69.25% and 64.53% was saved. This shows that good diagnostic performance is owned by the VGG-PCA model. The running time has been shortened and the CR has been improved.
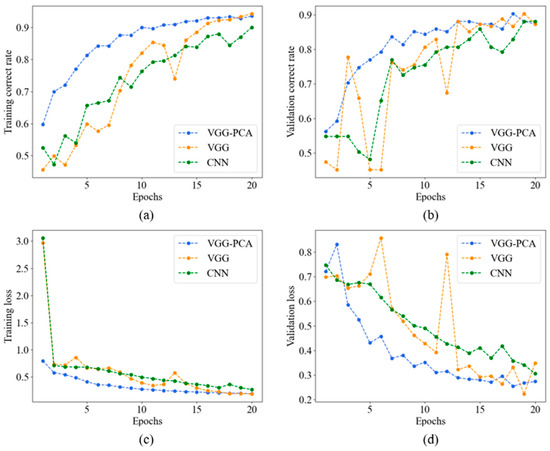
Figure 6.
Training and verification results of three models. (a) Training CR, (b) validation CR, (c) training loss, (d) validation loss.
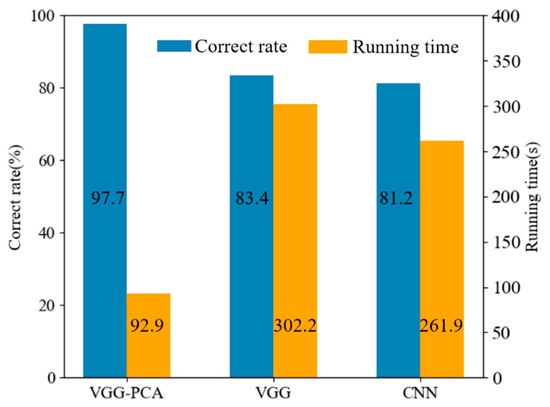
Figure 7.
Performances of fault diagnosis of three models.
5. Model Parameter Optimization Strategy
In this section, the optimal parameter range is obtained through testing and analysis. The selected parameters include epochs, batch size and learning rate. Then, the proposed parameter optimization method is applied to the VGG-PCA model.
5.1. Fault Diagnosis Results of VGG-PCA Model with Different Epochs
The working times of the learning algorithm are defined by epochs. With the inappropriate epochs, the model will be under-fitted or over-fitted, and the fault diagnosis performance will decrease. Therefore, it is important to select appropriate epochs. The effect of different epochs on the CR and running time is shown in Figure 8. The CR is 52.23% with the 1 epoch, and a large amount of running time is consumed. With the increase of epochs, the CR rises rapidly and maintains a high level, and the running time rises slowly. Therefore, the reasonable epochs range is 10 to 30. The CR is guaranteed and the time cost is saved. In this study, the epochs are 20.
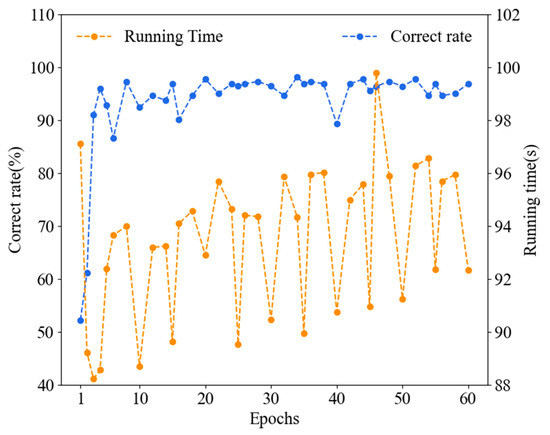
Figure 8.
Performances of fault diagnosis based on the VGG-PCA model with different epochs.
5.2. Fault Diagnosis Results of VGG-PCA Model with Different Batch Sizes
Batch size is the number of samples selected for one training, and the optimization degree and speed of the model are affected by it. Figure 9 shows the model diagnosis performance with the different batch sizes. The batch size range is 16 to 256. If the batch size is too small or large, more time will be spent on model fault diagnosis. The reasonable batch size range is 64 to 160. In this range, less running time and better CR of the model are possessed. The batch size is 128 in this study.
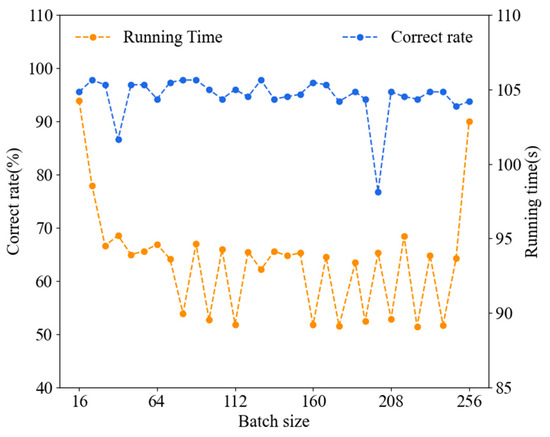
Figure 9.
Performances of fault diagnosis based on the VGG-PCA model with different batch sizes.
5.3. Fault Diagnosis Results of VGG-PCA Model with Different Learning Rates
In this section, the influence of the learning rate on fault diagnosis performance of the VGG-PCA model is analyzed. With an excessive or small learning rate selected, the diagnostic performances of the model will be reduced. Figure 10 shows the effect of different learning rates on the diagnostic performance of the model. For better observation, the learning rate is set with exponential growth, ranging from to (4.5 × to 0.60653). In the range of to , the CR is stable at a high level. The CR decreases rapidly with the learning rate. If the learning rate is greater than , the CR decreases slowly, and stabilizes at 44.2%. The better fault diagnosis performance of the model is obtained with the range in to . In this range, the learning rate is feasible.
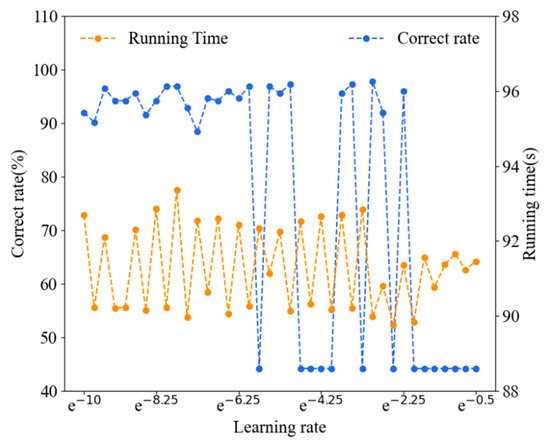
Figure 10.
Performances of fault diagnosis based on the VGG-PCA model with different learning rates.
6. Conclusions
A novel fault diagnosis method for the air conditioning system is established by the DPCA method and the VGG-PCA model. The DPCA method is applied in the field of image feature enhancement. Through the model evaluation method and two typical faults, the effectiveness of the method was verified. To optimize the selection of parameters, a parameter selection strategy for the model is developed. The main conclusions are as follows:
(1) To enhance image features, the DPCA method is applied in this study. DPCA sets with stronger features are obtained, the two faults sample coincidence rate is reduced. Compared with time domain sets, the model’s CR increased by 16.38%.
(2) VGG-PCA model possesses good diagnostic performance. Data dimension is reduced with the PCA method. Compared with the VGG16 model and CNN model, the CR is increased by 17.1% and 20.32%, and the running time is reduced by 69.25% and 64.53%, respectively.
(3) Through a large number of tests, the reference range of epochs, batch size and learning rate of the VGG-PCA model has been obtained. The model parameter optimization strategy is as follows: the range of epochs is 10 to 30, the range of batch size is 64 to 160, and the range of learning rate is to .
In subsequent research, the PCA method will be combined with more machine learning models to explore more efficient fault diagnosis strategies. To discuss the application potential of the model, more experiments of the air conditioning system were carried out.
Author Contributions
Y.S.: Conceptualization, Methodology, Software and Editing. Q.M.: Data curation, Experiments, Writing-Original draft preparation. T.Z.: Experiments, Investigation. F.L.: Software, Validation. Y.Y.: Investigation, Writing- Reviewing. All authors have read and agreed to the published version of the manuscript.
Funding
This work was supported by the Open Foundation of State Key Laboratory of Compressor Technology (Compressor Technology Laboratory of Anhui Province), No. SKL-YSJ202108; the Natural Science Foundation of Shandong Province, China (No. ZR2021QE157); the Plan of Guidance and Cul-tivation for Young Innovative Talents of Shandong Provincial Colleges and Universities.
Institutional Review Board Statement
Not applicable.
Informed Consent Statement
Not applicable.
Data Availability Statement
No new data were created or analyzed in this study. Data sharing is not applicable to this article.
Acknowledgments
Authors would like to thank Simonyan and Zisserman for sharing the VGG16 codes publicly.
Conflicts of Interest
The authors declare no conflict of interest.
References
- Zhang, P.; Dong, W.; Wang, L.; Sun, W.; Liu, B.; Yang, Z.; Liu, G. Failure analysis of micro-channel condenser of air source heat pump water heater. Eng. Fail. Anal. 2021, 122, 105250. [Google Scholar] [CrossRef]
- Zhou, Z.; Wang, J.; Chen, H.; Wei, W.; Xu, C. An online compressor liquid floodback fault diagnosis method for variable refrigerant flow air conditioning system. Int. J. Refrig. 2019, 111, 9–19. [Google Scholar] [CrossRef]
- Wang, J.; Li, G.; Chen, H.; Liu, J.; Guo, Y.; Hu, Y.; Li, J. Liquid floodback detection for scroll compressor in a VRF system under heating mode. Appl. Therm. Eng. 2017, 114, 921–930. [Google Scholar] [CrossRef]
- Singh, G.; Kumar, T.A.; Naikan, V. Efficiency monitoring as a strategy for cost effective maintenance of induction motors for minimizing carbon emission and energy consumption. Reliab. Eng. Syst. Saf. 2019, 184, 193–201. [Google Scholar] [CrossRef]
- Guo, Y.; Tan, Z.; Chen, H.; Li, G.; Wang, J.; Huang, R.; Liu, J.; Ahmad, T. Deep learning-based fault diagnosis of variable refrigerant flow air-conditioning system for building energy saving. Appl. Energy 2018, 225, 732–745. [Google Scholar] [CrossRef]
- Salih Hasan, B.M.; Abdulazeez, A.M. A Review of Principal Component Analysis Algorithm for Dimensionality Reduction. J. Soft Comput. Data Min. 2021, 2, 20–30. [Google Scholar] [CrossRef]
- Ayesha, S.; Hanif, M.K.; Talib, R. Overview and comparative study of dimensionality reduction techniques for high dimensional data. Inf. Fusion 2020, 59, 44–58. [Google Scholar] [CrossRef]
- Liu, J.; Li, G.; Chen, H.; Wang, J.; Guo, Y.; Li, J. A robust online refrigerant charge fault diagnosis strategy for VRF systems based on virtual sensor technique and PCA-EWMA method. Appl. Therm. Eng. 2017, 119, 233–243. [Google Scholar] [CrossRef]
- Liu, J.; Hu, Y.; Chen, H.; Wang, J.; Li, G.; Hu, W. A refrigerant charge fault detection method for variable refrigerant flow (VRF) air-conditioning systems. Appl. Therm. Eng. 2016, 107, 284–293. [Google Scholar] [CrossRef]
- Song, Y.; Liu, Z.; Hou, R.; Gao, H.; Huang, B.; Wu, D.; Liu, J. Research on electromagnetic and vibration characteristics of dynamic eccentric PMSM based on signal demodulation. J. Sound Vib. 2022, 541, 117320. [Google Scholar] [CrossRef]
- Alkhayrat, M.; Aljnidi, M.; Aljoumaa, K. A comparative dimensionality reduction study in telecom customer segmentation using deep learning and PCA. J. Big Data 2020, 7, 9. [Google Scholar] [CrossRef]
- Xu, X.; Xiao, F.; Wang, S. Enhanced chiller sensor fault detection, diagnosis and estimation using wavelet analysis and principal component analysis methods. Appl. Therm. Eng. 2008, 28, 226–237. [Google Scholar] [CrossRef]
- Guo, Y.; Li, G.; Chen, H.; Hu, Y.; Li, H.; Xing, L.; Hu, W. An enhanced PCA method with Savitzky-Golay method for VRF system sensor fault detection and diagnosis. Energy Build. 2017, 142, 167–178. [Google Scholar] [CrossRef]
- Xiao, F.; Wang, S.; Xu, X.; Ge, G. An isolation enhanced PCA method with expert-based multivariate decoupling for sensor FDD in air-conditioning systems. Appl. Therm. Eng. 2009, 29, 712–722. [Google Scholar] [CrossRef]
- Song, Y.; Liu, J.; Chu, N.; Wu, P.; Wu, D. A novel demodulation method for rotating machinery based on time-frequency analysis and principal component analysis. J. Sound Vib. 2018, 442, 645–656. [Google Scholar] [CrossRef]
- Song, Y.; Liu, J.; Cao, L.; Chu, N.; Wu, D. Robust passive underwater acoustic detection method for propeller. Appl. Acoust. 2018, 148, 151–161. [Google Scholar] [CrossRef]
- Sikirica, A.; Grbčić, L.; Kranjčević, L. Machine learning based surrogate models for microchannel heat sink optimization. Appl. Therm. Eng. 2023, 222, 119917. [Google Scholar] [CrossRef]
- Soori, M.; Arezoo, B.; Dastres, R. Machine learning and artificial intelligence in CNC machine tools, A review. Sustain. Manuf. Serv. Econ. 2023, 100009. [Google Scholar] [CrossRef]
- Lei, Q.; Zhang, C.; Shi, J.; Chen, J. Machine learning based refrigerant leak diagnosis for a vehicle heat pump system. Appl. Therm. Eng. 2022, 215, 118524. [Google Scholar] [CrossRef]
- Tóth, P.; Garami, A.; Csordás, B. Image-based deep neural network prediction of the heat output of a step-grate biomass boiler. Appl. Energy 2017, 200, 155–169. [Google Scholar] [CrossRef]
- Campos, V.; Sastre, F.; Yagües, M.; Bellver, M.; Giró-I-Nieto, X.; Torres, J. Distributed training strategies for a computer vision deep learning algorithm on a distributed GPU cluster. Procedia Comput. Sci. 2017, 108, 315–324. [Google Scholar] [CrossRef]
- Martinez, A.M.C.; Mallidi, S.H.; Meyer, B.T. On the relevance of auditory-based Gabor features for deep learning in robust speech recognition. Comput. Speech Lang. 2017, 45, 21–38. [Google Scholar] [CrossRef]
- Long, E.; Lin, H.; Liu, Z.; Wu, X.; Wang, L.; Jiang, J.; An, Y.; Lin, Z.; Li, X.; Chen, J.; et al. An artificial intelligence platform for the multihospital collaborative management of congenital cataracts. Nat. Biomed. Eng. 2017, 1, 24. [Google Scholar] [CrossRef]
- Sun, K.; Li, G.; Chen, H.; Liu, J.; Li, J.; Hu, W. A novel efficient SVM-based fault diagnosis method for multi-split air conditioning system’s refrigerant charge fault amount. Appl. Therm. Eng. 2016, 108, 989–998. [Google Scholar] [CrossRef]
- Shi, S.; Li, G.; Chen, H.; Liu, J.; Hu, Y.; Xing, L.; Hu, W. Refrigerant charge fault diagnosis in the VRF system using Bayesian artificial neural network combined with ReliefF filter. Appl. Therm. Eng. 2017, 112, 698–706. [Google Scholar] [CrossRef]
- Han, H.; Gu, B.; Kang, J.; Li, Z. Study on a hybrid SVM model for chiller FDD applications. Appl. Therm. Eng. 2011, 31, 582–592. [Google Scholar] [CrossRef]
- Zhao, Y.; Wang, S.; Xiao, F. Pattern recognition-based chillers fault detection method using Support Vector Data Description (SVDD). Appl. Energy 2013, 112, 1041–1048. [Google Scholar] [CrossRef]
- Yan, K.; Shen, W.; Mulumba, T.; Afshari, A. ARX model based fault detection and diagnosis for chillers using support vector machines. Energy Build. 2014, 81, 287–295. [Google Scholar] [CrossRef]
- Yan, K.; Zhou, X. Chiller faults detection and diagnosis with sensor network and adaptive 1D CNN. Digit. Commun. Networks 2022, 8, 531–539. [Google Scholar] [CrossRef]
- Miyata, S.; Lim, J.; Akashi, Y.; Kuwahara, Y.; Tanaka, K. Fault detection and diagnosis for heat source system using convolutional neural network with imaged faulty behavior data. Sci. Technol. Built Environ. 2019, 26, 52–60. [Google Scholar] [CrossRef]
Disclaimer/Publisher’s Note: The statements, opinions and data contained in all publications are solely those of the individual author(s) and contributor(s) and not of MDPI and/or the editor(s). MDPI and/or the editor(s) disclaim responsibility for any injury to people or property resulting from any ideas, methods, instructions or products referred to in the content. |
© 2023 by the authors. Licensee MDPI, Basel, Switzerland. This article is an open access article distributed under the terms and conditions of the Creative Commons Attribution (CC BY) license (https://creativecommons.org/licenses/by/4.0/).