Review

Spectroscopic Methods for the Detection of Microbial Pathogens and Diagnostics of Infectious Diseases—An Updated Overview

by
Subramani Pandian
1,
Selvaraj Alagu Lakshmi
2,†,
Arumugam Priya
3,†,
Boopathi Balasubramaniam
4,†,
John-Lewis Zinia Zaukuu
5,
Ravindran Durgadevi
6,
Vincent Abe-Inge
7 and
Soo-In Sohn
1,*
1
Department of Agricultural Biotechnology, National Institute of Agricultural Sciences, Rural Development Administration, Jeonju 54874, Republic of Korea
2
Department of Microbiology and Molecular Genetics, The Hebrew University, Jerusalem 9112001, Israel
3
Department of Biological Sciences, North Carolina State University, Raleigh, NC 27606, USA
4
Department of Molecular Biology, University of Wyoming, Laramie, WY 82071, USA
5
Department of Food Science and Technology, Kwame Nkrumah University of Science and Technology (KNUST), Kumasi 00233, Ghana
6
Department of Biotechnology, Vels Institute of Science, Technology & Advanced Studies, Chennai 600117, Tamil Nadu, India
7
Department of Bioresource Engineering, McGill University, Montreal, QC H9X 3V9, Canada
*
Author to whom correspondence should be addressed.
These authors contributed equally to this work.
Processes 2023, 11(4), 1191; https://doi.org/10.3390/pr11041191
Submission received: 7 March 2023 / Revised: 6 April 2023 / Accepted: 11 April 2023 / Published: 12 April 2023

Abstract

:
Microbial pathogens cause a quarter of all deaths worldwide annually due to deadly infectious diseases. Nevertheless, the fast and precise identification of pathogens remains one of the most challenging tasks in the medical sector. Early identification and characterization of microbes through medical diagnosis could pave the way for specific treatment strategies that could dramatically improve infection management, reduce healthcare costs, mitigate increasing antimicrobial resistance, and save numerous lives. To date, numerous traditional and molecular methods have been employed to diagnose illnesses with proven accuracy, reliability, and efficiency. Here, we have reviewed the most reliable tools that are prerequisites for the rapid detection of microbes. In particular, the remarkable roles of surface-enhanced Raman scattering, Fourier-transform infrared, electrochemical impedance, near-infrared, and MALDI-TOF/TOF in the identification and characterization of pathogenic microbes are discussed in detail. The approaches described herein cover broad ranges of biomedical applications, including the diagnosis of clinical infectious diseases, epidemiology, detection of vector-borne diseases, food security, phytosanitary monitoring, biosensing, and food- and waterborne pathogen detection. Considering the current pandemic outbreak, this review briefly emphasizes the importance of rapid detection and upgraded tools for early diagnosis to prevent the loss of lives.

1. Introduction

Microbial proliferation and evaluation are essential to the clinical microbial assay regime, which usually takes 24 to 48 h. The most common diagnostic method takes several days, even in state-of-the-art labs, as it has different stages, such as sample culturing, detection, identification of the bacteria, analysis of antibiotic susceptibility, etc. [1]. Broad-spectrum antibiotics are administered to patients during the identification process wait time, and the Centers for Disease Control and Prevention has reported that over 30% of people are treated unnecessarily [2]. Decades ago, a few molecular techniques were introduced for the detection of microbial pathogens, such as phenotyping, multilocus enzyme electrophoresis, plasmid profile analysis, chromosomal fingerprinting by restricted fragment length polymorphism, DNA probing, polymerase chain reaction, etc. [3]. Though these techniques were able to help diagnose previously difficult-to-detect pathogens, the need for rapid identification was not solved. Limitations, such as poor prognosis and late intervention, in earlier diagnosis methods led to the development of innovative technologies. The advancement of new methods has been utilized for fast and culture-free diagnosis of microbial pathogenesis [4,5,6,7]. Rapid diagnosis, treatment, and control of microbial infections are much needed to reduce morbidity and mortality caused by chronic infections [8,9]. Spectroscopy and its associated subsystems have been used recently for the identification of microbes [10,11,12,13], characterization of pathogenic biofilms [14,15,16,17,18], and the measurement of microbial pathogenicity [19,20,21,22]. Pathogen identification by micro-Raman spectroscopy can differentiate single bacterial cells non-destructively, efficiently, accurately, and automatically [23]. Spectra acquired through Raman spectroscopy will be compared to reference spectra from a database using this approach [24]. Due to its ability to detect single bacteria cells, this technology can be used immediately on microbial samples collected without the need for auxiliary support, and bacteria present in samples can be recognized without the need for sample culturing or preprocessing [25]. Several isolating procedures, such as magnetic separation, centrifugation, and filtration, are used to extract bacteria from the matrix. The main advantage of pairing the isolating procedures with Raman spectroscopy is that the bacteria from clinical samples may be directly identified, which aids in reducing time, energy, and manpower [26]. Surface-enhanced Raman scattering spectroscopy (SERS) [27] and MALDI-TOF/TOF tandem mass spectrometers [28,29] hold great promise for fast and accurate diagnosis of pathogenic infections, reducing diagnostic time and avoiding infection-related morbidity and death [30]. Furthermore, microbial phenotypes can be characterized and identified based on comparing the molecular compositions of output data. For the detection and identification of pathogens, spectroscopic approaches are largely employed. One of these is pyrolysis mass spectrometry, although its application is limited due to its cost-effectiveness. Other approaches, such as fluorescence spectroscopy, flow cytometry, and mass spectrometry, are being used for the identification of bacteria [31]. In addition, vibrational spectroscopic methods (such as FTIR and Raman spectroscopy) with artificial-intelligence-powered devices are used for the precise classification of microbes [31]. This review summarizes the current knowledge on the spectroscopic methods available for the identification and characterization of microbial pathogens, their application in diagnostics, and a future perspective on how these techniques can be advanced for the current clinical requirements.

2. Spectroscopic Methods for the Identification and Characterization of Microbial Pathogens

2.1. Wavelength-Based Microbial Growth Using Spectroscopic Analysis

Owing to their simplicity and quick response times, optical density (OD) measurements have been the favored technique in industrial and microbiological lab settings. An OD measurement, based on optical spectroscopy, measures the quantity of light lost owing to absorption and scattering at a single wavelength [32]. Bacteria are unicellular creatures without nuclei or organelles that are attached to membranes. A bacterial cell generally comprises a single chromosome of DNA (0.16 to 13 megabase pairs, depending on the species, with a mean and median of 3.65 and 3.46 megabase pairs, respectively), plasmids (small extrachromosomal DNA molecules), RNA, and proteins, all of which are accompanied by a phospholipid membrane and peptidoglycan cell wall [33]. Thirteen bacteria are classified as Gram-positive or Gram-negative based on the structures of their cell membranes. These changes in the exterior structure influence chemical absorption and antibiotic susceptibility. Bacteria are also classified by their shape, size, clustering propensity, and pathogenicity, which is followed by virulence [34].
In bacterium analysis, 600 nm is commonly utilized, giving rise to the name OD600nm. From the early research, it is considered that OD at 600nm directly corresponds to the cell concentration. Numerous investigations concluded that absorbance at 600nm is highly consistent and reproducible; nevertheless, these results were predicated on tolerating error rates of more than 50 percent [32,33]. Bacteria are known to produce pathogenic byproducts as they proliferate. These byproducts have the potential to improve absorption. As a result, these byproducts contribute to the signal in addition to the optical loss caused by scattering. Furthermore, the bacteria’s internal and subwavelength components might lead to a rise in optical loss, which in turn distinguishes the structural variability in bacteria [33]. Since the OD measurements are based on the concept that the scattering signal is directly proportional to the concentration of cells, any deviation may jeopardize this connection. Interestingly, few bacteria are smaller than the usual range, making them poor scatterers. When a certain concentration is achieved, bacteria will cluster together or form lengthy chains, depending on the non-growth signal. Given the differences in structure and development patterns across bacteria, a multiwavelength analysis strategy to enhance the signal’s accuracy would be helpful. While the OD600 approach is appealing because of its simplicity, single-wavelength measurement intensifies the variables of the recorded signal [32,33]. As a result, it is vital to thoroughly analyze the usefulness and accuracy of the present OD600 technique, especially considering past work indicating inconsistencies between different spectrophotometers and recent breakthroughs in optical spectroscopy and signal processing [35].

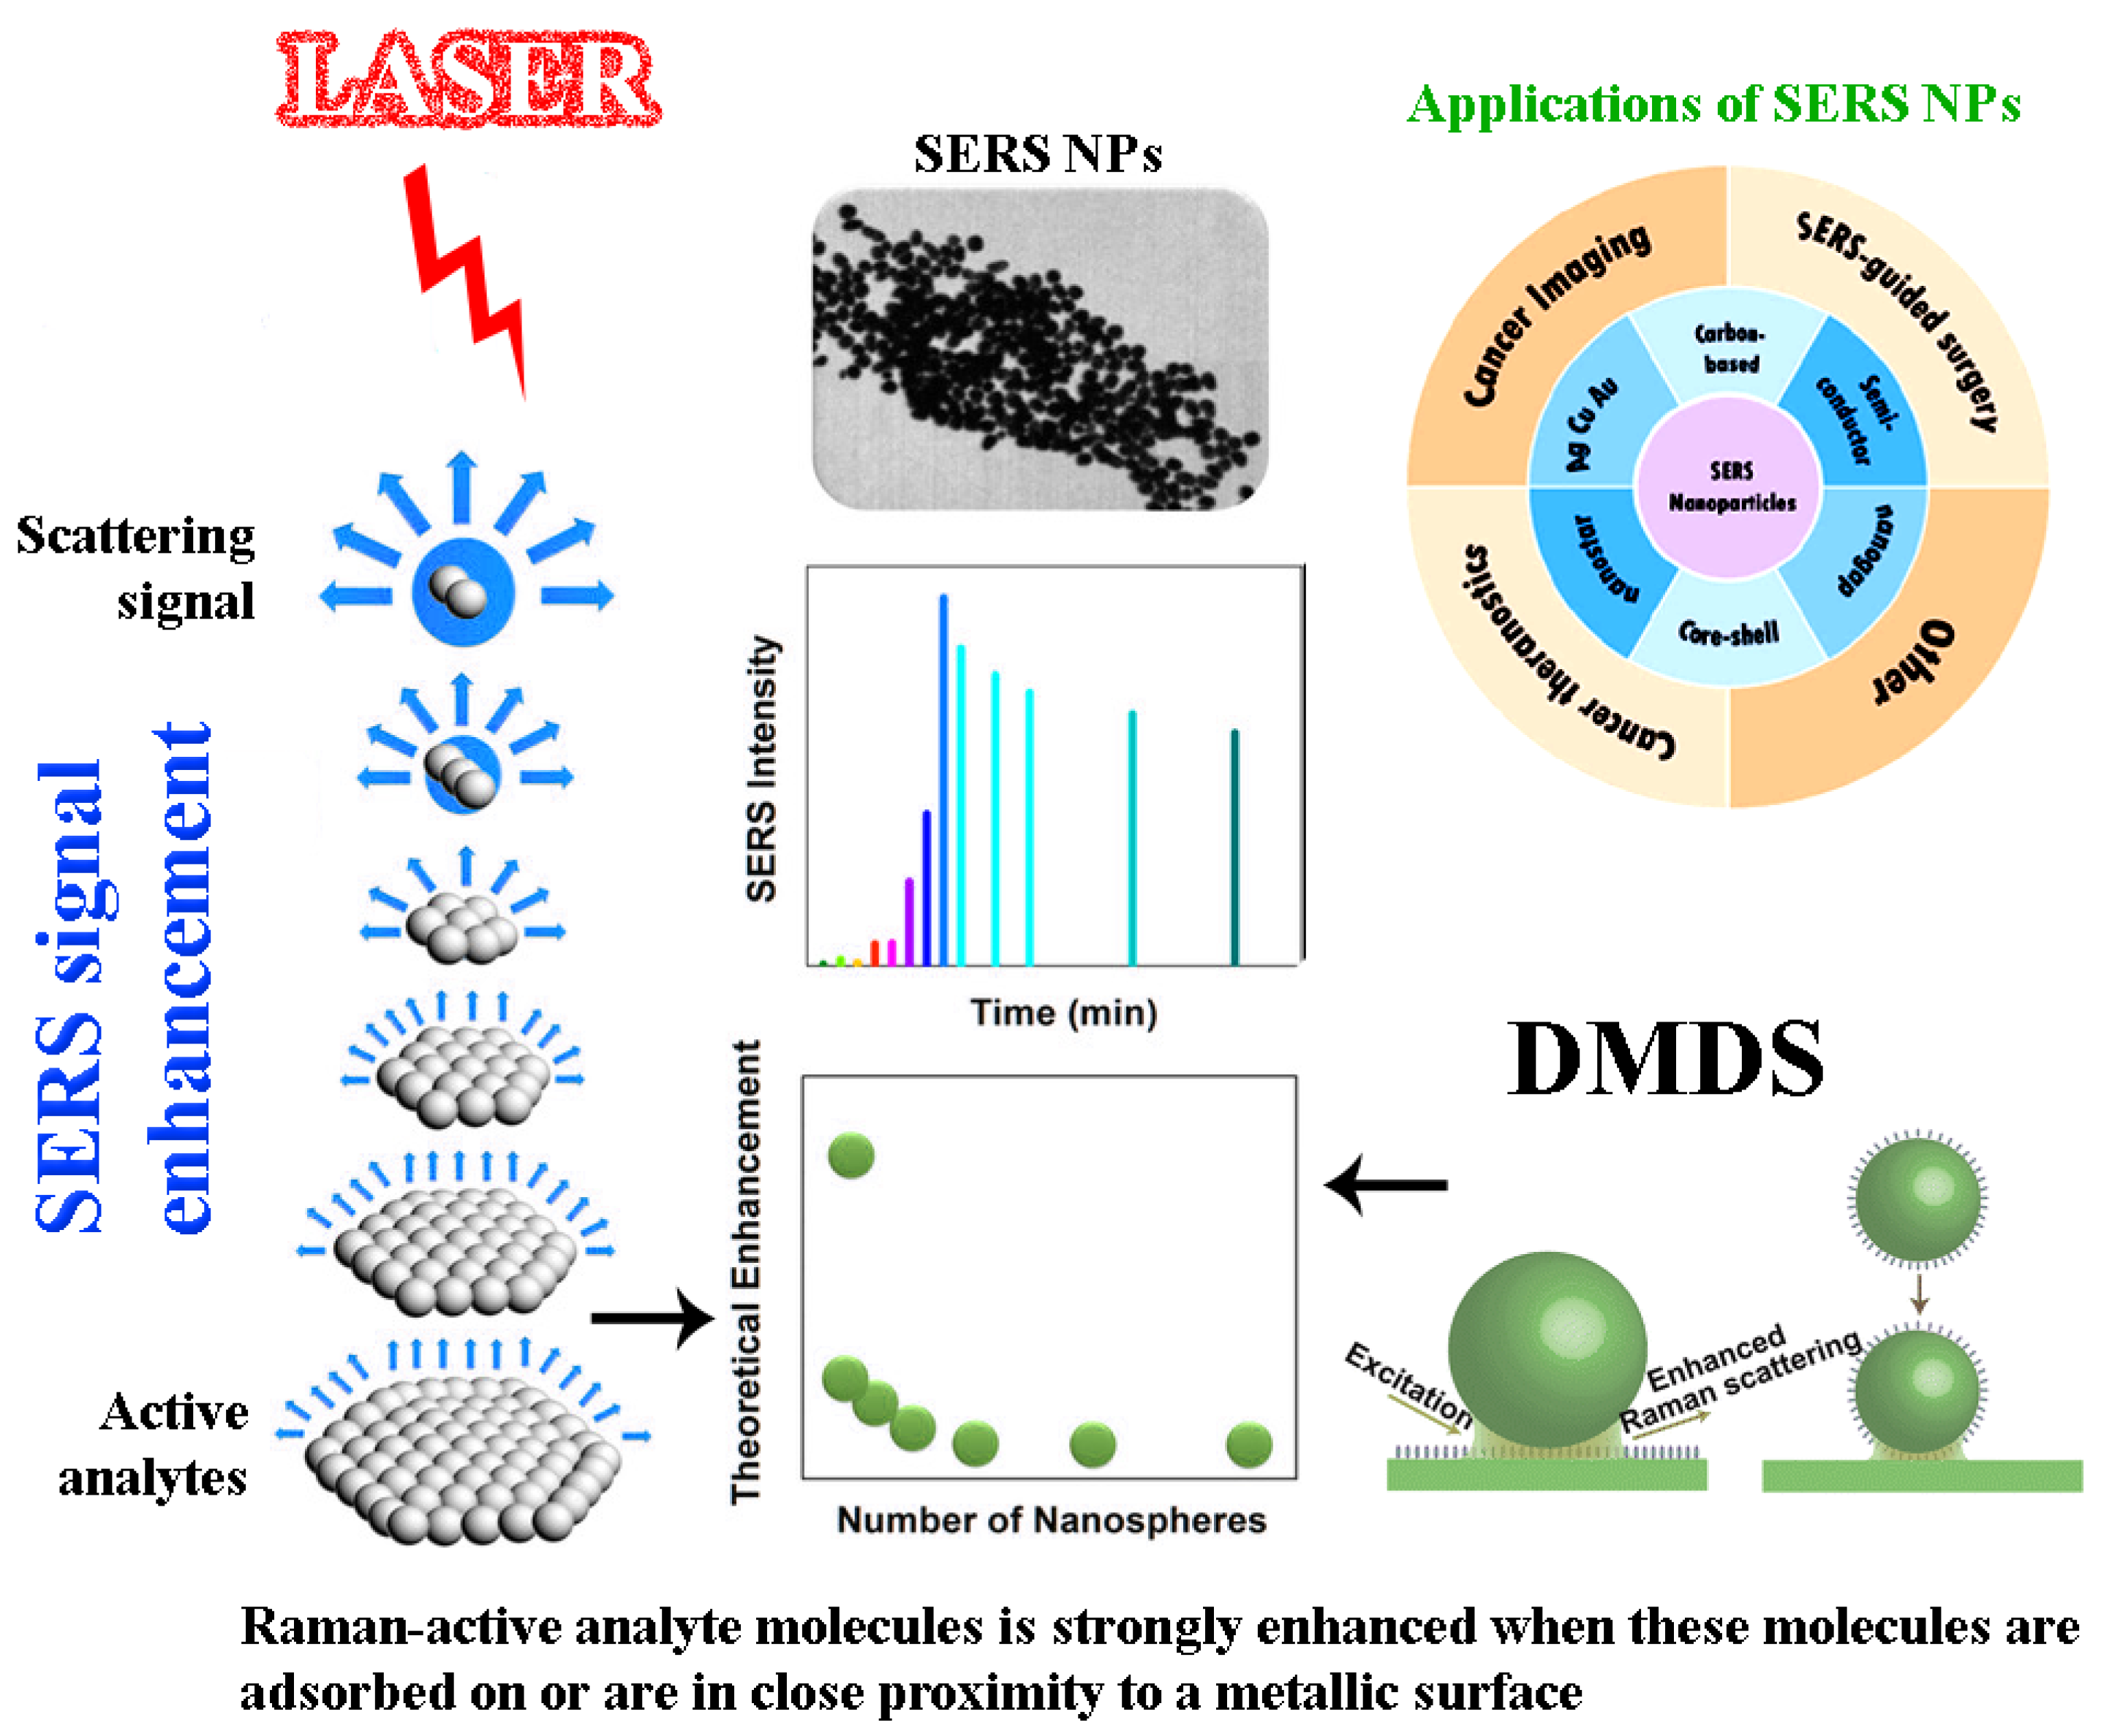
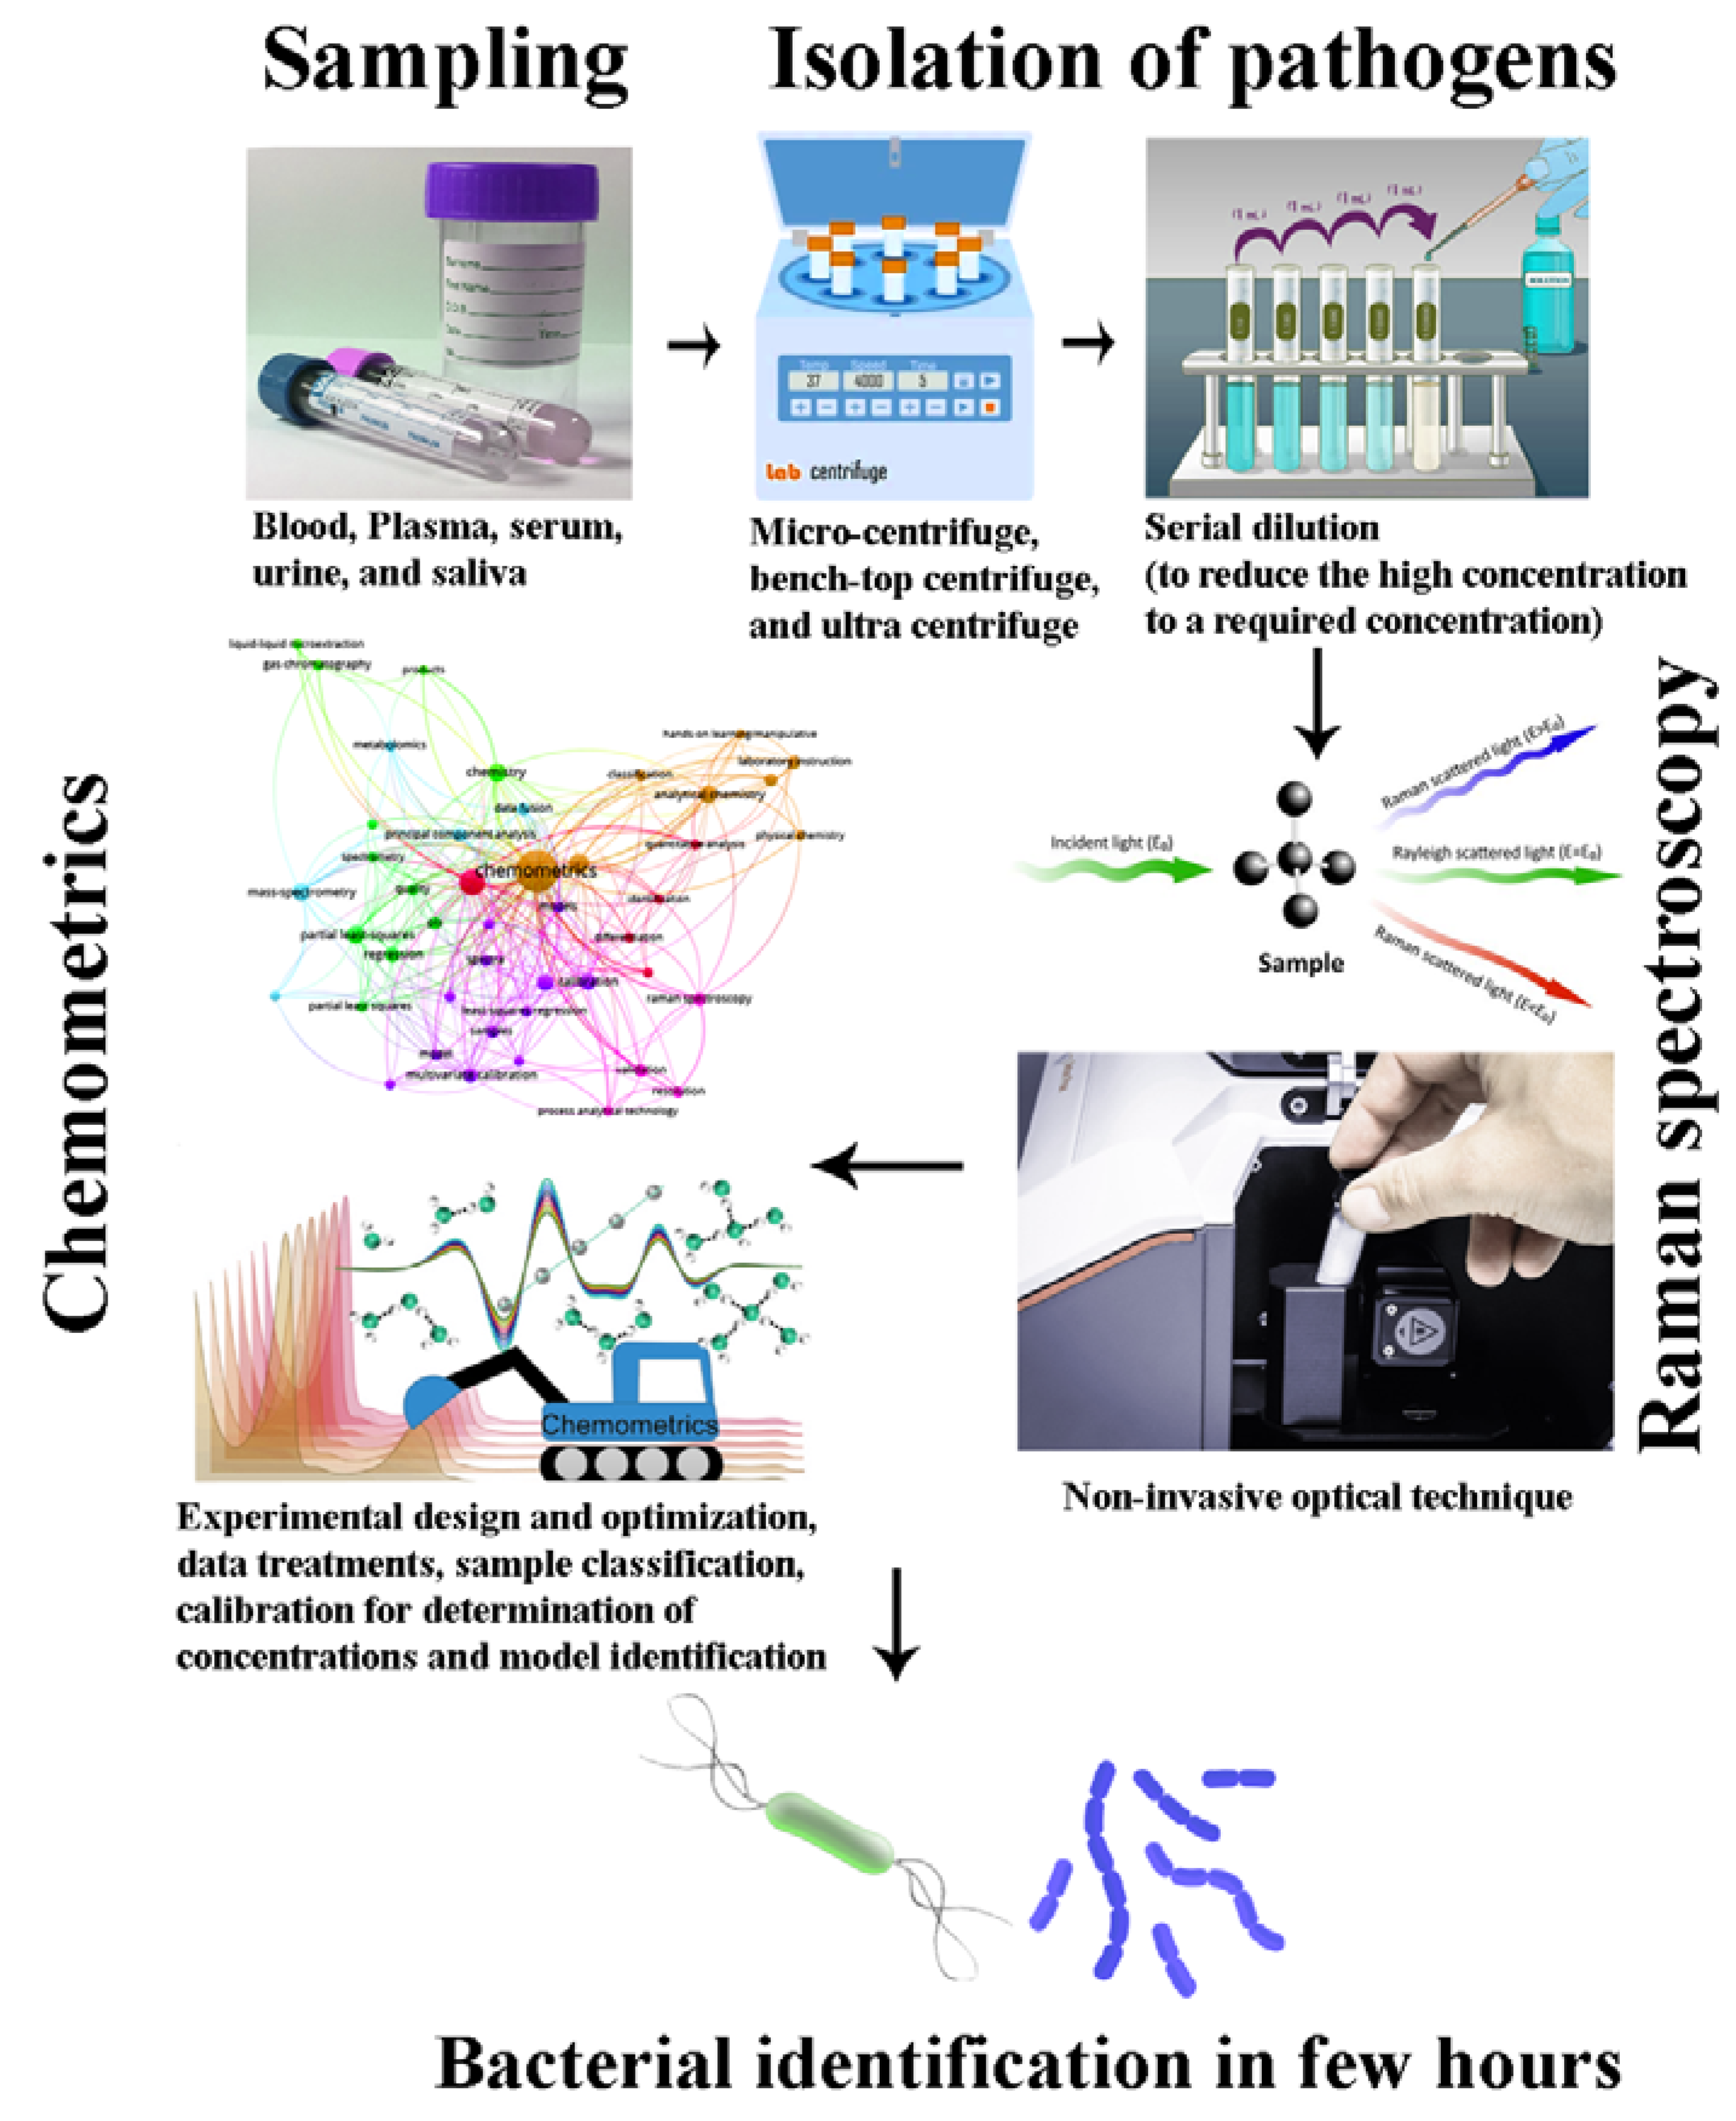
2.2. Surface-Enhanced Raman Spectroscopy (SERS)

Raman spectroscopy combined with nanotechnology may provide a promising foundation for the development of a new diagnostic system. With the use of nanotechnology, the ability of Raman spectroscopy has been demonstrated to increase [26]. With SERS-active nanoparticles, authors have shown imaging of a range of molecular targets and biological events, as well as in live animals [36]. Using nanoparticles as boosting substrates, SERS was created to amplify signals, improve overall resolution, and lower detection limits down to single molecules (Figure 1). For the identification and detection of microbial agents, silver nanorod supports have been created [37]. The length of nanorods has been shown to directly alter the observed signal intensity, resulting in enhancement factors of up to 5 × 10⁸. This device is a potentially viable pathogen diagnosis tool for defense and public healthcare professionals due to its rapid recordings, ease of use, and field-deployable potential [38]. Neng et al. [39] have developed an immunoassay-based SERS for the multiplex detection of viral antigens of West Nile virus and Rift Valley fever virus.
For instance, Ho et al. [40] used cutting-edge deep learning techniques to accurately identify the 30 most prevalent bacteria from noisy spectra, obtaining an accuracy of 99 percent via Raman spectroscopy. This novel method separates methicillin-resistant and -susceptible S. aureus isolates (MRSA and MSSA) and a pair of inoculated MRSA and MSSA that are genetically identical except for the deletion of the mecA resistance gene, indicating the possibility of culture-free antibiotic resistance detection [40]. In addition, Kotanen et al. [11] created an SERS-based analytic system for detecting and identifying bacteria in pooled human sera. The spectrum of bacteria retrieved from serum was compared to the spectrum of bacteria grown in pure culture. To find a bacterial “molecular fingerprint,” researchers used partial least squares differential and principal component analyses. There have also been some attempts to use Raman spectroscopy on tissues for in situ diagnosis of infectious diseases [11]. SERS is used as a biosensor for the rapid identification of microbes and spores. This technique overcomes the limitations of weak Raman signals, thereby lowering the detection limit to a single bacterium [41]. This is achieved by placing the samples in close proximity to a nanostructured noble metal surface, such as gold or silver, or other, non-metallic materials which strongly enhance the Raman signal [41]. Kloß et al. [42] employed Raman spectroscopy and chemometric assessment to effectively investigate ascitic fluid for pathogen identification, finding that 97.7% of Gram-positive bacteria spectra were properly classified at the genus level with 83.6% at the species level [42]. Maquelin et al. [43] employed Raman spectra to characterize microbial pathogens obtained from 115 blood cultures following 6 to 8 h incubation in an automatic culture system, with 109 samples containing bacteria and 6 samples including yeasts (92.2% identification accuracy) [43].
In a study, Liu et al. [44] developed a silver-nanorod-based SERS substrate for a wide- range differentiation of pathogenic bacteria. Out of 22 different pathogenic strains used in the study, 20 bacterial strains were clearly identified, including Francisella tularensis, Yersinia pestis, V. parahaemolyticus, Cryptococcus neoformans, Mycobacterium smegmatis, E. coli O157, S. aureus, Listeria spp., Salmonella spp., and Bacillus spp. Unique spectral features of each of the bacterial strains were analyzed, which allowed highly sensitive, selective, and specific bacterial identification [44].

2.3. Fourier Transform Infrared Spectroscopy (FTIR)

Raman and FTIR spectroscopies are effective tools for determining the chemical and molecular compositions of bioactive molecules [45]. The microspectroscopic methodology is considered superior to traditional histological and/or microscopic procedures since it is label-free, non-invasive, rapid, and less sensitive to human subjective analysis. The use of these alternative spectroscopic methods together can provide a more thorough approach to intact sample analysis and ensure the obtainment of more precise chemical information. At the microscopic level, the use of FT-IR and Raman vibrational spectrometers in conjunction with a microscope can offer critical information on chemical differences and spatial arrangements within and across distinct healthy and sick cells and tissues. The main differences between samples can be seen in the protein, lipid, and sugar regions of averaged spectra, as well as normalized spectra, which can be compared using the peak differences in the untreated samples without biofilm. The characteristic wavenumbers, as well as the recommended vibrational modes, are commonly attributed to the functional groups in specific biofilm components [46].
Absorbance spectra from the IR region of the electromagnetic spectrum are produced via FTIR spectroscopy. The sample absorbs the IR radiation from the spectrometer output in its path length, causing molecular components to be excited [47]. The electromagnetic spectrum’s infrared (IR) area is separated into three subregions: near-, mid-, and far-IR (NIR, MIR, and FIR regions). IR frequencies are commonly expressed in wavenumbers (cm−1), ranging from 10 cm−1 at the FIR region (near microwaves) to 10,000 cm−1 at the NIR region (near visible light) [47]. In general, medical microbiologists gather spectral data from the MIR region due to its biomolecular sensitivity across microorganisms and superior discriminatory power [48]. For FTIR spectroscopy of microbiological samples, there are three basic modalities of spectrum acquisition: attenuated total reflectance (ATR), transmittance, and diffuse reflection. Each of these is available for various sample types and provides spectroscopists with several benefits and limitations. In ATR-FTIR spectroscopy, samples are placed straight on an optically heavy crystal, which is a completely reflecting prism. An ATR plate emits an evanescent wave of IR radiation that passes obliquely through the sample, reflects off the crystal, and returns to the detector for digitalization. This approach is extremely handy and straightforward, cost-effective, repeatable, and, most importantly, requires minimal sample preparation [49].
Remarkably, Singh et al. [50] revealed a portable microfluidic device that separated practically all bacteria from complex biological matrices with a 99% success rate. As a result, feeding microbial cells isolated from complicated matrices into FTIR detection methods appears to be a viable alternative to bacterial culture and has already been used in several investigations to isolate foodborne pathogens. Al-Qadiri et al. [51] used filtered apple juice injected with strains of E. coli and Listeria spp. in one investigation. To distinguish between inocula filtered from apple juice, the researchers used the fingerprint region between 1500 cm−1 and 800 cm−1. Further advancement of this technique has the potential to improve illness detection and characterization, reduce spectral confounding variables, and lead to point-of-care diagnostics [51]. Donlan et al. [52] employed an ATR-FTIR biofilm reactor program to produce S. pneumoniae biofilm for 189 h, reporting successful measurements of biofilm carbohydrate (1200–900 cm−1) and protein (1650 cm−1 and 1550 cm−1) as they grew on the surface.

2.4. Electrochemical Impedance Spectroscopy (EIS)

Stewart established the relationship between bacterial growth and impedance in 1899 [53]. However, monitoring bacterial activity by assessing changes in the electrical impedance produced by growing bacterial cultures was not given much attention or effort until the 1970s [53]. The impedance approach has been demonstrated to be beneficial for estimating microbial biomass, detecting microbial metabolism, and determining the physiological condition of bacteria [54]. The impedance approach, as one of the primary electrochemical transductions, is proving to be a fruitful ground for the development of multidisciplinary methodologies for a variety of biological and biomedical detection applications [55]. This is due to several factors, including increased attention to impedance techniques prompted by the electrical properties of biological entities and/or biological reactions; impedance is one of the most successful strategies for developing label-free, non-invasive, and real-time methods for biological detection; and impedance as an automated detecting mechanism can easily be used with nanoscale devices, such as biosensors and biochips, to meet the growing demand [56]. The detection of metabolic activity may be performed in two ways: by direct or indirect methods. Impedance probes placed in liquid nutrient medium detect changes in bacterial metabolism occurring in the bulk of the growth medium through indirect measurements. The indirect approach, on the other hand, detects CO2 generated by microbes [57]. The CO2 generated by microbial biological activity interacts with the KOH solution in a separate compartment in an indirect impedance approach. The development of carbonates reduces the conductivity of the solution. Furthermore, these approaches necessitate the use of reference electrodes, therefore simplifying system downsizing and precluding their usage in low-volume samples [58]. EIS is mainly used to characterize the microbial activity and degradation of an antifouling coating subjected to SRB-inoculated modified Postgate B solution, in accordance with the study presented first by Permeh et al. [59]. The tests produced a convoluted impedance with several loops in the Nyquist diagram related to the protective film, surface-layer growth (biofilm), and steel contact [59].

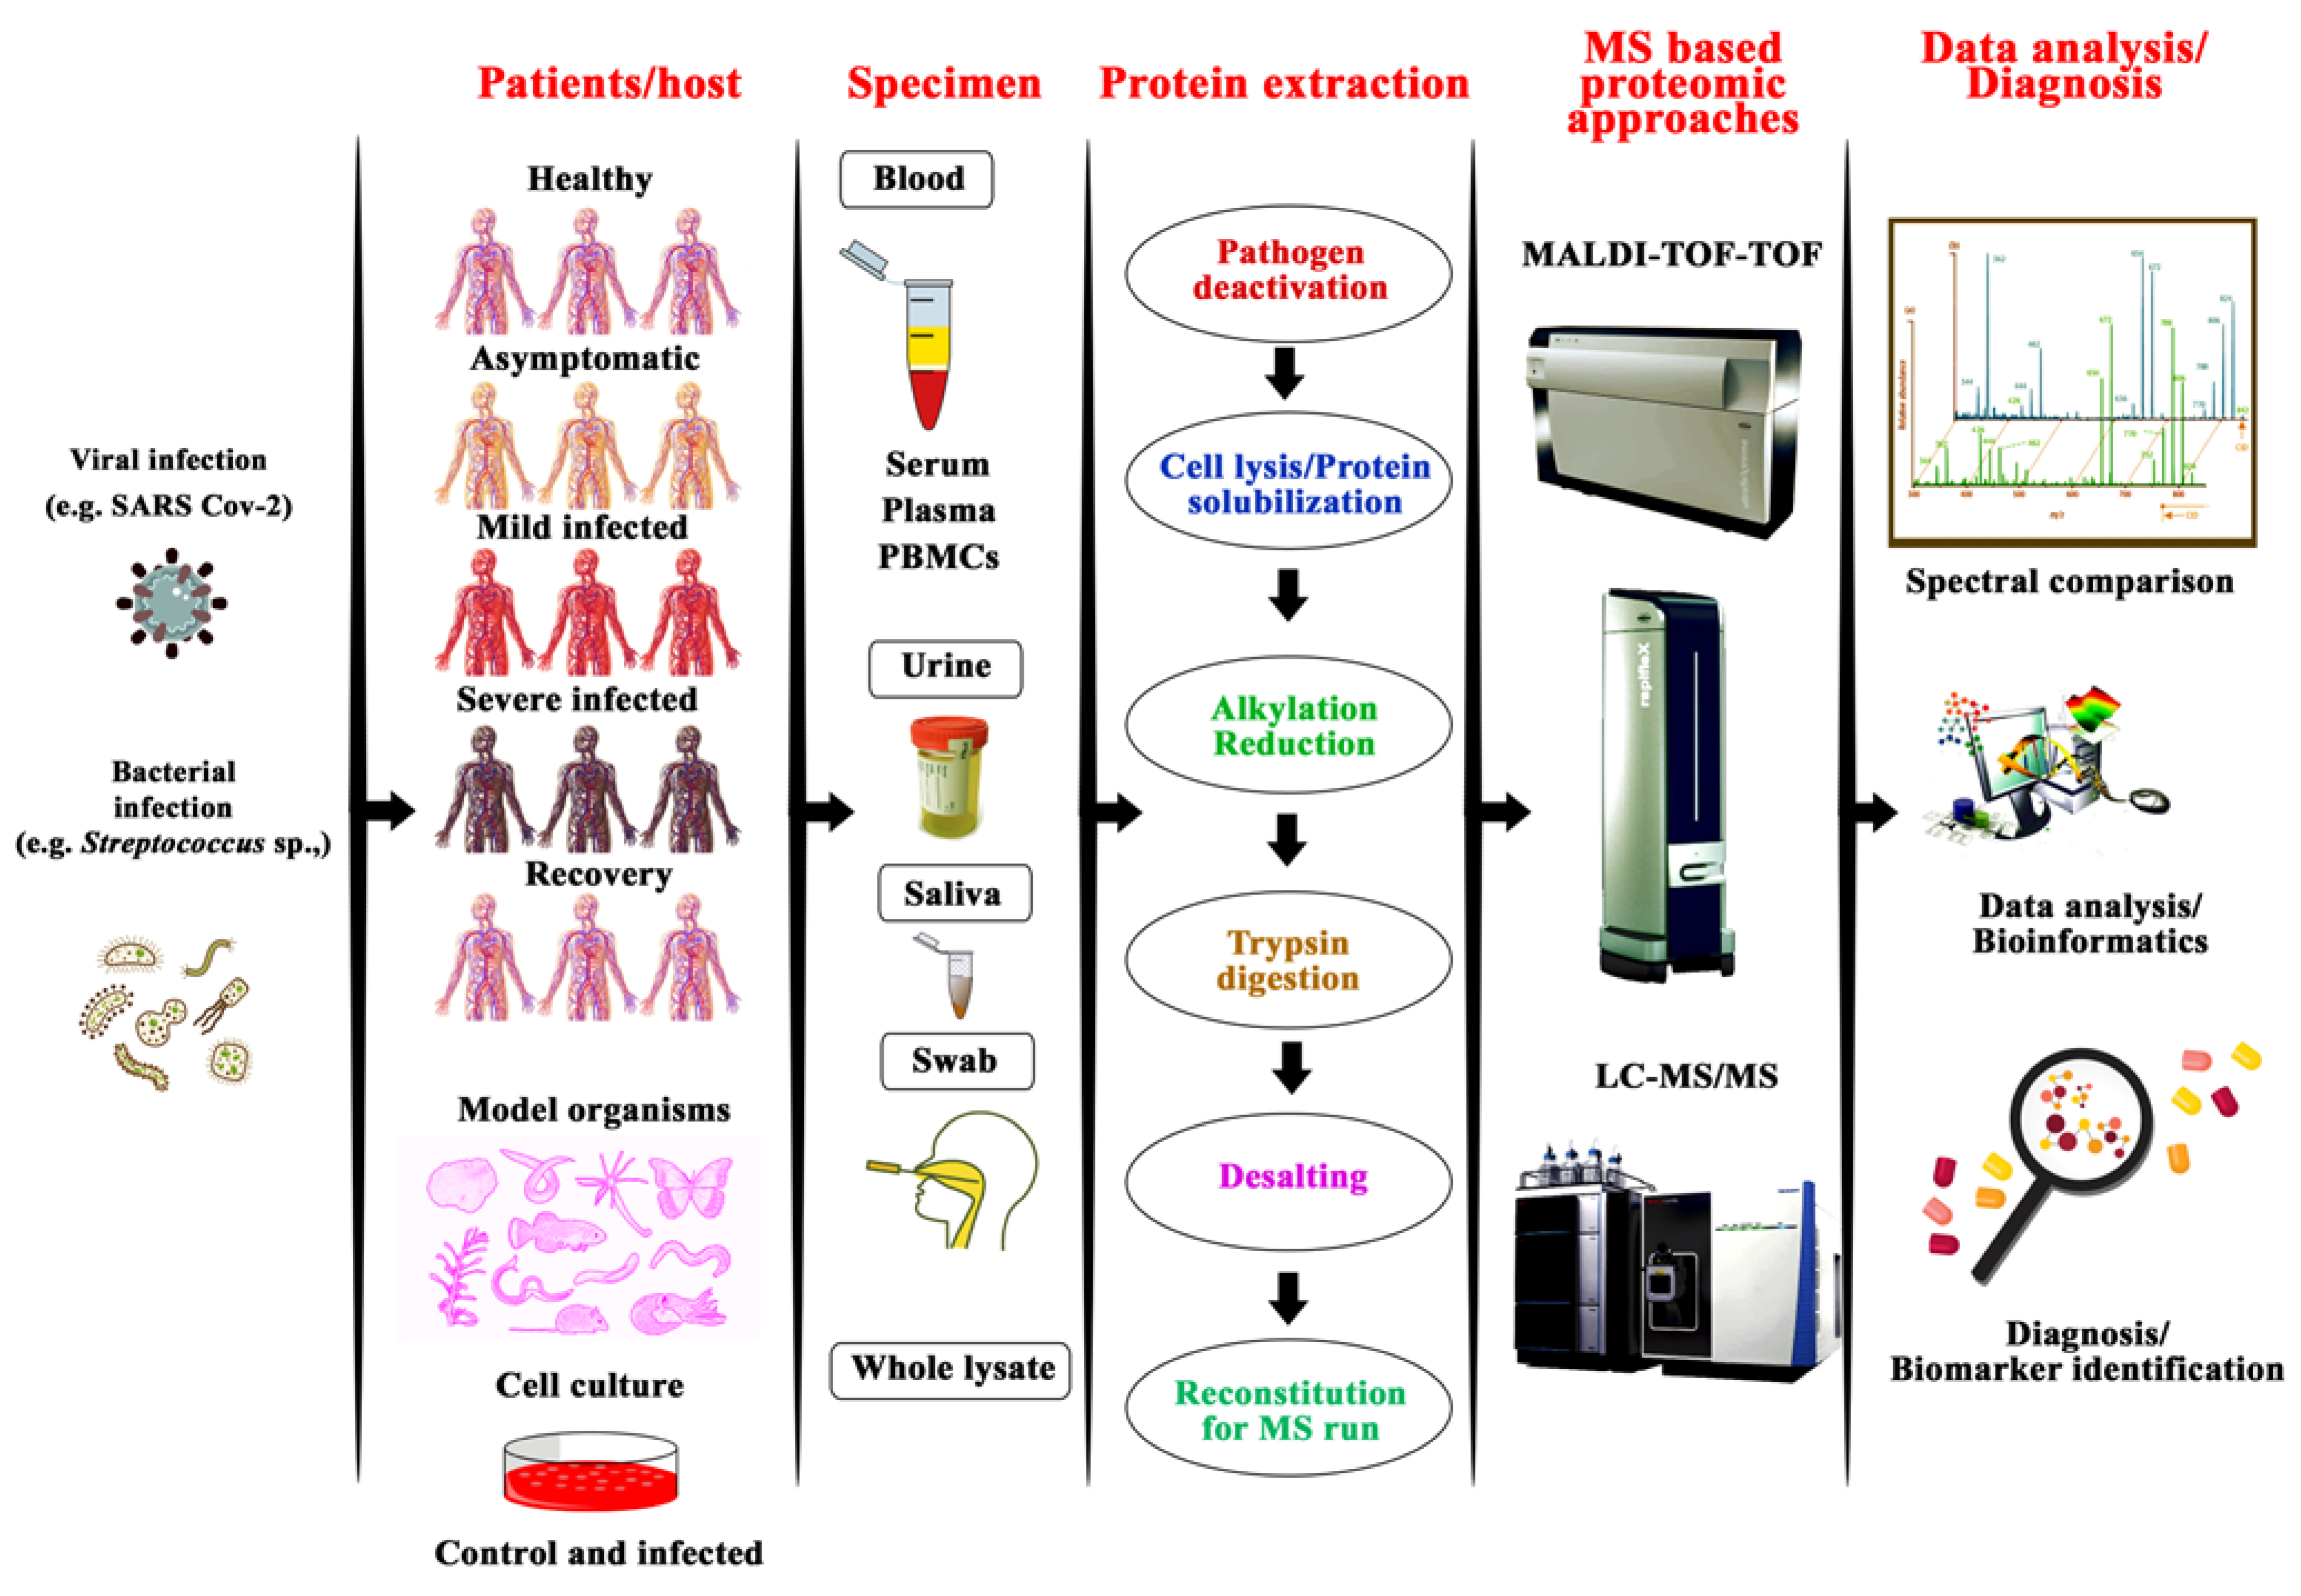
2.5. MALDI-TOF/TOF Tandem Mass Spectrometry

The introduction of electron spray ionization (ESI) and matrix-aided laser desorption ionization (MALDI) in the 1980s broadened the use of MS to include large biological molecules, such as proteins [60]. The peptide fragments are charged with ions for both MALDI and ESI by the addition or removal of one or more protons. Both are based on “soft ionization” procedures which do not result in a serious loss of sample integrity due to ion production [60]. In comparison to ESI-MS, MALDI-TOF MS offers the following advantages: (i) MALDI-TOF MS yields single-charged ions, making data interpretation easier; and (ii) ESI-MS analysis requires previous chromatographic separation, which is not necessary for MALDI-TOF MS analyses [61]. The sample for MALDI MS analysis is made by combining or coating it with a solution of the matrix, an energy-absorbent organic substance. When the matrix hardens as it dries, the sample encased inside it crystallizes as well. A laser beam is used to ionize the specimen within the matrix in an automated fashion. The laser beam creates protonated ions from the microbial sample through desorption and ionization. The protonated ions are then transported at a constant potential, where their m/z ratio separates them from one another. Different types of mass analyzers, including ion trap, quadrupole mass, and time of flight (TOF) analyzers, are then used to sense and compute the charged analytes [28].
In several studies, MALDI-TOF MS has been shown to be a useful method for the early recognition of bacteria in blood samples, cerebrospinal fluids, respiratory tract samples, stool samples, and urinary tract infection (UTI) samples [62,63] (Figure 2). In several trials, MALDI-TOF MS was found to be on track with conventional diagnostic procedures in terms of accuracy and speed in identifying bloodstream infections. For example, the direct identification of microorganisms causing meningitis in CSF fluids has been achieved using MALDI-TOF MS [63]. Technically, additional pre-treatment of bodily fluids with ammonium chloride, formic acid, or incubation on solid growth medium has been recommended in a few studies to increase the diagnostic capacity of MALDI-TOF.
The traditional methods for identifying UTIs were compared to MALDI-TOF-based documentation programs [28]. Recently, it was discovered that MALDI-TOF required the least amount of processing time and could identify microbes from urine samples even when there were more than two UTI pathogens present. To increase the turnaround time and detection sensitivity of MALDI-TOF MS-based UTI analysis, a few studies have proposed techniques using differential centrifugation of infected urine samples or diafiltration [64]. Most bacteria from stool samples are identified through conventional culturing methods. Although inexpensive, the isolation and classification of enteric bacterial pathogens is time-consuming, taking 3–5 days, which can be rectified with the use of MALDI-MS [63,64]. The limitation of MALDI-TOF analysis in the clinical laboratory is that the technique cannot discriminate between related species if there is inherent similarity between the organisms. An additional limitation with respect to incorrect identification of similar species or rare species is the lack of sufficient spectra in the database [65].
MALDI-TOF MS has been demonstrated in several studies to be on par with or even better than traditional diagnostic procedures in terms of speed and accuracy [28,62,63]. Studies have been carried out to identify pathogens in UTIs and bloodstream infections and diagnose human excretions caused by infections. For fungal spores of pathogenic organisms, Lasch et al. [66] proposed a trifluoroacetic acid (TFA)-based inactivation protocol using MALDI-TOF MS. Jeong et al. [67] observed accurate identification of aerosolized Bacillus spp. spores using direct in situ MALDI-TOF without performing any pretreatment. Johansson et al. [68] established a MALDI-TOF MS approach for detecting and verifying carbapenemase synthesis in the anaerobic bacteria Bacteroides fragilis [68]. Hoyos-Mallecot et al. [69] used a MALDI-TOF spectroscopy approach to identify and distinguish carbapenem-resistant P. aeruginosa clinical strains from metallo-lactamase-producing strains [69]. Hart et al. [70] used MALDI-TOF MS to develop a new technique for detecting antibiotic resistance biomarkers in clinical E. coli strains. They proposed that, rather than utilizing microbes for MS, the periplasmic compartment be isolated, followed by in-solution digestion with trypsin and sorting by nano-LC before MALDI-TOF MS analysis (Figure 2) [70].

2.6. Near-Infrared Spectroscopy (NIRS) and Chemometrics

NIRS has been applied in different fields, including food microbiology, for both qualitative and quantitative analyses. Responses observed in near-IR analysis are related to changes in the organic chemical bonds, such as O-H, C-H, C-O, and N-H bonds, present in microbial cells [71]. These responses are recorded as absorption, emission, transmittance, or reflectance spectra. The differences in the molecular composition of microbial cells explain the differences in the spectra often obtained for different microbes. The spectra for most microbes, however, present only minor differences due to the similarity in their molecular composition [72]. This has necessitated the combination of spectroscopy, including NIRS, with chemometric methods and preprocessing techniques for differential qualitative and quantitative analysis of microorganisms [73]. In addition, food safety and quality control are very critical in the food supply chain. These are influenced by the modes and conditions of handling throughout the supply chain [74]. The risk of contaminating foods through poor handling and monitoring is lower in a highly automated processing environment. However, the application covers a wide range of food processes, including fermentation, quality evaluation, etc. [74].
Curto et al. [75], who investigated the application of PCA-ANN-based NIRS to accurately predict the sensory attributes of controlled-process cheese reported the method to be cost-effective and efficient in the quality control of cheese. Li et al. [76] reported the use of Long Short-Term Memory networks with mechanistic modelling to predict changes in pH, lactose, lactic acid, and biomass during cheese fermentation with high accuracy (r2 > 0.99). Moreover, Sipos [77] reported the application of a knowledge-based intelligent control system in the alcoholic fermentation phases of white winemaking. They reported the suitability and efficiency of the system in ensuring quality and its industrial-scale application in the wine industry. Gonzalez et al. [78] also reported the applicability of ANNs in forecasting the acceptability of beer with an accuracy of about 92%.
Due to its stability in animal feed, antibiotic resistance is a problem that is becoming more and more serious in the food industry, especially in the meat sector. In order to forecast antibiotic resistance, identify foodborne outbreaks and the sources of infections, and assess risk, advanced machine learning algorithms have been used, according to Deng et al. [79]. Specifically, PCA and ANN models have been applied to classify the safety (spoilage status) of fish with about 96.87% accuracy, as reported by Vajdi et al. [80]. Additionally, support vector machine (SVM) models have been used to determine the presence and quantities of antibiotics in bovine milk with over 83% accuracy and high-level efficiency [81]. ANN models have been effectively used to identify adulteration in edible oils [82] and cow ghee [83]. These findings demonstrate the promising wider application of machine learning in assessing food safety/quality and quantifying antibiotic residues in inorganic foods and their products in the very near future.
According to Amigo et al. [84], support vector machine, stepwise multiple linear regression, partial least squares regression, and artificial neural networks (ANNs) are the most commonly used chemometric and preprocessing techniques in spectroscopy. These chemometric methods in combination with IR spectroscopy have been used to develop bioreceptor-free sensors and methods for various applications, including the detection of microorganisms, their metabolites, spoilage, and their diseases, as evidenced in some recent studies by Spyrelli et al. [85], Cebrian et al. [86], Alexandrakis et al. [87], and Azadshahraki et al. [88], respectively.
In the study conducted by Spyrelli et al. [85], FTIR and multispectral imaging were used with different chemometric models to estimate the total viable counts and Pseudomonas spp. in chicken thigh fillets. In their study, PLS, LDA, QDA, SVM, and QSVM were the chemometric models used. It was revealed in this study that SVM combined with multispectral imaging estimated total viable counts of Pseudomonas spp. with about 94.4% overall accuracy. This revealed the potential of MSI techniques in combination with machine-learning-based chemometrics for the detection of pathogenic bacteria in foods. E. coli, a fecal and pathogenic contaminant, was detected in Persian leek with Vis/NIRS coupled with PLSDA combined with genetic algorithms, interval PLS, and variable influence on projection scores in the study of Rahi et al. [89]. This was achieved with 100% sensitivity and 98% specificity. Their finding further indicates the potential of NIRS and machine-learning chemometric models in the field of food microbiology in detecting pathogens.
Pathogenic microbes exhibit their pathogenicity either directly or indirectly through their toxins, which are often produced as metabolites during cellular activities. Therefore, the ability of a method to detect pathogen-related toxins indicates the applicability of this method in estimating the presence of the related pathogens. Studies by Dachoupakan et al. [90], Tao et al. [91], and Cebrian et al. [86] reported the application of NIRS-based approaches in combination with different chemometric models to estimate mycotoxin levels in brown rice, corn kernels, and dried meat, respectively. These were achieved with adequately high levels of accuracy in the models used. These findings present the potential of developing and using NIRS-based biosensors for detecting the presence as well as quantifying the levels of mycotoxins and other toxins in foods. Table 1 presents a summary of some applications of NIRS coupled with chemometrics in microbial detection.

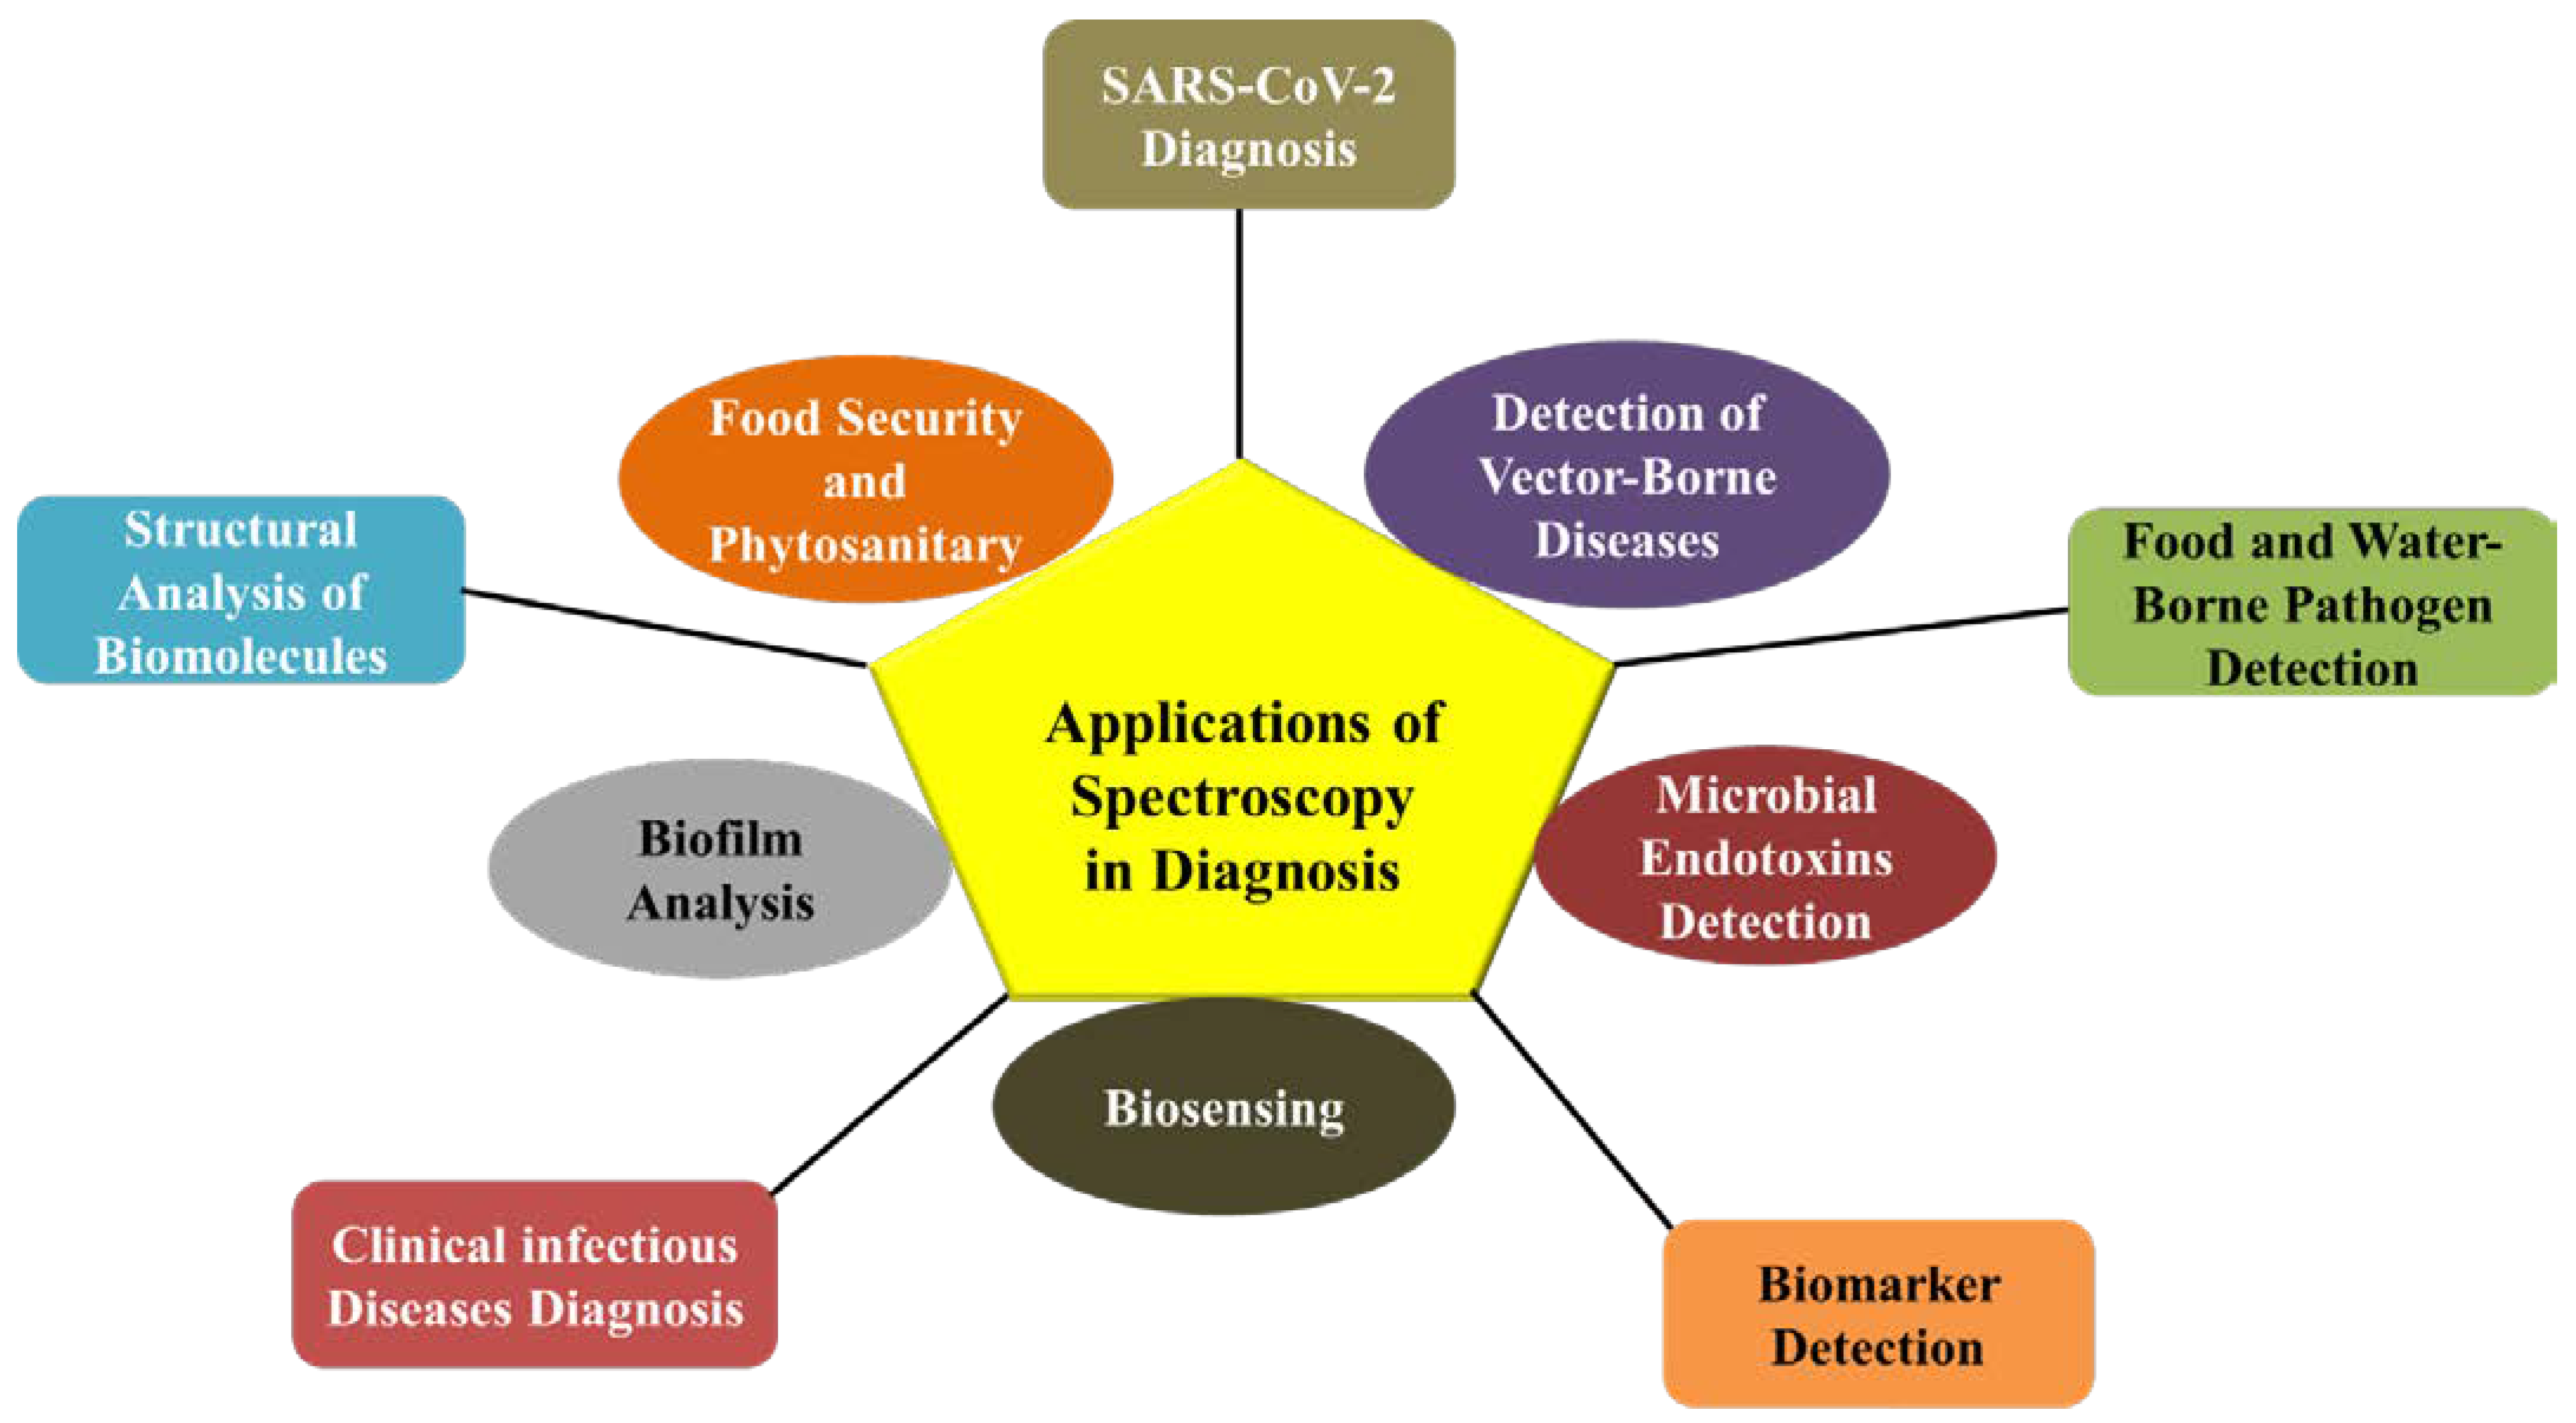
3. Applications of Spectroscopy in Diagnostics

A range of biomedical applications, such as the diagnosis of diseases in humans, plants, and animals, have benefited from the use of spectroscopy in combination with multivariate analysis, artificial intelligence, machine learning, or lateral flow tests (Figure 3). The most popular spectroscopic techniques for identifying a wide range of bacteria rapidly and accurately with high sensitivity and specificity are IR and Raman spectroscopies [44]. The first line of defensive measures in pandemic/epidemic outbreaks is quick point-of-care testing. Markedly, handheld Raman and IR spectroscopy with point-of-care testing methodology make them ideal for early diagnosis and monitoring of outbreaks [95]. In addition, these methods are inexpensive, fast, straightforward, more reliable, convenient, non-destructive, label-free, and time-efficient for the identification and classification of microbes at the genus, species, and even serotype levels.

3.1. Epidemiology

Infections connected with healthcare and the community could be avoided by early detection of possible outbreaks and the sources of contamination. However, microbial typing (genotypic, gel-based, sequence-based, and phenotypic) performed through conventional methods usually takes several hours to days, making it unsuitable for urgent use [96]. Raman spectroscopy allows real-time monitoring of disseminating bacterial isolates in a few seconds. Virus capture with rapid Raman spectroscopy detection and identification (VIRRION) is a handheld microdevice developed for the rapid identification of different viruses directly from clinical samples [97]. This device captures virus particles of different sizes and performs real-time, non-destructive, in situ characterization using SERS combined with artificial intelligence algorithms. Using this device, Yeh et al. [97] have validated different avian and human viruses. Combining the VIRRION platform with Raman spectra and advanced machine learning algorithms and convolutional neural networks (CNNs), Ye et al. [98] have modeled a real-time monitoring system for quick identification of types, subtypes, and strains of human respiratory and enteroviruses and avian viruses.

3.2. Diagnosis of Clinical Infectious and Vector-Borne Diseases

Rebrošová et al. [99] were able to differentiate 254 microbial strains from 20 microbial species causing UTIs using Raman spectroscopy and machine learning. In addition, the authors reported real-time analysis of single bacterial cells directly from urine in less than 10 min using Raman tweezers combined with Raman spectroscopy. Zhao et al. [100] utilized Raman spectroscopy and a multiscale CNN for the classification of hepatitis infections caused by hepatitis B and C viruses. Similarly, Tiwari et al. [101] effectively utilized Raman spectroscopy to monitor Epstein–Barr virus disease progression in human nerve cells. Rapid as well as accurate identification of different Mycobacterium strains, including drug-resistant strains, through Raman spectroscopy has also been reported [102]. According to Ho et al. [40], Raman spectroscopy and CNNs were used to identify 30 prevalent bacterial infections. The authors also distinguished between MSSA and MRSA and verified their method using clinical isolates. Moreover, Burkholderia cenocepacia ET12, a clinically infamous pathogen, has been distinguished from non-epidemic strains in CF patients using FTIR-based typing techniques [103].
A portable SERS-LFI detector for the quantitative, sensitive, and quick detection of non-structural protein-1 (NS1, 0.1 ng/mL) from West Nile virus has been described by Jia et al. [104]. Similarly, Sánchez-Purrà et al. [105] reported the detection of Zika and dengue virus NS1 at low concentrations of 0.72 ng/mL and 7.67 ng/mL, respectively, through SERS-based LFA. Detection of Trypanosoma brucei infection through portable Raman spectroscopy has been demonstrated in the skins of laboratory mouse models infected with Trypanosoma brucei [106]. Detection of malaria and arboviruses using Raman and IR spectroscopy has been comprehensively reviewed by Goh et al. [107].

3.3. Food- and Waterborne Pathogen Detection

Raman spectroscopy is employed in the examination of phytosanitary problems. Several plant pathogenic bacteria affect crop yield and productivity. Numerous studies have utilized Raman spectroscopy for the early diagnosis of plant pathogens, including bacteria, such as Candidatus Liberibacter [108] and Clavibacter michiganensis [109]; fungi, such as Stachybotrys chartarum, Penicillium, Aspergillus, Cladosporium, Alternaria, Fusarium, and Colletotrichum species [110,111]; and viruses, such as tomato spotted wilt virus and tomato yellow leaf curl sardinia virus [112]. The uses of Raman spectroscopy in food safety have been extensively discussed by Huang et al. [113] and Petersen et al. [114]. Microbial typing of Bifidobacteria through FTIR has been described by Deidda et al. [115], suggesting the prospects of possible usage in the food, dairy, and pharmaceutical industries. Additionally, the application of portable near-IR and Raman spectroscopy in evaluating the freshness of food by determining the decomposition state owing to bacterial growth is defined by Yakes et al. [116] and Petersen et al. [114].
Raman and IR spectroscopies are used for the precise identification of foodborne and waterborne pathogens. In a study, methods for discriminating food- and waterborne pathogens through Raman spectroscopy coupled with machine learning methods discriminated 18 different species of Arcobacter originating from wastewater treatment plants, agriculture water, dairy manure, and animal feces with the highest accuracy of 97.2% [117]. Similarly, Du et al. [118] suggested a method centered on Raman spectroscopy coupled with artificial intelligence algorithms for the detection of foodborne microbes, such as Salmonella typhimurium, Vibrio parahaemolyticus, and Escherichia coli 0157:H7. Yan et al. [119] utilized single-cell Raman spectroscopy with kernel principal component analysis and a decision tree algorithm to distinguish foodborne pathogens, including Staphylococcus, Cronobacter, Listeria, Escherichia, Shigella, Vibrio, and Salmonella, at the serotype level. FTIR combined with machine learning algorithms was utilized to classify foodborne bacteria (dry bacterial cells: B. subtilis and E. coli) collected from stainless-steel substrates and aluminum slides [120].

3.4. Antibiotic Resistance and Virulence Factors

Antibiotic resistance and hypervirulence are causing higher mortality in clinical settings, and therefore discriminating antibiotic resistance strains from non-resistant strains is of utmost importance for successful treatment [121]. In addition, a rapid and high-specificity detection approach could allow clinicians to choose suitable antibiotics at the initial stages of therapy, besides minimizing the prevalence of antibiotic resistance. Raman spectroscopy, along with machine learning/ANNs, allows for the accurate identification of multidrug resistant strains (Figure 4). In a study, Lu et al. [116] analyzed drug resistance in Klebsiella pneumonia (71 strains) through the Raman-CNN method to categorize the bacterial spectra by antibiotic resistance and virulence factors. Using an SERS-stacked autoencoder (SAE)-based deep neural network (DNN), Ciloglu et al. [122] discriminated the spectral data of MRSA from MSSA bacteria. Likewise, Chen et al. [123] detected clinical isolates of MSSA (52) and MRSA (215) using positively charged silver nanoparticles as SERS substrates. Ma et al. [124] explained a Raman-based metabolomic technique to investigate the minimum inhibitory concentrations and antimicrobial resistance profiles of Campylobacter jejuni. Additionally, Yi et al. [125] built a fast Raman-assisted antibiotic susceptibility test (FRAST) for the microbiological examination of clinical samples (urine and blood) through Raman single-cell spectroscopy. This method has a shorter turnaround time in comparison to conventional methods.
Raman spectroscopy might be used to examine the complex biofilm matrix composition, biofilm biomass, biofilm secretomes, and spatial mapping of complex chemicals in bacterial populations. SERS was used by Gannesen et al. [126] to profile the biofilm biomass and matrix of Cutibacterium acnes RT5. Do et al. [127] reported in situ detection of diffusible quorum-sensing molecules—pyocyanins—from P. aeruginosa biofilms through electrochemical (EC)-SERS. Similarly, Horiue et al. [128] studied the spatial distributions of constituent microorganisms within multispecies biofilms (pink biofilms) by evaluating the Raman signatures of polyenes through Raman microspectroscopy. Gieroba et al. [46] studied the composition of bacterial biofilms in various cariogenic Streptococci, including Streptococcus mutans, S. sanguis, and different strains of S. sobrinus. Raman spectroscopy coupled with multivariate analysis was utilized to predict and spatially differentiate two bacteria (Streptococcus oralis and Actinomyces denticolens) in an in vitro model simulating a subgingival dual-species biofilm [129].

3.5. SARS-CoV-2 Diagnosis

The widely implemented standard technique, RT-PCR (for detection of SARS-CoV-2), is limited for several reasons, including false-negative and false-positive rates, turnaround time, discrimination of subvariants, and inconclusive results at the initial stages of infection [130]. Therefore, an improved detection method is desperately needed to control the devastating outbreaks. Several studies have suggested powerful methods based on IR and Raman spectroscopy for the swift differentiation of SARS-CoV-2. A portable IR spectrometer based on transflection IR has been devised by Wood et al. [131] for quick point-of-care testing of SARS-CoV-2 in saliva samples. Similarly, Huang et al. [132] proposed a deep learning (RNN)-based SERS model for fast and on-site detection of differences in SARS-CoV-2. SERS combined with lateral flow immunoassay (LFI) for testing SARS-CoV-2 has been reviewed by Yadav et al. [133]. Zavyalova et al. [134] developed an SERS-based aptasensor for quick quantitative detection of the SARS-CoV-2 virus. Desai et al. [135] developed a graphical user interface (GUI)-based device (RNA virus detector) to detect RNA viruses (especially SARS-CoV-2) in human saliva via raw SPC files plotted by a Raman spectrometer. Gulekan et al. [136] showed the usefulness of FTIR spectra in determining the difference between healthy and COVID-19-affected individuals. The obtained spectra were able to show differences in the severity of infection with an estimated accuracy of 90%. The same group further determined that FTIR and Raman spectroscopy methods can be used for the dynamic measurement of serum antibody levels in COVID-19-infected individuals [137].

3.6. Microbial Endotoxins/Biomarker Detection

Although limulus amebocyte lysate (LAL) and MALDI-TOF-MS techniques are employed to uncover endotoxins in biological fluids, these methods are not satisfactory for several reasons, such as sensitivity, cost, and time consumption. Wu et al. [138] have reported significantly sensitive detection and differentiation of endotoxins, such as lipopolysaccharides, lipid-A, and KDO2-lipid-A, from pathogenic bacteria, including Neisseria meningitidis, E. coli, V. cholera, S. typhimurium, S. Minnesota, Rhizobium etli CE3, and R. niger, through SERS at low concentrations (10 nmol/mL). The spectral differences for different lipopolysaccharides due to variations in the composition of carbohydrates and phospholipids analyzed through SERS indicate that lipopolysaccharides could be used as biomarkers for sensing bacteria.
In addition to the aforementioned applications, Raman spectroscopy is utilized in high-throughput analysis [139]; the classification, identification, and investigation of biomarker components of uncultivated archaea [140]; the identification of the growth stages of microbial populations in batch culture [141]; cell sorting [142,143]; and studying the phenotypic diversity of a single cell in a microbial population [144]. Additionally, smartphones combined with Raman or FTIR spectroscopy are an emerging breakthrough technology for in situ detection [145]. This amazing technique will revolutionize daily life by easing the diagnostic process and will significantly advance the applications of spectroscopy in various conditions, including water contamination monitoring, health care, and so on.

4. Conclusions and Future Perspectives

In the current healthcare system, it takes several hours to confirm bacteria susceptibility, delaying effective treatment. As antibiotic-resistant bacteria continue to evolve, rapid and precise detection of antibacterial resistance profiles is now critical in clinical settings to save lives. Spectroscopic approaches are elegant optical techniques that could make a significant contribution to the early clinical diagnosis of infections or expected causative agents. The main advantages of the methods described in this review are shortening the time and reducing the consumables needed for identification, automation of the process, and the addition of prior information about microbes and virulence factors. Recent studies have shown that Raman spectroscopy with machine learning methods is fast and accurate in identifying bacterial species and can differentiate antibiotic-resistant and -susceptible strains with high (>95%) sensitivity and specificity within minutes. Although Raman spectroscopy is cheap and rapid, further advancement is required to fulfil its great promise for future antibiotic susceptibility testing and the development of profiling technology. Standard databases and computational techniques for bacterial phenotyping through Raman spectroscopy are progressing and could lead to new possibilities in the near future.

Author Contributions

Conceptualization: S.P., S.A.L. and A.P.; writing—original draft preparation: S.P., S.A.L., A.P. and J.-L.Z.Z.; visualization: S.P., B.B., R.D. and V.A.-I.; writing—original draft preparation: S.A.L., A.P., B.B. and R.D.; project administration: S.-I.S.; funding acquisition: S.-I.S. All authors have read and agreed to the published version of the manuscript.

Funding

This study was supported by the “Research Program for Agricultural Science & Technology Development and Postdoctoral Fellowship Program (Project No. PJ01494301 and PJ01672604)”, National Institute of Agricultural Sciences, Rural Development Administration, Republic of Korea.

Institutional Review Board Statement

Not applicable.

Informed Consent Statement

Not applicable.

Data Availability Statement

Not applicable.

Conflicts of Interest

The authors declare no conflict of interest.

Abbreviations

Electron spray ionization, ESI; matrix-aided laser desorption ionization, MALDI; time of flight, TOF; surface-enhanced Raman scattering spectroscopy, SERS; Fourier transform infrared spectroscopy, FTIR; optical density, OD; methicillin-resistant Staphylococcus aureus, MRSA; methicillin-susceptible Staphylococcus aureus, MSSA; attenuated total reflectance, ATR; near-infrared, NIR; mid-infrared, MIR; far-infrared, FIR; Electrochemical Impedance Spectroscopy, EIS; urinary tract infection, UTI; near-infrared spectroscopy, NIRS; artificial neural network, ANN; convolutional neural network, CNN; deep neural network, DNN; support vector machine, SVM.

References

  1. Dellinger, R.P.; Levy, M.M.; Rhodes, A.; Annane, D.; Gerlach, H.; Opal, S.M.; Sevransky, J.E.; Sprung, C.L.; Douglas, I.S.; Jaeschke, R.; et al. Surviving Sepsis Campaign: International guidelines for management of severe sepsis and septic shock, 2012. Intensive Care Med. 2013, 39, 165–228. [Google Scholar] [CrossRef] [PubMed]
  2. American Thoracic Society, Infectious Diseases Society of America. Guidelines for the management of adults with hospital-acquired, ventilator-associated, and healthcare-associated pneumonia. Am. J. Respir. Crit. Care Med. 2005, 171, 388. [Google Scholar] [CrossRef] [PubMed] [Green Version]
  3. Eisenstein, B.I. New molecular techniques for microbial epidemiology and the diagnosis of infectious diseases. J. Infect. Dis. 1990, 161, 595–602. [Google Scholar] [CrossRef] [PubMed]
  4. Sabat, A.J.; van Zanten, E.; Akkerboom, V.; Wisselink, G.; van Slochteren, K.; de Boer, R.F.; Hendrix, R.; Friedrich, A.W.; Rossen, J.W.; Kooistra-Smid, A. Targeted next-generation sequencing of the 16S-23S rRNA region for culture-independent bacterial identification-increased discrimination of closely related species. Sci. Rep. 2017, 7, 1–2. [Google Scholar] [CrossRef] [Green Version]
  5. Ko, J.; Park, S.G.; Lee, S.; Wang, X.; Mun, C.; Kim, S.; Kim, D.H.; Choo, J. Culture-free detection of bacterial pathogens on plasmonic nanopillar arrays using rapid Raman mapping. ACS Appl. Mater. Interfaces 2018, 10, 6831–6840. [Google Scholar] [CrossRef]
  6. Shrivastava, S.; Lee, W.I.; Lee, N.E. Culture-free, highly sensitive, quantitative detection of bacteria from minimally processed samples using fluorescence imaging by smartphone. Biosens. Bioelectron. 2018, 109, 90–97. [Google Scholar] [CrossRef]
  7. Wang, J.C.; Tung, Y.C.; Ichiki, K.; Sakamoto, H.; Yang, T.H.; Suye, S.I.; Chuang, H.S. Culture-free detection of methicillin-resistant Staphylococcus aureus by using self-driving diffusometric DNA nanosensors. Biosens. Bioelectron. 2020, 148, 111817. [Google Scholar] [CrossRef]
  8. Fenollar, F.; Raoult, D. Molecular diagnosis of bloodstream infections caused by non-cultivable bacteria. Int. J. Antimicrob. Agents 2007, 30, 7–15. [Google Scholar] [CrossRef]
  9. Şen Karaman, D.; Ercan, U.K.; Bakay, E.; Topaloğlu, N.; Rosenholm, J.M. Evolving technologies and strategies for combating antibacterial resistance in the advent of the postantibiotic era. Adv. Funct. Mater. 2020, 30, 1908783. [Google Scholar] [CrossRef]
  10. Ashton, L.; Lau, K.; Winder, C.L.; Goodacre, R. Raman spectroscopy: Lighting up the future of microbial identification. Future Microbiol. 2011, 6, 991–997. [Google Scholar] [CrossRef] [Green Version]
  11. Kotanen, C.N.; Martinez, L.; Alvarez, R.; Simecek, J.W. Surface enhanced Raman scattering spectroscopy for detection and identification of microbial pathogens isolated from human serum. Sens. Bio Sens. Res. 2016, 8, 20–26. [Google Scholar] [CrossRef] [Green Version]
  12. Singh, V.K.; Sharma, J.; Pathak, A.K.; Ghany, C.T.; Gondal, M.A. Laser-induced breakdown spectroscopy (LIBS): A novel technology for identifying microbes causing infectious diseases. Biophys. Rev. 2018, 10, 1221–1239. [Google Scholar] [CrossRef]
  13. Saari, S.; Järvinen, S.; Reponen, T.; Mensah-Attipoe, J.; Pasanen, P.; Toivonen, J.; Keskinen, J. Identification of single microbial particles using electro-dynamic balance assisted laser-induced breakdown and fluorescence spectroscopy. Aerosol Sci. Technol. 2016, 50, 126–132. [Google Scholar] [CrossRef] [Green Version]
  14. Cheeseman, S.; Shaw, Z.L.; Vongsvivut, J.; Crawford, R.J.; Dupont, M.F.; Boyce, K.J.; Gangadoo, S.; Bryant, S.J.; Bryant, G.; Cozzolino, D.; et al. Analysis of pathogenic bacterial and yeast biofilms using the combination of synchrotron ATR-FTIR microspectroscopy and chemometric approaches. Molecules 2021, 26, 3890. [Google Scholar] [CrossRef]
  15. Bosch, A.; Serra, D.; Prieto, C.; Schmitt, J.; Naumann, D.; Yantorno, O. Characterization of Bordetella pertussis growing as biofilm by chemical analysis and FT-IR spectroscopy. Appl. Microbiol. Biotechnol. 2006, 71, 736–747. [Google Scholar] [CrossRef]
  16. Wang, H.; Ding, S.; Wang, G.; Xu, X.; Zhou, G. In situ characterization and analysis of Salmonella biofilm formation under meat processing environments using a combined microscopic and spectroscopic approach. Int. J. Food Microbiol. 2013, 167, 293–302. [Google Scholar] [CrossRef]
  17. Chen, P.; Wang, J.J.; Hong, B.; Tan, L.; Yan, J.; Zhang, Z.; Liu, H.; Pan, Y.; Zhao, Y. Characterization of mixed-species biofilm formed by Vibrio parahaemolyticus and Listeria monocytogenes. Front. Microbiol. 2019, 10, 2543. [Google Scholar] [CrossRef] [Green Version]
  18. Van Duuren, J.B.; Müsken, M.; Karge, B.; Tomasch, J.; Wittmann, C.; Häussler, S.; Brönstrup, M. Use of single-frequency impedance spectroscopy to characterize the growth dynamics of biofilm formation in Pseudomonas aeruginosa. Sci. Rep. 2017, 7, 5223. [Google Scholar] [CrossRef] [Green Version]
  19. Yang, K.; Li, H.Z.; Zhu, X.; Su, J.Q.; Ren, B.; Zhu, Y.G.; Cui, L. Rapid antibiotic susceptibility testing of pathogenic bacteria using heavy-water-labeled single-cell Raman spectroscopy in clinical samples. Anal. Chem. 2019, 91, 6296–6303. [Google Scholar] [CrossRef]
  20. Zarnowiec, P.; Lechowicz, L.; Czerwonka, G.; Kaca, W. Fourier transform infrared spectroscopy (FTIR) as a tool for the identification and differentiation of pathogenic bacteria. Curr. Med. Chem. 2015, 22, 1710–1718. [Google Scholar] [CrossRef]
  21. Pezzotti, G.; Kobara, M.; Asai, T.; Nakaya, T.; Miyamoto, N.; Adachi, T.; Yamamoto, T.; Kanamura, N.; Ohgitani, E.; Marin, E.; et al. Raman imaging of pathogenic Candida auris: Visualization of structural characteristics and machine-learning identification. Front. Microbiol. 2021, 12, 769597. [Google Scholar] [CrossRef] [PubMed]
  22. Sinha, M.; Jupe, J.; Mack, H.; Coleman, T.P.; Lawrence, S.M.; Fraley, S.I. Emerging Technologies for Molecular Diagnosis of Sepsis. Clin. Microbiol. Rev. 2018, 31, e00089-17. [Google Scholar] [CrossRef] [PubMed] [Green Version]
  23. Roth, A.; Dornuf, F.; Klein, O.; Mäntele, W. IR spectroscopy goes to the hospital: Progress in reagent-free blood analysis and haemodialysis monitoring. FTIR Spectrosc. Microbiol. Med. Diagn. 2011, 20, 46. [Google Scholar]
  24. Lopez-Reyes, G.; Pérez, F.R. A method for the automated Raman spectra acquisition. J. Raman Spectrosc. 2017, 48, 1654–1664. [Google Scholar] [CrossRef]
  25. Li, Y.; Yang, X.; Zhao, W. Emerging Microtechnologies and Automated Systems for Rapid Bacterial Identification and Antibiotic Susceptibility Testing. SLAS Technol. 2017, 22, 585. [Google Scholar] [CrossRef] [Green Version]
  26. Yang, Y.; Chen, Y.; Tang, H.; Zong, N.; Jiang, X. Microfluidics for biomedical analysis. Small Methods 2020, 4, 1900451. [Google Scholar] [CrossRef]
  27. Cowcher, D.P.; Xu, Y.; Goodacre, R. Portable, quantitative detection of Bacillus bacterial spores using surface-enhanced Raman scattering. Anal. Chem. 2013, 85, 3297–3302. [Google Scholar] [CrossRef]
  28. Singhal, N.; Kumar, M.; Kanaujia, P.K.; Virdi, J.S. MALDI-TOF mass spectrometry: An emerging technology for microbial identification and diagnosis. Front. Microbiol. 2015, 6, 791. [Google Scholar] [CrossRef] [Green Version]
  29. Carbonnelle, E.; Raskine, L. MALDI-TOF mass spectrometry tools for bacterial identification in clinical microbiology laboratory. Bio Trib. Mag. 2011, 39, 35–42. [Google Scholar] [CrossRef]
  30. Madonna, A.J.; van Cuyk, S.; Voorhees, K.J. Detection of Escherichia coli using immunomagnetic separation and bacteriophage amplification coupled with matrix-assisted laser desorption/ionization time-of-flight mass spectrometry. Rapid Commun. Mass Spectrom. 2003, 17, 257–263. [Google Scholar] [CrossRef]
  31. Franco-Duarte, R.; Černáková, L.; Kadam, S.; Kaushik, K.S.; Salehi, B.; Bevilacqua, A.; Corbo, M.R.; Antolak, H.; Dybka-Stępień, K.; Leszczewicz, M.; et al. Advances in chemical and biological methods to identify microorganisms—From past to present. Microorganisms 2019, 7, 130. [Google Scholar] [CrossRef] [Green Version]
  32. Braga, P.A.; Tata, A.; dos Santos, V.G.; Barreiro, J.R.; Schwab, N.V.; dos Santos, M.V.; Eberlin, M.N.; Ferreira, C.R. Bacterial identification: From the agar plate to the mass spectrometer. RSC Adv. 2013, 3, 994–1008. [Google Scholar] [CrossRef]
  33. Trivedi, N.; Dubey, A. Degradation studies of pendimethalin by indigenous soil bacterium Pseudomonas strain PD1 using spectrophotometric scanning and FTIR. Arch. Microbiol. 2021, 203, 4499–4507. [Google Scholar] [CrossRef]
  34. Myers, J.A.; Curtis, B.S.; Curtis, W.R. Improving accuracy of cell and chromophore concentration measurements using optical density. BMC Biophys. 2013, 6, 4. [Google Scholar] [CrossRef] [Green Version]
  35. McBirney, S.E.; Trinh, K.; Wong-Beringer, A.; Armani, A.M. Wavelength-normalized spectroscopic analysis of Staphylococcus aureus and Pseudomonas aeruginosa growth rates. Biomed. Opt. Express 2016, 7, 4034–4042. [Google Scholar] [CrossRef] [Green Version]
  36. Zhang, Y.; Hong, H.; Myklejord, D.V.; Cai, W. Molecular imaging with SERS-active nanoparticles. Small. 2011, 7, 3261–3269. [Google Scholar] [CrossRef] [Green Version]
  37. Cui, S.; Zhang, S.; Yue, S. Raman Spectroscopy and Imaging for Cancer Diagnosis. J. Healthc. Eng. 2018, 2018, 1–11. [Google Scholar] [CrossRef]
  38. Wang, L.; Hu, C.; Shao, L. The antimicrobial activity of nanoparticles: Present situation and prospects for the future. Int. J. Nanomed. 2017, 12, 1227. [Google Scholar] [CrossRef] [Green Version]
  39. Neng, J.; Harpster, M.H.; Wilson, W.C.; Johnson, P.A. Surface-enhanced Raman scattering (SERS) detection of multiple viral antigens using magnetic capture of SERS-active nanoparticles. Biosens. Bioelectron. 2013, 41, 316–321. [Google Scholar] [CrossRef]
  40. Ho, C.S.; Jean, N.; Hogan, C.A.; Blackmon, L.; Jeffrey, S.S.; Holodniy, M.; Banaei, N.; Saleh, A.; Ermon, S.; Dionne, J. Rapid identification of pathogenic bacteria using Raman spectroscopy and deep learning. Nat. Commun. 2019, 10, 4927. [Google Scholar] [CrossRef] [Green Version]
  41. Efrima, S.; Zeiri, L. Understanding SERS of bacteria. J. Raman Spectr. 2009, 40, 277–288. [Google Scholar] [CrossRef]
  42. Kloß, S.; Rösch, P.; Pfister, W.; Kiehntopf, M.; Popp, J. Toward culture-free Raman spectroscopic identification of pathogens in ascitic fluid. Anal. Chem. 2015, 87, 937–943. [Google Scholar] [CrossRef] [PubMed]
  43. Maquelin, K.; Kirschner, C.; Choo-Smith, L.P.; Ngo-Thi, N.A.; van Vreeswijk, T.; Stämmler, M.; Endtz, H.P.; Bruining, H.A.; Naumann, D.; Puppels, G.J. Prospective study of the performance of vibrational spectroscopies for rapid identification of bacterial and fungal pathogens recovered from blood cultures. J. Clin. Microbiol. 2003, 41, 324–329. [Google Scholar] [CrossRef] [PubMed] [Green Version]
  44. Liu, S.; Hu, Q.; Li, C.; Zhang, F.; Gu, H.; Wang, X.; Li, S.; Xue, L.; Madl, T.; Zhang, Y.; et al. Wide-Range, Rapid, and Specific Identification of Pathogenic Bacteria by Surface-Enhanced Raman Spectroscopy. ACS Sens. 2021, 6, 2911–2919. [Google Scholar] [CrossRef]
  45. Singh, K.S.; Majik, M.S.; Tilvi, S. Vibrational spectroscopy for structural characterization of bioactive compounds. In Comprehensive Analytical Chemistry; Elsevier: Amsterdam, The Netherlands, 2014; Volume 65, pp. 115–148. [Google Scholar]
  46. Gieroba, B.; Krysa, M.; Wojtowicz, K.; Wiater, A.; Pleszczyńska, M.; Tomczyk, M.; Sroka-Bartnicka, A. The FT-IR and Raman Spectroscopies as Tools for Biofilm Characterization Created by Cariogenic Streptococci. Int. J. Mol. Sci. 2020, 21, 3811. [Google Scholar] [CrossRef]
  47. Ozaki, Y. Infrared spectroscopy—Mid-infrared, near-infrared, and far-infrared/terahertz spectroscopy. Anal. Sci. 2021, 37, 1193–1212. [Google Scholar] [CrossRef]
  48. How an FTIR Spectrometer Operates—Chemistry LibreTexts. 2022. Available online: https://chem.libretexts.org/Book-shelves/Physical_and_Theoretical_Chemistry_Textbook_Maps/Supplemental_Modules_(Physical_and_Theoretical_Chemis-try)/Spectroscopy/Vibrational_Spectroscopy/Infrared_Spectroscopy/How_an_FTIR_Spectrometer_Operates (accessed on 23 February 2022).
  49. Baker, M.J.; Trevisan, J.; Bassan, P.; Bhargava, R.; Butler, H.J.; Dorling, K.M.; Fielden, P.R.; Fogarty, S.W.; Fullwood, N.J.; Heys, K.A.; et al. Using Fourier transform IR spectroscopy to analyze biological materials. Nat. Protoc. 2014, 9, 1771. [Google Scholar] [CrossRef] [Green Version]
  50. Singh, R.; Hong, S.; Jang, J. Label-free detection of influenza viruses using a reduced graphene oxide-based electrochemical immunosensor integrated with a microfluidic platform. Sci. Rep. 2017, 7, 42771. [Google Scholar] [CrossRef] [Green Version]
  51. Al-Qadiri, H.M.; Lin, M.; Cavinato, A.G.; Rasco, B.A. Fourier transform infrared spectroscopy, detection and identification of Escherichia coli O157:H7 and Alicyclobacillus strains in apple juice. Int. J. Food Microbiol. 2006, 111, 73–80. [Google Scholar] [CrossRef]
  52. Donlan, R.M.; Piede, J.A.; Heyes, C.D.; Sanii, L.; Murga, R.; Edmonds, P.; El-Sayed, I.; El-Sayed, M.A. Model system for growing and quantifying Streptococcus pneumoniae biofilms in situ and in real time. Appl. Environ. Microbiol. 2004, 70, 4980–4988. [Google Scholar] [CrossRef] [Green Version]
  53. Stewart, G.N. The charges produced by the growth of bacteria in the molecular concentration and electrical conductivity of culture media. J. Exp. Med. 1899, 4, 235. [Google Scholar] [CrossRef] [Green Version]
  54. Brosel-Oliu, S.; Uria, N.; Abramova, N.; Bratov, A. Impedimetric sensors for bacteria detection. Biosens. Micro Nanoscale Appl. 2015, 24, 257–288. [Google Scholar]
  55. Lagier, J.C.; Edouard, S.; Pagnier, I.; Mediannikov, O.; Drancourt, M.; Raoult, D. Current and Past Strategies for Bacterial Culture in Clinical Microbiology. Clin. Microbiol. Rev. 2015, 28, 208. [Google Scholar] [CrossRef] [Green Version]
  56. Dean, D.A.; Ramanathan, T.; Machado, D.; Sundararajan, R. Electrical impedance spectroscopy study of biological tissues. J. Electrost. 2008, 66, 165–177. [Google Scholar] [CrossRef] [Green Version]
  57. Yang, L.; Bashir, R. Electrical/electrochemical impedance for rapid detection of foodborne pathogenic bacteria. Biotechnol. Adv. 2008, 26, 135–150. [Google Scholar] [CrossRef]
  58. Jahnke, H.G.; Heimann, A.; Azendorf, R.; Mpoukouvalas, K.; Kempski, O.; Robitzki, A.A.; Charalampaki, P. Impedance spectroscopy—An outstanding method for label-free and real-time discrimination between brain and tumor tissue in vivo. Biosens. Bioelectron. 2013, 46, 8–14. [Google Scholar] [CrossRef]
  59. Permeh, S.; Lau, K.; Duncan, M. Characterization of biofilm formation and coating degradation by electrochemical impedance spectroscopy. Coatings 2019, 9, 518. [Google Scholar] [CrossRef] [Green Version]
  60. Gogichaeva, N.V.; Williams, T.; Alterman, M.A. MALDI TOF/TOF tandem mass spectrometry as a new tool for amino acid analysis. J. Am. Soc. Mass Spectrom. 2007, 18, 279–284. [Google Scholar] [CrossRef] [Green Version]
  61. Goloborodko, A.A.; Gorshkov, M.V.; Good, D.M.; Zubarev, R.A. Sequence scrambling in shotgun proteomics is negligible. J. Am. Soc. Mass Spectrom. 2011, 22, 1121–1124. [Google Scholar] [CrossRef] [Green Version]
  62. Juiz, P.M.; Almela, M.; Melción, C.; Campo, I.; Esteban, C.; Pitart, C.; Marco, F.; Vila, J. A comparative study of two different methods of sample preparation for positive blood cultures for the rapid identification of bacteria using MALDI-TOF MS. Eur. J. Clin. Microbiol. Infect. Dis. 2012, 31, 1353–1358. [Google Scholar] [CrossRef]
  63. Hou, T.Y.; Chiang-Ni, C.; Teng, S.H. Current status of MALDI-TOF mass spectrometry in clinical microbiology. J. Food Drug Anal. 2019, 27, 404–414. [Google Scholar] [CrossRef] [PubMed]
  64. Haiko, J.; Savolainen, L.E.; Hilla, R.; Pätäri-Sampo, A. Identification of urinary tract pathogens after 3-hours urine culture by MALDI-TOF mass spectrometry. J. Microbiol. Methods 2016, 129, 81–84. [Google Scholar] [CrossRef] [PubMed] [Green Version]
  65. Rychert, J. Benefits and limitations of MALDI-TOF mass spectrometry for the identification of microorganisms. J. Infect. Epidemiol. 2019, 2, 1–5. [Google Scholar] [CrossRef]
  66. Lasch, P.; Nattermann, H.; Erhard, M.; Stämmler, M.; Grunow, R.; Bannert, N.; Appel, B.; Naumann, D. MALDI-TOF mass spectrometry compatible inactivation method for highly pathogenic microbial cells and spores. Anal. Chem. 2008, 80, 2026–2034. [Google Scholar] [CrossRef]
  67. Jeong, Y.S.; Choi, S.; Chong, E.; Kim, J.H.; Kim, S.J. Rapid detection of B acillus spore aerosol particles by direct in situ analysis using MALDI-TOF mass spectrometry. Lett. Appl. Microbiol. 2014, 59, 177–183. [Google Scholar] [CrossRef]
  68. Johansson, Å.; Nagy, E.; Sóki, J. Detection of carbapenemase activities of Bacteroides fragilis strains with matrix-assisted laser desorption ionization—time of flight mass spectrometry (MALDI-TOF MS). Anaerobe 2014, 26, 49–52. [Google Scholar] [CrossRef]
  69. Hoyos-Mallecot, Y.; Cabrera-Alvargonzalez, J.; Miranda-Casas, C.; Rojo-Martín, M.D.; Liebana-Martos, C.; Navarro-Marí, J. MALDI-TOF MS, a useful instrument for differentiating metallo-β-lactamases in Enterobacteriaceae and Pseudomonas spp. Lett. Appl. Microbiol. 2014, 58, 325–329. [Google Scholar] [CrossRef]
  70. Hart, P.J.; Wey, E.; McHugh, T.D.; Balakrishnan, I.; Belgacem, O. A method for the detection of antibiotic resistance markers in clinical strains of Escherichia coli using MALDI mass spectrometry. J. Microbiol. Methods 2015, 111, 1–8. [Google Scholar] [CrossRef]
  71. Ferone, M.; Gowen, A.; Fanning, S.; Scannell AG, M. Microbial detection and identification methods: Bench top assays to omics approaches. Compr. Rev. Food Sci. Food Saf. 2020, 19, 1–24. [Google Scholar] [CrossRef]
  72. Harz, M.; Rösch, P.; Popp, J. Vibrational spectroscopy—A powerful tool for the rapid identification of microbial cells at the single-cell level. Cytom. Part A 2009, 75, 104–113. [Google Scholar] [CrossRef]
  73. Roggo, Y.; Chalus, P.; Maurer, L.; Lema-Martinez, C.; Edmond, A.; Jent, N. A review of near infrared spectroscopy and chemometrics in pharmaceutical technologies. J. Pharm. Biomed. Anal. 2007, 44, 683–700. [Google Scholar] [CrossRef]
  74. Hamprecht, J.; Corsten, D.; Noll, M.; Meier, E. Controlling the sustainability of food supply chains. Supply Chain. Manag. Int. J. 2005, 10, 7–10. [Google Scholar] [CrossRef]
  75. Curto, B.; Moreno, V.; García-Esteban, J.A.; Blanco, F.J.; González, I.; Vivar, A.; Revilla, I. Accurate prediction of sensory attributes of cheese using near-infrared spectroscopy based on artificial neural network. Sensors 2020, 20, 3566. [Google Scholar] [CrossRef]
  76. Li, B.; Lin, Y.; Yu, W.; Wilson, D.I.; Young, B.R. Application of mechanistic modelling and machine learning for cream cheese fermentation pH prediction. J. Chem. Technol. Biotechnol. 2020, 96, 125–133. [Google Scholar] [CrossRef]
  77. Sipos, A. A knowledge-based system as a sustainable software application for the supervision and intelligent control of an alcoholic fermentation process. Sustainability 2020, 12, 10205. [Google Scholar] [CrossRef]
  78. Viejo, C.G.; Torrico, D.D.; Dunshea, F.R.; Fuentes, S. Development of artificial neural network models to assess beer acceptability based on sensory properties using a robotic pourer: A comparative model approach to achieve an artificial intelligence system. Beverages 2019, 5, 33. [Google Scholar] [CrossRef] [Green Version]
  79. Deng, X.; Cao, S.; Horn, A.L. Emerging Applications of Machine Learning in Food Safety. Annu. Rev. Food Sci. Technol. 2021, 12, 513–538. [Google Scholar] [CrossRef]
  80. Vajdi, M.; Varidi, M.J.; Varidi, M.; Mohebbi, M. Using electronic nose to recognize fish spoilage with an optimum classifier. J. Food Meas. Charact. 2019, 13, 1205–1217. [Google Scholar] [CrossRef]
  81. Gutiérrez, P.; Godoy, S.E.; Torres, S.; Oyarzún, P.; Sanhueza, I.; Díaz-García, V.; Contreras-Trigo, B.; Coelho, P. Improved anti-biotic detection in raw milk using machine learning tools over the absorption spectra of a problem-specific nanobiosensor. Sensors 2020, 20, 4552. [Google Scholar] [CrossRef]
  82. Karami, H.; Rasekh, M.; Mirzaee-Ghaleh, E. Application of the E-nose machine system to detect adulterations in mixed edible oils using chemometrics methods. J. Food Process Preserv. 2020, 44, 1–12. [Google Scholar] [CrossRef]
  83. Ayari, F.; Mirzaee- Ghaleh, E.; Rabbani, H.; Heidarbeigi, K. Using an E-nose machine for detecting the adulteration of margarine in cow ghee. J. Food Process. Eng. 2018, 41, e12806. [Google Scholar] [CrossRef]
  84. Amigo, J.M.; Martí, I.; Gowen, A. Hyperspectral imaging and chemometrics: A perfect combination for the analysis of food structure, composition and quality. Data Handl. Sci. Technol. 2013, 28, 343–370. [Google Scholar]
  85. Spyrelli, E.D.; Papachristou, C.K.; Nychas, G.J.E.; Panagou, E.Z. Microbiological Quality Assessment of Chicken Thigh Fillets Using Spectroscopic Sensors and Multivariate Data Analysis. Foods 2021, 10, 2723. [Google Scholar] [CrossRef] [PubMed]
  86. Cebrián, E.; Núñez, F.; Rodríguez, M.; Grassi, S.; González-Mohino, A. Potential of Near Infrared Spectroscopy as a Rapid Method to Discriminate OTA and Non-OTA-Producing Mould Species in a Dry-Cured Ham Model System. Toxins 2021, 13, 620. [Google Scholar] [CrossRef] [PubMed]
  87. Alexandrakis, D.; Downey, G.; Scannell, A.G.M. Rapid non-destructive detection of spoilage of intact chicken breast muscle using near-infrared and Fourier transform mid-infrared spectroscopy and multivariate statistics. Food Bioprocess Technol. 2012, 5, 338–347. [Google Scholar] [CrossRef]
  88. Azadshahraki, F.; Sharifi, K.; Jamshidi, B.; Karimzadeh, R.; Naderi, H. Diagnosis of Early Blight Disease in Tomato Plant based on Visible/Near-Infrared Spectroscopy and Principal Components Analysis-Artificial Neural Network Prior to Visual Disease Symptoms. J. Agric. Mach. 2022, 12, 81–94. [Google Scholar]
  89. Rahi, S.; Mobli, H.; Jamshidi, B.; Azizi, A.; Sharifi, M. Achieving a robust Vis/NIR model for microbial contamination detection of Persian leek by spectral analysis based on genetic, iPLS algorithms and VIP scores. Postharvest Biol. Technol. 2021, 175, 111413. [Google Scholar] [CrossRef]
  90. Sirisomboon, C.D.; Wongthip, P.; Sirisomboon, P. Potential of near infrared spectroscopy as a rapid method to detect aflatoxins in brown rice. J. Near Infrared Spectrosc. 2019, 27, 232–240. [Google Scholar] [CrossRef]
  91. Tao, F.; Yao, H.; Hruska, Z.; Liu, Y.; Rajasekaran, K.; Bhatnagar, D. Detection of aflatoxin B1 on corn kernel surfaces using visible-near infrared spectroscopy. J. Near Infrared Spectrosc. 2020, 28, 59–69. [Google Scholar] [CrossRef]
  92. Pan, W.; Zhao, J.; Chen, Q. Classification of foodborne pathogens using near infrared (NIR) laser scatter imaging system with multivariate calibration. Sci. Rep. 2015, 5, 9524. [Google Scholar] [CrossRef] [Green Version]
  93. Duan, C.; Chen, C.; Khan, M.N.; Liu, Y.; Zhang, R.; Lin, H.; Cao, L. Non-destructive determination of the total bacteria in flounder fillet by portable near infrared spectrometer. Food Control 2014, 42, 18–22. [Google Scholar] [CrossRef]
  94. Tito, N.B.; Rodemann, T.; Powell, S.M. Use of near infrared spectroscopy to predict microbial numbers on Atlantic salmon. Food Microbiol. 2012, 32, 431–436. [Google Scholar] [CrossRef]
  95. Wang, C.; Liu, M.; Wang, Z.; Li, S.; Deng, Y.; He, N. Point-of-care diagnostics for infectious diseases: From methods to devices. Nano Today 2021, 37, 101092. [Google Scholar] [CrossRef]
  96. El-Bouri, K.; Johnston, S.; Rees, E.; Thomas, I.; Bome-Mannathoko, N.; Jones, C.; Reid, M.; Ben-Ismaeil, B.; Davies, A.P.; Harris, L.G.; et al. Comparison of bacterial identification by MALDI-TOF mass spectrometry and conventional diagnostic microbiology methods: Agreement, speed and cost implications. Br. J. Biomed. Sci. 2012, 69, 47–55. [Google Scholar] [CrossRef]
  97. Yeh, Y.T.; Gulino, K.; Zhang, Y.; Sabestien, A.; Chou, T.W.; Zhou, B.; Lin, Z.; Albert, I.; Lu, H.; Swaminathan, V.; et al. A rapid and label-free platform for virus capture and identification from clinical samples. Proc. Natl. Acad. Sci. USA 2020, 117, 895–901. [Google Scholar] [CrossRef] [Green Version]
  98. Ye, J.; Yeh, Y.T.; Xue, Y.; Wang, Z.; Zhang, N.; Liu, H.; Zhang, K.; Yu, Z.; Roder, A.; Lopez, N.P.; et al. Accurate Virus Identification with Interpretable Raman Signatures by Machine Learning. bioRxiv 2021. [Google Scholar] [CrossRef]
  99. Rebrošová, K.; Bernatová, S.; Šiler, M.; Uhlirova, M.; Samek, O.; Ježek, J.; Holá, V.; Růžička, F.; Zemanek, P. Raman spectroscopy-a tool for rapid differentiation among microbes causing urinary tract infections. Anal. Chim. Acta 2022, 1191, 339292. [Google Scholar] [CrossRef]
  100. Zhao, Y.; Tian, S.; Yu, L.; Zhang, Z.; Zhang, W. Analysis and Classification of Hepatitis Infections Using Raman Spectroscopy and Multiscale Convolutional Neural Networks. J. Appl. Spectrosc. 2021, 88, 441–451. [Google Scholar] [CrossRef]
  101. Tiwari, D.; Jakhmola, S.; Pathak, D.K.; Kumar, R.; Jha, H.C. Temporal In Vitro Raman Spectroscopy for Monitoring Replication Kinetics of Epstein-Barr Virus Infection in Glial Cells. ACS Omega 2020, 5, 29547–29560. [Google Scholar] [CrossRef]
  102. Zyubin, A.; Lavrova, A.; Manicheva, O.; Dogonadze, M.; Belik, V.; Samusev, I. Raman spectroscopy for glutathione measurements in Mycobacterium tuberculosis strains with different antibiotic resistance. J. Raman Spectrosc. 2021, 52, 1661–1666. [Google Scholar] [CrossRef]
  103. Barker, K.R.; Santino, M.; LiPuma, J.J.; Tullis, E.; Muller, M.P.; Matukas, L.M.; Tadros, M. Fourier Transform Infrared Spectroscopy for Typing Burkholderia cenocepacia ET12 Isolates. Microbiol. Spectr. 2021, 9, e0183121. [Google Scholar] [CrossRef] [PubMed]
  104. Jia, X.; Liu, Z.; Peng, Y.; Hou, G.; Chen, W.; Xiao, R. Automatic and sensitive detection of West Nile virus non-structural protein 1 with a portable SERS-LFIA detector. Mikrochim. Acta 2021, 188, 206. [Google Scholar] [CrossRef] [PubMed]
  105. Sánchez-Purrà, M.; Carré-Camps, M.; de Puig, H.; Bosch, I.; Gehrke, L.; Hamad-Schifferli, K. Surface-Enhanced Raman Spectroscopy-Based Sandwich Immunoassays for Multiplexed Detection of Zika and Dengue Viral Biomarkers. ACS Infect. Dis. 2017, 3, 767–776. [Google Scholar] [CrossRef] [PubMed]
  106. Girard, A.; Cooper, A.; Mabbott, S.; Bradley, B.; Asiala, S.; Jamieson, L.; Clucas, C.; Capewell, P.; Marchesi, F.; Gibbins, M.P.; et al. Raman spectroscopic analysis of skin as a diagnostic tool for Human African Trypanosomiasis. PLoS Pathog. 2021, 17, e1010060. [Google Scholar] [CrossRef]
  107. Goh, B.; Ching, K.; Magalhães, R.J.S.; Ciocchetta, S.; Edstein, M.D.; Maciel-de-Freitas, R.; Sikulu-Lord, M.T. The application of spectroscopy techniques for diagnosis of malaria parasites and arboviruses and surveillance of mosquito vectors: A systematic review and critical appraisal of evidence. PLoS Negl. Trop. Dis. 2021, 15, e0009218. [Google Scholar] [CrossRef]
  108. Sanchez, L.; Ermolenkov, A.; Tang, X.T.; Tamborindeguy, C.; Kurouski, D. Non-invasive diagnostics of Liberibacter disease on tomatoes using a hand-held Raman spectrometer. Planta 2020, 251, 64. [Google Scholar] [CrossRef]
  109. Vallejo-Pérez, M.R.; Sosa-Herrera, J.A.; Navarro-Contreras, H.R.; Álvarez-Preciado, L.G.; Rodríguez-Vázquez, Á.G.; Lara-Ávila, J.P. Raman Spectroscopy and Machine-Learning for Early Detection of Bacterial Canker of Tomato: The Asymptomatic Disease Condition. Plants 2021, 10, 1542. [Google Scholar] [CrossRef]
  110. Strycker, B.D.; Han, Z.; Duan, Z.; Commer, B.; Wang, K.; Shaw, B.D.; Sokolov, A.V.; Scully, M.O. Identification of toxic mold species through Raman spectroscopy of fungal conidia. PLoS ONE 2020, 15, e0242361. [Google Scholar] [CrossRef]
  111. Saif, F.A.; Yaseen, S.A.; Alameen, A.S.; Mane, S.B.; Undre, P.B. Identification and characterization of Aspergillus species of fruit rot fungi using microscopy, FT-IR, Raman and UV-Vis spectroscopy. Spectrochim. Acta. Part A Mol. Biomol. Spectrosc. 2021, 246, 119010. [Google Scholar] [CrossRef]
  112. Mandrile, L.; Rotunno, S.; Miozzi, L.; Vaira, A.M.; Giovannozzi, A.M.; Rossi, A.M.; Noris, E. Nondestructive Raman Spectroscopy as a Tool for Early Detection and Discrimination of the Infection of Tomato Plants by Two Economically Important Viruses. Anal. Chem. 2019, 91, 9025–9031. [Google Scholar] [CrossRef]
  113. Huang, C.C.; Hsu, Z.H.; Lai, Y.S. Raman spectroscopy for virus detection and the implementation of unorthodox food safety. Trends Food Sci. Technol. 2021, 116, 525–532. [Google Scholar] [CrossRef]
  114. Petersen, M.; Yu, Z.; Lu, X. Application of Raman Spectroscopic Methods in Food Safety: A Review. Biosensors 2021, 11, 187. [Google Scholar] [CrossRef]
  115. Deidda, F.; Cionci, N.B.; Cordovana, M.; Campedelli, I.; Fracchetti, F.; Di Gioia, D.; Ambretti, S.; Pane, M. Bifidobacteria Strain Typing by Fourier Transform Infrared Spectroscopy. Front. Microbiol. 2021, 12, 692975. [Google Scholar] [CrossRef]
  116. Yakes, B.J.; Ellsworth, Z.; Karunathilaka, S.R.; Crump, E. Evaluation of Portable Sensor and Spectroscopic Devices for Seafood Decomposition Determination. Food Anal. Methods 2021, 14, 2346–2356. [Google Scholar] [CrossRef]
  117. Wang, K.; Chen, L.; Ma, X.; Ma, L.; Chou, K.C.; Cao, Y.; Khan, I.; Gölz, G.; Lu, X. Arcobacter Identification and Species Determination Using Raman Spectroscopy Combined with Neural Networks. Appl. Environ. Microbiol. 2020, 86, e00924-20. [Google Scholar] [CrossRef]
  118. Du, Y.; Han, D.; Liu, S.; Sun, X.; Ning, B.; Han, T.; Wang, J.; Gao, Z. Raman spectroscopy-based adversarial network combined with SVM for detection of foodborne pathogenic bacteria. Talanta 2022, 237, 122901. [Google Scholar] [CrossRef]
  119. Yan, S.; Wang, S.; Qiu, J.; Li, M.; Li, D.; Xu, D.; Li, D.; Liu, Q. Raman spectroscopy combined with machine learning for rapid detection of food-borne pathogens at the single-cell level. Talanta 2021, 226, 122195. [Google Scholar] [CrossRef]
  120. Xu, J.L.; Herrero-Langreo, A.; Lamba, S.; Ferone, M.; Scannell, A.; Caponigro, V.; Gowen, A.A. Characterisation and Classification of Foodborne Bacteria Using Reflectance FTIR Microscopic Imaging. Molecules 2021, 26, 6318. [Google Scholar] [CrossRef]
  121. Lu, J.; Chen, J.; Liu, C.; Zeng, Y.; Sun, Q.; Li, J.; Shen, Z.; Chen, S.; Zhang, R. Identification of antibiotic resistance and virulence-encoding factors in Klebsiella pneumoniae by Raman spectroscopy and deep learning. Microb. Biotechnol. 2022, 15, 1270–1280. [Google Scholar] [CrossRef]
  122. Ciloglu, F.U.; Caliskan, A.; Saridag, A.M.; Kilic, I.H.; Tokmakci, M.; Kahraman, M.; Aydin, O. Drug-resistant Staphylococcus aureus bacteria detection by combining surface-enhanced Raman spectroscopy (SERS) and deep learning techniques. Sci. Rep. 2021, 11, 18444. [Google Scholar] [CrossRef]
  123. Chen, X.; Tang, M.; Liu, Y.; Huang, J.; Liu, Z.; Tian, H.; Zheng, Y.; de la Chapelle, M.L.; Zhang, Y.; Fu, W. Surface-enhanced Raman scattering method for the identification of methicillin-resistant Staphylococcus aureus using positively charged silver nanoparticles. Mikrochim. Acta 2019, 186, 102. [Google Scholar] [CrossRef] [PubMed]
  124. Ma, L.; Chen, L.; Chou, K.C.; Lu, X. Campylobacter jejuni Antimicrobial Resistance Profiles and Mechanisms Determined Using a Raman Spectroscopy-Based Metabolomic Approach. Appl. Environ. Microbiol. 2021, 87, e0038821. [Google Scholar] [CrossRef] [PubMed]
  125. Yi, X.; Song, Y.; Xu, X.; Peng, D.; Wang, J.; Qie, X.; Lin, K.; Yu, M.; Ge, M.; Wang, Y.; et al. Development of a Fast Raman-Assisted Antibiotic Susceptibility Test (FRAST) for the Antibiotic Resistance Analysis of Clinical Urine and Blood Samples. Anal. Chem. 2021, 93, 5098–5106. [Google Scholar] [CrossRef] [PubMed]
  126. Gannesen, A.V.; Zdorovenko, E.L.; Botchkova, E.A.; Hardouin, J.; Massier, S.; Kopitsyn, D.S.; Gorbachevskii, M.V.; Kadykova, A.A.; Shashkov, A.S.; Zhurina, M.V.; et al. Composition of the Biofilm Matrix of Cutibacterium acnes Acneic Strain RT5. Front. Microbiol. 2019, 10, 1284. [Google Scholar] [CrossRef]
  127. Do, H.; Kwon, S.R.; Fu, K.; Morales-Soto, N.; Shrout, J.D.; Bohn, P.W. Electrochemical Surface-Enhanced Raman Spectroscopy of Pyocyanin Secreted by Pseudomonas aeruginosa Communities. Langmuir ACS J. Surf. Colloids 2019, 35, 7043–7049. [Google Scholar] [CrossRef]
  128. Horiue, H.; Sasaki, M.; Yoshikawa, Y.; Toyofuku, M.; Shigeto, S. Raman spectroscopic signatures of carotenoids and polyenes enable label-free visualization of microbial distributions within pink biofilms. Sci. Rep. 2020, 10, 7704. [Google Scholar] [CrossRef]
  129. Kriem, L.S.; Wright, K.; Ccahuana-Vasquez, R.A.; Rupp, S. Mapping of a Subgingival Dual-Species Biofilm Model Using Confocal Raman Microscopy. Front. Microbiol. 2021, 12, 729720. [Google Scholar] [CrossRef]
  130. World Health Organization. Clinical Management of COVID-19: Living Guideline, 13 January 2023; World Health Organization: Geneva, Switzerland, 2023. [Google Scholar]
  131. Wood, B.R.; Kochan, K.; Bedolla, D.E.; Salazar-Quiroz, N.; Grimley, S.L.; Perez-Guaita, D.; Baker, M.J.; Vongsvivut, J.; Tobin, M.J.; Bambery, K.R.; et al. Infrared Based Saliva Screening Test for COVID-19. Angew. Chem. 2021, 60, 17102–17107. [Google Scholar] [CrossRef]
  132. Huang, J.; Wen, J.; Zhou, M.; Ni, S.; Le, W.; Chen, G.; Wei, L.; Zeng, Y.; Qi, D.; Pan, M.; et al. On-Site Detection of SARS-CoV-2 Antigen by Deep Learning-Based Surface-Enhanced Raman Spectroscopy and Its Biochemical Foundations. Anal. Chem. 2021, 93, 9174–9182. [Google Scholar] [CrossRef]
  133. Yadav, S.; Sadique, M.A.; Ranjan, P.; Kumar, N.; Singhal, A.; Srivastava, A.K.; Khan, R. SERS Based Lateral Flow Immunoassay for Point-of-Care Detection of SARS-CoV-2 in Clinical Samples. ACS Appl. Bio Mater. 2021, 4, 2974–2995. [Google Scholar] [CrossRef]
  134. Zavyalova, E.; Ambartsumyan, O.; Zhdanov, G.; Gribanyov, D.; Gushchin, V.; Tkachuk, A.; Rudakova, E.; Nikiforova, M.; Kuznetsova, N.; Popova, L.; et al. SERS-Based Aptasensor for Rapid Quantitative Detection of SARS-CoV-2. Nanomaterials 2021, 11, 1394. [Google Scholar] [CrossRef]
  135. Desai, S.; Mishra, S.V.; Joshi, A.; Sarkar, D.; Hole, A.; Mishra, R.; Dutt, S.; Chilakapati, M.K.; Gupta, S.; Dutt, A. Raman spectroscopy-based detection of RNA viruses in saliva: A preliminary report. J. Biophotonics 2020, 13, e202000189. [Google Scholar] [CrossRef]
  136. Guleken, Z.; Jakubczyk, P.; Wiesław, P.; Krzysztof, P.; Bulut, H.; Öten, E.; Depciuch, J.; Tarhan, N. Characterization of Covid-19 infected pregnant women sera using laboratory indexes, vibrational spectroscopy, and machine learning classifications. Talanta 2022, 237, 122916. [Google Scholar] [CrossRef]
  137. Guleken, Z.; Tok, Y.T.; Jakubczyk, P.; Paja, W.; Pancerz, K.; Shpotyuk, Y.; Cebulski, J.; Depciuch, J. Development of novel spectroscopic and machine learning methods for the measurement of periodic changes in COVID-19 antibody level. Measurement 2022, 196, 111258. [Google Scholar] [CrossRef]
  138. Wu, X.; Zhao, Y.; Zughaier, S.M. Highly Sensitive Detection and Differentiation of Endotoxins Derived from Bacterial Pathogens by Surface-Enhanced Raman Scattering. Biosensors 2021, 11, 234. [Google Scholar] [CrossRef]
  139. Ge, X.; Pereira, F.C.; Mitteregger, M.; Berry, D.; Zhang, M.; Wagner, M.; Cheng, J.X. SRS-FISH: High-Throughput Platform Linking Microbiome Function to Identity at the Single Cell Level. bioRxiv 2021. [Google Scholar] [CrossRef]
  140. Wang, Y.; Xu, J.; Cui, D.; Kong, L.; Chen, S.; Xie, W.; Zhang, C. Classification and Identification of Archaea Using Single-Cell Raman Ejection and Artificial Intelligence: Implications for Investigating Uncultivated Microorganisms. Anal. Chem. 2021, 93, 17012–17019. [Google Scholar] [CrossRef]
  141. Ren, Y.; Ji, Y.; Teng, L.; Zhang, H. Using Raman spectroscopy and chemometrics to identify the growth phase of Lactobacillus casei Zhang during batch culture at the single-cell level. Microb. Cell Factories 2017, 16, 233. [Google Scholar] [CrossRef] [Green Version]
  142. Yan, S.; Qiu, J.; Guo, L.; Li, D.; Xu, D.; Liu, Q. Development overview of Raman-activated cell sorting devoted to bacterial detection at single-cell level. Appl. Microbiol. Biotechnol. 2021, 105, 1315–1331. [Google Scholar] [CrossRef]
  143. Song, Y.; Kaster, A.K.; Vollmers, J.; Song, Y.; Davison, P.A.; Frentrup, M.; Preston, G.M.; Thompson, I.P.; Murrell, J.C.; Yin, H.; et al. Single-cell genomics based on Raman sorting reveals novel carotenoid-containing bacteria in the Red Sea. Microb. Biotechnol. 2017, 10, 125–137. [Google Scholar] [CrossRef] [Green Version]
  144. García-Timermans, C.; Props, R.; Zacchetti, B.; Sakarika, M.; Delvigne, F.; Boon, N. Raman Spectroscopy-Based Measurements of Single-Cell Phenotypic Diversity in Microbial Populations. mSphere 2020, 5, e00806-20. [Google Scholar] [CrossRef] [PubMed]
  145. Skolrood, L.; Wang, Y.; Zhang, S.; Wei, Q. Single-molecule and particle detection on true portable microscopy platforms. Sens. Actuators Rep. 2022, 4, 100063. [Google Scholar] [CrossRef]
Figure 1. Applications of SERS for pathogenic detection and disease diagnosis.
Processes 11 01191 g001
Figure 2. Overall methodologies for mass spectrometry methods for microbial identification and disease diagnosis.
Processes 11 01191 g002
Figure 3. Overview of applications of spectroscopy in diagnosis.
Processes 11 01191 g003
Figure 4. Spectroscopy and machine learning methods for the detection of bacterial pathogens.
Processes 11 01191 g004
Table 1. Some applications of NIRS in combination with chemometrics for microbial detection.
ApplicationChemometric MethodMain FindingReference
Early detection of blight disease in tomato with Vis-NIR spectroscopyPCA-ANNEarly detection of blight disease and the associated pathogen type was achieved with about 93–100% accuracy[88]
Detection of E. coli contamination in Persian leek with Vis/NIR spectroscopyPLSDA with Genetic Algorithm (GA), interval PLS, variable influence on projection scores GA exhibited high sensitivity (100%) and specificity (98%) and low classification error (0.8) in E. coli detection[89]
Estimation of total viable counts and Pseudomonas spp. in chicken thigh fillets with FTIR and MSIPLSR, LDA, QDA, SVM, and QSVMSVM coupled with multispectral imaging showed the highest performance with about 94.4% overall accuracy [85]
Detection of ochratoxin A-producing fungi from non-ochratoxin-producing fungi in dried meat with NIRSPCA with SVM-DAThe SVM-DA model could differentiate between ochratoxin and non-ochratoxin-producing fungi with 86% specificity and 85% accuracy[86]
Detection of aflatoxin B1 in corn kernel using Vis-NIRSPCA-LDA and PLS-DABoth discriminant and classification models exhibited over 90% accurate performance[91]
Detection of aflatoxin contamination in brown rice with NIRSPLSRThe model showed good predictive performance with a prediction coefficient of 0.95%[90]
Classification of foodborne pathogens (E. coli, S. aureus, S. typhimurium, and mixed bacteria) using NIR-LSISLinear (PLSDA, KNN, and LDA) and nonlinear (BPANN, OSELM, and SVM)Nonlinear methods performed better than linear methods, with OSELM exhibiting a performance accuracy of 95%[92]
Quantification of total bacteria in fish fillets with a portable NIR spectrometerPLS, GA combined with BPANNGA combined with BPANN exhibited a better efficiency of prediction (about 96% accuracy) than PLS[93]
Non-invasive and non-destructive detection of spoilage in chicken breast muscles via NIRS and FTIRPCA, PLS-DA, and outer product analysis (OPA)OPA performed better compared to PCA and PLS-DA in discriminating between bacterial loads[87]
Detection and prediction of microbial spoilage in salmon with NIRSPCA and PLSThe validation curve exhibited a large error of R2 = 0.64, although the calibration equation presented a good R2 of 0.95[94]
Disclaimer/Publisher’s Note: The statements, opinions and data contained in all publications are solely those of the individual author(s) and contributor(s) and not of MDPI and/or the editor(s). MDPI and/or the editor(s) disclaim responsibility for any injury to people or property resulting from any ideas, methods, instructions or products referred to in the content.

