Article

Fig Leaves (Ficus carica L.): Source of Bioactive Ingredients for Industrial Valorization

by
Carlos S. H. Shiraishi
1,2,3,
Yosra Zbiss
1,
Custódio Lobo Roriz
1,2,
Maria Inês Dias
1,2,
Miguel A. Prieto
3,
Ricardo C. Calhelha
1,2,
Maria José Alves
1,2,
Sandrina A. Heleno
1,2,
da Cunha Mendes V.
4,
Márcio Carocho
1,2,
Rui M. V. Abreu
1,2 and
Lillian Barros
1,2,*
1
Centro de Investigação de Montanha (CIMO), Instituto Politécnico de Bragança, Campus de Santa Apolónia, 5300-253 Bragança, Portugal
2
Laboratório Associado Para a Sustentabilidade e Tecnologia em Regiões de Montanha (SusTEC), Instituto Politécnico de Bragança, Campus de Santa Apolónia, 5300-253 Bragança, Portugal
3
Nutrition and Bromatology Group, Depart of Analytical Chemistry and Food Science, Faculty of Science, Universidad de Vigo, E-32004 Ourense, Spain
4
Sociedade Agrícola Quinta da Mó de Cima, S.A., Rua Julieta Ferrão, 12 Torre A 602, 1600-131 Lisboa, Portugal
*
Author to whom correspondence should be addressed.
Processes 2023, 11(4), 1179; https://doi.org/10.3390/pr11041179
Submission received: 25 February 2023 / Revised: 30 March 2023 / Accepted: 4 April 2023 / Published: 11 April 2023
(This article belongs to the Special Issue Advances in Green Extraction Processes of Bioactive Compounds)

Abstract

:
The fig tree (Ficus carica L.) was one of the first domesticated trees. In 2019, the world’s fig fruit production was estimated at 1153 tons. However, fig leaves are not utilized, resulting in copious quantities of bio-waste. To identify promising fig tree varieties, hydroethanolic extracts were prepared from the leaves of five fig tree varieties (Pasteliere—PA, Longue d’Aout—LA, Dauphinie—DA, Boujassote Noire—BN, and Marseille—MA). The variety with the highest concentration of organic acids was BN (146.5 mg/g dw), while glucose, fructose, and sucrose were the predominant sugars across all varieties. All extracts present α-tocopherol as the prevalent tocopherol isoform (above 78%), while PUFA fatty acids were predominant, ranging from 53% to 71% of total fatty acids. BN showed moderate antioxidant activity (EC50 0.23 ± 0.01 mg/mL), while the DA variety presented promising cytotoxicity against the tumor AGS and MCF-7 cell line (GI50 158 ± 13 and 223 ± 21 μg/mL) and especially in the inhibition of Nitric Oxide Production evaluation (IC50 20 ± 5 μg/mL). The DA activities are probably related to high concentrations of flavonoids, specifically the predominant apigenin-C-hexoside-C-pentoside and quercetin-O-deoxyhexosyl-hexoside. Finally, the BN and DA varieties showed good antimicrobial activity, especially against Yersinia enterocolitica. Fig leaves can be considered sustainable sources of industrially valuable bioactive molecules, and several potential applications were highlighted.

1. Introduction

The fig (Ficus carica L.) has had significant importance in human history, either in its use as food or in traditional medicine. It is one of the largest genera of angiosperms, with more than 800 species. The first cultivation records date from ~6000 years ago in the Mediterranean [1,2] and the fig fruit has a strong presence in different cultures. It is the first tree mentioned in the Bible, being linked to “paradise” in Islamic culture, and, according to ancient Greek culture, it was considered a gift from Demeter to Mother Earth [3]. As previously mentioned, it is among the first plants cultivated in the world, along with apple and grape, and is consumed in various forms (raw, dehydrated, or incorporated into food), presenting various applications as a remedy in popular medicine [4,5,6]. The fig tree is present in moderate climate regions such as southwest Asia and the eastern Mediterranean region (from Afghanistan to Portugal) [7,8]. In 2007, the Mediterranean region’s top producers represented 70% of global production [1] and the production has been increasing steadily (1,142,611 tons in 2009, 1,148,211 tons in 2014, and 1,315,588 tons in 2019) [9].
Difficulties in the fig production process can generate losses, such as the perishability of the fruit and the drastic pruning necessary to have the fruit in proper ripening conditions [10]. The “Sustainable Development Goals (SDGs) by 2030”, in particular, Goal 12 “Ensure sustainable consumption and production patterns”, are not met by these wasted production losses, notably the leaves that are discarded.
It is estimated that using waste production by-products could generate a total annual benefit of €1.8 trillion for the European Union by 2030 and promote the circular economy [11,12,13]. Incorporating agri-food by-products into the value cycle to decrease biowaste and promote sustainable development at various points along the production chain presents a challenge to the circular economy [14]. The bio-waste from fig fruit production, in particular, fig leaves, can be an alternative source of bioactive compounds for different industries. Possible applications include the replacement of synthetic additives with natural alternatives in the food industry [15] while improving the physical and sensory properties of foods in which they are added.
The compounds found in fig leaves can also be used as natural medicine, as widely documented by traditional medicine in the past. As already described [9], fig leaves present high-value biomolecules with antidiabetic, antipyretic, antioxidant, and antilipemic activities. Li et al. [16] assured that fig leaves could be explored as alternative novel sources of chemical compounds, including phytoconstituents such as organic acids, phenolics, flavonoids, coumarins, and volatile constituents. The same author pointed out different bioactivities for fig leaves, including hypoglycemic, diabetic, antioxidant, anti-inflammatory and anticancer bioactivities. Also significant is fig leaves’ dermatological potential in treating psoriasis and vitiligo [4,5,6,17].
Fig leaves are a well-known source of bioactive components for industrial valorization. In addition to other secondary metabolites, they are a rich source of tannins, flavonoids, and hydrocarbons. These substances have strong antioxidant properties that can be employed in treating and preventing many ailments. They can also be employed as a source of bioactive chemicals to be used as food additives to prepare food products with health benefits. This article’s primary objective is to provide a chemical and biological understanding of five varieties of fig tree leaves (Pasteliere—PA, Longue d’Aout—LA, Dauphinie—DA, Boujassote Noire—BN, and Marseille—MA) and to assess their potential for industrial applications. Only a small body of information is available about this type of characterization of fig leaves. This knowledge may be significant in decreasing the production of biological waste, giving it an economic value, and highlighting the significance of fig leaves as a potential source of compounds for commercial applications.

2. Materials and Methods

2.1. Chemicals, Reagents, and Samples

All chemicals and reagents used in this research were purchased from scientific suppliers and were at least analytical grade except those utilized in high-performance liquid chromatography (HPLC), which employed HPLC-grade chemicals and reagents. Samples were supplied by the agricultural firm “Mó de Cima”, located on the Setubal peninsula, right on the edge of the Arrábida Natural Park in Portugal. The company is devoted to the exploration and production of figs of various varieties.

2.2. Samples Preparation

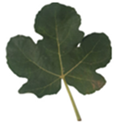
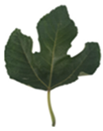
The company “Mó de Cima” provided samples of leaves from the five fig varieties PA, LA, DA, BN, and MA (Lisbon, Portugal). The company’s botanical co-ordinator identified the varieties by analyzing the leaves’ morphology since they display noticeable differences. To remove the water from the fresh fig leaves, they were separated and allowed to dry at room temperature while being protected from light and moisture for two weeks. The samples were powdered and kept in a dry environment for further examination.

2.3. Color Measurement

For colorimetric analysis of the fig leaves, a colorimeter (model CR-400, Konica Minolta Sensig Inc., Tokyo, Japan) was used, equipped with illuminant C and an 8 mm diaphragm and calibrated with the white color standard tile, for evaluation of the three CIELAB (Commission Internationale de l’Elcairage) color parameters: L* (brightness), a* (green-red), and b* (blue-yellow); the Spectra Magic Nx software (version CM-S100W2.03.006) was used as discussed elsewhere [18]

2.4. Preparation of Hydroethanolic Extracts

The extracts were obtained by a green solid–liquid extraction, resorting to dynamic maceration of 1 g of sample with 30 mL of hydroethanolic solution (ethanol:water, 80:20 v/v), stirred continuously at room temperature for 1 h on a magnetic stirrer, filtered on Whatman nº4 filter paper, and then extracted for an additional 1 h. A Büchi R-210 rotary evaporator at decreased pressure and 40 °C was used to extract all the ethanol under vacuum, and the solution was frozen and lyophilized. The recovered extract was stored and protected by light and humidity until further analysis.

2.5. Chromatographic Analysis of Chemical Constituents

2.5.1. Organic Acids

As previously described [19], organic acids were analyzed by ultra-fast liquid chromatography (UFLC) using a Shimadzu 20A series (Shimadzu Corporation, Kyoto, Japan) linked to a photodiode array detector (PDA). Chromatographic separation was accomplished on a SphereClone (Phenomenex, Torrance, CA, USA) reverse phase C18 column (250 mm 4.6 mm; 5 m) thermostated at 35 °C. Sulphuric acid (3.6 mM) was used for elution at a rate of 0.8 mL/min; the run time is 30 min. The identified organic acids were measured by comparing the areas of the peaks observed at 215 nm with calibration curves derived from commercial standards of each chemical. Results were given in g per kg of dry weight (dw).

2.5.2. Free Sugars

Leaf samples’ sugar content was analyzed using high-performance liquid chromatography (HPLC) coupled with a refractive index (RI) detector. The internal standard method (IS, melezitose, Sigma-Aldrich, St. Louis, MO, USA), as previously published by Barros et al., 2013 [19], was utilized to quantify the soluble sugars (Knauer, Smartline system 1000, Berlin, Germany). The mobile phase was acetonitrile:water (70:30 v/v, acetonitrile HPLC-grade, Lab-Scan, Lisbon, Portugal), operating with isocratic gradient at a flow rate of 1 mL/min and the chemicals were separated on a Eurospher 100-5 NH2 column (4.6 250 mm, 5 m, Knauer, Berlin, Germany), in a 20 min run, with the data being processed using Clarity v.2.4 software (DataApex, Prague, Czech Republic).

2.5.3. Tocopherols

The leaf’s tochopherol content was determined using a HPLC system (Knauer, Smartline system 1000, Berlin, Germany) coupled to a fluorescence detector (FP-2020; Jasco, Easton, PA, USA), programmed for excitation at 290 nm and emission at 330 nm. This analytical procedure was previously described by Barros et al., 2013 [19]. The internal standard (tocol, from Matreya, Pleasant Gap, PA, USA) technique was employed for quantification. A polyamide II column (250 mm, 4.6 mm, 5 m; YMC, Kyoto, Japan) was employed for chromatographic separation, in a 20 min run. Hexane and ethyl acetate were combined as the mobile phase (HPLC-grade solvents from Lab-Scan, Lisbon, Portugal; 70:30, v/v) operating with isocratic gradient at a flow rate of 1 mL/min. Clarity 2.4 software was used to capture and analyze the data, and results were given as mg/100 g dw.

2.5.4. Fatty Acids

The fatty acids were determined using a gas chromatograph (DANI1000, Contone, Switzerland) outfitted with a split/spitless injector and a flame ionization detector (GC-FID at 260 °C) resorting to a Zebron–Fame column (30 m × 0.25 mm ID × 0.20 µm df, Phenomenex, Lisbon, Portugal) and operated under the conditions outlined previously [19]. Hydrogen was used as the carrier gas at a flow rate of 4 mL/min, and the run time of 26 min. Identifying and quantifying the fatty acids was performed by comparing the respective retention periods of fatty acid methyl esters (FAME) reference standard mixture, Sigma-Aldrich, St. Louis, MO, USA. Data were recorded and processed using CSW 1.7 software (Data Apex 1.7, Prague, Czech Republic).

2.5.5. Phenolic Compounds

The hydroethanolic extracts were redissolved in ethanol:water (80:20, v/v) at 10 mg/mL concentrations. The phenolic profile was determined using liquid chromatography (Dionex Ultimate 3000 UPLC, Thermo Scientific, San Jose, CA, USA) with a quaternary pump and diode array detector coupled in series (wavelengths of 280, 330, and 370 nm) to an electrospray ionization mass spectrometry detector (LC-DAD-ESI/MSn), and operating in negative mode with a m/z following the methodology described previously [20]. The solvents used were: (A) 0.1% formic acid in water, and (B) acetonitrile. The elution gradient established was isocratic 15% B (5 min), 15–20% B (5 min), 20–25% B (10 min), 25–35% B (10 min), 35–50% B (10 min), and re-equilibration of the column, using a flow rate of 0.5 mL/min, resulting in a run time of 0.70 min. Double online detection was carried out in the DAD using 280 and 370 nm as preferred wavelengths and in a mass spectrometer (MS) connected to HPLC system via the DAD cell outlet.
The phenolic compounds were identified by comparing each peak’s chromatographic responses and mass spectra information with data available in the literature. Then, 7-level calibration curves were used with the standard compounds to quantify the peaks. For the identified peaks with no available standard compounds, the quantification was performed with the most similar standard regarding chromatographic responses. Results were expressed in mg/g dry extract.

2.6. Evaluation of Bioactive Properties

2.6.1. Antioxidant Activity

Antioxidant activity was measured by evaluating the fig leaves’ extract’s (8 mg/mL in water) ability to demonstrate 50% inhibition of lipid peroxidation in porcine brain homogenate (Sus scrofa). This evaluation was accomplished by using the TBARS (thiobarbituric acid reactive substances) method that measures the formation of the malondialdehyde-thiobarbituric acid complex (MDA-TBA) at 532 nm, with results expressed as IC50 (mg/mL extract) [21,22,23].
The cellular antioxidant activity (CAA) method was also performed, using RAW 264.7 (murine macrophage cell line) cells as described previously [24]. Briefly, the leaf extracts were evaluated for their ability to inhibit the oxidation of dichlorofluorescin to fluorescent dichlorofluorescein (DCF) promoted through peroxyl radicals generated by dichlorhydrochloride addition. Quercetin standard was used as the positive control, and the results were expressed in % inhibition of the maximum tested concentration (2 mg/mL).

2.6.2. Cytotoxic and Hepatotoxic Activities

The cytotoxic and hepatotoxic activities of the extracts (8 mg/mL in water) were tested using the sulforhodamine B assay, according to the procedure described previously [25,26]. To perform this assay, three human tumor cell lines were used: MCF-7 (human breast adenocarcinoma), AGS (gastric adenocarcinoma), and CaCo2 (colon adenocarcinoma), obtained from the European Collection of Authenticated Cell Cultures (ECACC) collection. In addition, two non-tumor cell lines were used: VERO (non-tumor African monkey embryo kidney cell line), also obtained from ECACC, and PLP2 (non-tumor porcine liver primary culture), a cell line prepared in-house according to Mandim et al., 2019 [26]. Ellipticine (Sigma-Aldrich, St. Louis, MO, USA) was used as a positive control for all cell lines, and the results obtained are presented as the extract concentration required for 50% inhibition of cell proliferation (GI50 in μg/mL).

2.6.3. Inhibition of Nitric Oxide Production Evaluation

The inhibition of nitric oxide production of the extracts (8 mg/mL in water) was performed by evaluating their ability to inhibit lipopolysaccharide (LPS)-induced nitric oxide (NO) production. The RAW 264.7 cell line (ECACC) was used as described previously [27,28], and dexamethasone (Sigma-Aldrich, Saint Louis, MO, USA) was used as the positive control. Samples without LPS (Sigma-Aldrich, Saint Louis, MO, USA) were considered negative control, with results expressed at EC50 values, in μg/mL.

2.6.4. Antimicrobial Activity

Fig leaves’ extracts were redissolved in a 10 mg/mL concentration using a 5% DMSO (dimethyl sulfoxide) solution as solvent. The antimicrobial activity was tested following the procedure described by other authors [29,30]. The antibacterial potential of the extracts was evaluated against Gram-negative bacteria (Enterobacter cloacae, Escherichia coli, Pseudomonas aeruginosa, Salmonella enterica, and Yersinia enterocolitica), Gram-positive bacteria (Bacillus cereus, Listeria monocytogenes, and Staphylococcus aureus), and fungi (Aspergillus brasiliensis and Aspergillus fumigatus). Streptomycin (1 mg/mL), methicillin (1 mg/mL), ampicillin (1 mg/mL), and ketoconazole (1 mg/mL) were used as positive controls for Gram-negative, Gram-positive bacteria, and fungi, respectively. The results were expressed as the extract minimum concentration (mg/mL) that inhibited bacterial and fungal growth (MIC) and the minimum concentration (mg/mL) that killed the tested strains of bacteria (MBC) and fungi (MFC).

2.7. Statistical Analysis

In all the assays, the samples were analyzed in triplicate, with results obtained analyzed by one-way analysis of variance (ANOVA), followed by Tukey’s HSD test (p = 0.05) for expression of standard deviation (SD), and Student’s t-test (α = 0.05) was applied to evaluate significant differences. All statistical analyses were performed using the SPSS Statistics v. 23.0 software (IBM Corp., Armonk, NY, USA).

3. Results and Discussion

3.1. Color Measurement

The CIELab color parameters, L* (brightness), a* (green-red), and b* (blue-yellow), for the leaves of the five fig varieties were measured and converted into RGB format, representing the color hues (Table 1). The color measurement results indicated different shades of green for the leaves of the different varieties, with the BN and LA varieties presenting higher L* (41.1 and 38.2, respectively) and a* parameter values (17.7 and 16.1, respectively). This variation indicates that BN and LA present a lighter (higher L* parameter) and a more yellowish color (higher b* parameter). This difference is clearly visible to the naked eye by observing the obtained RGB color compared to the leaves of the other varieties.

3.2. Chemical Composition

3.2.1. Organic Acids

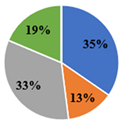
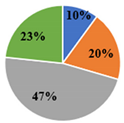
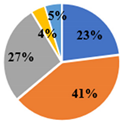
In terms of organic acid composition, depicted in Table 2, all five varieties present almost exclusively oxalic, quinic, malic, and citric acids. The remaining organic acids analyzed (shikimic, ascorbic, and fumaric acids) are only present in minimal (<0.1%) or trace amount quantities. The BN variety presents the highest concentration of total organic acids (146.5 ± 1.1 g/100 g dw), with malic acid at 36%, oxalic acid at 33%, quinic acid at 16%, and citric acid at 15%. In a previous study on fig leaves from the “Brown Turkey” variety [31], the authors identified malic, citric, and oxalic acids as the organic acids with the highest concentrations. The PA and MA varieties present a similar organic acid composition pattern to the BN variety. However, the LA variety presented a significantly higher percentage of oxalic acid (57%) and a lower percentage of malic acid (3%) compared to the BN, PA, and MA varieties. Oxalic acid is generally found in green leaves [4], and the results obtained in this study corroborate this assessment. In a previous study, the authors were also able to identify oxalic acid in the leaves of the “Pingo de Mel” (24.06 ± 16.3 g/100 g dw) and “Branca Tradicional” (9.83 ± 58.8 g/100 g dw) fig varieties, with concentrations in line with the varieties analyzed in this study [4].
On the other hand, the DA variety presents an alternative organic acid profile with a higher percentage of malic acid (47%) and a lower percentage of oxalic acid (10%). This fact is of interest as malic acid is widely applied in the food industry (sweets, bakery, and jellies) and drinks (soft drinks), labelled as E296, due to its acidulant action and as a flavor enhancer [32]. Other malic acid applications include in medicine against migraine and in biotechnology to produce biopolymers by dicarboxylic composition [4].

3.2.2. Free Sugars

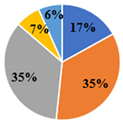
The free sugars content was also analyzed in the leaves of the five varieties and is presented in Table 3. The total amount of free sugars varies significantly, with the DA variety presenting the highest amount of total free sugars (17.36 ± 0.08 g/100 g dw), followed by BN (15.57 ± 0.03 g/100 g dw), MA (10.08 ± 0.06 g/100 g dw), PA (5.34 ± 0.02 g/100 g dw), and finally LA (4.95 ± 0.02 g/100 g dw). Fructose and glucose represent a significant percentage of the sugars found, especially in the DA, BN, and LA varieties, with a combined amount (glucose and fructose) of 87%, 64%, and 75%, respectively. For instance, the DA variety presents the highest amounts of glucose, 7.72 ± 0.04 g/100 g dw, accounting for 45% of its composition in free sugars. This value is 5.2 times higher than the amount observed in the PA variety (1.48 ± 0.02 g/100 g dw). Sucrose is also present in significant amounts, while trehalose and raffinose are present in much smaller amounts. In a recent study, the authors also observed significant sugar content variations between different fig varieties and even for the same variety obtained from different locations [33]. Free soluble sugars can be used in the food industry to improve different food’s technical and functional qualities or as an alternative to white sugar [34]. Considering the values of total sugar content, especially in the DA and BN varieties, their leaves could be considered for use as natural sweeteners instead of synthetic sweeteners.

3.2.3. Tocopherols

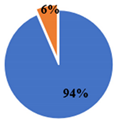
Different isoforms (α, β, and γ) of tocopherol were identified and quantified on the extracts obtained for the different fig varieties, as shown in Table 4. Tocopherols are biological substances that can have beneficial effects on the body, including antioxidant activity, protection of mono- and polyunsaturated fatty acids, and cancer prevention [35]. The PA variety presented the highest amount of total tocopherol with 4.14 ± 0.04 mg/100 g, 2.3× higher than the amount found in the BN and MA varieties, which presented the lowest amounts. In all samples, α-tocopherol was present in much higher concentrations when compared to the other isoforms, ranging from 78% (the BN and MA varieties) to 94% (the LA variety) of total tocopherol content. The γ-tocopherol isoform was present in much lower amounts for all varieties, ranging from 10% to 17% of total tocopherol content, with the DA variety presenting the highest concentration (0.51 ± 0.02 mg/100 g) and the BN variety the lowest amount (0.188 ± 0.007 mg/100 g). For β-tocopherol, the percentage observed was between 5% and 12% of total tocopherol, with the PA variety presenting the highest quantity (0.29 ± 0.01 mg/100 g), presenting 2.1 times the amount observed for the DA (0.14 ± 0.01 mg/100 g) and MA (0.142 ± 0.008 mg/100 g) varieties. A study in F. carica dried leaves obtained an α-tocopherol concentration of 57 mg/100 g [36], a value significantly higher than the quantity observed in this study for all varieties. This is probably an indication that the tocopherol content in leaves probably varies significantly between different fig varieties.

3.2.4. Fatty Acids

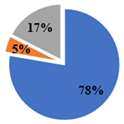
The fatty acid profile of the different fig varieties was obtained and is presented in Table 5. In general, there is a predominance of polyunsaturated fatty acid (PUFA), ranging from 53% (the MA variety) to 71% (the LA variety) in total fatty acid content; followed by saturated fatty acid (SFA), ranging from 29% (the LA variety) to 41% (the MA variety); and monounsaturated fatty acid (MUFA), which was only observed for the DA (7%) and MA (6%) varieties. When analyzing fatty acid diversity, it was possible to identify fifteen distinct fatty acids in the DA variety, with twelve fatty acids observed for the MA variety and fewer than seven distinct fatty acids observed for the other varieties. The predominant fatty acid observed was alpha-linolenic acid (C18:3n3), with values ranging from 36.8% (BN) to 52.9% (PA) of total fatty acid content, followed by palmitic acid, ranging from 16.5% (MA) to 23.2% (LA), and linoleic acid (C18:2n6c), ranging from 10.3% (MA) to 19.7% (LA). In a previous study [36], alpha-linolenic acid (C18:3n3), which is known as an essential fatty acid and a precursor of polyunsaturated fatty acids (omega-3 and omega-6), was also found to be the most prevalent fatty acid in fig leaves. The same study [34] observed similar proportions of PUFA > SFA > MUFA for the fig leaves analyzed, in line with the current study’s findings.

3.2.5. Phenolic Compounds

The chromatographic responses (Rt, wavelength of maximum absorption, deprotonated ion, and main MS2 fragments), tentative identification, and quantification of phenolic compounds by LC-DAD/ESI-MSn, in the hydroethanolic extracts of the five different fig varieties, are present in Table 6. A total of thirteen compounds were found in the studied samples, including five phenolic acids (vanillic, caffeic, chlorogenic, and p-coumaric derivatives) and eight flavonoids (C-glycosylated derivatives of apigenin and luteolin and O-glycosylated derivatives of quercetin). Identifying the phenolic compounds was possible by a comparison with available standard compounds and data literature (Table S1, Supplementary Material). Peaks 3 ([M−H] at m/z 353) and 5 ([M−H] at m/z 179) were identified as 5-O-caffeoylquinic acid, and caffeic acid, respectively, by comparing their retention time (Rt), UV-spectra, and MS response with available standard compounds. The tentative identification of peaks 1 ([M−H] at m/z 341), 3 ([M−H] at m/z 353), 7/8 ([M−H] at m/z 563), 9 ([M−H] at m/z 545), 10 ([M−H] at m/z 609), and 13 ([M−H] at m/z 593), as caffeic acid hexoside, trans 5-O-caffeoylquinic acid, apigenin-C-hexoside-C-pentoside, vanillic acid -malonyl-rhamnoside-rhamnoside, quercetin-O-deoxyhexosyl-hexoside, and kaempherol-O-deoxyhexosyl-hexoside, respectively, followed the previously reported results in the Portuguese common fig (Ficus carica L.) [37]. Peak 6 ([M−H] at m/z 337) was tentatively identified as 5-O-p-coumaroylquinic acid following a previous study [38], and peak 4 ([M−H] at m/z 579) was tentatively identified as luteolin-O-pentosyl-C-hexoside by comparing it to what was previously reported [38]. Finally, peak 11 ([M−H] at m/z 463) and peak 12 ([M−H] at m/z 549) were tentatively identified as quercetin-O-hexoside and quercetin-O-malonyl-hexoside, as both presented major MS2 fragments at m/z 301 corresponding to quercetin aglycone. This identification was achieved because peak 11 did not show other MS2 fragments, so the fragmentation only corresponded to the loss of the hexosyl moiety, while peak 12 presented additional MS2 fragments at m/z 505 (44 u) and 463 (42 u) that corresponded to the loss of the malonyl group, linked to the sugar moiety.
Regarding total phenolic compounds (TPC), the highest value was obtained for the LA variety (42.4 ± 0.2 mg/g dw), while the lowest amount was observed in the BN variety (16.75 ± 0.04 mg/g dw). For total phenolic acids (TPA), the highest amount was found in the PA variety (8.54 ± 0.02 mg/g dw), and again the lower amount was observed in the BN variety (2.455 ± 0.002 mg/g dw). The higher concentration of total flavonoids (TF) was observed for the LA variety (35.80 ± 0.08 mg/g dw), with the BN variety (14.30 ± 0.04 mg/g dw) presenting the lowest concentration of this class of compounds.
The variability of the phenolic compound composition observed between different varieties has been related to different causes, such as genetic factors, water stress conditions, geographical location of production, drying process, and sample ripening stage, among others [37,39,40]. In a previous study where the influence of fig leaf ripeness on five Pakistan varieties was investigated [41], the authors identified 14 phenolic compounds, some coinciding with the ones found in this study. In another study [42], the methanolic extracts from the leaves of ten Algerian fig tree varieties were analyzed. The phenolic compounds quercetin-3-glucoside, caftaric acid, quercetin-3,7-diglycoside, and coumaroyl-hexose were found in higher concentrations. Curiously, some of these compounds were not found in the varieties analyzed in the present study.
Particularly, in evaluating some of the compounds, we can verify that apigenin-C-hexoside-C-pentoside is the most abundant compound in all samples, being highest in the LA variety: LA (13.62 ± 0.08 mg/g extract) > DA (8.83 ± 0.09 mg/g extract) > PA (6.63 ± 0.04 mg/g extract) > MA (6.40 ± 0.02 mg/g extract) > BN (6.19 ± 0.06 mg/g extract). Another interesting compound, and with significant amounts in all samples, is quercetin-O-deoxyhexosyl-hexoside, present in the DN variety with values of 9.903 ± 0.005 mg/g extract, followed by LA (9.33 ± 0.03 mg/g extract) > PA (6.72 ± 0.03 mg/g extract) > MA (5.97 ± 0.02 mg/g extract) > BN (5293 ± 0.004 mg/g extract).
Although the DA variety did not show the highest TPC values (35.3 ± 0.2 mg/g extract), it was the one with the highest concentrations in the following phenolic compounds: caffeic acid hexoside (1.08 ± 0.02 mg/g extract), caffeoylquinic acid (2.361 ± 0.003 mg/g extract), apigenin-C-hexoside-C-pentoside (1.01 ± 0.01 mg/g extract), and quercetin-O-deoxyhexosyl-hexoside (9.903 ± 0.005 mg/g extract). It is significant that caffeoylquinic acid was only found in the DA variety. This acid, whose action has a defensive role against oxidative stress (biotic and abiotic) in plants, is also associated with anti-inflammatory and antioxidant properties [43].

3.3. Bioactivity Evaluation

In addition to the chemical composition analysis, several bioactivities of the extracts obtained from the five fig leaf varieties were also analyzed, and the complete results are presented in Table 7.

3.3.1. Antioxidant Activity

Currently, it is widely acknowledged that oxidative stress is involved in various diseases such as cardiovascular diseases, Alzheimer’s, and cancer [44]. Thus, the antioxidant properties of the different leaf extracts of the five fig varieties are of interest. In this study, the antioxidant activity was evaluated using the TBARS and CAA methods (Table 7). The TBARS method measures the extract concentration that can inhibit by 50% the formation of TBARS substances (EC50), thus preventing lipid peroxidation. Among the five fig tree varieties under study, the BN variety showed the most promising results with an EC50 value of 0.23 ± 0.01 mg/mL, followed by the DN (0.33 ± 0.01 mg/mL), MA (0.45 ± 0.03 mg/mL), LA (0.74 ± 0.02 mg/mL), and finally PA (0.78 ± 0.02 mg/mL) varieties. When using the CAA methodology, the leaf extracts with the highest inhibition percentage were obtained from the PA variety, followed by LA and DA with 65 ± 11%, 60 ± 4%, and 57 ± 5%, respectively (percentage obtained at an extract concentration of 2 mg/mL). Previous studies also reported antioxidant activity for extracts of fig leaves using the DPPH assay [45,46], with an EC50 value of 0.259 mg/mL, in line with the values obtained in this study.

3.3.2. Cytotoxic Activities

The cytotoxic activity of five fig leaf extracts was performed on three tumor cell lines, AGS (gastric adenocarcinoma), MCF-7 (breast carcinoma), and CaCo2 (colon adenocarcinoma). The toxicity of the extracts was also evaluated in non-tumor lines, specifically, VERO (non-tumor culture of African monkey embryo kidney) and PLP2 (pig liver primary cell line). The results are expressed in GI50, the concentration capable of inhibiting 50% cell proliferation (Table 7). Regarding cytotoxic activity in the tumor cell line tested, the one presenting the highest susceptibility to fig leaf extracts was AGS, followed by MCF-7, with no cytotoxicity observed in CaCo2 cells. The more potent antitumor varieties were LA and DA, with GI50 values for AGS of 173 ± 12 and 158 ± 13 μg/mL, respectively, and GI50 values for MCF-7 of 208 ± 7 and 223 ± 21 μg/mL, respectively. Recently, researchers have investigated the antiproliferative effect of fig leaves in breast cancer cell lines [46] and observed an antiproliferative activity when using the MDA-MB-231 cell line. They also correlated the antiproliferative effect of the fig leaves extracts with two major active components observed in the leaves: psoralen and bergapten. The findings from this study [47] are in line with our results, especially when comparing the fig leaf extract’s antiproliferative activity against the MCF-7 breast cancer cell line, which was one of the most susceptible cell lines in this study. Regarding the antiproliferative activity in non-tumor cells, no cytotoxicity was observed for the VERO cell line. Limited antiproliferative activity was observed in the PLP2 cell line, with only the LA and DA varieties presenting GI50 values of 225 ± 11 and 248 ± 10 μg/mL, respectively.

3.3.3. Inhibition of Nitric Oxide Production Evaluation

The inhibition of nitric oxide production evaluation was performed in murine macrophages (RAW 264.7 cells). For this assay, it is possible to verify that leaf extracts obtained from the LA and BN varieties showed no perceivable activity. The remaining extracts, on the other hand, presented very good results for the inhibition of nitric oxide production with IC50 values ranging from 20 ± 5 μg/mL in the DA variety to 82 ± 8 μg/mL in the PA variety and 89 ± 3 μg/mL in the MA variety. These results are quite interesting and demonstrate that fig leaves may be a potential source of compounds with a capacity of the inhibition of nitric oxide production. A previous study [48], where the anti-inflammatory activity of a hydroalcoholic extract obtained from fig leaves was measured in an in vivo study using the carrageenan-induced paw edema method, corroborates the finding in this study. Of note is the significant variation of anti-inflammatory activity between the five varieties, with the LA and BN varieties presenting no activity and DA with a very satisfactory result for the inhibition of nitric oxide production (20 ± 5 μg/mL), when compared to the value obtained by dexamethasone, the known anti-inflammatory compound used as the control (6.3 ± 0.4 μg/mL). The DA result may be due to the fact that this variety is the one presenting the highest concentrations in some phenolic compounds such as caffeic and caffeoylquinic acid, apigenin, and quercetin, whose action has a defensive role against oxidative stress (biotic and abiotic) in plants; it is also associated with anti-inflammatory and antioxidant properties [48].

4. Antimicrobial Activity

The leaf extracts’ antimicrobial activity for the five fig varieties under study was assessed using various food bacterial and fungal strains (Table 8). The DA variety extract showed the most promising antibacterial activity, with MIC values of 1.25 mg/mL against Y. enterocolitica, 2.5 mg/mL against E. coli and S. aureus, and 5 mg/mL against S. enterica. However, the most potent antibacterial activity observed was obtained by the BN variety, with a MIC of 0.6 mg/mL against Y. enterocolitica and a MIC of 5 mg/mL against E. Coli. The MIC value for the PA variety extract was determined to be 5 mg/mL for L. monocytogenes and A. fumigatus. Finally, the LA and MA extracts have shown antibacterial activity against only Y. enterocolitica and E. coli, with a MIC value of 5 mg/mL. The P. aeruginosa was not susceptible to any of the extracts assessed to a maximum concentration of 10 mg/mL. In a previous study [44], in which fig leaves’ aqueous extracts were also tested, the authors observed moderate antibacterial activity against S. aureus (0.625 mg/mL) and weak antifungal activity (≥2.5 mg/mL) when tested against C. albicans. In another study [45], a fig leaf ethanolic extract presented an antibacterial effect on E. faecalis with an MBC of 50%. The reported results for the antimicrobial activity may be explained by the phenolic composition of the studied samples, as phenolic compounds are known to have a variety of bioactivities, one of which is the ability to inhibit the growth of micro-organisms [49].

5. Conclusions

The use of fig leaves for human well-being is historically proven. However, there are few studies regarding fig leaves’ chemical and bioactive characterization. This study presents a thorough chemical composition and bioactivity analysis of fig leaves’ hydroethanolic extracts obtained from five different varieties. The chemical composition of organic acids, free sugars, tocopherols, fatty acids, and phenolics was analyzed, and in general, many of the composition traits observed were similar across the five varieties. However, differences in composition were observed between varieties and are highlighted.
The leaf extracts for all varieties presented oxalic, malic, quinic, and citric acids as the primary organic acids. However, while quinic and citric acid had relatively stable concentrations across the varieties, oxalic and malic acids presented significant variations, with the LA variety presenting higher quantities of oxalic acid and the DA variety presenting higher quantities of malic acid. Regarding sugar content, fructose, glucose, and sucrose were the main sugars observed, with trehalose and raffinose presenting significantly lower amounts. However, the DA and BN varieties presented higher concentrations of total free sugars and can be viewed as potential natural sweeteners. The leaves of the PA and LA varieties presented the highest total tocopherols content, with β-tocopherol as the predominant isomer, with percentages above 78% across all varieties. A predominance of PUFA fatty acids was observed, ranging from 53% for the MA variety to 71% for the LA variety. The predominant fatty acid observed for all varieties was alpha-linolenic acid, followed by palmitic acid and linoleic acid. Finally, for phenolic composition, the leaves from the DA variety presented the thirteen compounds identified across all varieties (five phenolic acids and eight flavonoids). The phenolic composition highlights the flavonoid derivatives apigenin-C-hexoside-C-pentoside and quercetin-O-deoxyhexosyl-hexoside, which are present in significant amounts among the five extracts analyzed.
Considering the biological activities analyzed, moderate results were obtained for the antioxidant activity of the five extract varieties. However, the LA and the DA extracts presented the highest values of cytotoxic activity against AGS and MCF-7 tumor cells. We propose that the cytotoxic activity of the LA and DA variety extracts against AGS and MCF-7 cells is probably related to the higher concentrations of phenolics, especially the flavonoids apigenin-C-hexoside-C-pentoside and quercetin-O-deoxyhexosyl-hexoside.
The most interesting result for the inhibition of nitric oxide production evaluation, was presented by the DA variety (20 ± 5 μg/mL). These results could be related to flavonoids’ high content, especially quercetin-O-deoxyhexosyl-hexoside, or the higher concentration of free sugars observed in the DA extract composition. The DA and BN varieties presented the most promising activities for antimicrobial activity, especially against the Gram-negative bacteria Y. enterocolitica.
Leaves are considered biological waste and have no associated monetary value. Still, they can be explored as alternative sources of specific biomolecules used by different industries. This study documents the characterization of five fig tree varieties and suggests the exploitation of fig leaves for applications in products in the food, nutraceutical, and cosmeceutical area, promoting bio-waste valorization, supporting the circular economy, and achieving the sustainability goals set for 2030.

Supplementary Materials

The following supporting information can be downloaded at: https://www.mdpi.com/article/10.3390/pr11041179/s1, Table S1: MS spectrum data and DAD spectrum information of the phenolic compounds tentatively identified in fig leaves hydroethanolic extract.

Author Contributions

Conceptualization, L.B.; formal analysis, C.S.H.S., Y.Z., C.L.R., M.I.D., R.C.C., S.A.H., M.C., R.M.V.A. and L.B.; investigation, C.S.H.S., Y.Z., C.L.R., M.I.D., R.C.C., S.A.H., M.C. and L.B.; methodology, C.L.R., M.I.D., M.A.P., R.C.C., M.J.A., S.A.H., R.M.V.A. and L.B.; validation, V.d.C.M.; writing—original draft, C.S.H.S. and C.L.R.; writing—review & editing, M.I.D., M.A.P., R.C.C., M.J.A., S.A.H., V.d.C.M., M.C., R.M.V.A. and L.B. All authors have read and agreed to the published version of the manuscript.

Funding

This research was funded by the Portuguese Foundation for Science and Technology (FCT) (support to CIMO (UIDB/00690/2020 and UIDP/00690/2020) and SusTEC (LA/P/0007/2021), Institutional Scientific Employment Program-Contract for L. Barros and R. Calhelha and the contracts of M. Carocho and S.A. Heleno (CEEC-IND/00831/2018 and CEECIND/03040/2017) through the Individual Scientific Employment Program-Contract; and to MICINN for supporting the Ramón y Cajal grant for M.A. Prieto (RYC-2017-22891)) and European Regional Development Fund (ERDF) through the Competitiveness and Internationalization Operational Program for financial support to the project 100% Figo (POCI-01-0247-FEDER-064977) and for C. Shirashi and C. L. Roriz PhD and Post-Doc grants, respectively.

Data Availability Statement

Data available on request.

Acknowledgments

The authors are grateful to the Foundation for Science and Technology (FCT, Portugal) for financial support to CIMO (UIDB/00690/2020 and UIDP/00690/2020) and SusTEC (LA/P/0007/2021); national funding by FCT, P.I., through the institutional scientific employment program-contract for L. Barros and R. Calhelha and the contracts of M. Carocho and S.A. Heleno (CEEC-IND/00831/2018 and CEECIND/03040/2017) through the individual scientific employment program-contract; and to MICINN for supporting the Ramón y Cajal grant for M.A. Prieto (RYC-2017-22891).

Conflicts of Interest

The authors declare no conflict of interest.

References

  1. Stover, E.; Aradhya, M.; Ferguson, L.; Crisosto, C.H. The Fig: Overview of an Ancient Fruit. HortScience 2007, 42, 1083–1087. [Google Scholar] [CrossRef]
  2. Badgujar, S.B.; Patel, V.V.; Bandivdekar, A.H.; Mahajan, R.T. Traditional Uses, Phytochemistry and Pharmacology of Ficus carica: A Review. Pharm. Biol. 2014, 52, 1487–1503. [Google Scholar] [CrossRef] [PubMed] [Green Version]
  3. Solana, R.R.; Romano, A. Chemical and Biological Characteristics of Ficus carica L. Fruits, Leaves, and Derivatives (Wine, Spirit, and Liqueur). In Modern Fruit Industry; IntechOpen: London, UK, 2019. [Google Scholar] [CrossRef] [Green Version]
  4. Oliveira, A.P.; Valentão, P.; Pereira, J.A.; Silva, B.M.; Tavares, F.; Andrade, P.B. Ficus carica L.: Metabolic and Biological Screening. Food Chem. Toxicol. 2009, 47, 2841–2846. [Google Scholar] [CrossRef] [PubMed]
  5. Raskovic, B.; Lazic, J.; Polovic, N. Characterisation of General Proteolytic, Milk Clotting and Antifungal Activity of Ficus carica Latex during Fruit Ripening. J. Sci. Food Agric. 2016, 96, 576–582. [Google Scholar] [CrossRef] [PubMed] [Green Version]
  6. Takahashi, T.; Okiura, A.; Saito, K.; Kohno, M. Identification of Phenylpropanoids in Fig (Ficus carica L.) Leaves. J. Agric. Food Chem. 2014, 62, 10076–10083. [Google Scholar] [CrossRef]
  7. Dueñas, M.; Pérez-Alonso, J.J.; Santos-Buelga, C.; Escribano-Bailón, T. Anthocyanin Composition in Fig (Ficus carica L.). J. Food Compos. Anal. 2008, 21, 107–115. [Google Scholar] [CrossRef]
  8. Shahinuzzaman, M.; Yaakob, Z.; Anuar, F.H.; Akhtar, P.; Kadir, N.H.A.; Hasan, A.K.M.; Sobayel, K.; Nour, M.; Sindi, H.; Amin, N.; et al. In Vitro Antioxidant Activity of Ficus carica L. Latex from 18 Different Cultivars. Sci. Rep. 2020, 10, 10852. [Google Scholar] [CrossRef]
  9. Ayuso, M.; Carpena, M.; Taofiq, O.; Albuquerque, T.G.; Simal-Gandara, J.; Oliveira, M.B.P.P.; Prieto, M.A.; Ferreira, I.C.F.R.; Barros, L. Fig “Ficus carica L.” and Its by-Products: A Decade Evidence of Their Health-Promoting Benefits towards the Development of Novel Food Formulations. Trends Food Sci. Technol. 2022, 127, 1–13. [Google Scholar] [CrossRef]
  10. Nienow, A.A.; Chaves, A.; Lajús, C.R.; Calvete, E.O. Produção Da Figueira Em Ambiente Protegido Submetida a Diferentes Épocas de Poda e Número de Ramos. Rev. Bras. Frutic. 2006, 28, 421–424. [Google Scholar] [CrossRef]
  11. Ballardini, R.M.; Kaisto, J.; Similä, J. Developing Novel Property Concepts in Private Law to Foster the Circular Economy. J. Clean. Prod. 2021, 279, 123747. [Google Scholar] [CrossRef]
  12. Gómez-Mejía, E.; Roriz, C.L.; Heleno, S.A.; Calhelha, R.; Dias, M.I.; Pinela, J.; Rosales-Conrado, N.; León-González, M.E.; Ferreira, I.C.F.R.; Barros, L. Valorisation of Black Mulberry and Grape Seeds: Chemical Characterization and Bioactive Potential. Food Chem. 2021, 337, 127998. [Google Scholar] [CrossRef] [PubMed]
  13. Soria-Lopez, A.; Garcia-Perez, P.; Carpena, M.; Garcia-Oliveira, P.; Otero, P.; Fraga-Corral, M.; Cao, H.; Prieto, M.A.; Simal-Gandara, J. Challenges for Future Food Systems: From the Green Revolution to Food Supply Chains with a Special Focus on Sustainability. Food Front. 2022, 4, 9–20. [Google Scholar] [CrossRef]
  14. Othman, S.; Añibarro-Ortega, M.; Dias, M.I.; Ćirić, A.; Mandim, F.; Soković, M.; Ferreira, I.C.F.R.; Pinela, J.; Barros, L. Valorization of Quince Peel into Functional Food Ingredients: A Path towards “Zero Waste” and Sustainable Food Systems. Heliyon 2022, 8, e11042. [Google Scholar] [CrossRef]
  15. Chamorro, F.; Carpena, M.; Fraga-Corral, M.; Echave, J.; Riaz Rajoka, M.S.; Barba, F.J.; Cao, H.; Xiao, J.; Prieto, M.A.; Simal-Gandara, J. Valorization of Kiwi Agricultural Waste and Industry By-Products by Recovering Bioactive Compounds and Applications as Food Additives: A Circular Economy Model. Food Chem. 2022, 370, 131315. [Google Scholar] [CrossRef]
  16. Li, Z.; Yang, Y.; Liu, M.; Zhang, C.; Shao, J.; Hou, X.; Tian, J.; Cui, Q. A Comprehensive Review on Phytochemistry, Bioactivities, Toxicity Studies, and Clinical Studies on Ficus carica Linn. Leaves. Biomed. Pharmacother. 2021, 137, 111393. [Google Scholar] [CrossRef] [PubMed]
  17. Pucci, M.; Mandrone, M.; Chiocchio, I.; Sweeney, E.M.; Tirelli, E.; Uberti, D.; Memo, M.; Poli, F.; Mastinu, A.; Abate, G. Different Seasonal Collections of Ficus carica L. Leaves Diversely Modulate Lipid Metabolism and Adipogenesis in 3T3-L1 Adipocytes. Nutrients 2022, 14, 2833. [Google Scholar] [CrossRef] [PubMed]
  18. Fernandes, Â.; Antonio, A.L.; Barreira, J.C.M.; Oliveira, M.B.P.P.; Martins, A.; Ferreira, I.C.F.R. Effects of Gamma Irradiation on Physical Parameters of Lactarius Deliciosus Wild Edible Mushrooms. Postharvest Biol. Technol. 2012, 74, 79–84. [Google Scholar] [CrossRef]
  19. Barros, L.; Pereira, E.; Calhelha, R.C.; Dueñas, M.; Carvalho, A.M.; Santos-Buelga, C.; Ferreira, I.C.F.R. Bioactivity and Chemical Characterization in Hydrophilic and Lipophilic Compounds of Chenopodium Ambrosioides L. J. Funct. Foods 2013, 5, 1732–1740. [Google Scholar] [CrossRef]
  20. Bessada, S.M.F.; Barreira, J.C.M.; Barros, L.; Ferreira, I.C.F.R.; Oliveira, M.B.P.P. Phenolic Profile and Antioxidant Activity of Coleostephus Myconis (L.) Rchb.f.: An Underexploited and Highly Disseminated Species. Ind. Crops Prod. 2016, 89, 45–51. [Google Scholar] [CrossRef] [Green Version]
  21. Spréa, R.M.; Fernandes, Â.; Finimundy, T.C.; Pereira, C.; Alves, M.J.; Calhelha, R.C.; Canan, C.; Barros, L.; Amaral, J.S.; Ferreira, I.C.F.R. Lovage (Levisticum Officinale W.D.J. Koch) Roots: A Source of Bioactive Compounds towards a Circular Economy. Resources 2020, 9, 81. [Google Scholar] [CrossRef]
  22. Corrêa, R.C.G.; de Souza, A.H.P.; Calhelha, R.C.; Barros, L.; Glamoclija, J.; Sokovic, M.; Peralta, R.M.; Bracht, A.; Ferreira, I.C.F.R. Bioactive Formulations Prepared from Fruiting Bodies and Submerged Culture Mycelia of the Brazilian Edible Mushroom Pleurotus Ostreatoroseus Singer. Food Funct. 2015, 6, 2155–2164. [Google Scholar] [CrossRef] [PubMed] [Green Version]
  23. Silva, A.R.; Pinela, J.; Dias, M.I.; Calhelha, R.C.; Alves, M.J.; Mocan, A.; García, P.A.; Barros, L.; Ferreira, I.C.F.R. Exploring the Phytochemical Profile of Cytinus Hypocistis (L.) L. as a Source of Health-Promoting Biomolecules behind Its in Vitro Bioactive and Enzyme Inhibitory Properties. Food Chem. Toxicol. 2020, 136, 111071. [Google Scholar] [CrossRef] [PubMed]
  24. Wolfe, K.L.; Rui, H.L. Cellular Antioxidant Activity (CAA) Assay for Assessing Antioxidants, Foods, and Dietary Supplements. J. Agric. Food Chem. 2007, 55, 8896–8907. [Google Scholar] [CrossRef] [PubMed]
  25. Abreu, R.M.V.; Ferreira, I.C.F.R.; Calhelha, R.C.; Lima, R.T.; Vasconcelos, M.H.; Adega, F.; Chaves, R.; Queiroz, M.J.R.P. Anti-Hepatocellular Carcinoma Activity Using Human HepG2 Cells and Hepatotoxicity of 6-Substituted Methyl 3-Aminothieno[3,2-b]Pyridine-2-Carboxylate Derivatives: In Vitro Evaluation, Cell Cycle Analysis and QSAR Studies. Eur. J. Med. Chem. 2011, 46, 5800–5806. [Google Scholar] [CrossRef] [Green Version]
  26. Mandim, F.; Graça, V.C.; Calhelha, R.C.; Machado, I.L.F.; Ferreira, L.F.V.; Ferreira, I.C.F.R.; Santos, P.F. Synthesis, Photochemical and In Vitro Cytotoxic Evaluation of New Iodinated Aminosquaraines as Potential Sensitizers for Photodynamic Therapy. Molecules 2019, 24, 863. [Google Scholar] [CrossRef] [Green Version]
  27. Mandim, F.; Barros, L.; Calhelha, R.C.; Abreu, R.M.V.; Pinela, J.; Alves, M.J.; Heleno, S.; Santos, P.F.; Ferreira, I.C.F.R. Calluna Vulgaris (L.) Hull: Chemical Characterization, Evaluation of Its Bioactive Properties and Effect on the Vaginal Microbiota. Food Funct. 2019, 10, 78–89. [Google Scholar] [CrossRef] [PubMed] [Green Version]
  28. Svobodova, B.; Barros, L.; Sopik, T.; Calhelha, R.C.; Heleno, S.; Alves, M.J.; Walcott, S.; Kuban, V.; Ferreira, I.C.F.R. Non-Edible Parts of Solanum Stramoniifolium Jacq.—A New Potent Source of Bioactive Extracts Rich in Phenolic Compounds for Functional Foods. Food Funct. 2017, 8, 2013–2021. [Google Scholar] [CrossRef] [PubMed] [Green Version]
  29. Pires, T.C.S.P.; Dias, M.I.; Barros, L.; Alves, M.J.; Oliveira, M.B.P.P.; Santos-Buelga, C.; Ferreira, I.C.F.R. Antioxidant and Antimicrobial Properties of Dried Portuguese Apple Variety (Malus Domestica Borkh. Cv Bravo de Esmolfe). Food Chem. 2018, 240, 701–706. [Google Scholar] [CrossRef] [Green Version]
  30. Carocho, M.; Barros, L.; Calhelha, R.C.; Ćirić, A.; Soković, M.; Santos-Buelga, C.; Morales, P.; Ferreira, I.C.F.R. Melissa Officinalis L. Decoctions as Functional Beverages: A Bioactive Approach and Chemical Characterization. Food Funct. 2015, 6, 2240–2248. [Google Scholar] [CrossRef] [Green Version]
  31. Pande, G.; Akoh, C.C. Organic Acids, Antioxidant Capacity, Phenolic Content and Lipid Characterisation of Georgia-Grown Underutilized Fruit Crops. Food Chem. 2010, 120, 1067–1075. [Google Scholar] [CrossRef]
  32. Nuñez-Estevez, B.; Finimundy, T.C.; Carpena, M.; Barral-Martinez, M.; Calhelha, R.; Pires, T.C.S.P.; Otero, P.; Garcia-Perez, P.; Simal-Gandara, J.; Ferreira, I.C.F.R.; et al. Bioactive Compound Profiling and Nutritional Composition of Three Species from the Amaranthaceae Family. Chem. Proc. 2021, 5, 20. [Google Scholar] [CrossRef]
  33. Teruel-Andreu, C.; Sendra, E.; Hernández, F.; Cano-Lamadrid, M. How Does Cultivar Affect Sugar Profile, Crude Fiber, Macro-and Micronutrients, Total Phenolic Content, and Antioxidant Activity on Ficus carica Leaves? Agronomy 2023, 13, 30. [Google Scholar] [CrossRef]
  34. Uysal, S.; Zengin, G.; Aktumsek, A.; Karatas, S. Fatty Acid Composition, Total Sugar Content and Anti-Diabetic Activity of Methanol and Water Extracts of Nine Different Fruit Tree Leaves Collected from Mediterranean Region of Turkey. Int. J. Food Prop. 2015, 18, 2268–2276. [Google Scholar] [CrossRef]
  35. Shahidi, F.; de Camargo, A.C. Tocopherols and Tocotrienols in Common and Emerging Dietary Sources: Occurrence, Applications, and Health Benefits. Int. J. Mol. Sci. 2016, 17, 1745. [Google Scholar] [CrossRef] [PubMed]
  36. Konyalιoğlu, S.; Sağlam, H.; Kιvçak, B.; Konyaloglu, S.; Sniye Saglam, H.; Kvçak, B. α-Tocopherol, Flavonoid, and Phenol Contents and Antioxidant Activity of Ficus carica Leaves. Pharm. Biol. 2008, 43, 683–686. [Google Scholar] [CrossRef]
  37. Palmeira, L.; Pereira, C.; Dias, M.I.; Abreu, R.M.V.; Corrêa, R.C.G.; Pires, T.C.S.P.; Alves, M.J.; Barros, L.; Ferreira, I.C.F.R. Nutritional, Chemical and Bioactive Profiles of Different Parts of a Portuguese Common Fig (Ficus carica L.) Variety. Food Res. Int. 2019, 126, 108572. [Google Scholar] [CrossRef] [Green Version]
  38. Clifford, M.N.; Zheng, W.; Kuhnert, N. Profiling the Chlorogenic Acids of Aster by HPLC-MSn. Phytochem. Anal. 2006, 17, 384–393. [Google Scholar] [CrossRef]
  39. Pereira, O.R.; Silva, A.M.S.; Domingues, M.R.M.; Cardoso, S.M. Identification of Phenolic Constituents of Cytisus multiflorus. Food Chem. 2012, 131, 652–659. [Google Scholar] [CrossRef]
  40. Essid, A.; Aljane, F.; Ferchichi, A. Mineral and Phenolic Content of Leaves of Tunisian Caprifig (Ficus carica L.) Accessions. J. New Sci. 2015, 21, 977–984. [Google Scholar]
  41. Nadeem, M.; Zeb, A. Impact of Maturity on Phenolic Composition and Antioxidant Activity of Medicinally Important Leaves of Ficus carica L. Physiol. Mol. Biol. Plants 2018, 24, 881. [Google Scholar] [CrossRef]
  42. Mahmoudi, S.; Khali, M.; Benkhaled, A.; Benamirouche, K.; Baiti, I. Phenolic and Flavonoid Contents, Antioxidant and Antimicrobial Activities of Leaf Extracts from Ten Algerian Ficus carica L. Varieties. Asian Pac. J. Trop. Biomed. 2016, 6, 239–245. [Google Scholar] [CrossRef] [Green Version]
  43. Alcázar Magaña, A.; Kamimura, N.; Soumyanath, A.; Stevens, J.F.; Maier, C.S. Caffeoylquinic Acids: Chemistry, Biosynthesis, Occurrence, Analytical Challenges, and Bioactivity. Plant J. 2021, 107, 1299–1319. [Google Scholar] [CrossRef] [PubMed]
  44. Ergül, M.; Ergül, M.; Eruygur, N.; Ataş, M.; Uçar, E. In Vitro Evaluation of the Chemical Composition and Various Biological Activities of Ficus carica Leaf Extracts. Turk. J. Pharm. Sci. 2019, 16, 401–409. [Google Scholar] [CrossRef] [PubMed]
  45. Nirwana, I.; Rianti, D.; Helal Soekartono, R.; Listyorini, R.D.; Basuki, D.P. Antibacterial Activity of Fig Leaf (Ficus carica Linn.) Extract against Enterococcus Faecalis and Its Cytotoxicity Effects on Fibroblast Cells. Vet. World 2018, 11, 342. [Google Scholar] [CrossRef] [PubMed] [Green Version]
  46. Zhang, Y.; Wan, Y.; Huo, B.; Li, B.; Jin, Y.; Hu, X. Extracts and Components of Ficus carica Leaves Suppress Survival, Cell Cycle, and Migration of Triple-Negative Breast Cancer MDA-MB-231 Cells. Onco Targets Ther. 2018, 11, 4377. [Google Scholar] [CrossRef] [PubMed] [Green Version]
  47. Purnamasari, R.; Winarni, D.; Permanasari, A.A.; Agustina, E.; Hayaza, S.; Darmanto, W. Anticancer Activity of Methanol Extract of Ficus carica Leaves and Fruits Against Proliferation, Apoptosis, and Necrosis in Huh7it Cells. Cancer Inform. 2019, 18, 1176935119842576. [Google Scholar] [CrossRef] [Green Version]
  48. Ali, B.; Mujeeb, M.; Aeri, V.; Mir, S.R.; Faiyazuddin, M.; Shakeel, F. Anti-Inflammatory and Antioxidant Activity of Ficus carica Linn. Leaves. Nat. Prod. Res. 2012, 26, 460–465. [Google Scholar] [CrossRef]
  49. Takó, M.; Kerekes, E.B.; Zambrano, C.; Kotogán, A.; Papp, T.; Krisch, J.; Vágvölgyi, C. Plant Phenolics and Phenolic-Enriched Extracts as Antimicrobial Agents against Food-Contaminating Microorganisms. Antioxidants 2020, 9, 165. [Google Scholar] [CrossRef] [Green Version]
Table 1. Color analysis in fig leaves.
PALADABNMA
Processes 11 01179 i001Processes 11 01179 i002Processes 11 01179 i003Processes 11 01179 i004Processes 11 01179 i005
CIELAB
L*35.0 ± 0.3 c38.2 ± 0.8 b36.8 ± 0.5 b41.1 ± 0.6 a37.1 ± 0.3 b
a*−7.1 ± 0.7 b−11.0 ± 0.4 a−7.7 ± 0.7 b−7.7 ± 0.8 b−7.3 ± 0.3 b
b*11.1 ± 0.4 b16.1 ± 0.9 a12.0 ± 0.6 b17.7 ± 0.4 a12.6 ± 0.4 b
ColorProcesses 11 01179 i006Processes 11 01179 i007Processes 11 01179 i008Processes 11 01179 i009Processes 11 01179 i010
Significant statistical differences in each row (α = 0.05) are represented with different letters.
Table 2. UFLC-DAD characterization of organic acids composition in fig leaves.
Organic Acids (g/100 g dw)
PALADABNMA
Oxalic41.6 ± 0.6 c60.0 ± 0.6 a11.90 ± 0.08 d48.8 ± 0.2 b41.0 ± 0.7 c
Quinic16.1 ± 0.2 c19.03 ± 0.08 b23.0 ± 0.2 a23.3 ± 0.2 a19.5 ± 0.6 b
Malic40.1 ± 0.4 c2.54 ± 0.03 d55.8 ± 0.2 a52.5 ± 0.6 b55.49 ± 0.6 a
Citric22.4 ± 0.3 d23.1 ± 0.2 c27.6 ± 0.4 a21.8 ± 0.4 e24.1 ± 0.1 b
▊ Shikimictrndnd0.11 ± 0.06nd
Ascorbicndtrndtrtr
Fumarictrtrtrtrtr
Total120.2 ± 0.7 c104.7 ± 0.8 d118.3 ± 0.4 c146.5 ± 1.1 a140.1 ± 0.3 b
Processes 11 01179 i011Processes 11 01179 i012Processes 11 01179 i013Processes 11 01179 i014Processes 11 01179 i015
Significant statistical differences in each row (α = 0.05) are represented with different letters. nd—not detected. tr—traces.
Table 3. HPLC-IR characterization of free sugar content in fig leaves.
Free Sugars (g/100 g dw)
PALADABNMA
Fructose1.36 ± 0.02 e1.94 ± 0.02 c7.34 ± 0.06 a3.58 ± 0.02 b1.75 ± 0.01 d
Glucose1.48 ± 0.02 e1.77 ± 0.02 d7.72 ± 0.04 a6.32 ± 0.007 b3.59 ± 0.02 c
Sucrose1.62 ± 0.01 c0.133 ± 0.007 e0.276 ± 0.008 d4.27 ± 0.03 a3.59 ± 0.01 b
Trehalose0.62 ± 0.02 c0.63 ± 0.01 c1.130 ± 0.009 a0.61 ± 0.01 c0.72 ± 0.01 b
Raffinose0.26 ± 0.01 e0.47 ± 0.02 d0.87 ± 0.01 a0.74 ± 0.01 b0.687 ± 0.008 c
Total5.34 ± 0.02 d4.95 ± 0.02 e17.36 ± 0.08 a15.57 ± 0.03 b10.08 ± 0.06 c
Processes 11 01179 i016Processes 11 01179 i017Processes 11 01179 i018Processes 11 01179 i019Processes 11 01179 i020
Significant statistical differences in each row (α = 0.05) are represented with different letters.
Table 4. HPLC-FL determination of tocopherol content of fig leaves.
Tocopherols (mg/100 g dw)
PALADABNMA
α-Tocoferol3.36 ± 0.05 a3.32 ± 0.05 a2.26 ± 0.02 b1.438 ± 0.004 c1.45 ± 0.01 c
β-Tocoferol0.29 ± 0.01 a0.23 ± 0.02 b0.14 ± 0.01 c0.21 ± 0.01 b0.142 ± 0.008 c
γ-Tocoferol0.49 ± 0.01 and0.51 ± 0.02 a0.188 ± 0.007 c0.26 ± 0.01 b
δ-Tocoferolndndndndnd
Total4.14 ± 0.04 a3.56 ± 0.06 b2.91 ± 0.03 c1.84 ± 0.01 d1.85 ± 0.01 d
Processes 11 01179 i021Processes 11 01179 i022Processes 11 01179 i023Processes 11 01179 i024Processes 11 01179 i025
For each row, significant differences, with α = 0.05, are represented with different letters. nd—not detected.
Table 5. CG-MS determination of lipidic fractions and fatty acid composition of fig leaves.
Fatty Acids (% of Total)
PALADABNMA
C12:0nd0.911 ± 0.004ndndnd
C13:0nd2.171 ± 0.008 b1.65 ± 0.02 d2.87 ± 0.15 a1.77 ± 0.06 c
C14:0nd3.11 ± 0.02 a1.39 ± 0.04 d2.30 ± 0.04 b1.87 ± 0.01 c
C14:1ndnd0.316 ± 0.004ndnd
C15:1ndnd0.346 ± 0.003ndnd
C16:018.9 ± 0.4 b23.19 ± 0.07 a19.05 ± 0.05 b18.1 ± 0.3 c16.5 ± 0.1 d
C16:1ndnd1.457 ± 0.002nd1.66 ± 0.03
C17:0ndnd0.756 ± 0.001ndnd
C18:07.8 ± 0.2 and4.77 ± 0.02 d6.5 ± 0.2 b5.26 ± 0.02 c
C18:1n9cndnd4.62 ± 0.04 and3.941 ± 0.006 b
C18:2n6c13.5 ± 0.5 c19.68 ± 0.05 a12.25 ± 0.09 d15.27 ± 0.02 b10.318 ± 0.004 e
C18:3n352.9 ± 0.2 a44.23 ± 0.02 b40.334 ± 0.001 c36.8 ± 0.3 e38.99 ± 0.02 d
C20:0ndnd3.41 ± 0.02 bnd4.63 ± 0.05 a
C20:3n3nd6.71 ± 0.07 b1.420 ± 0.001 d18.4 ± 0.2 a3.6 ± 0.1 c
C22:06.7 ± 0.2 and4.045 ± 0.006 cnd6.26 ± 0.02 b
C24:0ndnd4.19 ± 0.04nd5.3 ± 0.1
SFA33.4 ± 0.3 c29.4 ± 0.1 d39.3 ± 0.1 b29.7 ± 0.2 d41.5 ± 0.09 a
MUFAndnd6.73 ± 0.03nd5.60 ± 0.03
PUFA66.4 ± 0.2 b70.6 ± 0.1 a54.00 ± 0.09 c70.5 ± 0.1 a52.9 ± 0.1 d
Processes 11 01179 i026Processes 11 01179 i027Processes 11 01179 i028Processes 11 01179 i029Processes 11 01179 i030
Significant statistical differences in each row (α = 0.05) are represented with different letters. Relative to fatty acid identification: lauric acid (C12:0); tridecanoic acid (C13:0); myristic acid (C14:0); myristoleic acid (C14:1); ginkgolic acid (C15:1); palmitic acid (C16:0); palmitoleic acid (C16:1); heptadecanoic acid (C17:0); stearic acid (C18:0); oleic acid (C18: 1n9c); linoleic acid (C18:2n6c); α-linolenic acid (C18:3n3); arachidic acid (C20:0); eicosatrienoic acid (C20: 3n3); behenic acid (C22:0); lignoceric acid (C24:0); saturated fatty acids (SFA); monounsaturated fatty acids (MUFA); and polyunsaturated fatty acids (PUFA). nd—not detected.
Table 6. Chromatographic identification by LC-DAD-ESI/MSn of the phenolic compounds present in fig leaves’ hydroethanolic extract (retention time (Rt), wavelengths of maximum absorption in the visible region (max), spectral mass, tentative identification, and quantification).
Quantification (mg/g dw Extract)
PeakRt (min)λmax (nm)[M−H] (m/z)MS2 (m/z)TentativeIdentificationPALADABNMA
15.99320341179 (100), 161 (18), 135 (5)Caffeic acid hexoside0.747 ± 0.007 b0.56 ± 0.02 c1.08 ± 0.02 a0.427 ± 0.006 d0.54 ± 0.01 c
27.08324353191 (100), 179 (12), 161 (7), 135 (5)cis 5-O-caffeoylquinic acid1.52 ± 0.04 a1.22 ± 0.02 b1.27 ± 0.05 b0.548 ± 0.007 d0.67 ± 0.02 c
37.26324353191 (100), 179 (9), 161 (8), 135 (5)trans 5-O-Caffeoylquinic acidndnd2.361 ± 0.003ndnd
410.12328579459 (22), 429 (83), 357 (63), 327 (100), 309 (54)Luteolin O-pentosyl-C-hexoside3.5 ± 0.1 c7.7 ± 0.1 a3.99 ± 0.07 b0.092 ± 0.001 e3.1 ± 0.1 d
510.54324179163 (100)Caffeic acid2.55 ± 0.03 b3.68 ± 0.03 a2.16 ± 0.05 c0.71 ± 0.01 e1.02 ± 0.03 d
611.7283337191 (100), 163 (12), 119 (10)5-O-p-Coumaroylquinic acid3.624 ± 0.002 a0.95 ± 0.03 b0.92 ± 0.02 b0.599 ± 0.001 d0.68 ± 0.02 c
712.88337563473 (58), 443 (100), 383 (15), 353 (20), 311 (5), 297 (5)Apigenin-C-hexoside-C-pentoside6.63 ± 0.04 c13.62 ± 0.08 a8.83 ± 0.09 b6.19 ± 0.06 e6.40 ± 0.02 d
814.37338563473 (58), 443 (100), 383 (15), 353 (20), 311 (5), 297 (5)Apigenin-C-hexoside-C-pentoside0.562 ± 0.002 d0.87 ± 0.02 b1.01 ± 0.01 a0.592 ± 0.009 c0.60 ± 0.01 c
915.72287545501 (100), 459 (13), 313 (5), 167 (98)Vanilic acid -malonyl-rhamnoside-rhamnoside0.104 ± 0.001 d0.238 ± 0.003 a0.181 ± 0.001 b0.175 ± 0.001 c0.178 ± 0.003 b,c
1016.82355609301 (100)Quercetin-O-deoxyhexosyl-hexoside6.72 ± 0.03 c9.33 ± 0.03 b9.903 ± 0.005 a5.293 ± 0.004 e5.97 ± 0.02 d
1118.21351463301 (100)Quercetin-O-hexoside1.426 ± 0.005 b1.00 ± 0.02 c1.16 ± 0.02 a0.586 ± 0.003 e0.668 ± 0.002 d
1219.58355549505 (52), 463 (43), 301 (100)Quercetin-O-malonyl-hexoside3.640 ± 0.005 a1.90 ± 0.03 b1.39 ± 0.02 c0.826 ± 0.001 e1.28 ± 0.0 d
1320359593285 (100)Kaempherol-O-deoxyhexosyl-hexoside0.895 ± 0.009 c1.38 ± 0.02 a1.05 ± 0.01 b0.718 ± 0.006 d0.735 ± 0.009 d
Total Phenolic Acids8.54 ± 0.02 a6.6 ± 0.1 c7.98 ± 0.05 b2.455 ± 0.002 e3.08 ± 0.03 d
Total Flavonoids23.4 ± 0.1 c35.80 ± 0.08 a27.3 ± 0.1 b14.30 ± 0.04 e18.7 ± 0.2 d
Processes 11 01179 i031Processes 11 01179 i032Processes 11 01179 i033Processes 11 01179 i034Processes 11 01179 i035
Total Phenolic Compounds31.9 ± 0.1 c42.4 ± 0.2 a35.3 ± 0.2 b16.75 ± 0.04 e21.8 ± 0.2 d
Significant statistical differences in each row (α = 0.05) are represented with different letters. Standard curves used for calibration: apigenin-6-C-glucoside (y = 197,337x + 30,036; LOD = 0.19 µg/mL; and LOQ = 0.63 µg/mL, peaks 7 and 8); caffeic acid (y = 388,345x + 406,369; LOD = 0.78 μg/mL; and LOQ = 1.97 μg/mL, peak 4); chlorogenic acid (y = 168,823x − 161,172; R2 = 0.9999; LOD = 0.20 µg/mL; and LOQ = 0.68 µg/mL, peaks 1 and 3); luteolin-6-C-glucoside (y = 4087.1x + 72,589; R2 = 0.999; LOD = 0.86 μg/mL; and LOQ = 1.67 μg/mL, peak 9); p-coumaric acid (y = 301,950x + 6966.7; LOD = 0.68 μg/mL; and LOQ = 1.61 μg/mL, peak 3); quercetin-3-O-glucoside (y = 34,843x − 160,173; R2 = 0.9998; LOD = 0.21 µg/mL; and LOQ = 0.71 µg/mL, peaks 11, 12, and 13); and vanillic acid (y = 29,751x – 28,661; R2 = 0.999, LOD = 1.66 µg/mL; and LOQ = 5.45 µg/mL, peaks 5 and 6).
Table 7. Antioxidant, cytotoxic activity, and inhibition of nitric oxide production evaluation of the extracts obtained from fig leaves.
PALADABNMAPositive Control
Antioxidant Activity
TBARS (EC50, mg/mL)0.78 ± 0.02 d0.74 ± 0.02 d0.35 ± 0.01 b0.23 ± 0.01 a0.45 ± 0.03 c0.0091 ± 0.0003
CAA (% inhibition by 2 mg/mL)65 ± 11 a60 ± 4 a57 ± 5 a40 ± 3 b33 ± 3 c95 ± 5
Cytotoxic activity
AGS(GI50, µg/mL)>400173 ± 12 b158 ± 13 a235 ± 23 c>4001.23 ± 0.03
MCF-7253 ± 12 b,c208 ± 7 a223 ± 2 a,b>400279 ± 24 c1.02 ± 0.02
CaCo2>400>400>400>400>4001.21 ± 0.02
VERO>400>400>400>400>4001.41 ± 0.06
PLP2>400225 ± 1 a248 ± 10 b>400>4001.4 ± 0.1
Inhibition of nitric oxide production evaluation
NO production inhibition (IC50, µg/mL)82 ± 8 b>40020 ± 5 a>40089 ± 3 b6.3 ± 0.4
For each row, significant differences, with α = 0.05, are represented with different letters. Positive controls were: Trolox (TBARS), quercetin (CAA), ellipticine (cytotoxic activity), and dexamethasone (anti-inflammatory activity).
Table 8. Antimicrobial activity against food micro-organisms.
Fig Leaves VarietiesPositive Control
PALADABNMAStreptomycin
(1 mg/mL)
Methicillin
(1 mg/mL)
Ampicillin
(20 mg/mL)
MICMBCMICMBCMICMBCMICMBCMICMBCMICMBCMICMBSMICMBC
Gram-negative bacteria
E. cloacae10>1010>1010>1010>1010>100.0070.007n.t.n.t0.150.15
E. coli10>1010>102.5>105>105>100.010.01n.t.n.t.0.150.15
P. aeruginosa>10>10>10>10>10>10>10>10>10>100.060.06n.t.n.t.0.630.63
S. enterica10>1010>105>1010>1010>100.0070.007n.t.n.t.0.150.15
Y. enterocolitica10>105>101.25>100.6>100.6>100.0070.007n.t.n.t.0.150.15
Gram-positive bacteria
B. cereus10>1010>10>10>10>10>10>10>100.0070.007n.t.n.t.n.t.n.t.
L. monocytogenes5>10>10>10>10>10>10>10>10>100.0070.007n.t.n.t.0.150.15
S. aureus10>1010>102.5>1010>1010>100.0070.0070.0070.0070.150.15
Fungal strainsKetaconazole (1 mg/mL)
MICMFCMICMFCMICMFCMICMFCMICMFCMICMFC
A. brasiliensis10>1010>1010>1010>1010>100.060.125
A. fumigatus5>1010>10>10>1010>1010>100.51
Results are expressed as mg/mL of extract. MIC: minimum inhibitory concentration; MBC: minimum bactericidal concentration; MFC: minimum fungicidal concentration; and n.t.—not tested.
Disclaimer/Publisher’s Note: The statements, opinions and data contained in all publications are solely those of the individual author(s) and contributor(s) and not of MDPI and/or the editor(s). MDPI and/or the editor(s) disclaim responsibility for any injury to people or property resulting from any ideas, methods, instructions or products referred to in the content.