Article

Predicting Final PCDD/F Emissions by Coupling Adsorption Model of Activated Carbon and Relationships of PCDD/Fs and Flue Gas Compositions

1
Guangxi Key Laboratory of New Energy and Building Energy Saving, Guilin 541004, China
2
School of Architecture and Traffic, Guilin University of Electronic Technology, Guilin 541004, China
3
College of Civil and Architecture Engineering, Guilin University of Technology, Guilin 541004, China
4
School of Energy and Power Engineering, Jiangsu University, Zhenjiang 212013, China
5
Guangxi Key Laboratory on the Study of Coral Reefs in the South China Sea, School of Marine Sciences, Guangxi University, Nanning 530004, China
*
Authors to whom correspondence should be addressed.
Processes 2023, 11(4), 1158; https://doi.org/10.3390/pr11041158
Submission received: 3 February 2023 / Revised: 4 April 2023 / Accepted: 5 April 2023 / Published: 10 April 2023
(This article belongs to the Special Issue New Trends in Chemical Looping)

Abstract

:
Due to their low concentration and complex nature, the low-cost online and real-time monitoring of polychlorinated dibenzo-p-dioxins and polychlorinated dibenzofurans (PCDD/Fs) is a challenge. In this paper, based on a coupling adsorption model of activated carbon and the relationship of PCDD/Fs and flue gas, an online monitoring system with real-time control of final PCDD/F emissions was built for the tracing and control of PCDD/F emissions in municipal solid waste incinerators (MSWIs). According to the online monitoring system, the effects of activated carbon concentration, the specific surface area of activated carbon (AC), operating temperature, contact time, fly ash concentration, residence carbon concentration of fly ash, and the lime concentration of final PCDD/F emissions were discussed. These MSWI operating parameters for reaching standards of 0.1 ng international toxic equivalents (TEQ)/Nm3 and 0.05 ng TEQ/Nm3 were summarized by the predicting model based on several published models.

1. Introduction

Municipal solid waste (MSW) is gaining increasing attention as a key environmental concern. The total MSW generation worldwide will reach as high as 3.4 × 10⁹ tonnes in 2050, according to the World Bank Forecast [1]. However, in 2016, more than 10% of the world’s MSW was produced in China, and the amount of MSW generated maintains a highly increasing trend for the next few decades [2]. Based on this situation, China has devoted considerable efforts to both MSW management and technology development in treatment and resource utilization. Presently, municipal solid waste incineration (MSWI) provides an effective way to minimize the production of MSW that must be disposed of in landfills; therefore, it is widely used in waste management [3]. However, in the process of incineration, some environmental pollutants (such as fly ash, SOx, and NOx) are produced as a thermochemical transformation. For example, a large number of polychlorinated dibenzo-p-dioxins and polychlorinated dibenzofurans (PCDD/Fs) can be produced in the process of MSWI.
The PCDD/Fs have resulted in adverse toxicological effects to environmental health [4,5,6]. It is known that PCDD/Fs are semi-volatile persistent organic pollutants (POPs) [7]. These matters maintain their nondegradable status in the natural environment for a long time. A range of POPs, such as polychlorinated biphenyl (PCBs), polychlorinated dibenzodioxins (PCDDs), polychlorinated dibenzofurans (PCDFs), and polybrominated diphenyl ethers (PBDEs), originate mainly from anthropogenic activities and have been widely used in an array of products [8]. Therefore, over several decades, although PCDD/F emissions have been restricted by the Stockholm Convention, many PCDD/F emissions continue from municipal solid waste incinerators (MSWIs) [9,10]. There is a growing body of research that recognizes the importance of restricting PCDD/F emissions from MSWIs due to increased environmental requirements [11,12].
China is a major developing country with fast-paced economic growth; meanwhile, China is characterized for its high degree of energy consumption, high level of heavy industry, international trade, and urbanization progress [13]. The rapid development has also brought many environmental problems. For example, the PCDD/F emissions from China are larger than other countries in the world due to its economic scale and energy structure. In 2004, the production of PCDD/Fs from China was estimated to be 10,237 g of toxic equivalents (TEQ) per year, and the atmospheric emission was estimated to be 5042.8 g TEQ per year [14]. According to this study, using a similar methodology, the PCDD/F atmosphere emissions from China in 2016 were 10,366 g TEQ per year [14]. This value almost equals twice the value of 2014. With the increasing awareness of environmental protection and the strict ratification of the Stockholm Convention, the production and release of PCDD/Fs from China dropped sharply and reached an emission peak in 2007. These results demonstrated that these preliminary control measures in China were effectiveness.
To date, several measures have been taken to restrict PCDD/F emissions from MSWI [15,16]. Among them, air pollution control devices (APCDs) are a mostly direct method for restricting the emission of PCDD/Fs into the atmosphere [17]. In APCDs, the first step is usually the removal of fly ash directly downstream of the steam boiler [18]. The next step is the neutralization of acid compounds in wet or dry scrubbing systems [19]. In most cases, activated carbon injection (ACI), in combination with baghouse filtration (BF), is the third step, which is often followed by a selective catalytic reduction (SCR) if NOx abatement is performed. The APCD structure can be modified in accordance with actual requirements [18]. Thus, PCDD/F emissions will be changed with the change in APCDs’ structure. In APCDs, a great deal of previous research has proved that the ACI+BF system is an effective alternative to the removal of PCDD/Fs [20]. For the ACI+BF system, there are several factors which could affect the efficiency of removing PCDD/F emissions [21], including upstream APCDs [22], the gas/particle partition of PCDD/Fs [23,24], characteristic and dosage of the activated carbon [25,26], contact time of the activated carbon and PCDD/Fs [27], and the injection method, among others [28]. According to the actual structure of APCDs [29,30], the question of how to control the operating parameters of the ACI+BF system to satisfy national PCDD/F emission standards is one of most frequently stated problems in the operation of MSWIs.
Recently, investigators have examined the effects of the characteristic and dosage of activated carbon on the removal efficiency of PCDD/F emissions (RE) in the ACI+BF system [14,22,23]. In one recent experiment, when the dosage of activated carbon was 100 mg/Nm3, removal efficiency was as high as 92–96% [31]. However, other recent evidence suggests that the optimum dosage of activated carbon is 66 mg/Nm3 (RE = 99%), and no significant difference was measured at 197 mg/Nm3 [32]. Other investigators have also provided different conclusions [33]. Thus, previously published studies on the effects of activated carbon on the removal efficiency of PCDD/Fs are not consistent. This may be related to the actual structure of APCD and the characteristic of activated carbon. Therefore, there is a lack of appropriate methods to ensure the optimum characteristic and dosage of activated carbon according to the actual APCD structure.
Several attempts have been made to model the adsorption of PCDD/Fs in the ACI+BF system [33,34]. Some key parameters (such as activated carbon concentration, specific surface area of AC, operating temperature, contact time, fly ash concentration, residence carbon concentration of fly ash, and lime concentration) of the ACI+BF system have been considered in the models [34]. These approaches, however, have failed to address the model of the adsorption of PCDD/Fs into the whole APCD process. Previous research has established migrating behaviors and the relationships of PCDD/Fs and flue gas in the whole MSWI process [22,35]. No previous study has investigated how to apply the model of PCDD/F adsorption to the relationships of PCDD/Fs and flue gas. This method provides a simple, economic way to ensure the characteristic and dosage of activated carbon based on the actual APCD structure, especially for stable operating conditions. However, far too little attention has been paid to this research.
The present paper describes the migrating behaviors and relationships of PCDD/Fs and flue gas during the whole MSWI process. The results will investigate how to apply the PCDD/F adsorption model to the relationships of PCDD/Fs and flue gas. Additionally, some key parameters of APCDs are discussed in this paper, and design equations are presented.

2. Materials and Methods

2.1. Sampling

The tested data were sampled from a full-scale mechanical-grate MSWI. A schematic diagram of the MSWI is shown in Figure 1. The exhaust gas was initially cooled by superheater and then passed through an economizer in which some large particulates were separated from the flue gas by superheaters and collected in the ash hoppers. The flue gas then passed through a semi-dry scrubber (SDS) in which acid gas was removed by a reaction with injected slaked lime slurry. Next, activated carbon was added to capture the PCDD/Fs, and other fine ash and powder-activated carbon (AC) particles were collected effectively by BF. The multi-point Brunauer–Emmett–Teller (BET) of the powder AC was 663.3 m2/g, and the average pore radius of the powder AC was 14.6 Å. Moreover, NOx was removed by selective catalytic reduction (SCR). Non-selective catalytic reduction (SNCR) was also applied to remove NOx. Six tests were carried out, and all were performed under sufficient burning conditions. All operations were conducted as steadily as possible to minimize group variation. For each test, flue gas was sampled at six different positions, as shown in Figure 1.

2.2. Instrumental Analysis

Samples were collected in a multi-component sampling train using the filter/condenser method, following Chinese Standard Measurement Procedure HJ/T 77.2-2008. The collection components consisted of a quartz fiber filtration medium, in line with a condenser and a sorbent (XAD-2). Purified samples were analyzed through a high-resolution gas chromatography/high-resolution mass spectrometry (HRGC/HRMS) (DFS High Resolution GC/MS, America). The gas chromatograph was equipped with a DB-5MS column (60 m length × 0.25 mm ID × 0.25 μm film, Agilent Technologies). The international toxic equivalents (TEQ) were estimated using international toxic equivalence factors. The PCDD/F congeners were identified and quantified on the basis of retention time and isotope ratios. PCDD/F emissions were consistent with the PCDD/F emissions in the filter membrane, condenser, and XAD-2. The compositions of O2, SO2, and NOx in the flue gas were simultaneously sampled by the exhaust gas sampler, and the concentration was tested using electrochemical sensors. The test ranges of O2, SO2, and NOx in flue gas were 0–25%, 0–5700 mg/Nm3, and 0–1500 mg/Nm3, respectively. The resolution ratios of O2, SO2, and NOx in the electrochemical sensors were 0.1%, 1 mg/Nm3, and 1 mg/Nm3, respectively.

3. Results and Discussion

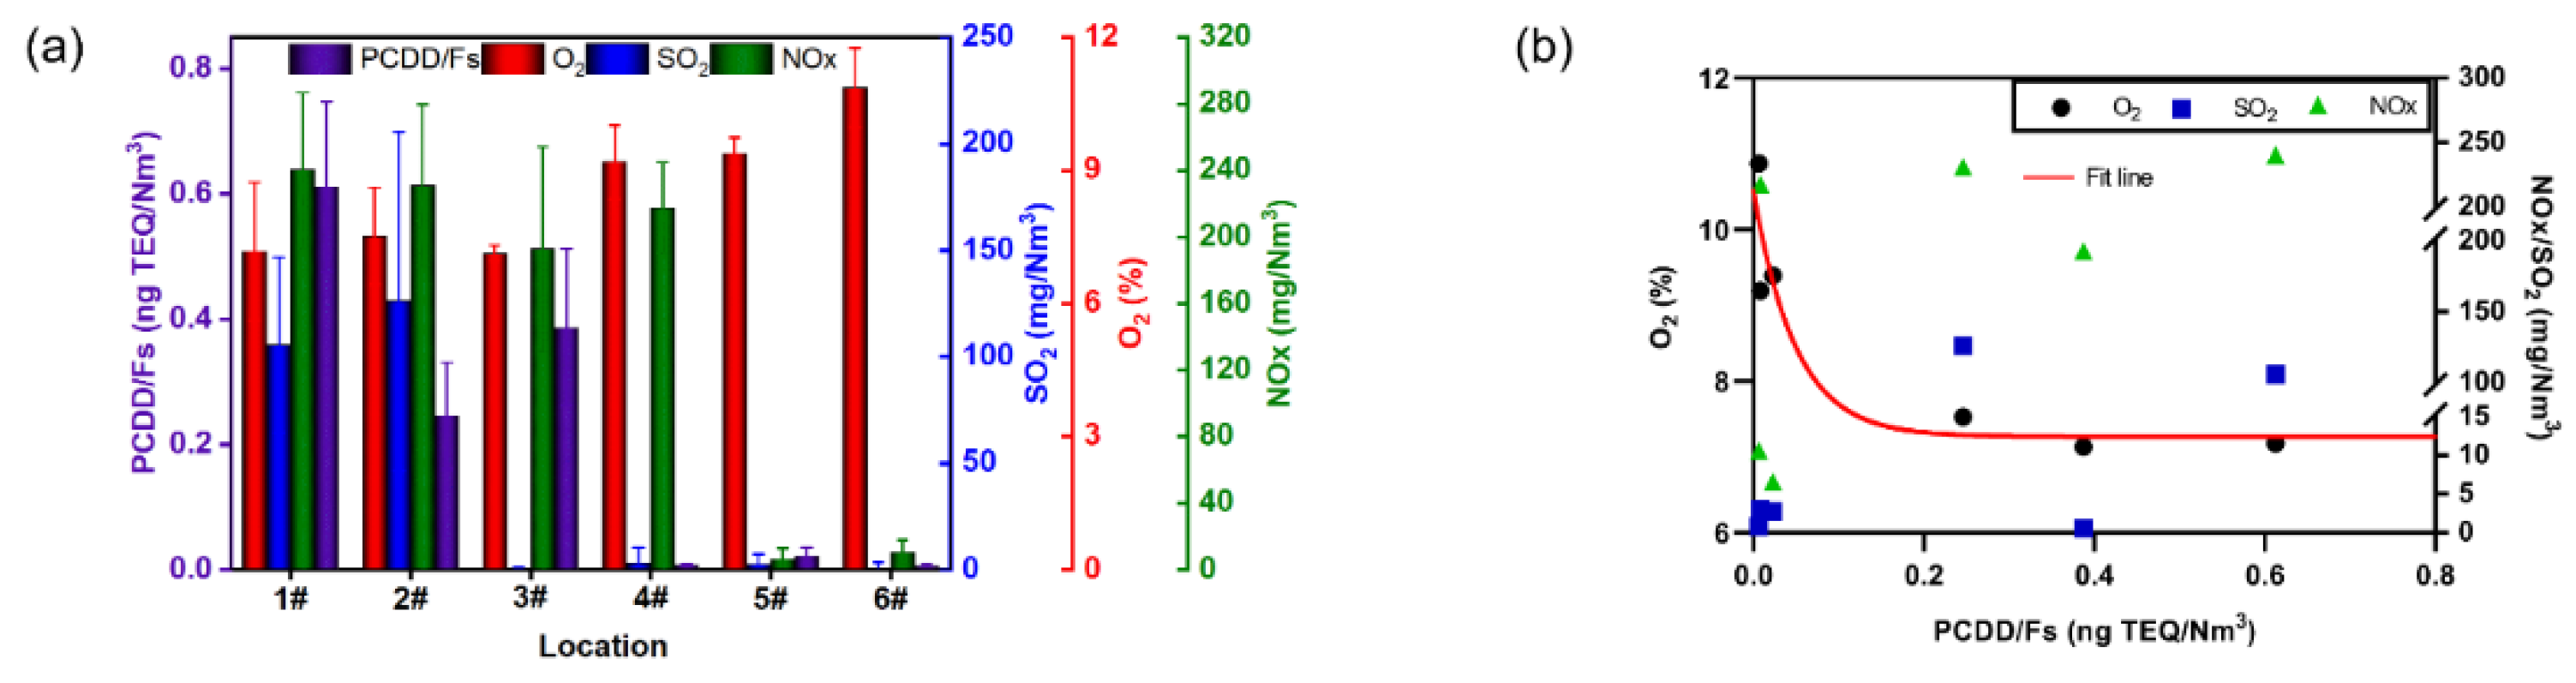
3.1. Correlations of PCDD/Fs and Flue Gas Components

The emissions of PCDD/Fs and flue gas components at different concentrations are shown in Figure 2. The concentrations of the SO2, NOx, and PCDD/Fs followed a generally decreasing trend through the APCDs, but the O2 concentration showed an opposite trend (Figure 2a). The SO2 concentration decreased strongly moving through the semi-dry scrubber. This result could be explained by the fact that most of the SO2 migrated to lime particles by homogeneous condensation, surface chemical reaction, and surface physical adsorption. The NOx concentration showed a significantly decreasing trend while moving through SCR system. The O2 concentration increased with the decrease in SO2 and NOx concentrations. It is noteworthy that the removal efficiency of the PCDD/Fs mainly originated from the ACI+BF system and was approximately 61.95%. This is consistent with previous observations [20]. The effects of SO2 on the de novo synthesis of PCDD/Fs was studied in a previously published report, which pointed out that the synthesis of PCDD/Fs could be inhibited by the sulfate of CuCl2 [36]. However, the concentrations of SO2 and PCDD/Fs followed a generally decreasing trend through the APCDs. However, there is no direct correlation between them. This is a complex process. Further studies, which take these variables into account, will need to be undertaken. To date, little evidence has been found associating NOx with PCDD/Fs. This is an important issue for future research.
Statistically significant correlations were observed between PCDD/F emissions and flue gas components (Figure 2b). There was a significant correlation between PCDD/F emissions and the O2 concentration (R2 = 0.905). However, the correlation between PCDD/Fs and SO2 and the correlation between PCDD/Fs and NOx were insignificant. Thus, the O2 concentration could be used to estimate the PCDD/F emissions during the APCD process.

3.2. Modeling PCDD/F Emissions in APCDs

As shown in Figure 2b, levels of ∑PCDD/Fs and the I-TEQ values decreased as a one-phase exponential decay function. The slope (y = −A/t) of special point (0, y0 + A) could characterize the rapid decay rate of the ∑PCDD/F levels using the O2 concentration in flue gas (Figure S1). The parameter of t is the time constant parameter, and thus A is the control parameter. We therefore can modify the parameter of A to achieve the purposes of modeling ∑PCDD/F emissions in APCDs. The modification of A should refer to the characteristic of PCDD/F emissions in APCDs. According to the migrating behaviors of ∑PCDD/Fs and the O2 concentration in APCDs (Figure 2), the rapid decay rate of ∑PCDD/Fs originated from the removal of the ACI+BF system. Therefore, the parameter of A could be modified by the removal efficiency of ∑PCDD/Fs in ACI+BF system. PCDD/Fs of flue gas could be divided into gas phase and particle phase. The gas/particle partition of PCDD/Fs depends on the flue gas temperature, ash density, and ash properties (specific surface area, vapor pressure, pore size, and chemical properties) [37]. The partition of gas/particle phase PCDD/Fs is also affected by the actual structure of the APCDs, which is applied upstream, and the particulate matter concentration in the flue gas [24]. When cyclone and electrostatic precipitator equipment is applied prior to ACI+BF, gaseous PCDD/Fs comprise the main proportion of PCDD/Fs in the flue gas. For controlling particulate emissions and acid gas, MWIs were equipped with four series connecting ash hoppers and a semi-dry scrubber. This equipment was located prior to the ACI+BF system. Therefore, the gaseous PCDD/Fs were mainly proportionate in the flue gas. In the ACI+BF system, the adsorption of gaseous PCDD/Fs consists of the adsorption of gaseous PCDD/Fs in the entrained flow and filter cake [33,34]. Thus, according to the adsorption of gaseous PCDD/Fs in the entrained flow and filter cake, we can establish the relationships between the parameter A and the removal efficiency of the ∑PCDD/Fs in the ACI+BF system. The adsorption efficiency of gaseous PCDD/Fs in the entrained flow can be expressed as [33,34,38]:
η t = 1 exp k 1 2 φ residual carbon × 10 0.0125 T 3 C dust + 10 0.0125 T 5 C lime + 5.31 × S ss × 10 0.0125 T 6 C AC t t
where ηt is the adsorption efficiency of gaseous PCDD/Fs in the entrained flow; k1 is the adsorption coefficient, 9200 Nm3‧mold‧s−1 [38]; T is the flue gas temperature, °C; φresidual-carbon is the mass fraction of residual carbon in the fly ash, %; Sss is the specific surface area of active carbon, m2‧g−1; Cdust, Clime, and CAC are concentrations (g‧Nm−3) of fly ash, lime, and active carbon, respectively; tt is contact time in entrained flow, s.
The adsorption efficiency of filter cake can be expressed as [33,34]:
η f = 1 exp 79.1 ρ b × 1 0 3 f s 2 φ residual carbon × 1 0 0.0125 T 3 f D + 1 0 0.0125 T 5 f L + 5.31 × S ss × 1 0 0.0125 T 6 f A d ε υ f
where ηf is the adsorption efficiency of the filter cake; ρb is the bulk density of the filter cake, kg‧m−3; fs is the fraction of unoccupied adsorption sites of adsorbents in the filter cake. According to the reference, fD, fL, and fA are mass fractions of fly ash, lime, and active carbon, equal to 1.5%, 97.8%, and 0.7%, respectively [33]; d is the distance of the filter cake, m; νf is the filtration velocity, m‧s−1. Therefore, the removal efficiency of gaseous PCDD/Fs by the ACI+BF system can be expressed as 1 η g = 1 η t 1 η f [34]. The total removal efficiency of PCDD/Fs can be expressed by η = φ s η s + 1 φ s η g [34]. ηs is removal efficiency of particle-phase PCDD/Fs; φs is the proportion of particle-phase PCDD/Fs. Thus, the relationships of the A parameter and the removal efficiency of PCDD/Fs accord with A = 6.91 + 1.21 × 1 0 5 × e η g / 0.10 (η < 0.87) and A   = 2.64 + 1.38   × 1 0 12 × e η g / 0.033 (0.87 ≤ η ≤ 1) (Figure S1). As shown in Figure 3, the values calculated by the above model fit well with the tested values. Thus, the model is reliable for calculating PCDD/F emissions in MSWIs.

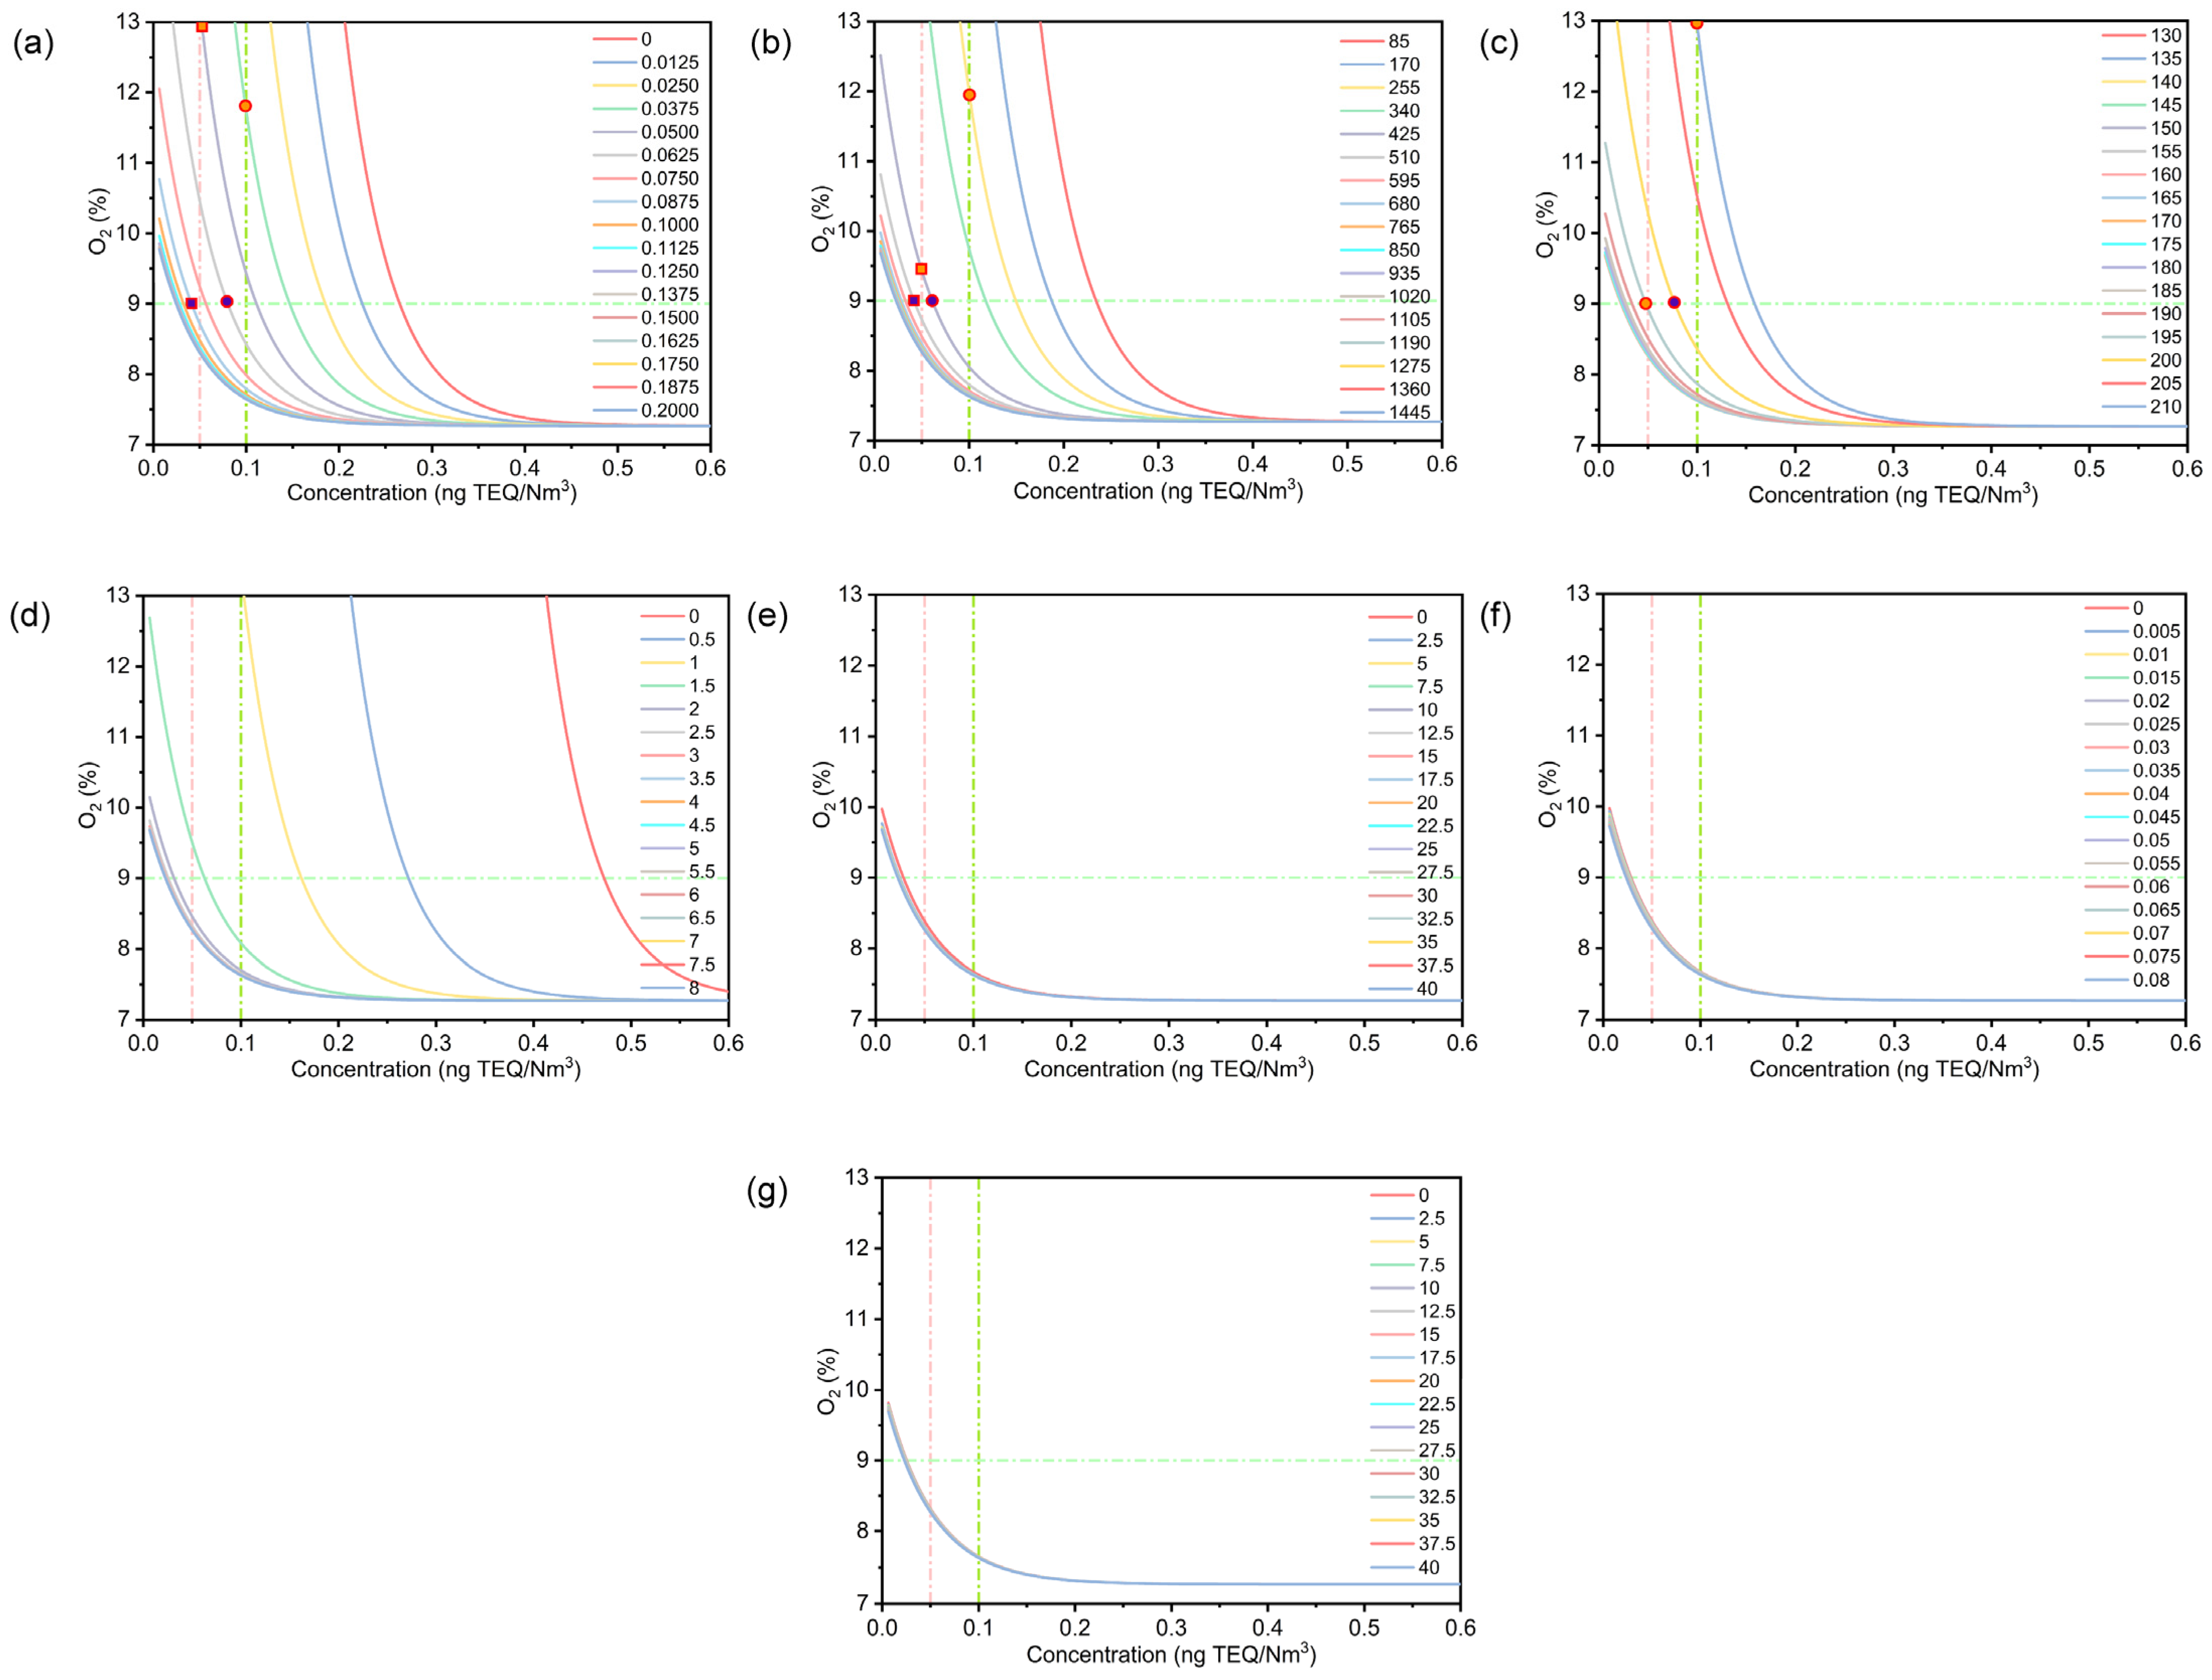
3.3. Effects of Operating Parameters on ∑PCDD/Fs

At the stack inlet, following the principle of “3T+E”, the O2 concentration was in the range of 9–13% (Figure S2). As shown in Figure 4a, in order to reach the standards of 0.1 ng TEQ/Nm3 and 0.05 ng TEQ/Nm3, the CAC should be located in ranges of 0.0375–0.0625 g/Nm3 and 0.0500–0.0875 g/Nm3, respectively. As presented in Figure 4a, TEQs almost linearly decreased with the increase of the CAC in the range of 0–0.010 g/Nm3, and then reached a steady state in the range of 0.1–0.2 g/Nm3. When the CAC was located in the range of 0–0.010 g/Nm3, these results indicated that increasing the CAC was beneficial to the removal of PCDD/Fs in the flue gas. As shown in Figure 4b,d–g, similar to the CAC, to reach standards of 0.1 ng TEQ/Nm3 and 0.05 ng TEQ/Nm3, the Sss, tt, Cdust, φ, and Clime also had appropriate ranges. Additionally, with the increase in the Sss, tt, Cdust, φ, and Clime, the TEQ also linearly decreased and then reached a steady state (Figure 5b,d–g), whereas the influence of BF temperature on the TEQ shows an opposite change. There are two possible explanations for this result. First, the saturated vapor pressure of PCDD/Fs increases with the increase in BF temperature, leading to an increase in the gaseous PCDD/F partition. Second, the available active adsorption sites decreased with the increase in BF temperature. Cdust has a slight effect on PCDD/F emissions Figure 4e). There are several possible explanations for this result. First, in the presence of activated carbon, PCDD/F adsorption by fly ash was negligible. Second, when fly ash passed through the APCDs, the PCDD/F adsorption by fly ash was in equilibrium. In order to distinguish PCDD/F adsorption in activated carbon and fly ash, we studied PCDD/F adsorption by fly ash in the absence of activated carbon (see in built-in graph of Figure 4e). Similar to the results in the present of activated carbon, TEQ linearly decreased and then reached a steady state with the increase in the Cdust. Similar results were also observed in other studies [34]. In order to reach 0.1 ng TEQ/Nm3, the Cdust was located in the range of 5–7.5 g/Nm3, which was 125 times that of the CAC. These results indicated that the uptake of PCDD/Fs by fly ash is obviously lower than that of activated carbon. To date, several reports have suggested that the uptake of PCDD/Fs by fly ash mainly originates form carbonous residue [39,40]. These reports agreed well with this paper (Figure 4f). It was found that TEQ linearly decreased with the increase in carbonous residue in the range of 0–0.04 (Figure 4f). A great deal of previous research has demonstrated that combustion efficiency decreased with the increase in carbonous residue [41]. Therefore, the carbonous residue in fly ash must remain within 1 wt.%. For old-style MSWIs, the carbonous residue in fly ash could reach 3–10 wt.%. Similar to the Cdust, the TEQs also linearly decreased and then reached a steady state with the increase in carbonous residue. These results proved that the uptake of PCDD/Fs by fly ash mainly originated from carbonous residue. Additionally, in order to reach 0.1 ng TEQ/Nm3, carbonous residue should be located in the range of 0.06–0.07 (see in built-in graph of (Figure 5f). According to the formula of Cdust×φ, the total carbonous residue in flue gas was 0.14 g/Nm3, which was 2.8 times that of the CAC. These results demonstrated that carbon was significantly different between fly ash and activated carbon. Similar to the Cdust, in the presence of activated carbon, the Clime has just a slight effect on PCDD/Fs emissions (Figure 4g). From the built-in graph of Figure 5f, in the absence of activated carbon and in order to reach the standard of 0.1 ng TEQ/Nm3, the Clime must be located in the range of 20–35 g/Nm3, which is 550 times that of the CAC.

3.4. Environmental Applications or Suggestions

According to the modeling results, we summarized the operating parameters for attaining the standards of 0.1 ng TEQ/Nm3 (China) and 0.05 ng TEQ/Nm3 (as the ultra-low emission standard of PCDD/Fs in China) (Table 1). These findings suggest that in general, the characteristic and dosage of activated carbon was one of factors determining the removal of PCDD/Fs. As shown in Table 1, when the PCDD/F emissions are 0.05 ng TEQ/Nm3, the operating temperature is 177.9 °C, and it is lower than in the case of a 0.10 ng TEQ/Nm3, whereas the other parameters were much higher than that of the 0.1 ng TEQ/Nm3. Therefore, it is necessary to comprehensively consider the influence of these factors in the actual application process.
Until now, testing PCDD/F emissions from MSWIs typically required a multi-hour sample extraction, followed by several weeks of tedious analytical work to determine their concentrations in a professional laboratory [42]. Thus, it is difficult to achieve the goals of real-time monitoring and a low analyzing cost. However, the online and real-time monitoring of PCDD/Fs is currently infeasible due to their low concentration and the complex nature of flue gas [43,44]. Recent evidence suggests that the dioxin precursor correlation method could be indirectly calculated through the online monitoring of concentrations of dioxin precursors [45,46]. In fact, the analytical cost is still expensive. Additionally, the verification of many experimental results is still lacking in engineering. This study has shown that the online and real-time monitoring of PCDD/Fs could be indirectly tested based on the correlations of PCDD/F emissions and flue gas. The research has also shown that modeling the adsorption of PCDD/Fs by activated carbon could be applied to relationships between PCDD/F emissions and flue gas. Therefore, the time lag between the analytical results and the operation conditions of incinerator was drastically shortened, resulting in linking the PCDD/F emissions to the operation of MSWIs in a timely fashion. Public safety also was simultaneously guaranteed. Compared to the dioxin precursor correlation method, the cost of the online and real-time monitoring of PCDD/Fs sharply decreased. Moreover, this method is easy to apply in engineering.
However, this study did not consider the effects of the CO concentration of the flue gas and the pressure drops of the ACI+BF system on the PCDD/F emissions. Currently, there are relatively few direct reports on the effect of a pressure drop of ACI+BF system on the removal of dioxin. There are relatively many reports about the influence of the operating temperature, AC residence time, and AC feeding rate of the bag filter on the removal rate of gaseous pollutants [47]. In future investigations, it might be possible to use different pressure drops in the ACI+BF system. Aurell et al. indicated that increasing the CO levels as the transient combustion condition, raising the Cl level, and reducing the freeboard temperature all substantially increased the PCDD/F emission levels [48]. The formation of PCDD/Fs is a complex process; several questions still remain to be answered. Therefore, it is affected by many factors. Further studies which take these variables into account, will need to be conducted. More information on the above studies would help us to establish a greater degree of accuracy on this matter.

4. Conclusions

The online and real-time monitoring of PCDD/Fs at a low cost is a challenge due to their low concentration and complex nature. In this investigation, the aim was to assess a coupling model of the adsorption of activated carbon and the relationship between the PCDD/Fs and the flue gas. The most obvious finding to emerge from this study is that an online monitoring system with real-time control of final PCDD/F emissions was built for the tracing and control of PCDD/Fs. According to the online monitoring system, the effects of some key parameters (activated carbon concentration, specific surface area of AC, operating temperature, contact time, fly ash concentration, residence carbon concentration of fly ash, and lime concentration) in MSWIs on the final PCDD/F emissions were discussed in this paper. These key operating parameters of MSWIs for reaching the standards of 0.1 ng TEQ/Nm3 and 0.05 ng TEQ/Nm3 were summarized by the predicting model. Although the current study was based on a small sample of participants, the findings suggest the activated carbon concentration, specific surface area of AC, operating temperature, contact time, fly ash concentration, residence carbon concentration of fly ash, and lime concentration were 0.050 g/Nm3, 425 m2/g, 177.9 °C, 4.22 s, 14 g/Nm3, 0.075, and 35 g/Nm3 under the standard of 0.05 ng TEQ/Nm3. Several questions remain unanswered at present. Further studies which take these variables into account will need to be conducted.

Supplementary Materials

The following supporting information can be downloaded at: https://www.mdpi.com/article/10.3390/pr11041158/s1, Figure S1: One-phase exponential decay function; Figure S2: The concentration of O2 at the stack inlet.

Author Contributions

Conceptualization, J.C., D.H. and M.L.; methodology, W.L.; formal analysis, J.C., D.H. and M.L.; writing—original draft preparation, J.C. and L.Z.; writing—review and editing, D.H., M.L., X.T. and W.L.; funding acquisition, J.C. and M.L. All authors have read and agreed to the published version of the manuscript.

Funding

This research was funded by Guangxi Key Laboratory of New Energy and Building Energy Saving (22-J-22-1 and 22-J-21-8), the Guangxi Natural Science Foundation of China (2020GXNSFBA297075 and AD20297010), the Guilin Scientific Research and Technology Development Plan of China (2021H0202 and 20210218-3), and the National Natural Science Foundation of China (52266011).

Informed Consent Statement

Not applicable.

Data Availability Statement

No new data were created.

Acknowledgments

The authors gratefully acknowledge the financial support of the Guangxi Key Laboratory of New Energy and Building Energy Saving (22-J-22-1 and 22-J-21-8), the Guangxi Natural Science Foundation of China (2020GXNSFBA297075 and AD20297010), the Guilin Scientific Research and Technology Development Plan of China (2021H0202 and 20210218-3), and the National Natural Science Foundation of China (52266011).

Conflicts of Interest

The authors declare no conflict of interest.

Abbreviations

PCDD/FPolychlorinated dibenzo-p-dioxin and polychlorinated dibenzofuran
MSWIMunicipal solid waste incinerator
MSWMunicipal solid waste
TEQInternational toxic equivalents
APCDAir pollution control device
SDSSemi-dry scrubber
BFBaghouse filtration
SCRSelective catalytic reduction
HRGC/HRMSHigh-resolution gas chromatograph/high-resolution mass spectrometer
ACIActivated carbon injection
ACActivated carbon
SSASpecific Surface Area
BETBrunauer–Emmett–Teller

References

  1. Kaza, S.; Yao, L.; Bhada-Tata, P.; Van Woerden, F. What a Waste 2.0: A Global Snapshot of Solid Waste Management to 2050; World Bank Publications: Washington, DC, USA, 2018. [Google Scholar]
  2. Ding, Y.; Zhao, J.; Liu, J.-W.; Zhou, J.; Cheng, L.; Zhao, J.; Shao, Z.; Iris, Ç.; Pan, B.; Li, X.; et al. A review of China’s municipal solid waste (MSW) and comparison with international regions: Management and technologies in treatment and resource utilization. J. Clean. Prod. 2021, 293, 126144. [Google Scholar] [CrossRef]
  3. Luo, H.; Cheng, Y.; He, D.; Yang, E.-H. Review of leaching behavior of municipal solid waste incineration (MSWI) ash. Sci. Total Environ. 2019, 668, 90–103. [Google Scholar] [CrossRef] [PubMed]
  4. Ssebugere, P.; Sillanpää, M.; Matovu, H.; Mubiru, E. Human and environmental exposure to PCDD/Fs and dioxin-like PCBs in Africa: A review. Chemosphere 2019, 223, 483–493. [Google Scholar] [CrossRef] [PubMed]
  5. Esposito, V.; Bruno, D.; Maffei, A.; Giua, R.; Capoccia, C.; Nicosia, A.; Ficocelli, S. Long-term emission sampling validation for PCDD/Fs control of compliance to permitted Emission Limit Values at a large sinter plant. Chemosphere 2019, 233, 44–48. [Google Scholar] [CrossRef]
  6. Li, X.; Dong, S.; Wang, P.; Su, X.; Fu, J. Polychlorinated biphenyls are still alarming persistent organic pollutants in marine-origin animal feed (fishmeal). Chemosphere 2019, 233, 355–362. [Google Scholar] [CrossRef]
  7. Li, M.; Zhou, Y.; Wang, G.; Zhu, G.; Zhou, X.; Gong, H.; Sun, J.; Wang, L.; Liu, J. Evaluation of atmospheric sources of PCDD/Fs, PCBs and PBDEs around an MSWI plant using active and passive air samplers. Chemosphere 2021, 274, 129685. [Google Scholar] [CrossRef]
  8. Mato, Y.; Isobe, T.; Takada, H.; Kanehiro, H.; Ohtake, C.; Kaminuma, T. Plastic Resin Pellets as a Transport Medium for Toxic Chemicals in the Marine Environment. Environ. Sci. Technol. 2001, 35, 318–324. [Google Scholar] [CrossRef]
  9. De Titto, E.; Savino, A. Environmental and health risks related to waste incineration. Waste Manag. Res. 2019, 37, 976–986. [Google Scholar] [CrossRef]
  10. Chen, Z.L.; Tang, M.H.; Lu, S.Y.; Buekens, A.; Ding, J.M.; Qiu, Q.L.; Jianhua, Y. Mechanochemical degradation of PCDD/Fs in fly ash within different milling systems. Chemosphere 2019, 223, 188–195. [Google Scholar]
  11. Lu, J.-W.; Zhang, S.; Hai, J.; Lei, M. Status and perspectives of municipal solid waste incineration in China: A comparison with developed regions. Waste Manag. 2017, 69, 170–186. [Google Scholar] [CrossRef]
  12. Pham, M.T.N.; Hoang, A.Q.; Nghiem, X.T.; Tu, B.M.; Dao, T.N.; Vu, D.N. Residue concentrations and profiles of PCDD/Fs in ash samples from multiple thermal industrial processes in Vietnam: Formation, emission levels, and risk assessment. Environ. Sci. Pollut. Res. 2019, 26, 17719–17730. [Google Scholar] [CrossRef] [PubMed]
  13. Zheng, W.; Walsh, P.P. Economic growth, urbanization and energy consumption—A provincial level analysis of China. Energy Econ. 2019, 80, 153–162. [Google Scholar] [CrossRef]
  14. Gao, D.; Chen, Z.; Zhang, J.; Xu, W.; Wen, D.; Hu, J. Historical production and release inventory of PCDD/Fs in China and projections upon policy options by 2025. Sci. Total Environ. 2023, 876, 162780. [Google Scholar] [CrossRef] [PubMed]
  15. Deng, D.; Qiao, J.; Liu, M.; Kołodyńska, D.; Zhang, M.; Dionysiou, D.D.; Ju, Y.; Ma, J.; Chang, M.-B. Detoxification of municipal solid waste incinerator (MSWI) fly ash by single-mode microwave (MW) irradiation: Addition of urea on the degradation of Dioxin and mechanism. J. Hazard. Mater. 2019, 369, 279–289. [Google Scholar] [CrossRef]
  16. Chen, Z.; Lin, X.; Lu, S.; Li, X.; Yan, J. Suppressing formation pathway of PCDD/Fs by S-N-containing compound in full-scale municipal solid waste incinerators. Chem. Eng. J. 2019, 359, 1391–1399. [Google Scholar] [CrossRef]
  17. Wang, C.; Xu, J.; Yang, Z.; Zhang, Z.; Cai, Z. A field study of polychlorinated dibenzo-p-dioxins and dibenzofurans formation mechanism in a hazardous waste incinerator: Emission reduction strategies. J. Clean. Prod. 2019, 232, 1018–1027. [Google Scholar] [CrossRef]
  18. Vehlow, J. Air pollution control systems in WtE units: An overview. Waste Manag. 2015, 37, 58–74. [Google Scholar] [CrossRef]
  19. Zhong, Z.; Jin, B.; Huang, Y.; Zhou, H.; Zhang, M. Experimental study on flue gas purifying of MSW incineration using in-pipe jet adsorption techniques. Waste Manag. 2008, 28, 1923–1932. [Google Scholar] [CrossRef]
  20. Qiang, N.; He, J.; Miao, H.; Xie, L.; Liu, T.; Cao, Y.; Li, Z. A novel activated carbon injection method to enhance PCDD/Fs removel efficiency in flue gas from a medical waste incinerator in Shanghai, China. Appl. Ecol. Environ. Res. 2018, 16, 2717–2728. [Google Scholar] [CrossRef]
  21. Tejima, H.; Nakagawa, I.; Shinoda, T.-A.; Maeda, I. PCDDs/PCDFs reduction by good combustion technology and fabric filter with/without activated carbon injection. Chemosphere 1996, 32, 169–175. [Google Scholar] [CrossRef]
  22. Zhan, M.; Wang, T.; Yang, J.; Ji, L.; Zhou, G.; Chen, T.; Li, X.; Lin, X. The Behaviors and Relationships of PCDD/Fs and Chlorobenzenes in the Whole Process of one Municipal Solid Waste Incinerator. Aerosol Air Qual. Res. 2018, 18, 3134–3146. [Google Scholar] [CrossRef]
  23. Liu, X.; Ye, M.; Wang, X.; Liu, W.; Zhu, T. Gas-phase and particle-phase PCDD/F congener distributions in the flue gas from an iron ore sintering plant. J. Environ. Sci. 2017, 54, 239–245. [Google Scholar] [CrossRef]
  24. Chi, K.H.; Chang, M.B. Evaluation of PCDD/F Congener Partition in Vapor/Solid Phases of Waste Incinerator Flue Gases. Environ. Sci. Technol. 2005, 39, 8023–8031. [Google Scholar] [CrossRef]
  25. Chang, Y.-M.; Hung, C.-Y.; Chen, J.-H.; Chang, C.-T.; Chen, C.-H. Minimum feeding rate of activated carbon to control dioxin emissions from a large-scale municipal solid waste incinerator. J. Hazard. Mater. 2009, 161, 1436–1443. [Google Scholar] [CrossRef] [PubMed]
  26. Das, D.; Gaur, V.; Verma, N. Removal of volatile organic compound by activated carbon fiber. Carbon 2004, 42, 2949–2962. [Google Scholar] [CrossRef]
  27. Karademir, A.; Bakoglu, M.; Taspinar, F.; Ayberk, S. Removal of PCDD/Fs from Flue Gas by a Fixed-Bed Activated Carbon Filter in a Hazardous Waste Incinerator. Environ. Sci. Technol. 2004, 38, 1201–1207. [Google Scholar] [CrossRef]
  28. Chen, M.-W.; Lin, T.-C.; Wang, L.-C.; Chang-Chien, G.-P. The PCDD/F Removal Efficiency of a Medical Waste Incinerator Dual-Bag Filter System. Aerosol Air Qual. Res. 2014, 14, 1223–1231. [Google Scholar] [CrossRef] [Green Version]
  29. Sam-Cwan, K.; Hwan, J.S.; Il-Rok, J.; Ki-Hun, K.; Myung-Hee, K.; Jae-Hyung, K.; Jun-Heung, Y.; Seung-Jin, K.; Jae-Cheon, Y.; Dong-Hee, J. Removal efficiencies of PCDDs/PCDFs by air pollution control devices in municipal solid waste incinerators. Chemosphere 2001, 43, 773–776. [Google Scholar] [CrossRef]
  30. Cheruiyot, N.K.; Lee, W.-J.; Yan, P.; Mwangi, J.K.; Wang, L.-C.; Gao, X.; Lin, N.-H.; Chang-Chien, G.-P. An Overview of PCDD/F Inventories and Emission Factors from Stationary and Mobile Sources: What We Know and What is Missing. Aerosol Air Qual. Res. 2016, 16, 2965–2988. [Google Scholar] [CrossRef] [Green Version]
  31. Abad, E.; Caixach, J.; Rivera, J. Improvements in dioxin abatement strategies at a municipal waste management plant in Barcelona. Chemosphere 2003, 50, 1175–1182. [Google Scholar] [CrossRef] [Green Version]
  32. Gunes, G.; Saral, A.; Yıldız, Ş.; Kuzu, S.L. Determination of optimum dose of adsorbent for PCDD/F removal in the flue gas of a medical waste incineration plant. Chem. Eng. Res. Des. 2015, 104, 695–702. [Google Scholar] [CrossRef]
  33. Everaert, K.; Baeyens, J.; Degrève, J. Entrained-Phase Adsorption of PCDD/F from Incinerator Flue Gases. Environ. Sci. Technol. 2003, 37, 1219–1224. [Google Scholar] [CrossRef] [PubMed]
  34. Lu, S.; Ji, Y.; Buekens, A.; Ma, Z.; Jin, Y.; Li, X.; Yan, J. Activated carbon treatment of municipal solid waste incineration flue gas. Waste Manag. Res. J. Sustain. Circ. Econ. 2012, 31, 169–177. [Google Scholar] [CrossRef]
  35. Zhang, H.-J.; Ni, Y.-W.; Chen, J.-P.; Zhang, Q. Influence of variation in the operating conditions on PCDD/F distribution in a full-scale MSW incinerator. Chemosphere 2008, 70, 721–730. [Google Scholar] [CrossRef]
  36. Ke, S.; Jianhua, Y.; Xiaodong, L.; Shengyong, L.; Yinglei, W.; Muxing, F. Inhibition of de novo synthesis of PCDD/Fs by SO2 in a model system. Chemosphere 2010, 78, 1230–1235. [Google Scholar] [CrossRef] [PubMed]
  37. Mätzing, H.; Baumann, W.; Becker, B.; Jay, K.; Paur, H.-R.; Seifert, H. Adsorption of PCDD/F on MWI fly ash. Chemosphere 2001, 42, 803–809. [Google Scholar] [CrossRef] [PubMed]
  38. Shin, D.; Choi, S.; Oh, J.-E.; Chang, Y.-S. Evaluation of Polychlorinated Dibenzo-p-dioxin/Dibenzofuran (PCDD/F) Emission in Municipal Solid Waste Incinerators. Environ. Sci. Technol. 1999, 33, 2657–2666. [Google Scholar] [CrossRef]
  39. Wang, M.; Li, Q.; Liu, W.; Fang, M.; Han, Y. Monochlorinated to Octachlorinated Polychlorinated Dibenzo-p-dioxin and Dibenzofuran Emissions in Sintering Fly Ash from Multiple-Field Electrostatic Precipitators. Environ. Sci. Technol. 2018, 52, 1871–1879. [Google Scholar] [CrossRef]
  40. Weber, R.; Takasuga, T.; Nagai, K.; Shiraishi, H.; Sakurai, T.; Matuda, T.; Hiraoka, M. Dechlorination and destruction of PCDD, PCDF and PCB on selected fly ash from municipal waste incineration. Chemosphere 2002, 46, 1255–1262. [Google Scholar] [CrossRef]
  41. Burris, S.C.; Li, D.; Riley, J.T. Comparison of Heating Losses and Macro Thermogravimetric Analysis Procedures for Estimating Unburned Carbon in Combustion Residues. Energy Fuels 2005, 19, 1493–1502. [Google Scholar] [CrossRef]
  42. Oudejans, L.; Touati, A.; Gullett, B.K. Real-Time, On-Line Characterization of Diesel Generator Air Toxic Emissions by Resonance-Enhanced Multiphoton Ionization Time-of-Flight Mass Spectrometry. Anal. Chem. 2004, 76, 2517–2524. [Google Scholar] [CrossRef] [PubMed]
  43. Liu, W.; Jiang, J.; Hou, K.; Wang, W.; Qi, Y.; Wang, Y.; Xie, Y.; Hua, L.; Li, H. Online monitoring of trace chlorinated benzenes in flue gas of municipal solid waste incinerator by windowless VUV lamp single photon ionization TOFMS coupled with automatic enrichment system. Talanta 2016, 161, 693–699. [Google Scholar] [CrossRef] [PubMed] [Green Version]
  44. Gullett, B.K.; Oudejans, L.; Tabor, D.; Touati, A.; Ryan, S. Near-Real-Time Combustion Monitoring for PCDD/PCDF Indicators by GC-REMPI-TOFMS. Environ. Sci. Technol. 2012, 46, 923–928. [Google Scholar] [CrossRef] [PubMed]
  45. Nakui, H.; Koyama, H.; Takakura, A.; Watanabe, N. Online measurements of low-volatile organic chlorine for dioxin monitoring at municipal waste incinerators. Chemosphere 2011, 85, 151–155. [Google Scholar] [CrossRef] [PubMed]
  46. Watanabe, N.; Kawamoto, K.; Asada, S.; Fujiyoshi, H.; Miyata, H.; Watanabe, G.; Suzuki, S. Surrogate study for dioxins from municipal waste incinerator in startup condition: Applicability as a dioxin control indicator and an organohalogen emission warning. J. Mater. Cycles Waste Manag. 2010, 12, 254–263. [Google Scholar] [CrossRef]
  47. Ma, X.; Lv, H.; Yang, L.; Zhang, Z.; Sun, Z.; Wu, H. Removal characteristics of organic pollutants by the adsorbent injection coupled with bag filtering system. J. Hazard. Mater. 2020, 405, 124193. [Google Scholar] [CrossRef]
  48. Aurell, J.; Marklund, S. Effects of varying combustion conditions on PCDD/F emissions and formation during MSW incineration. Chemosphere 2009, 75, 667–673. [Google Scholar] [CrossRef]
Figure 1. Systemic diagram of MSWI. 1# was located at the superheater outlet; 2# was located at the economizer outlet; 3# was located at SDS outlet; 4# was located at BF outlet; 5# was located at SCR outlet; 6# was located at stack inlet.
Processes 11 01158 g001
Figure 2. Characteristics of ∑PCDD/Fs and flue gas components, based on the three tested values: (a) emissions of ∑PCDD/Fs and flue gas components; (b) correlations of ∑PCDD/Fs and flue gas components.
Processes 11 01158 g002
Figure 3. Comparison of the calculated value and tested value (six group tested values).
Processes 11 01158 g003
Figure 4. Effect of operating parameters on PCDD/F emissions through APCDs: (a) AC concentration from 0.0500 g/Nm3 to 0.2000 g/Nm3, (b) specific surface area (SSA) of AC from 85 m2/g to 1445 m2/g, (c) operating temperature from 130 °C to 210 °C, (d) contact time from 0 s to 8 s, (e) fly ash concentration from 0 g/Nm3 to 40 g/Nm3, (f) residence carbon concentration in fly ash from 0 to 0.08, and (g) lime concentration from 0 g/Nm3 to 40 g/Nm3. In the figures (ag), Processes 11 01158 i001 is the upper limit for 0.1 ng TEQ/Nm3, Processes 11 01158 i002 is the lower limit for 0.1 ng TEQ/Nm3, Processes 11 01158 i003 is the upper limit for 0.05 ng TEQ/Nm3, and Processes 11 01158 i004 is the lower limit for 0.05 ng TEQ/Nm3. The internationally authoritative measurement of SSA is usually measured by the low-temperature nitrogen adsorption method or static volumetric principle (static volumetric principle; V-Sorb 2800). The Brunauer–Emmett–Teller (BET) theory is commonly used as the testing theory for SSA. In order to facilitate the understanding of more readers of the meaning of the picture more intuitively, in this manuscript, we replaced “SSA” with “BET”.
Processes 11 01158 g004
Figure 5. Effect of operating parameters of ACI+BF system on the final PCDD/F emissions when final O2 concentration is 9.75%: (a) AC concentration, (b) specific surface area (BET) of AC, (c) operating temperature, (d) contatct time, (e) fly ash concentration, (f) residence carbon conentration if fly ash, and (g) lime concentration.
Processes 11 01158 g005
Table 1. Operating parameters for attaining the standards of 0.1 ng TEQ/Nm3 and 0.05 ng TEQ/Nm3.
Final PCDD/F Eemissions0.1 ng TEQ/Nm30.05 ng TEQ/Nm3
CAC≥0.037 g/Nm3≥0.050 g/Nm3
Sss≥255 m2/g≥425 m2/g
T≤203.4 °C≤177.9 °C
tt≥1.24 s≥4.22 s
* Cdust≥5 g/Nm3≥14 g/Nm3
* φ≥0.06≥0.075
* Clime≥20 g/Nm3≥35 g/Nm3
*—presence of activated carbon.
Disclaimer/Publisher’s Note: The statements, opinions and data contained in all publications are solely those of the individual author(s) and contributor(s) and not of MDPI and/or the editor(s). MDPI and/or the editor(s) disclaim responsibility for any injury to people or property resulting from any ideas, methods, instructions or products referred to in the content.

