Review

Liquid–Liquid Phase Separation of Two Non-Dissolving Liquids—A Mini Review

by
Dragana Dimitrijević
1,*,
Markus Bösenhofer
1,2 and
Michael Harasek
1
1
Institute of Chemical, Environmental and Bioscience Engineering, TU Wien, 1060 Vienna, Austria
2
Area 4—Simulation and Analyses K1-MET GmbH, 4020 Linz, Austria
*
Author to whom correspondence should be addressed.
Processes 2023, 11(4), 1145; https://doi.org/10.3390/pr11041145
Submission received: 21 February 2023 / Revised: 22 March 2023 / Accepted: 5 April 2023 / Published: 7 April 2023

Abstract

:
The separation of immiscible liquids is critical in many industrial processes, such as water treatment, different extraction processes, the petroleum industry, food production, and medicine. This work provides an overview of present research on the separation of liquid mixtures. A brief summary of the thermodynamic basis is provided, covering phase equilibrium, phase diagrams, and thermodynamic properties of phases. Additionally, the fundamentals of dispersion, necessary for discussing liquid–liquid separation, are presented. Subsequently, different liquid–liquid separation methods are discussed, highlighting their advantages and limitations. These methods include decanters, coalescers, centrifugal separators, membranes and electro-coalescers for liquid–liquid separation. Phase properties, dispersion formation, and time and space constraints specify the most efficient separation method. Phase recycling is also briefly discussed as a method to reduce the environmental impact of liquid–liquid extraction with subsequent phase separation. In summary, liquid–liquid separation methods are compared and future perspectives of liquid–liquid separation are discussed.

1. Introduction

Separating a liquid–liquid mixture into two distinct phases is a critical component of numerous chemical processes, including industrial wastewater treatment [1,2,3,4], solvent extraction in hydrometallurgy [5,6,7,8,9], extraction in the field of medicine [10,11,12,13,14], separation of oil and water [15,16,17,18], ATPS (aqueous two-phase systems) [19,20,21,22], and extraction of food components [23,24,25,26]. Phase separation can be achieved as an integral part of the process design, e.g., phase separation achieved by liquid–liquid extraction [27]. However, there are cases where an independent (single) separation device is beneficial or required. Standalone separation devices can be gravity decanters [28,29,30], coalescers [29,31,32,33,34], centrifuges [29,35,36,37], and hydrocyclones [38,39,40,41,42,43]. Besides these widespread separation devices, recently membranes [44,45,46,47,48] and electro-coalescers [49,50,51] are becoming popular for liquid–liquid separation.
Liquid–liquid separation is the process of separating two immiscible liquids from each other. It is a challenging process as the two liquids can have similar densities, viscosities, and surface tensions, making it difficult to separate them effectively. Additionally, the separation process can be complicated by the presence of impurities, such as solids or other liquids that can interfere with the separation process or reduce the efficiency of the separation. There are several methods for liquid–liquid separation that are discussed in this work. However, the effectiveness of these methods varies depending on the specific properties of the liquids being separated and the desired level of separation.
The review is structured into five sections. The initial section discusses the significance, practical uses, and rationale behind liquid separation. The Section 2 summarizes the thermodynamic basis, presenting phase equilibrium and transport properties, as well as phase diagrams. Additionally, this section covers the fundamentals of dispersion and dispersed drop size, which are important for describing the stability and separation process of mixtures [52,53]. Section 3 focuses on exploring various separation equipment, presenting their theoretical fundamentals and specific examples of each individual equipment. Section 4 is dedicated to recycling of phase-forming components, which is becoming more important due to environmental and economic issues. The final section compares and summarizes the discussed separation equipment and gives an outlook on future prospects of liquid separation.

2. Thermodynamic Basis

Liquid–liquid separation depends primarily on the separated components’ thermodynamic equilibrium. Knowledge of the thermodynamic background and relationships between phases is essential, especially when selecting the proper separation device, deciding how many stages the process needs, or evaluating the interphase mass transfer and separation efficiency rate. The following sub-sections discuss the thermodynamic basis for immiscible liquid phases.

2.1. Phase Equilibrium and Activity Coefficient

Two phases are at equilibrium when the total Gibbs energy is at minimum. In other words, two non-reacting phases are at equilibrium when the chemical potential of each component is equal in both phases [54,55]:
µiI = µiII, i = 1,2, …, n,
where µi represent the chemical potential of component i in phases I and II.
Phase separation in liquid–liquid equilibrium is a complex phenomenon and can be affected by different forces and interactions [56,57,58]. Forces and interactions that play a role in phase separation can be intermolecular forces, temperature and pressure, kinetics, entropy, and enthalpy. The intermolecular forces between the molecules in each phase can influence the phase separation process. For example, suppose the intermolecular forces between the molecules in one phase are stronger than those in the other phase. In that case, the system tends to separate into two phases with different compositions [59,60]. Temperature and pressure can affect the intermolecular forces and/or the entropy of the system, leading to changes in the phase behavior [61,62,63]. The kinetics of the phase separation process can also play a role. For example, the rate at which the two phases form can be influenced by factors such as the initial concentration of the components, the size of the system, and the presence of other molecules or particles in the system [64,65]. In liquid–liquid phase separation systems, the enthalpy change (ΔH) and the entropy change (ΔS) can play an essential role in determining the phase behavior of the system [66,67,68]. This change can be either positive or negative depending on the specific properties of the liquids involved [69,70,71]. Le Chatelier’s Principle [72] offers a highly effective approach to comprehend and manage chemical equilibria. For closed systems at constant temperature and pressure, the following correlation is valid:
ΔG = ΔH−TΔS
If the system is also at equilibrium, ΔG equals zero leading to the following expression:
ΔH = TΔS
Since T is always positive, the signs of ΔH and ΔS must be the same for a system in equilibrium. The entropy reduces (ΔS < 0) for exothermic phase mixing systems at equilibrium resulting in enhanced phase separation, while the entropy increases (ΔS > 0) for endothermic phase mixing systems hindering phase separation [73,74]. In general, the entropy change is the driving force for liquid–liquid phase separation, while the enthalpy affects the separation process [67]. If the enthalpy change of the liquid mixture is high, it can require more energy to separate the liquids because of the stronger intermolecular forces. On the other hand, if the enthalpy change is low, the separation can be easier since the intermolecular forces are weaker. The specific values of the entropy and enthalpy changes for a given liquid–liquid phase separation depend on the properties of the involved liquids and the separation conditions.
For two phases at the same temperature and pressure, the phase equilibrium for species is typically described using mole fractions and activity coefficients and is given by [75,76]:
yiγiI = xiγiII, i = 1,2, …, n,
where yi and xi represent the mole fractions of component i in phases I and II, respectively, and γi is the activity coefficient of component i. Mole fraction is a measure of the relative amount of each species in the mixture, expressed as the number of moles of a particular species divided by the total number of moles in the mixture [77,78]. Activity coefficients can be defined as measurement of a deviation of a mixture from ideal behavior [79,80]. Activity coefficients are typically approximated with mathematical models. These models can be divided into correlative and predictive models. The most prominent correlative models are the Wilson [81], the NRTL [82], and the UNIQUAC [83] models. Common predictive models are the UNIFAC [84], the UNIFAC-LBY [85], the UNIFAC-DMD [86], and the NIST modified UNIFAC (UNIFAC-NIST) [87] models.

2.2. Phase Diagrams

Phase equilibria can be presented via phase diagrams. Phase diagrams are characterized by monophasic regions (homogeneous) and multiphasic regions (heterogeneous) and depend on the type of equilibria, e.g., liquid–liquid or solid–liquid. Common diagram types are TP (temperature–pressure), Txy (temperature–fraction), and Pxy (pressure–fraction). The choice of suitable phase diagrams for a given system depends on the degrees of freedom defined by Gibbs’ phase rule. Furthermore, the experimental viability of data and the intended application influence the choice of phase diagram type (TP, Txy, Pxy) for a particular system. For instance, for evaluating the temperature effect on the volatile compounds contained in oils, the Txy phase diagram is most appropriate [88].
Lower critical solution temperature (LCST) is the critical temperature below which the components of a mixture are miscible in all proportions, and is not commonly observed in phase diagrams [89]. LCST behavior is typically displayed for mixtures involving hydrogen-bonding compounds such as amine, ketone, or etheric alcohol in combination with water [90,91,92]. Several varieties of “water+glycol ether” are known to display LCST behavior [92]. In these systems, hydrogen bonding results in complete miscibility below LCST. As the temperature rises, the increasing thermal energy disturbs the hydrogen bonding, and hydrophobic interactions prevail, causing partial miscibility at temperatures above the LCST. Figure 1a shows an example of a system exhibiting only LCST, e.g., “ethylene glycol+triethylamine” [54]. Figure 1b depicts a binary system that demonstrates both an upper critical solution temperature (UCST) and a lower critical solution temperature (LCST). An example for such a system is the “water+2-butoxyethanol” [93] binary system, and it displays partial miscibility at temperatures ranging from LCST to UCST. Typically, as the temperature increases, most mixtures become increasingly soluble in each other, which indicates UCST behavior.
Multiphase systems can have more than two components, e.g., a mixture of water, oil, and surfactants (microemulsion) [96,97], known as ternary systems. The ternary and pseudo-ternary systems can be [75] one of the following:
  • type I—one binary pair with restricted miscibility;
  • type II—two binary pairs with restricted miscibility.
Figure 1c shows a triangular diagram of a type I system. “Heptane+toluene+sulfolane” is an example for such a system, where the “heptane+sulfolane” binary pair exhibits partial miscibility [96]. The boundary line that distinguishes the area where two liquid phases emerge is known as a binodal curve [88]. Lines ab, cd, and ef (tie lines) connect equilibrium compositions for each phase. The tie line is the line that describes the exact composition of the liquid phases in equilibrium for a given temperature and pressure. At the plait point, the tie lines intersect, and the length of the tie line approaches zero. This point occurs on the binodal curve when both liquid phases reach the same composition.
Figure 1d shows a triangular phase diagram for type II systems. Numerous immiscible liquid systems demonstrate a critical solution temperature at which the system ceases to divide into two liquid phases [95]. Type II systems change to type I systems when exceeding the critical temperature of the solute and extraction-solvent binary system TBS. Above the critical temperature of binary system TAS (including the feed solvent and extraction-solvent), the system reached miscibility. These systems can also demonstrate a temperature below which a critical solution point occurs, making the phase soluble.
Merchuk et al. [98] investigated the determination of equilibrium binodal lines, tie lines, and phase inversion points. The Merchuk approach involves plotting the values of the equilibrium tie lines on a graph where the axes are defined by mole fractions of two components. As mentioned, tie line connect the equilibrium points of two coexisting phases at a given temperature and pressure. In order to identify the binodal line, Merchuk et al. plotted the tie lines at a constant temperature and pressure for different compositions. The binodal line is determined by identifying the endpoints of these tie lines, which represent the critical composition at which the two coexisting phases become identical. However, some ambiguity exists where the continuity of the phases is influenced not only by the mixture composition but also by fluid dynamics. To acquire information regarding the phase composition of one system, a set of equations has to be solved following the study of Merchuk et al. [98]. The mass share of a two-phase system (Y-X system) relative to the binodal curves can be correlated with the following equation:
Y = A · e B · X 0.5 + C · X 3
where A, B, and C are binodal curve parameters determined from the regression of experimental data [99]. Overall, the Merchuk approach is a useful tool to determine the phase behavior of liquid–liquid systems, particularly for systems that exhibit non-ideal behavior and for multi-component systems. Several recent studies have followed the Merchuk approach to determine the binodal curve in their studies [99,100,101,102].

2.3. Liquid Substance (Thermodynamic) Data

The separation of liquid–liquid phases depends on the equilibrium between phases and transport properties. Physical properties having significant impact on transport behavior are interfacial tension, liquid density, and viscosity. These properties impact how the liquid flows and develops, and potential drops coalescence. Therefore, these factors are crucial in determining the performance of liquid–liquid phase separators. Extensive liquid density and viscosity data databases exist in the literature, e.g., the collection of transport properties by Wypych and Flick [103,104]. Estimating density and viscosity is possible [105], but it is best to obtain these values from experimental measurements [106]. Estimating density from the equation of state and viscosity from the molecular theory is achievable by using different correlations such as gas law equation, deviations from ideal-gas law, equation of van der Waals, and other equations. Such ideal-gas law extensions helped develop molecular theory but, more importantly, provided the framework for correlating physical properties of fluid [105]. One common example of an equation of state is the Peng–Robinson equation, which is often used to model the behavior of hydrocarbon mixtures. Given the composition, temperature, and pressure of a fluid, the Peng–Robinson equation can be used to estimate the density of the fluid [107].
Interfacial tension values can be derived from two types of methods. The first type determines interfacial tensions by measuring the shape, contact angle, or volume of a drop suspended in a liquid. These methods include the following:
  • the pendant drop method (a heavy liquid drop is suspended from a vertically mounted capillary tube that is submerged in the light liquid) [108,109];
  • the sessile drop method (a heavy liquid drop rests on a plate that is submerged in the light liquid) [110,111,112];
  • the spinning drop method (one liquid drop is held in suspension within a tube contacting second liquid and rotating) [113].
The sessile drop method is beneficial for measuring interfacial tension in the presence of surfactants or macromolecules. On the other hand, the spinning drop method is ideal for measuring low interfacial tensions [114].
The second method type is based on the adherence of a ring or any other shape to the liquid. Two methods can be distinguished here:
  • the du Noüy’s method (measuring the force required to detach a ring of wire from the liquid interface) [115];
  • the Wilhelmy method (measuring the force required to detach a plate of glass or platinum foil from the liquid interface) [116].
The Wilhelmy plate method is used to measure interfacial tension when surfactants are present, making this method superior to the du Noüy ring method [117]. In the presence of surfactants, the du Noüy ring method is not suitable due to changes in the wetting characteristics of the ring caused by adsorption of surfactant molecules. As a result, the contact angles on the inside and outside of the ring may differ [118,119].
An approximate interfacial tension value can be obtained based on the maximum drop size that can maintain its shape in a quiescent dispersion without any agitation. The drop size can be determined by examining a photograph of the dispersion under these terms. Using this approach, the balance between interfacial tension and buoyancy forces can be used to approximate the interfacial tension [75]:
σ~dmax2Δρg,
where dmax is the maximum drop diameter.
Antonov’s rule [120] can also be utilized to estimate the surface tension as it suggests that the interfacial tension between two liquids is roughly equivalent to the difference in their liquid–air surface tensions measured under the same conditions [121].

2.4. Liquid–Liquid Mixture Fundamentals

Emulsion refers to a type of dispersed systems comprising two immiscible liquids, where drops of one liquid (known as the dispersed phase) are spread evenly throughout another liquid (known as the continuous phase) [122]. Droplets can re-coalesce, resulting in simultaneous drop breakup and coalescence processes during emulsion formation [123]. The typical design of liquid–liquid separation devices aims to produce suspended drops of one liquid within the other liquid, rather than creating liquid films. Holdup (or the volume fraction of the dispersed phase) within the device is defined as
ϕd = Vd/Vf,
where Vd is the volume of the dispersed phase, and Vf is the total fluid volume. The total fluid volume in the device is the volume that remains after deducting the volume of any internal components, such as trays, packing, or impellers. The Sauter mean diameter d32 refers to an average diameter based on the ratio of volume to surface area:
d 32 = i = 1 n N i d i 3 i = 1 n N i d i 2 ,
where Ni is the amount of drops with diameter di. The Sauter mean diameter is directly related to holdup and interfacial area (spherical shape is assumed). Therefore, it is often used to characterize liquid–liquid and gas–liquid dispersions [124]. It can be estimated from the total dispersed volume divided by the total interfacial area [125]:
d32 = 6εϕd/a,
where a refers to interfacial area per unit volume, while ε refers to the void fraction within the device, i.e., the fraction of internal volume (not considering any packing, trays, etc.).

Dispersed Phase

It is essential to identify the dispersed phase and the continuous phase to predict the drop size. Selker and Sleicher [126] proposed a set of guidelines that employ volume rations, density, and viscosity to predict the dispersed phase. An expression to determine the dispersed phase is given by [127]:
Χ = (QL/QH)[(ρLµH)/(ρHµL)]0.3,
The volume is denoted by Q, while phase properties density and viscosity are ρ and μ. L and H represent the light and heavy phases, respectively. The light phase is dispersed if χ < 0.3. The light phase is likely to be dispersed for χ = 0.3–0.5, while both phases can be dispersed for χ = 0.5–2, and phase inversion can occur. The heavy phase is likely to be dispersed for χ = 2–3.3 while the heavy phase will be dispersed for χ > 3.3. For cases where either phase could be dispersed, the added phase is usually dispersed. Phase inversion can be triggered by changes in concentrations, temperature, and physical properties [127].
Liquid–liquid dispersions involve one phase being dispersed as droplets into the other phase. The varying sizes of the dispersed droplets can have varying impacts on the performance of the equipment being used. A narrow droplet size distribution is preferred to ensure optimal dispersion performance [128]. Compared to gas–liquid systems, the drop settling for liquid–liquid systems is slower. This is caused by the continuous phase in liquid–liquid systems being much denser and more viscous [129]. The maximum drop size is determined primarily by the balance between buoyancy and interfacial tension forces acting on the flow. In static devices, disregarding viscosity effects (assuming low viscosity of the dispersed phase), the maximum drop size is directly proportional to the square root of the interfacial tension (σ) divided by the difference in density (∆ρ) [130]:
dmax = c1(σ/Δρg)0.5,
The constant c1 is approximately 1 [130]. Equation (11) does not indicate the Sauter mean diameter but the maximum stable drop diameter. However, these two diameters are proportionally related, and their values can be close [75,131,132]. The equilibrium between drop breakage and coalescence rates determines the drop size in agitated devices [133]. Breakage occurs due to turbulent stresses caused by the agitator, while coalescence occurs when drops collide with each other [133,134]. The maximum drop size in an agitated liquid–liquid dispersion was investigated by Kolmogorov [135,136] and Hinze [134], who developed the following expression:
dmax = c2(σ/ρ)3/5ϵ2/5,
where ϵ is the turbulent energy dissipation rate and the constant c2 is approximately 0.7 [134,137]. Equation (12) assumes low dispersed-phase holdup and neglects viscous forces and breakage, which is a valid assumption for water and typical low-viscous and moderate-viscous organic solvents [75,134]. Wang and Calabrese [138] investigated the effects of viscous resistance on droplet breakage and identified interfacial tension and dispersed-phase viscosity as influencing parameters.
A general equation for the maximum drop size in agitated liquid–liquid dispersion is given by [139]:
dmax/Di = We−3/5,
where We is the Weber number (ratio of inertia to surface tension) [140], and Di is a characteristic diameter. For applications using rotating impellers, Di is the impeller diameter, and the appropriate Weber number is We = ρωi2Di3/σ, where ωi is the impeller speed (in rotations per second) [136]. For static mixers, Di = Dsm and We = ρvsm2Dsm/σ, where Dsm is the static mixer pipe diameter, and vsm is the superficial liquid velocity (inlet velocity).

2.5. Shake Test

The dimension of dispersed drops can influence separator selection and design. Prediction of drop diameter is difficult, especially when drops are tiny or sampling is challenging. Moreover, knowing the drop size does not give any information about drop coalescence. As a workaround, the feed can be classified based on the simple shake test [75]. The feed classification can be used to identify suitable separator types. The shake test is performed by hand-shaking the feed in a closed cylinder of around 2.5 cm diameter for 30–60 s. In systems where drops merge rapidly, a sharp boundary emerges between two settling liquid layers [75]. The movement of drops, toward or away from the boundary, will dictate how quickly the layers undergo phase separation. In many other systems, droplets gather at the boundary and create a dispersion band—a stratum of drops that coalesce at a slow pace. In these cases, the phase separation speed is determined by how rapidly the droplets merge. Table 1 classifies feed materials into four categories based on the shake test results [75]. In addition, common data of interfacial tension, density difference, and viscosity also are provided.

3. Liquid–Liquid Phase Separation Equipment

3.1. Gravity Decanters (Settlers)

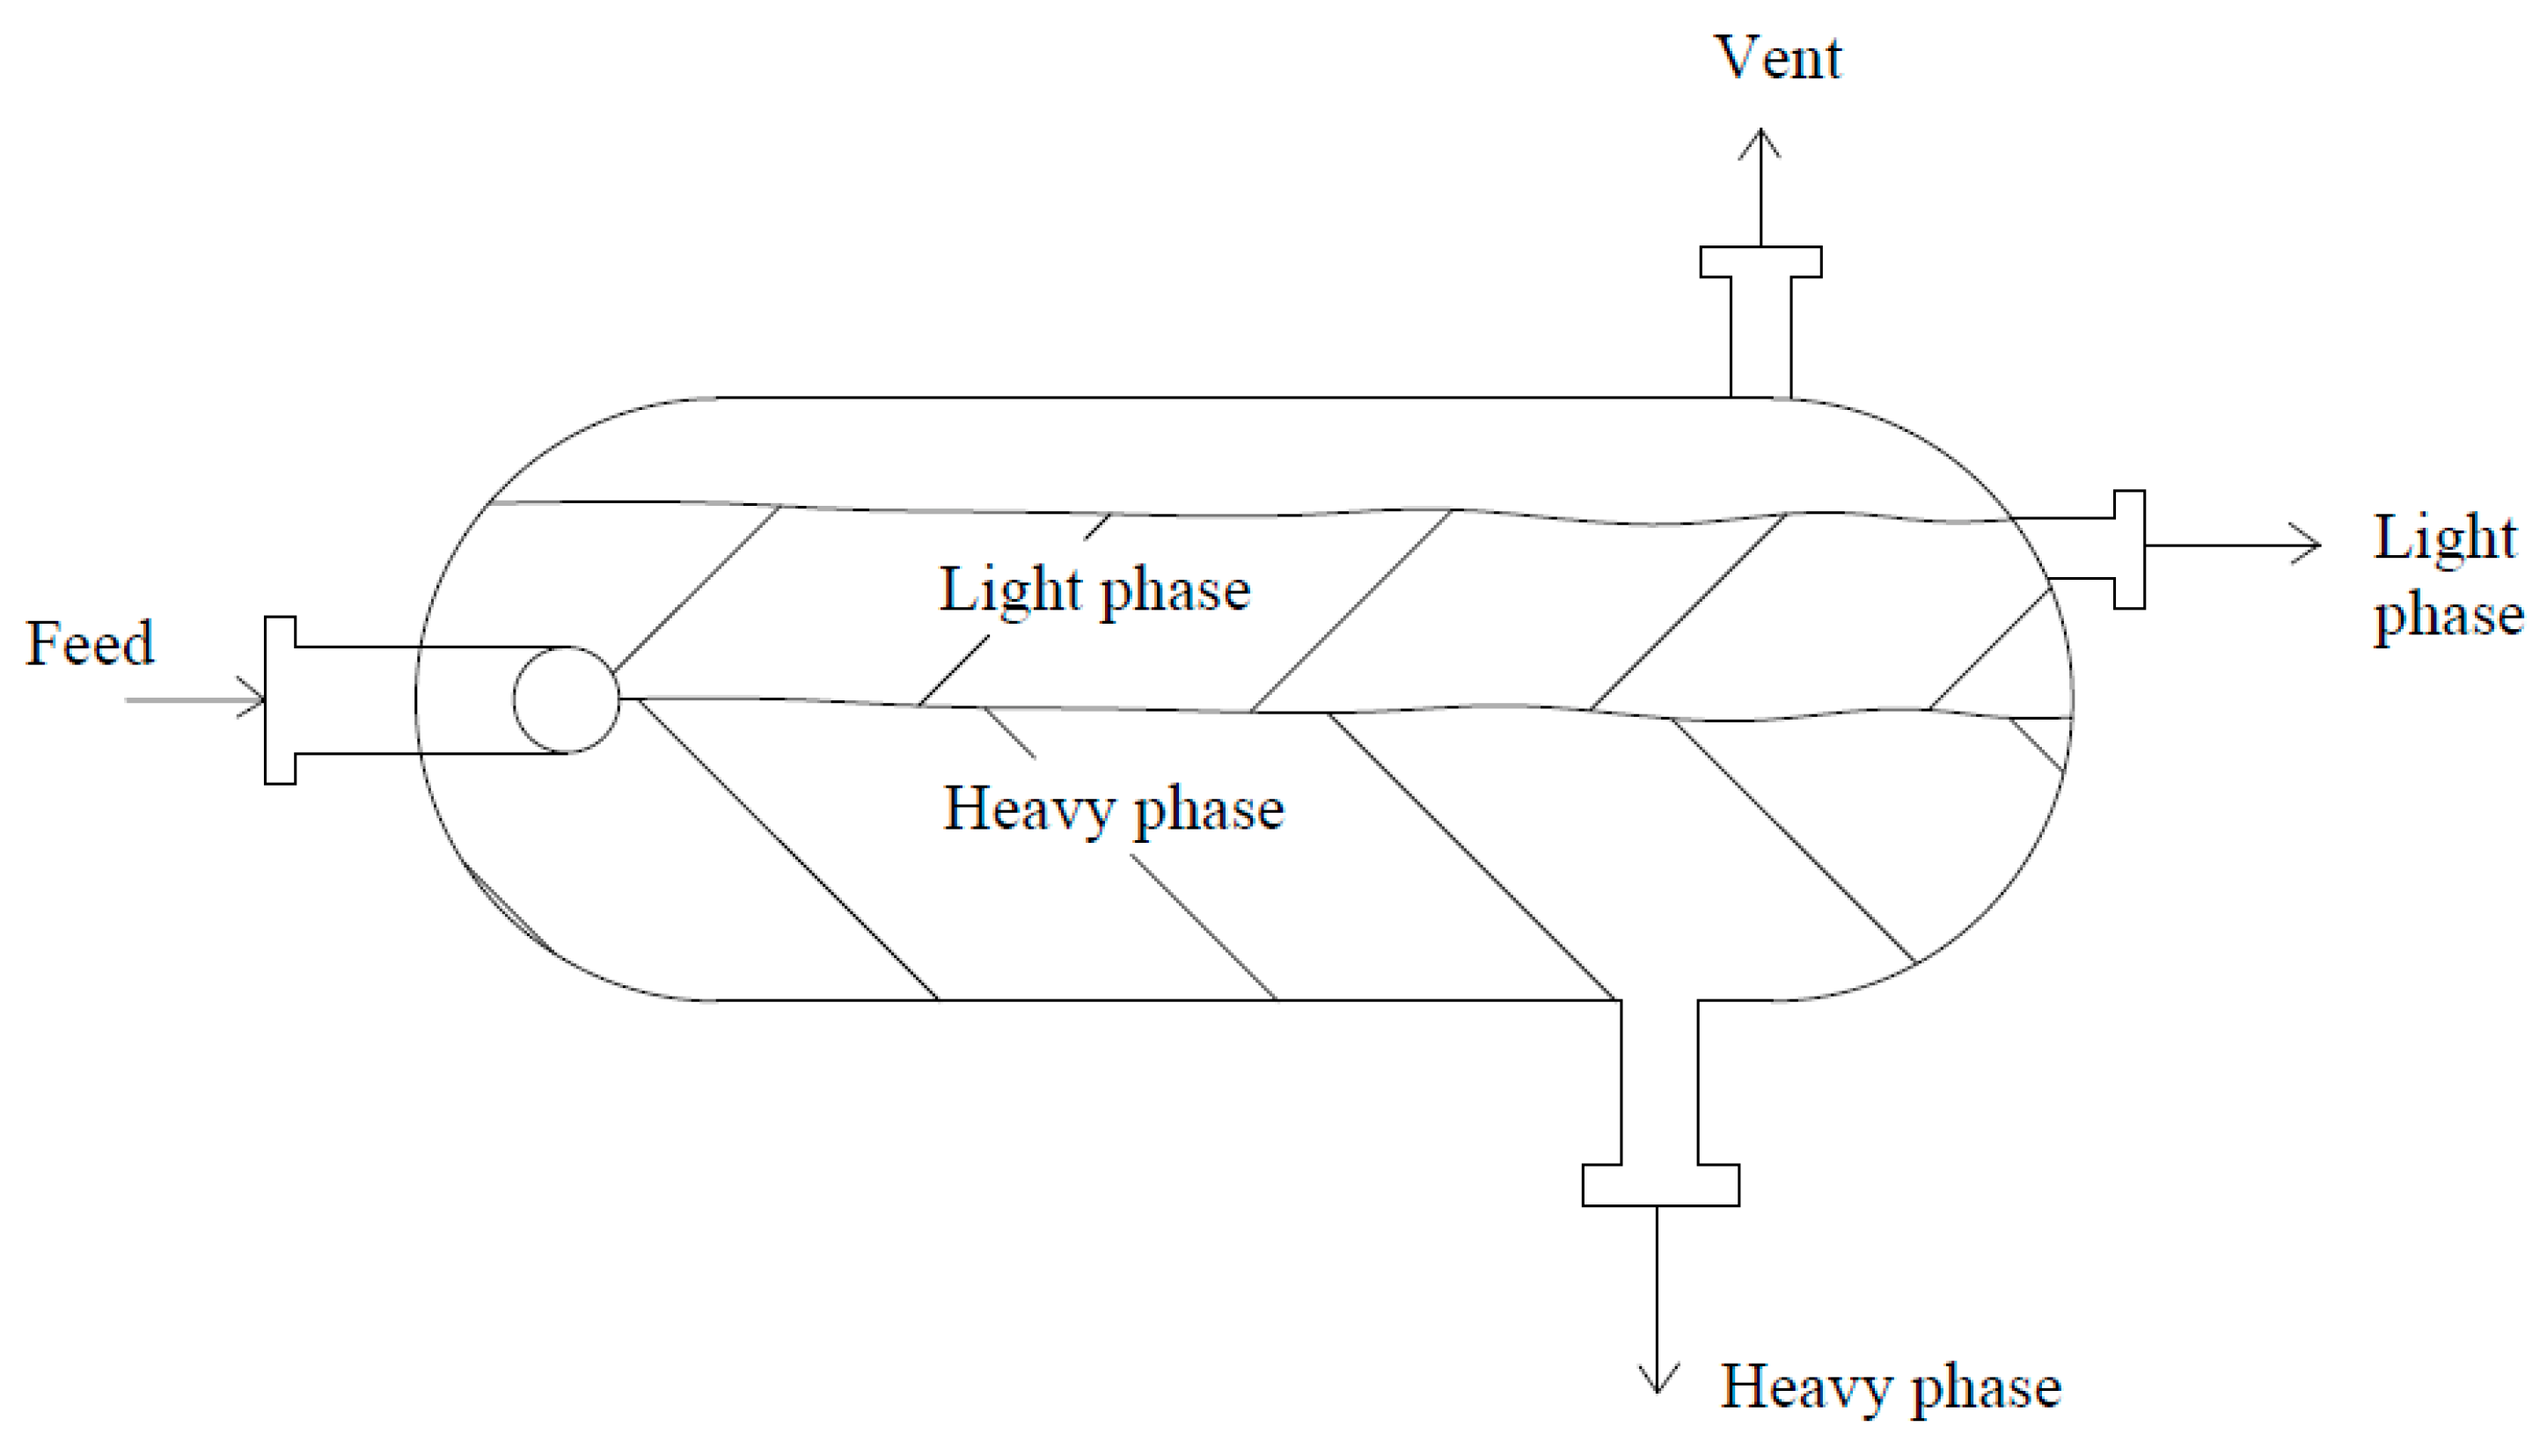
Gravity decanters (also known as settlers) are vessels where two phases settle into separate layers over time [30]. Figure 2 indicates the operating principle of decanters. The liquid mixture enters at one end of the vessel (feed) and separates into layers based on density difference between phases. The denser phase settles down faster under the influence of gravity, while lighter phase rises to the top. The separated phases are discharged through respective outlets at the other end of the vessel. The outlets and the top of the vessel are vented to the atmosphere. Based on the shake test characterizations (see Table 1), gravity decanters are appropriate for handling type I and the majority of type II systems. Coalescence is a limiting factor for mixtures of type II; therefore, the configuration and size of decanters can be different than the fast coalescing type I systems.
The typical length-to-diameter ratio for horizontal gravity decanters is greater than 2 [28]. The cross-sectional area (phase boundary between the two settled layers) is maximized with this ratio. This makes the horizontal decanter more effective compared to the vertical design. However, vertical decanters are more practical for low-flow rate applications and space limitations.

3.1.1. Stokes’ Law Design Method

Stokes’ method relies on the assumption that the coalescence rate of drops is fast, and it requires knowledge of the drop size. The drop settling velocity based on Stokes’ law [127,141] is as follows:
ut = gd2Δρ/18µ,
where d is a characteristic minimum drop diameter; g is gravitational acceleration; ∆ρ is the density difference between the drop and fluid; and μ is the dynamic viscosity of the fluid. Only the continuous phase viscosity is used in Equation (14). Therefore, defining which phase is dispersed and continuous is essential. According to [141], the settling velocity from Equation (14) is related to small Reynolds numbers (Re < 0.5) where the Reynolds number is given by
Re = utdρ/µ,
Stoke’s law calculations are not reliable for designing systems with slow coalescence. Jeelani and Hartland [142] recommended the following expression for the decanter performance:
1/(Q/A) = 1/(k1ΔH) + 1/(k2),
where ΔH is an average steady-state dispersion band height; Q is total volumetric throughput; and k1 and k2 are empirical constants [142].

3.1.2. Vented Decanters

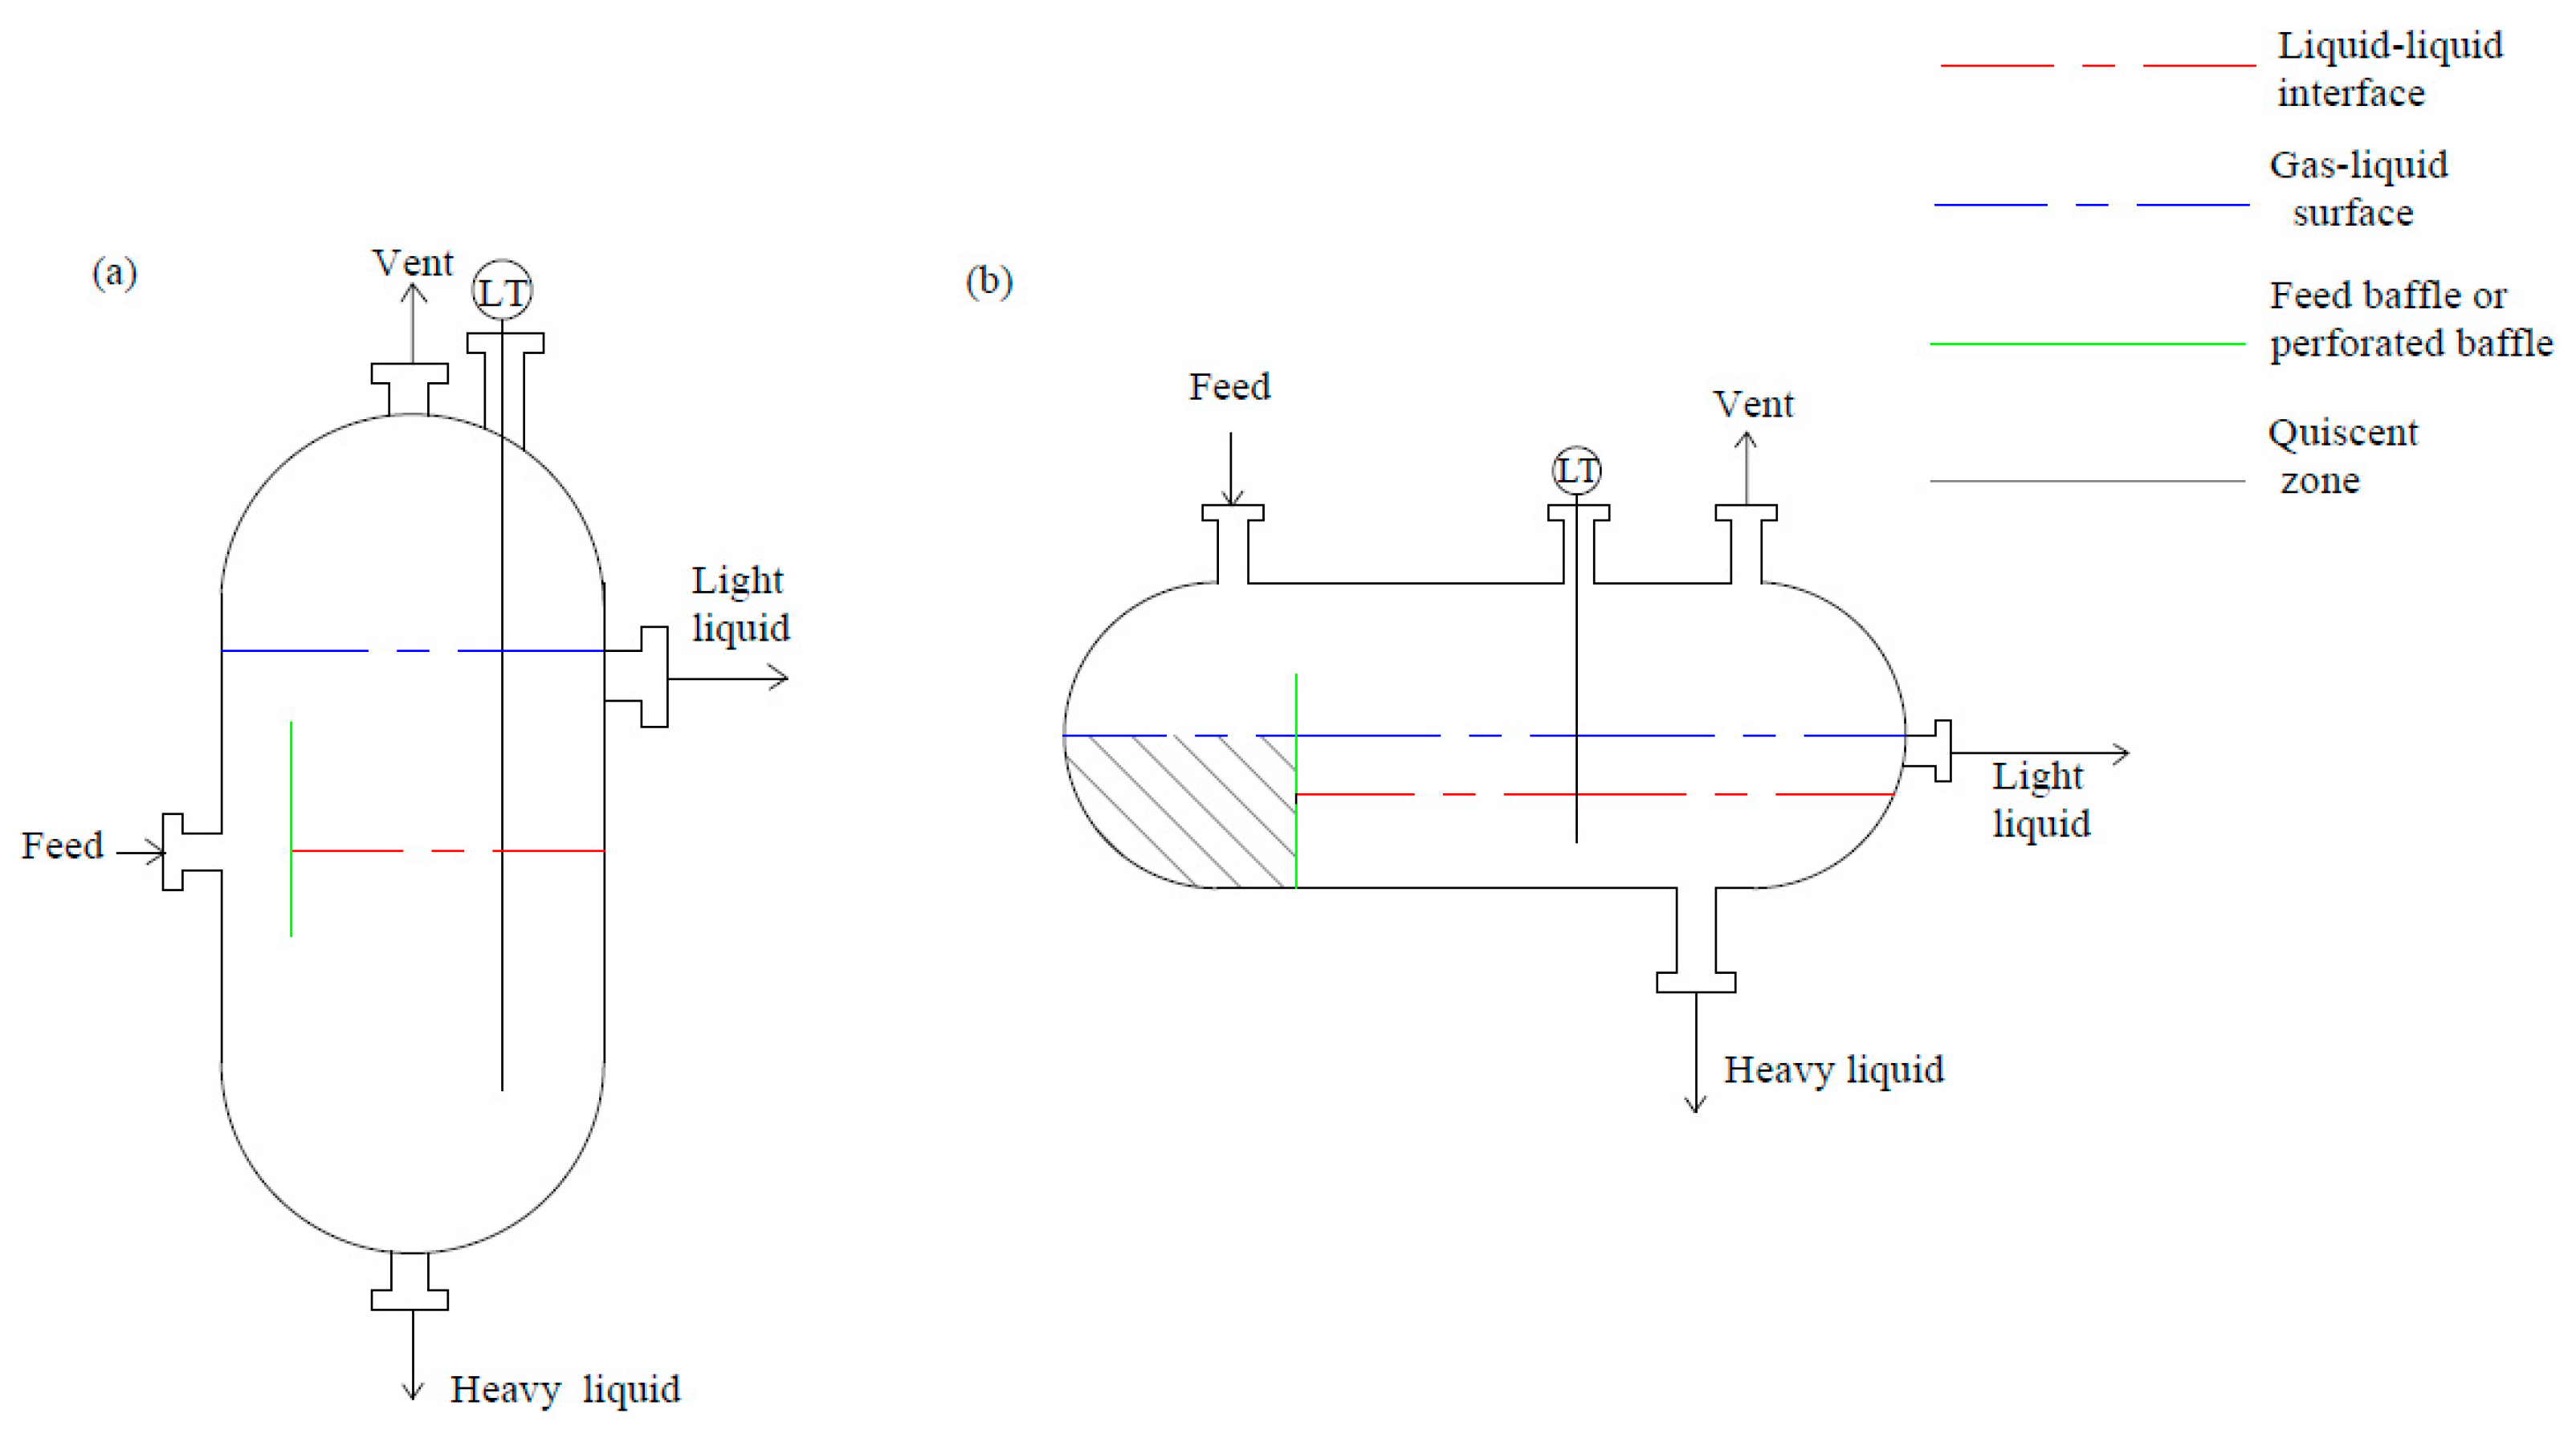
Venting supplies to the decanter have to be included for systems containing gases or vapors. Gases or vapors can occur during azeotropic distillation in vacuum where condensation occurs or during the decanting of liquids from extractors operated at high pressure. Figure 3a shows a typical design for vented decanters. The liquid feed is introduced into the decanter at a level below the liquid surface. Gases have to flow through the liquid before reaching the vapor headspace.
Figure 3b shows an alternative decanter design where the feed is introduced from the top of the vessel in the vapor headspace. Adding a perforated baffle provides a quiescent zone below the top feed nozzle. This baffle separates disturbances caused by the feed stream and a calm separation zone where the two liquid phases can coalesce and disengage before being drawn off.

3.1.3. Coalescing Internals

Decanter performance can be improved by adding coalescing internals. Coalescing internals promote the growth of drops and reduce the length that drops need to rise/fall to a coalescing surface [143,144]. Consequently, the size of decanter handling dispersions with slow coalescence (e.g., type II from Table 1) can be reduced when using internals. Coalescing internals can be wire meshes, knitted wires or fibers, and flat or corrugated plates [29].

3.2. Coalescers

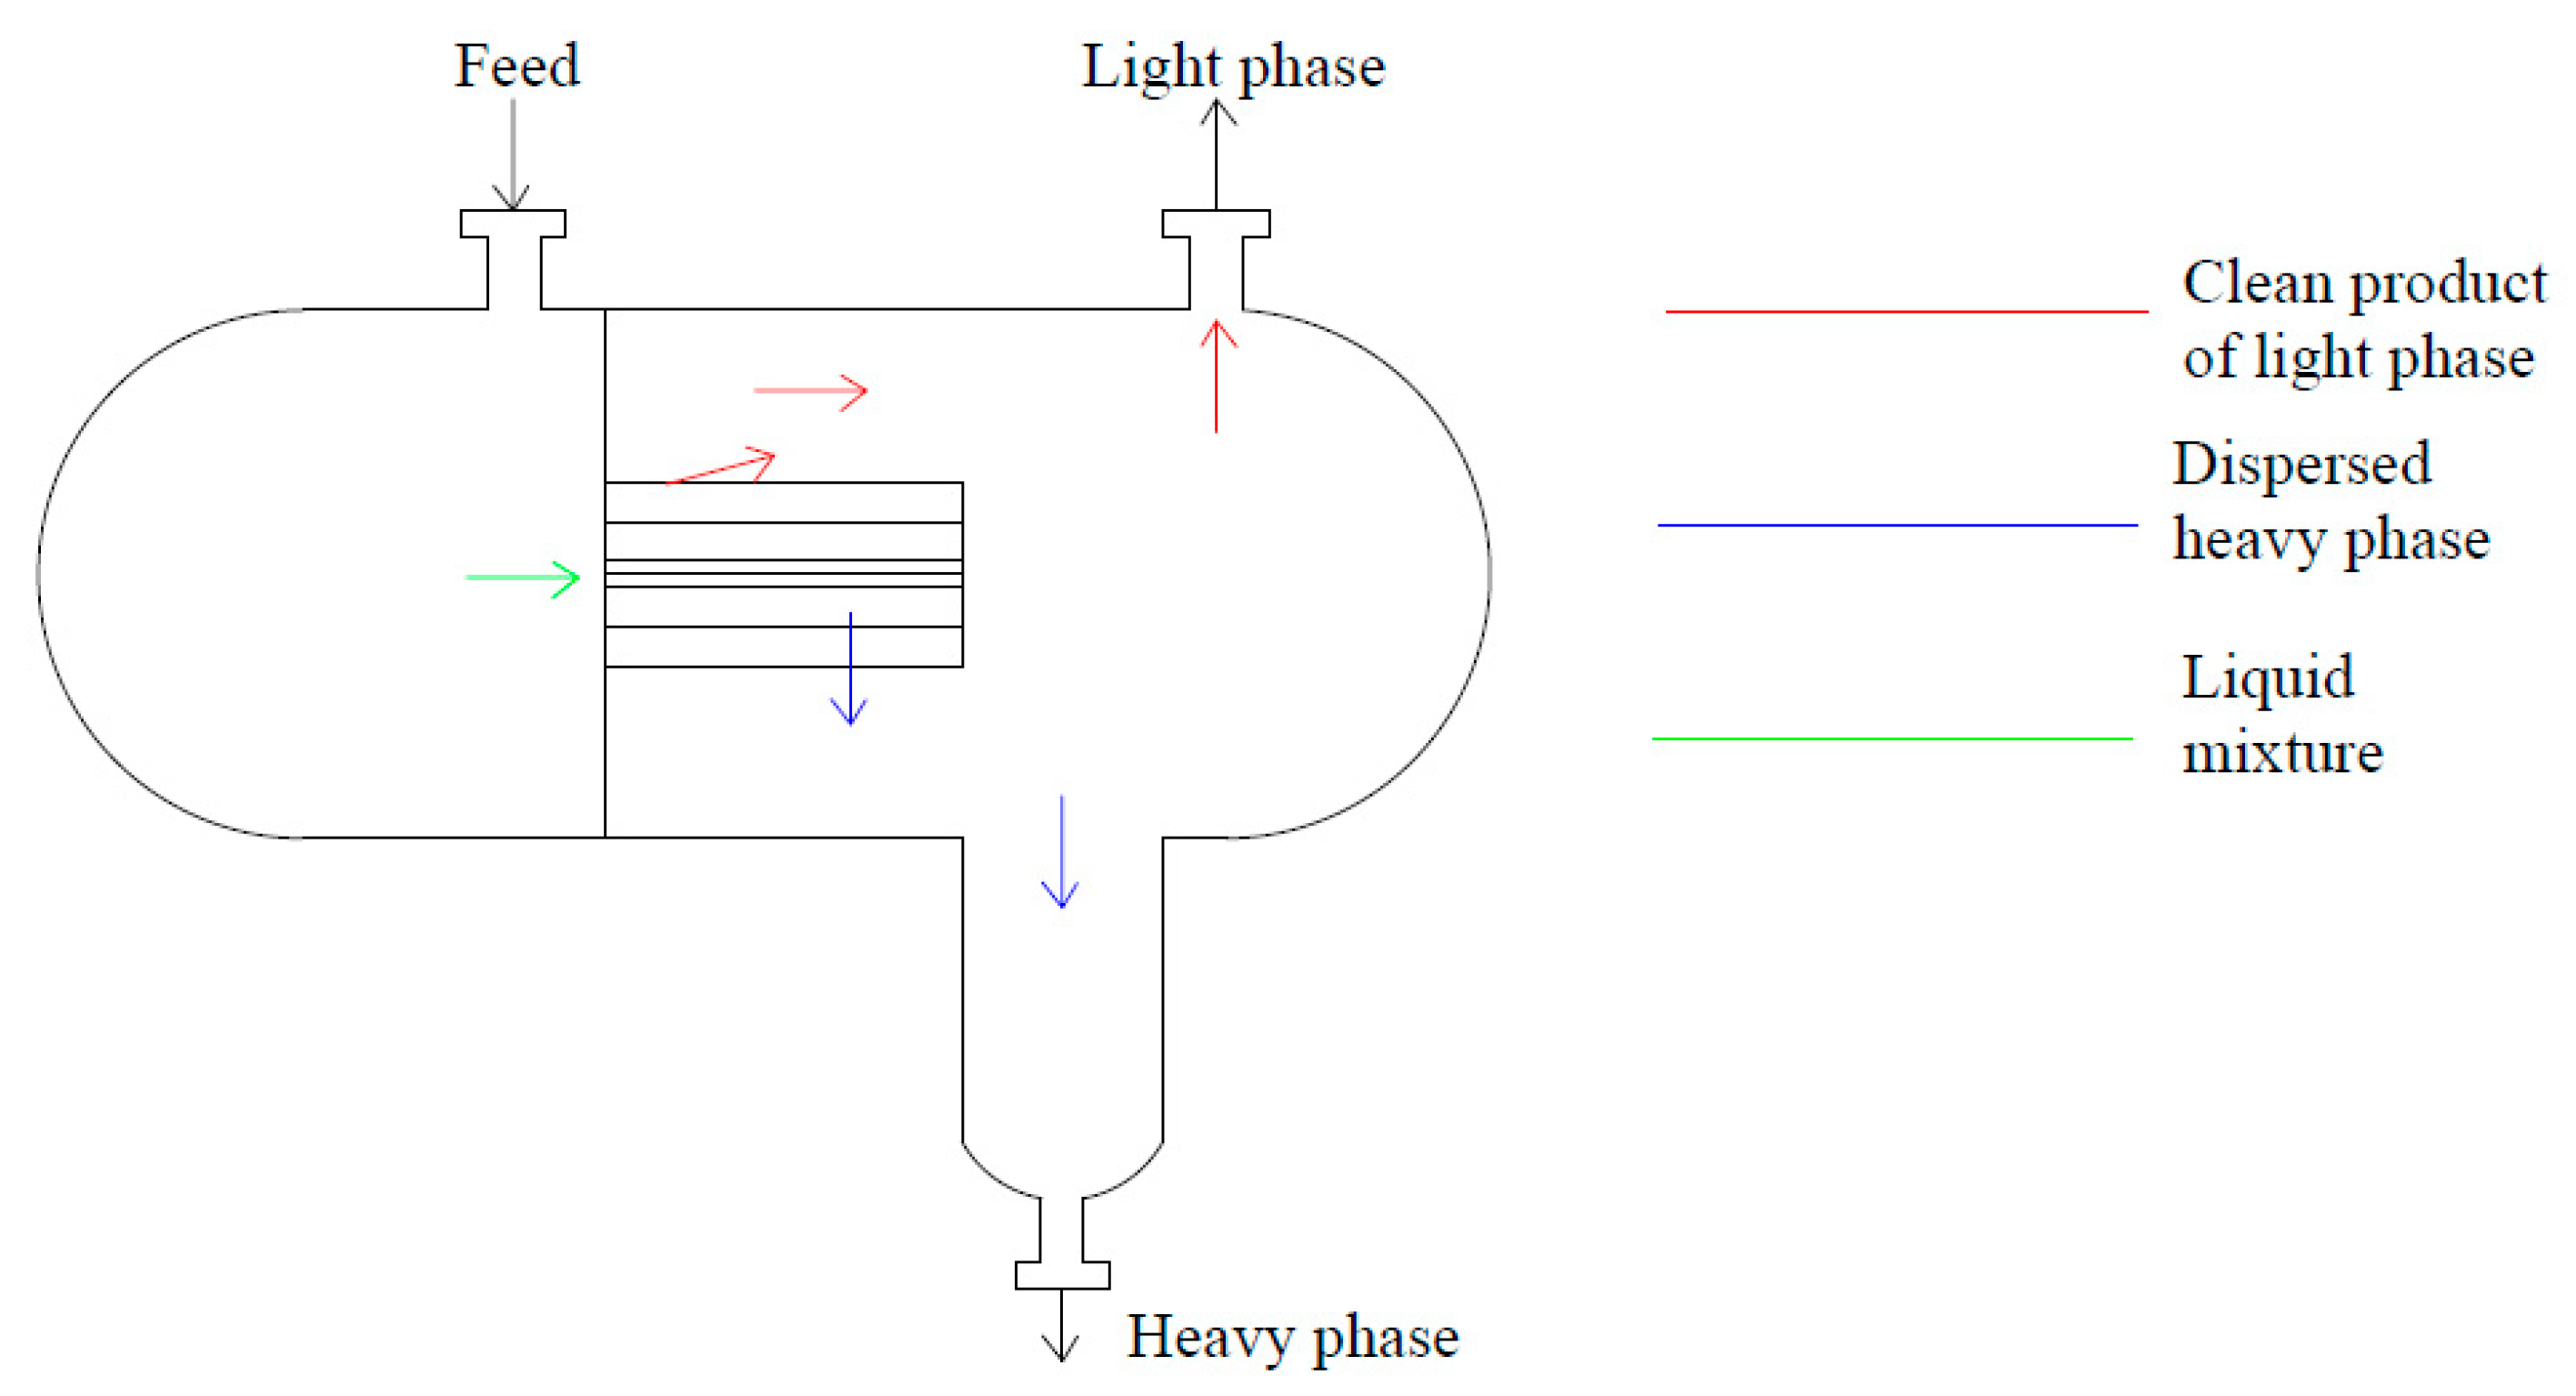
Coalescing internals can be applied to pre-treat decanter feeds in separate coalescer vessels [33,34]. Coalescers are particularly used for type III and IV systems (see Table 1). Benefits of coalescing internals are improved separation efficiency, reduced operating costs, and increased throughput. The configuration of coalescers depends on the dispersed phase. For the light phase being dispersed, the configuration is upflow, and for the heavy phase being dispersed, the configuration is downflow. Coalescers are typically packed with granular materials, metal wire meshes, polymer filaments (or both), or fine fibers in woven or nonwoven composite sheets [29]. Coalescers can tolerate feeds containing fine solids if granules or wire meshes are used. The feed should be free of solids for coalescers containing fine granules or fibers to avoid potential requirement for pre-filtration [31,32,145,146]. A standard design for a coalescer is given in Figure 4. The liquid mixture enters at one end of the vessel (feed). Then, liquids flow (1) through the coalescer elements inside the vessel, separate, and discharge at respective outlets: (2) clean product of light phase, and (3) dispersed heavy phase. Generally, the best coalescer performance is achieved when the dispersed phase wets the packing material. [29].
An essential criterion in the design of coalescers is the pressure drop, which depends on particle size and shape, bed height or filter thickness, and throughput. For near spherical particles, assuming incompressible fluid, the pressure drop due to frictional losses can be estimated from the Ergun equation [147,148]:
ΔP/L = [150(1−φ)2µvsv/(dm2φ3)] + [1.75ρvsv2/dmφ3]; Reparticle = vsvρdm/µ ≤ 10,
where L is the length of the packed section; vsv is the superficial velocity of the total liquid flow; dm is effective particle diameter (given by six times the mean ratio of particle volume to particle surface area); and φ is the volume fraction of voids (flow channels) within the bed [147]. The minimum value of φ for a tightly ordered bed of uniform spherical particles is 0.26 [75]. This varies depending on the particle size distribution and particle shape for real media.

3.3. Centrifugal Separators

Centrifugal force can impact the separation of phases significantly. Unlike gravity being constant, centrifugal force can be varied either by the rotational speed or equipment dimensions. Devices for performing centrifugal separation are cyclone separators for gas–gas and gas–solid separation, hydrocyclones for liquid–solid and liquid–liquid separation, and centrifuges for liquid–solid, liquid–liquid, and gas–gas separation [35,37]. Centrifugal devices are beneficial in the following instances [35]:
  • the difference in density between the phases is small;
  • immediate contact is needed to prevent degradation;
  • feed and solvent emulsify easily;
  • specific required throughput due to capacity restrictions.
Centrifugal devices can achieve high throughput at low liquid residence times [35]. Residence time is given by the holdup volume of the feed phase divided by the volumetric feed rate, t = Vt/V. Centrifugal separators allow feed rate and rotational speed adjustments, making them flexible and beneficial for operation. However, these devices have some potential disadvantages:
  • maintaining high-speed rotating machinery—even though the high acceleration in operation makes a good performance, in some cases, this can promote back-mixing or emulsification;
  • presence of solids—some of these devices are designed to handle feeds containing solids, such as whole fermentation broth. However, if solids are present in the feed, there is a potential for plugging, e.g., in separators with close internal clearances.

3.3.1. Centrifugal Force

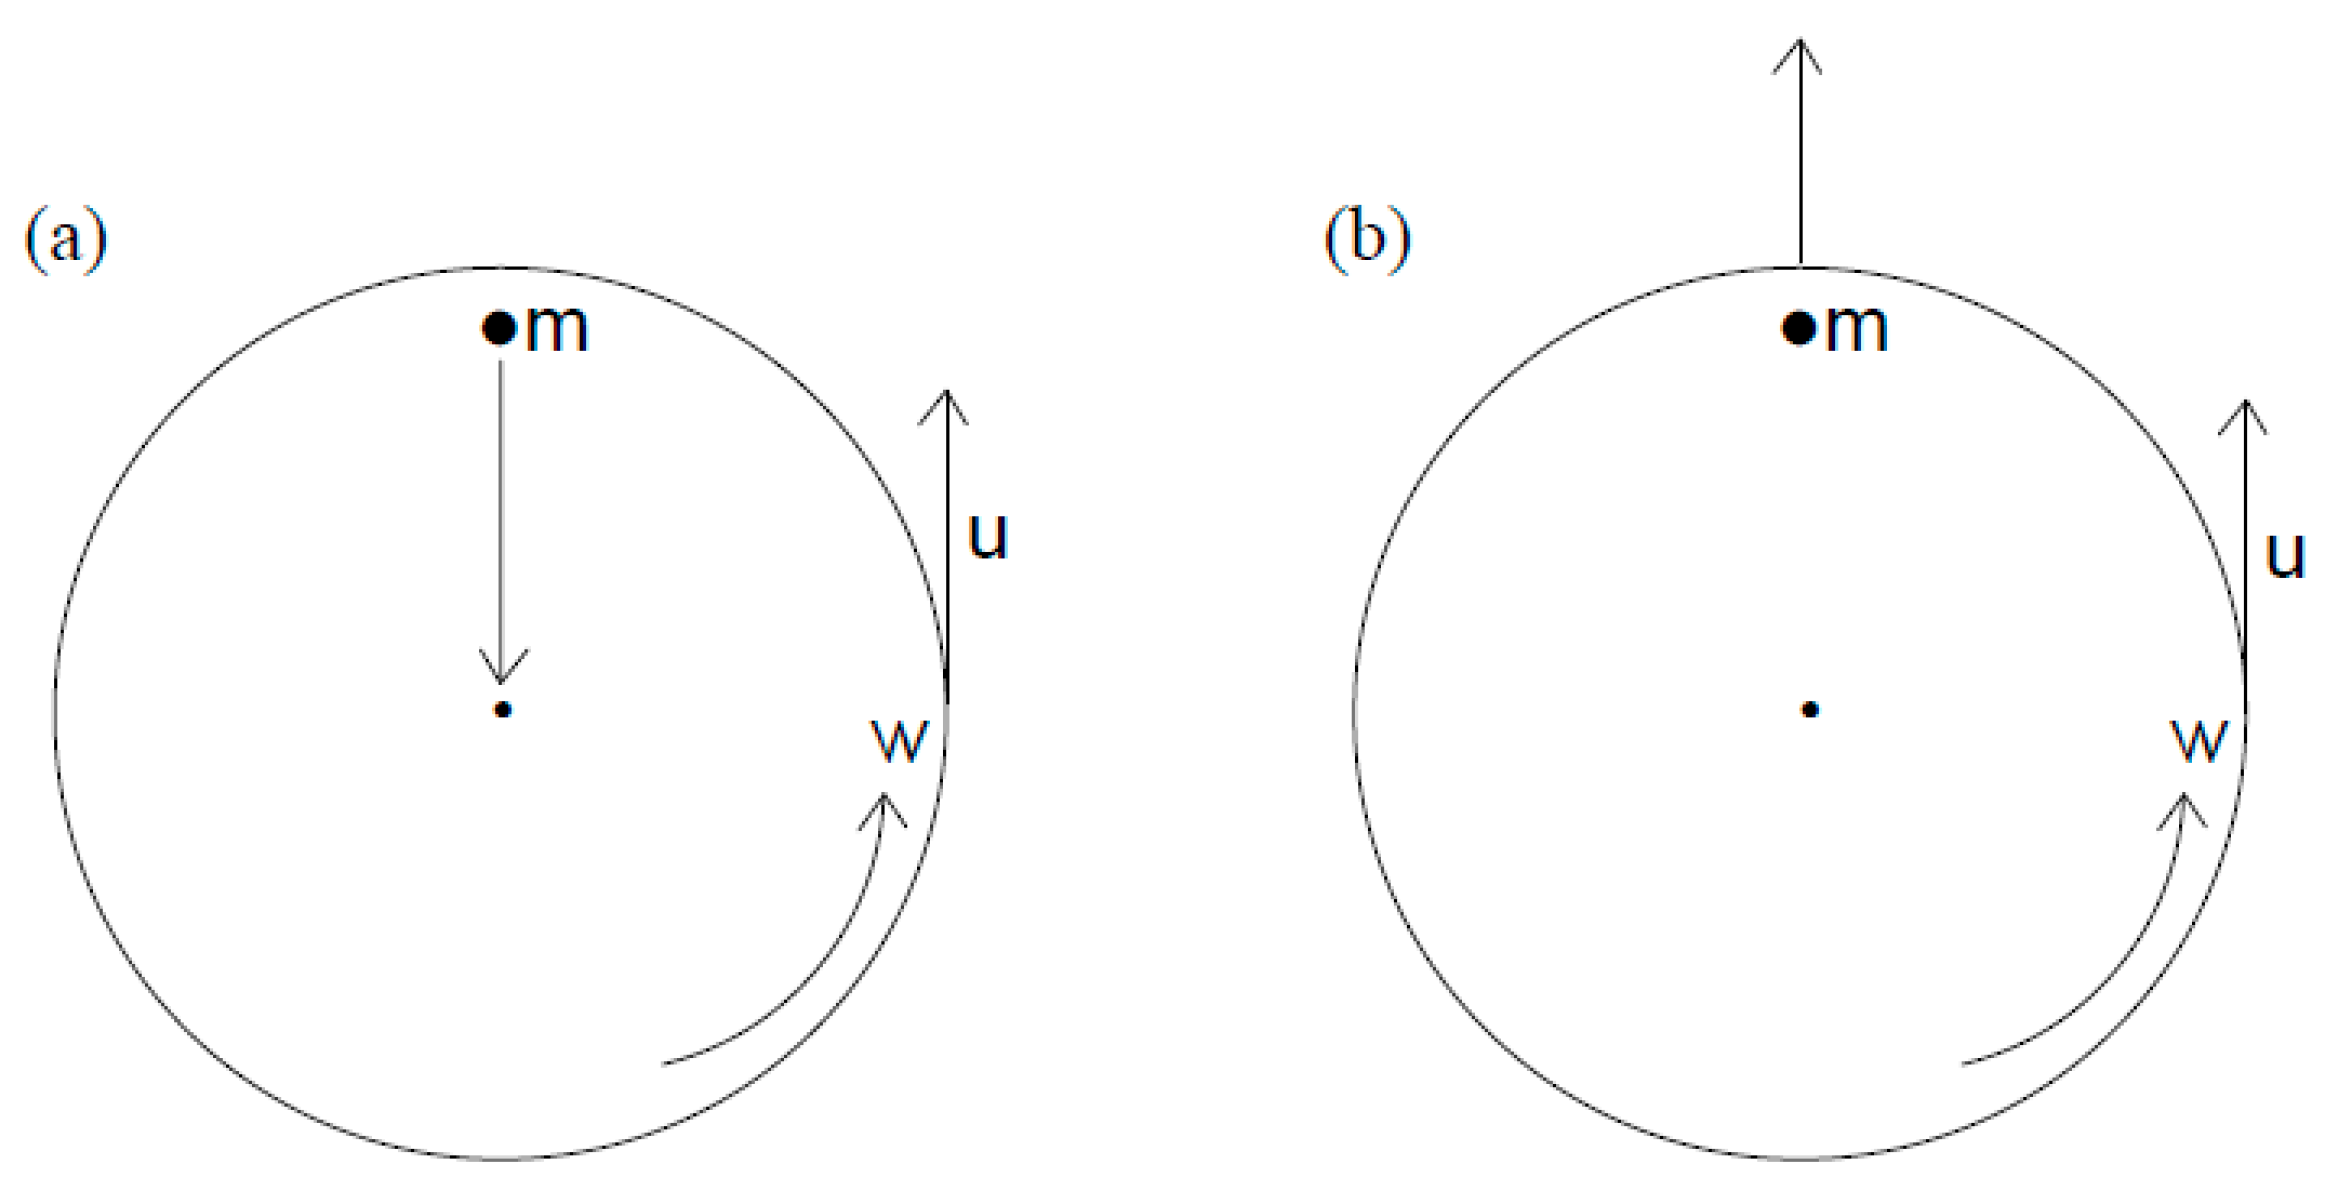
Rotating objects undergo centripetal and centrifugal forces. Figure 5 illustrates the action of these forces. While the centripetal force keeps an object moving in a circle and is pointed toward the circle center, the centrifugal force is an outward force on an object moving in a circle.
The centrifugal force Fc is given by
Fc = mω2r,
where m is the mass; r is the distance from the origin of a frame of reference; and ω is the angular velocity.
The centripetal force Fcp is given by
Fcp = mu2/r,
where u is the tangential velocity.
In centrifuges, gravity can be neglected because centrifugal force is significantly higher than gravity [36].

3.3.2. Centrifuges

Centrifuges are devices used to separate liquids with small density differences. They can handle high throughputs, e.g., up to 100 m3/h. Centrifuges can also break almost any emulsion [29] and are suitable for type III and type IV systems (see Table 1). When centrifuges are stationary, the free liquid surface is horizontal, and the liquids (and possible particles) settle due to gravity. Once the rotation starts, the suspension is subjected to gravity and centrifugal force, resulting in the suspension taking the position of the axe of rotation (vertical or horizontal free liquid surface). The suspension can consist of several components having different densities. In this case, the lightest component will stratify nearest to the rotation axis and the heaviest farthest to the rotation axis [35]. Common types of centrifuges are bowl (tubular bowl) or disk (disk bowl) centrifuges [29].
The working principle of centrifuges is always the same. The liquid mixture is introduced to the centrifuge bowl, where centrifugal force is created through the drive mechanism rotating the centrifuge bowl or centrifuge internals. As a result of centrifugal force (rotation), phases are being separated and discharged. The phases are separated as follows: the lighter phase is close to the rotation axe where the centrifugal force is lowest, and the heavier phase is close to the centrifuge wall where the centrifugal force is the highest.
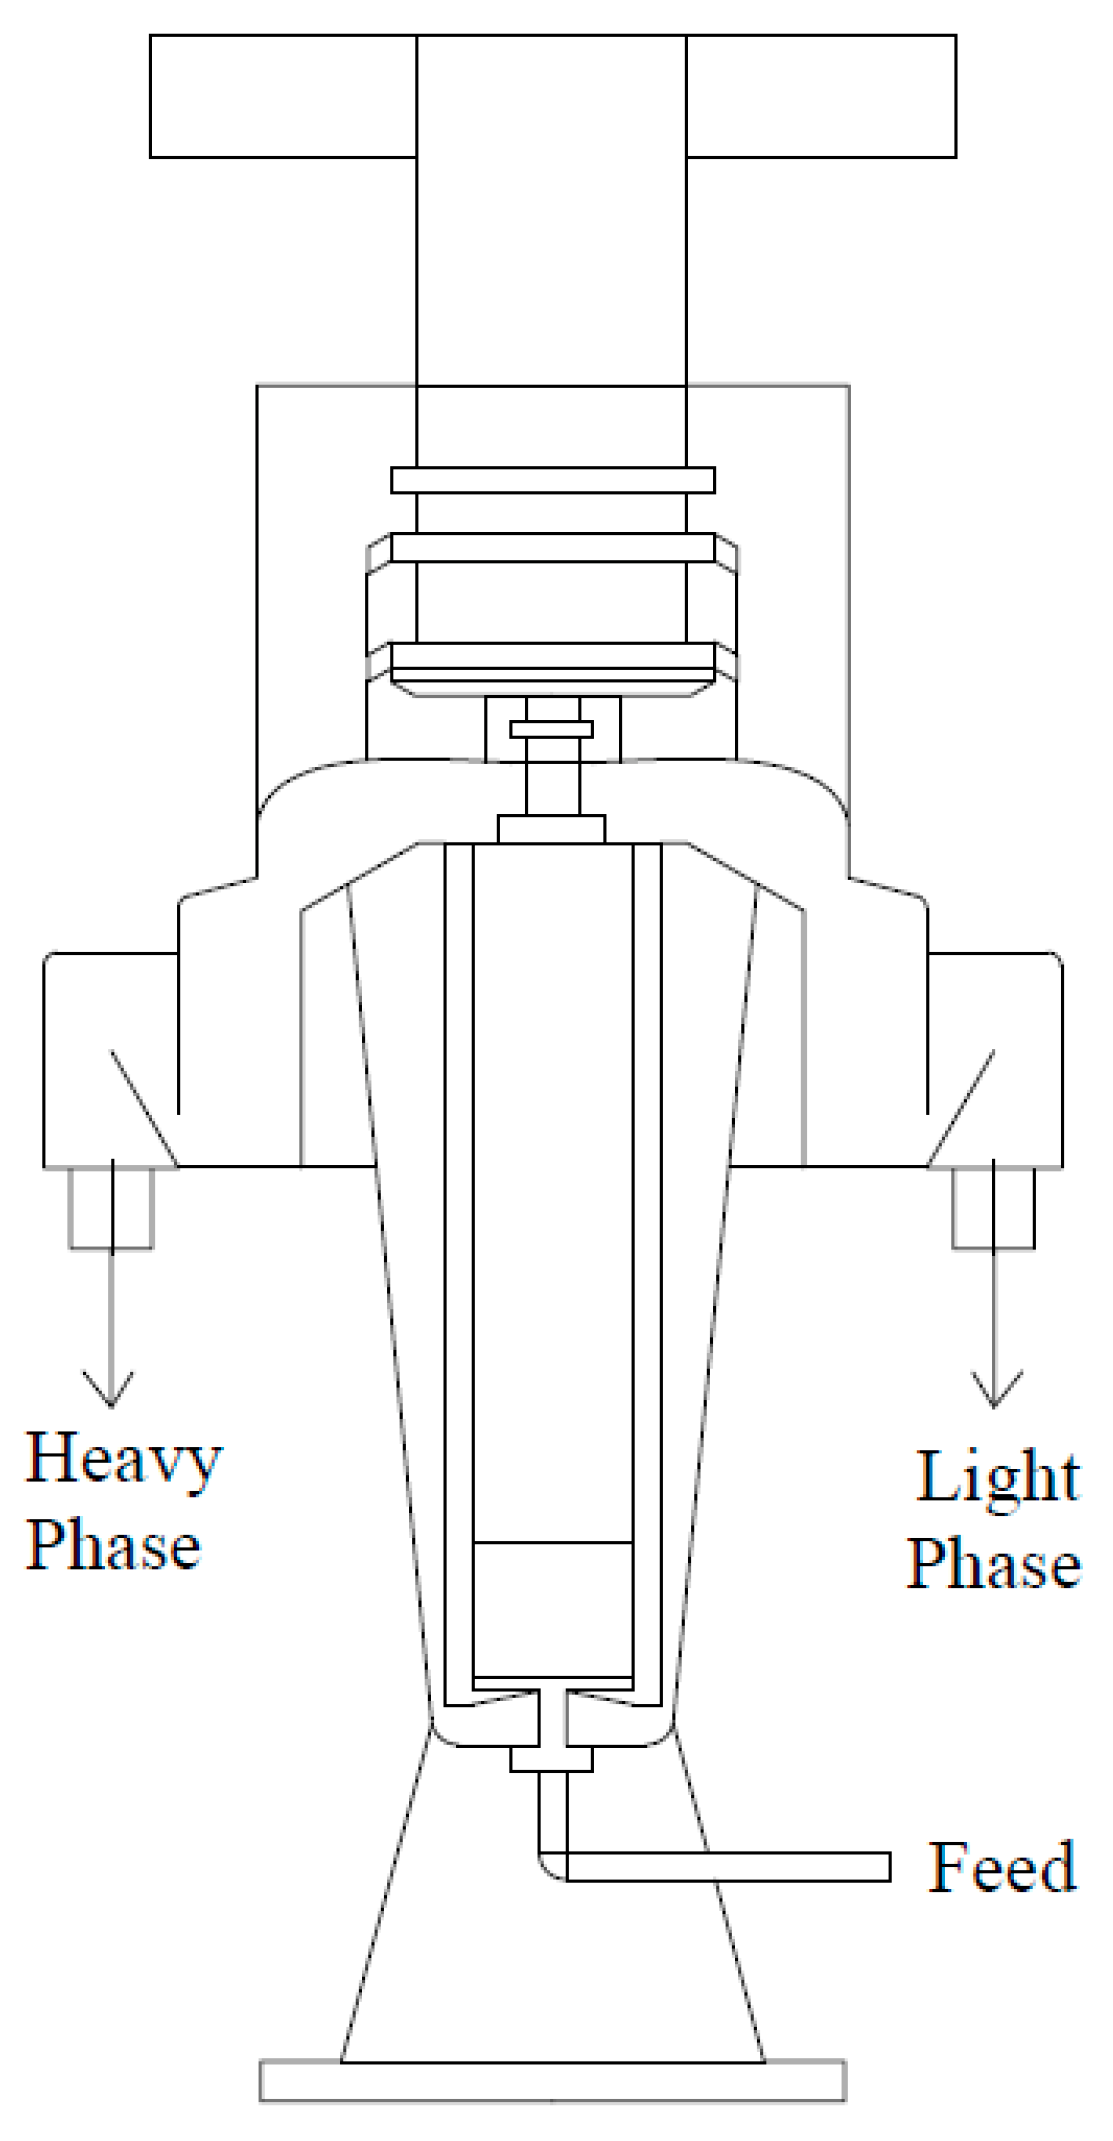
Figure 6 shows a schematic tubular bowl. Tubular bowls are high-speed, vertical centrifuges to separate immiscible liquids, such as water and oil (and fine solids). The bowl is typically rotated at around 15,000 rpm (250 Hz), and the generated centrifugal force exceeds 130,000 N [29]. The tubular bowl is designed for low capacities, 0.19 to 1.9 m3/h (50 to 500 gph), and can handle only low solid concentrations [35].
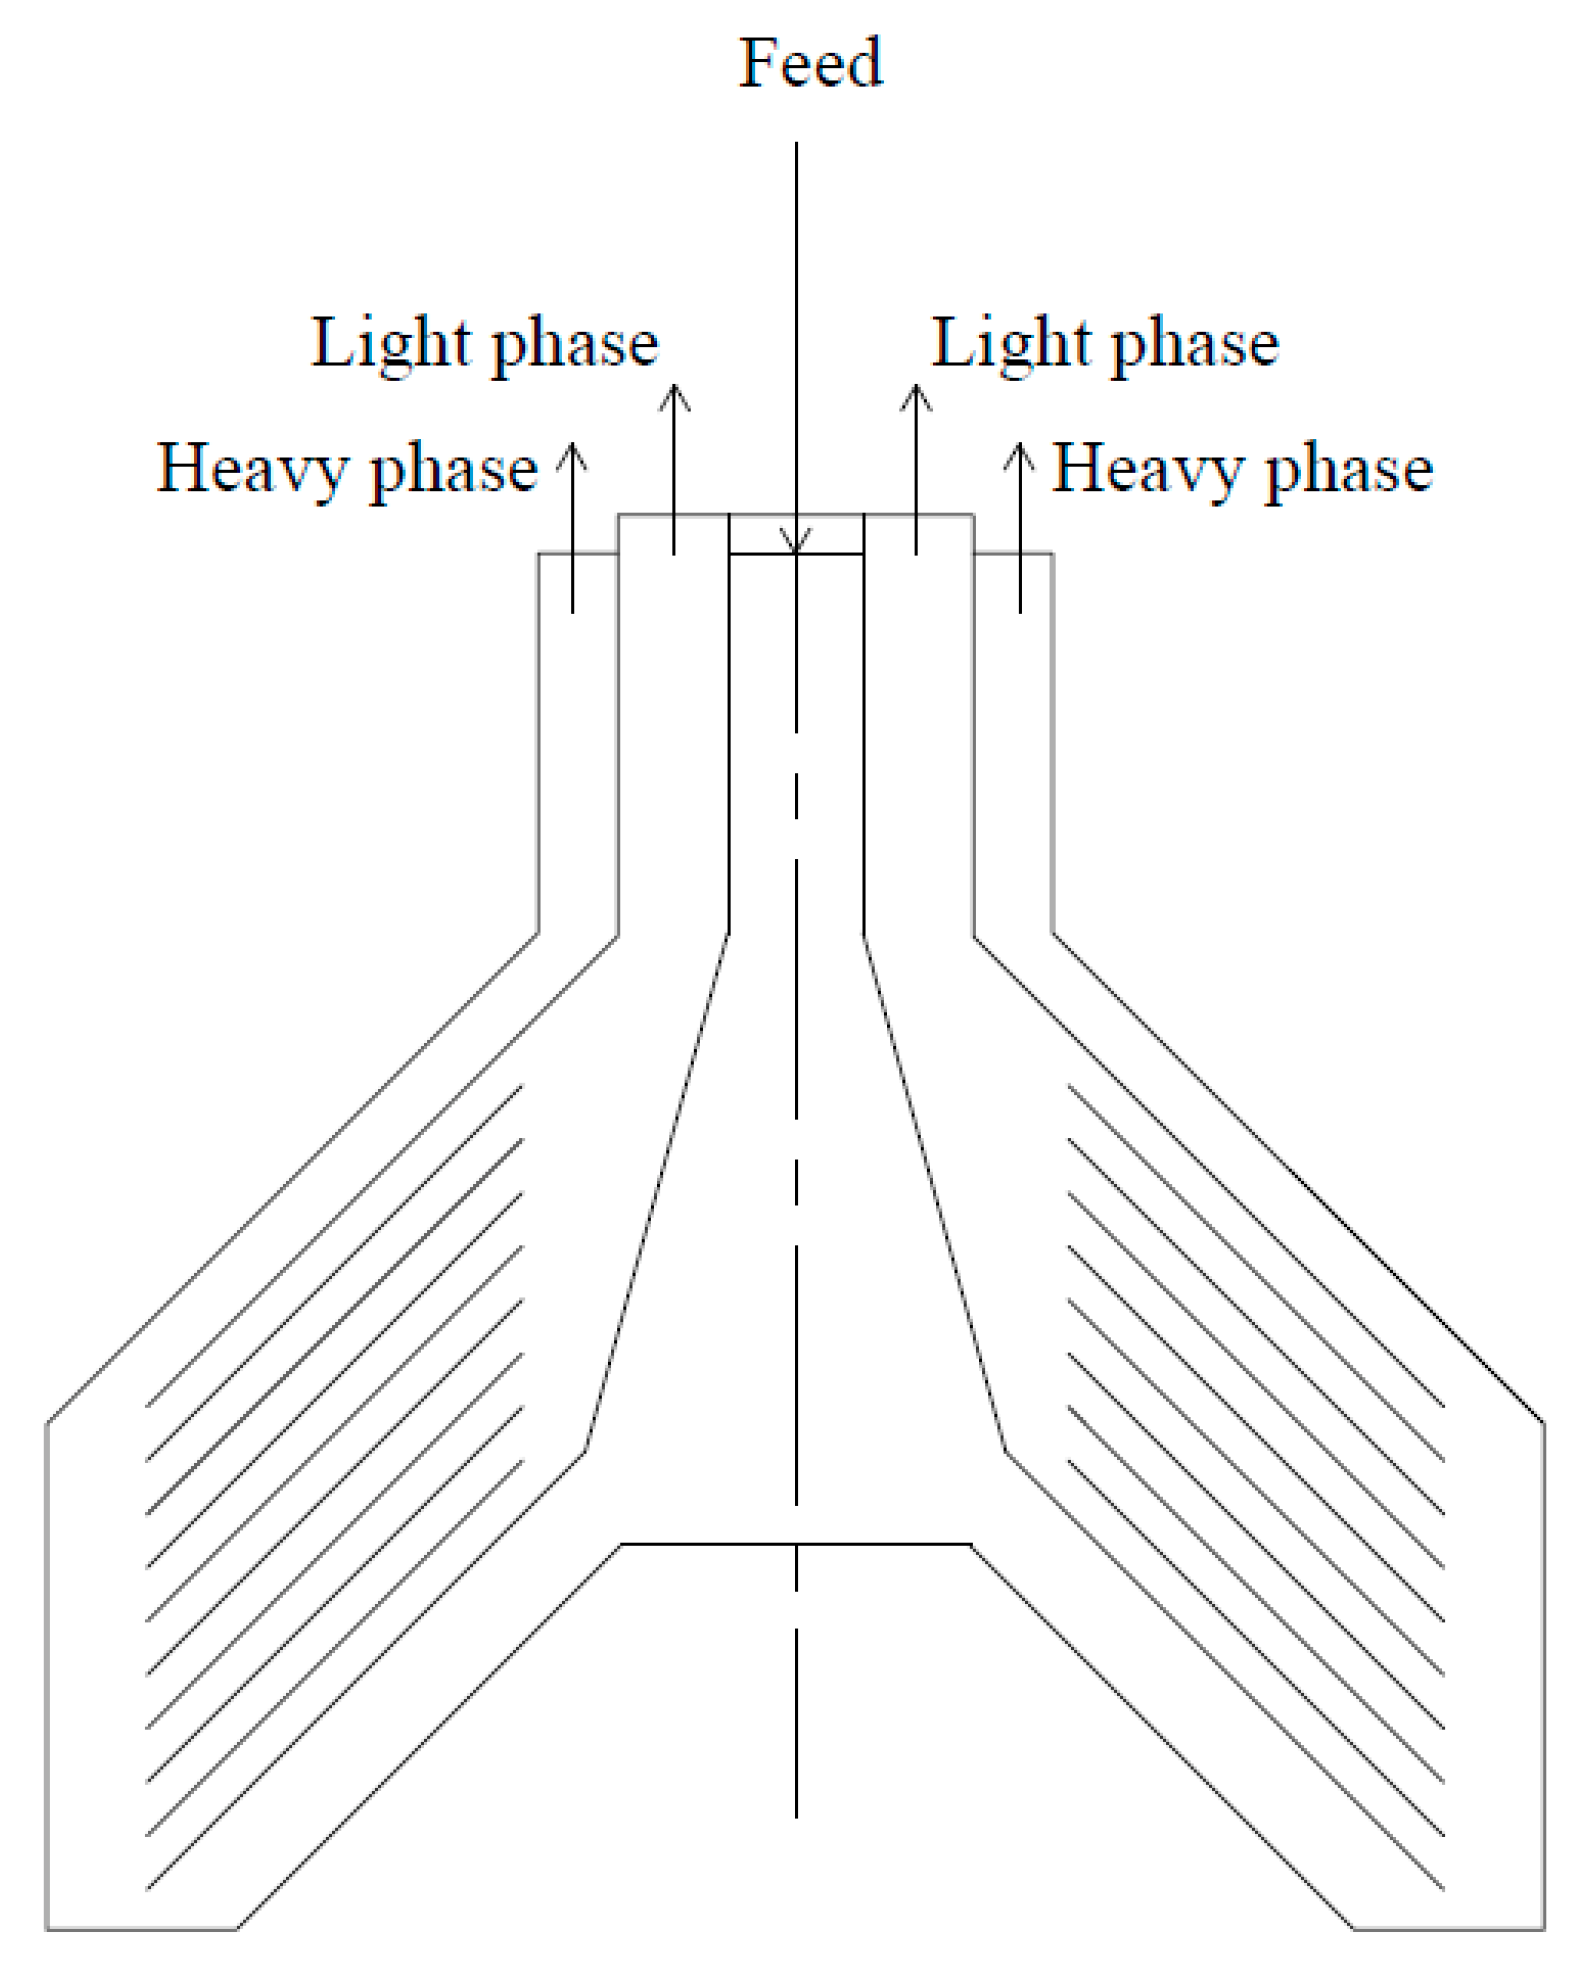
Figure 7 shows a schematic disc bowl. Disc bowls are used to separate liquids and fine solids and classify solids. These devices consist of conical discs that split the liquid flow into multiple thin layers [29].
Disc bowl centrifuges are larger than tubular bowl centrifuges and rotate at slower speeds. These centrifuges can handle up to 114 m3/h (30,000 gph) of feed and moderate quantities of solid particles [35]. Particles migrate radially (toward or away) from the axis of rotation, depending on whether the density of the dispersed particles is greater or lower compared to the continuous phase [35].

3.3.3. Hydrocyclones

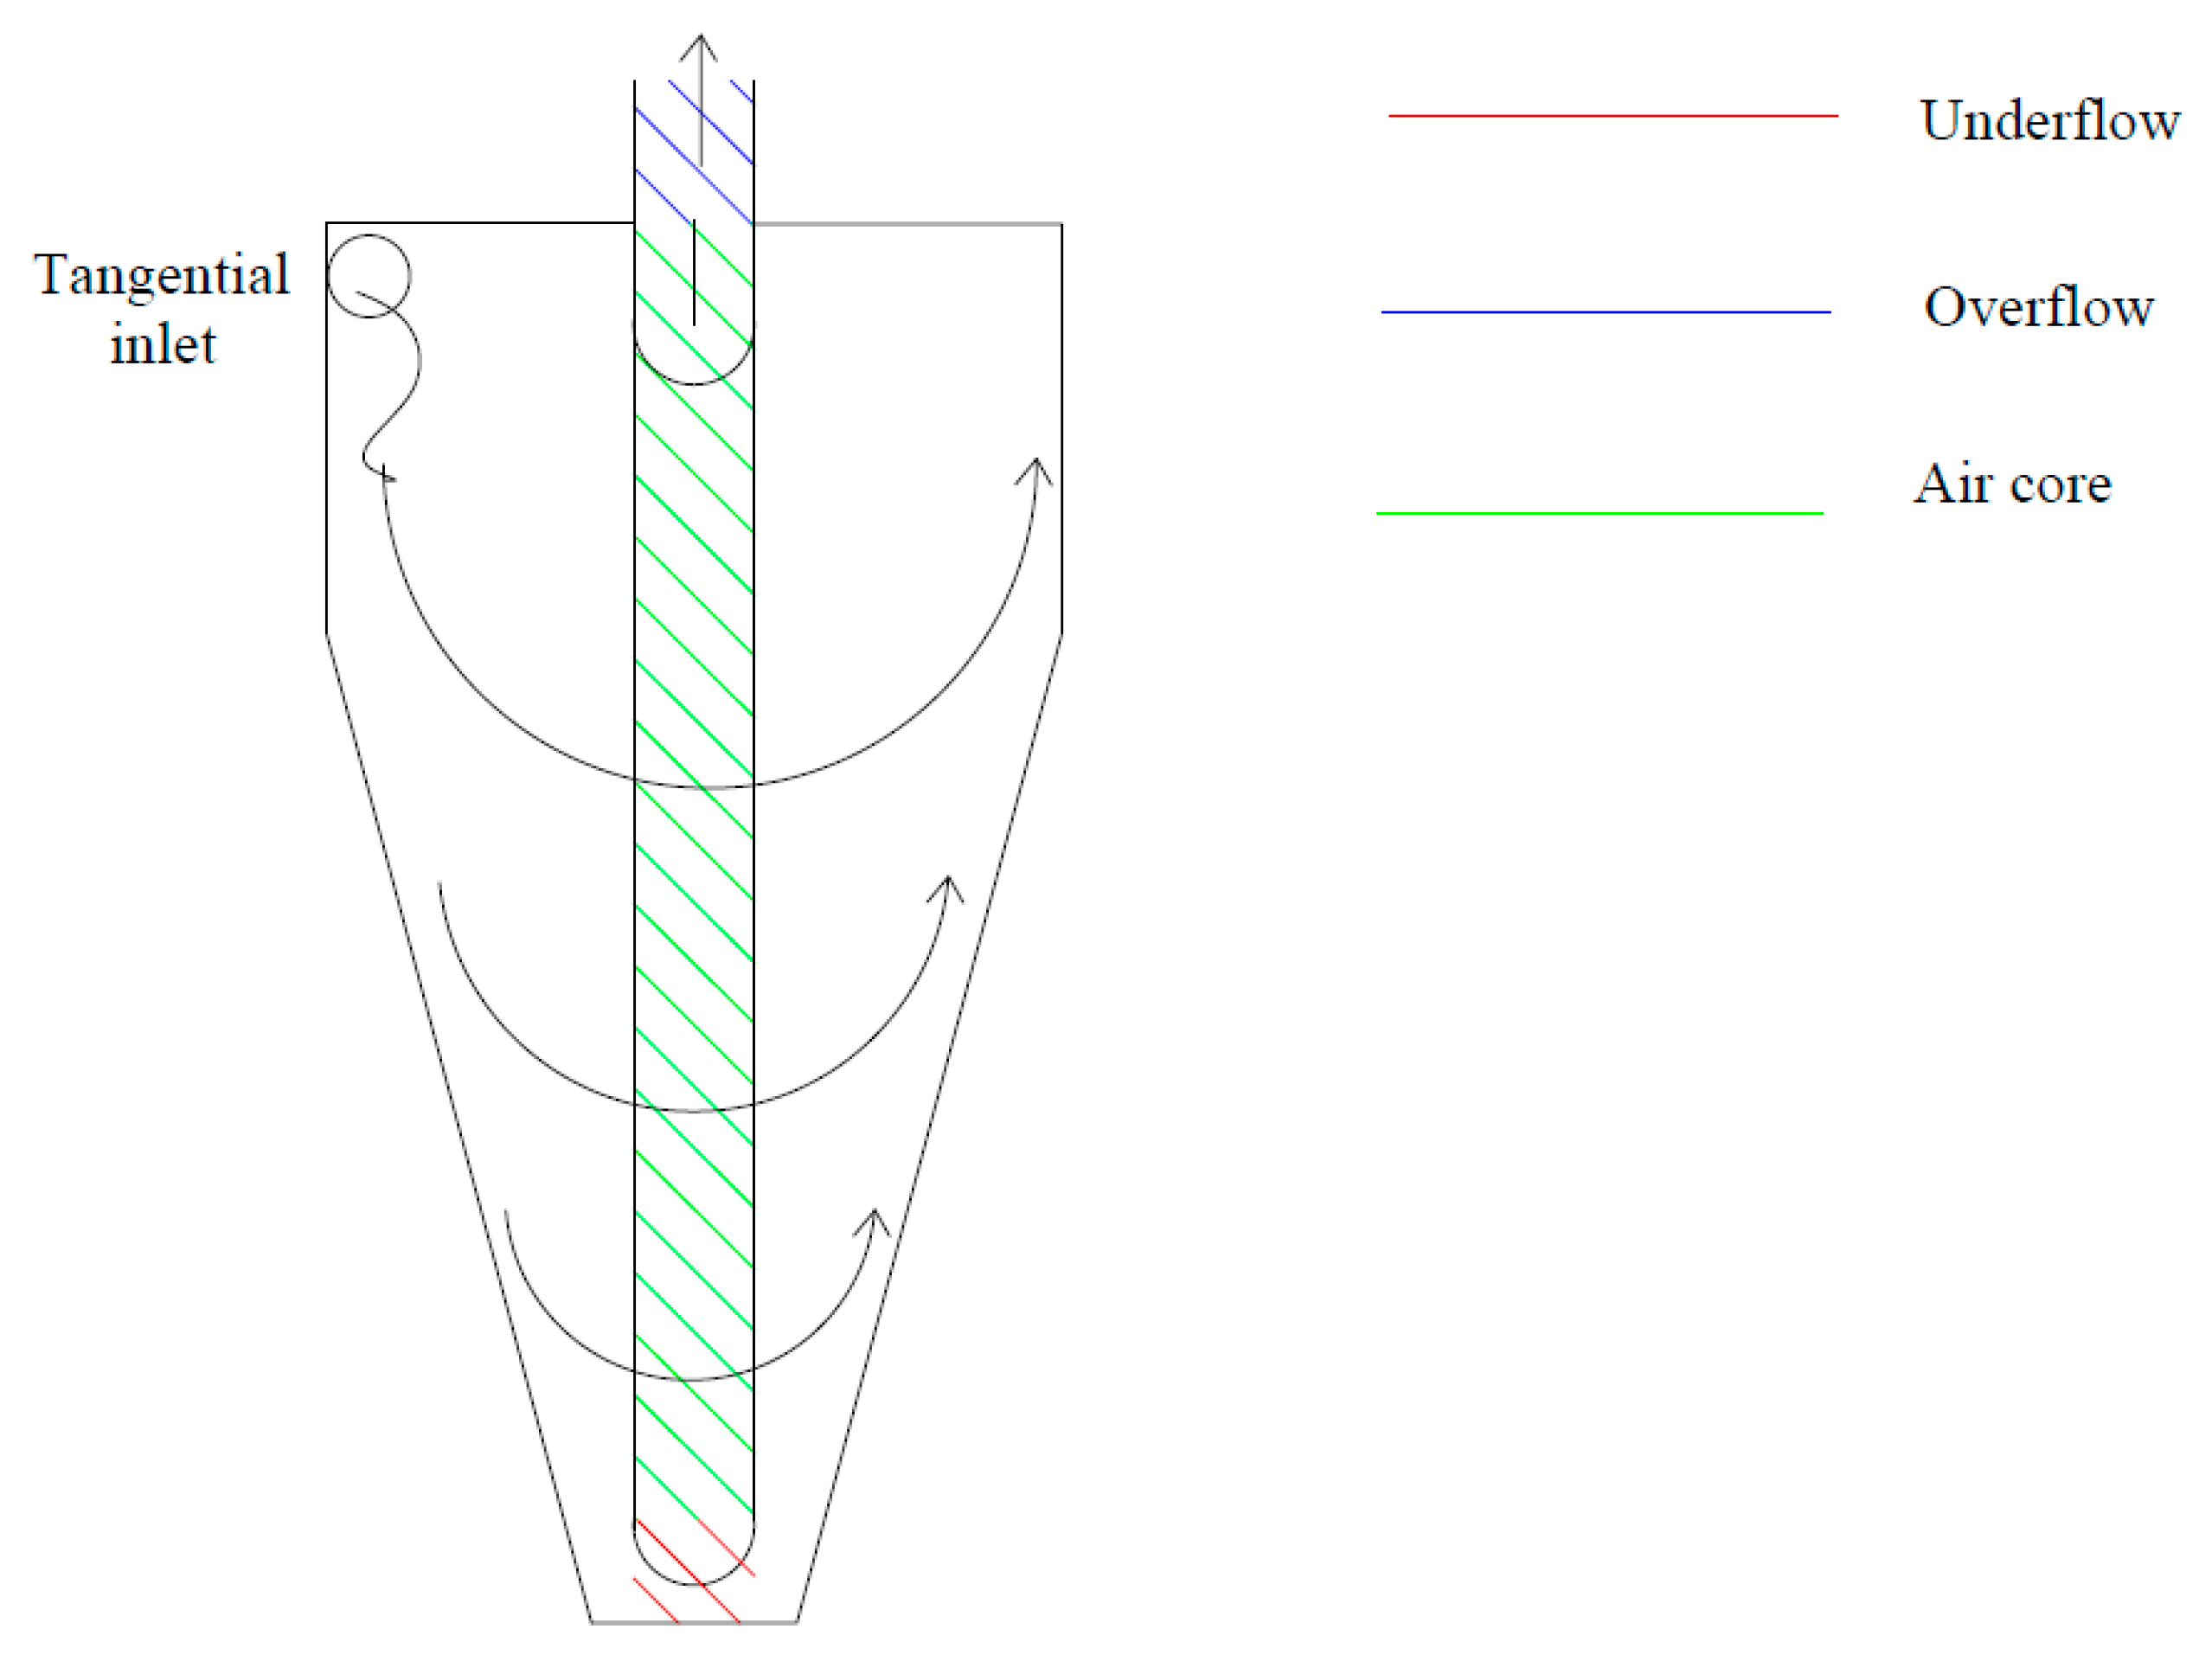
Another type of centrifugal separator for mixtures of liquid phases are hydrocyclones. Figure 8 shows a schematic sketch of a hydrocyclone [38,39]. Among the existing cyclones, the gas–solid cyclone, known as cyclone separator, has the longest history of usage [40]. Although the first hydrocyclone patent was granted in 1891 [149], these devices were not used until the early 1940s when numerous research results appeared in the literature, resulting in the expansion of hydrocyclones use for a broad spectrum of applications [40,41,42,43]. Hydrocyclones have traditionally been used for liquid–solid separation. They can also be applied to separate liquids after adjusting their design [35,40,41,42,43,75]. Hydrocyclones generate centrifugal force from fluid rotation [75]. Figure 8 illustrates the working principle of hydrocyclones. The hydrocyclone feed is introduced via a tangential inlet, which initiates the formation of a primary vortex near the hydrocyclone wall containing the heavy phase and a secondary vortex in the center containing the light phase. The heavy phase, or underflow stream, leaves through the cone’s apex via the underflow outlet, while the light phase, or overflow stream, leaves through the vortex finder, a duct that expands from the cylinder top into the inner part of the hydrocyclone.
Due to the presence of a high shear generated by the rotation of liquid in the device and the turbulent flow at the top of the unit, hydrocyclones have a tendency to create foam or emulsify mixtures with low interfacial tension [40]. Nevertheless, hydrocyclones are particularly suitable for separating type I and type II mixtures (Table 1) that contain solids, particularly when only a coarse separation is required. The main variables governing the operation of a cyclone are the feed pressure, feed flow rate, and split ratio, which refers to the proportion of fluid exiting from the top and bottom of the unit. The split ratio can be adjusted by the specifications of the over- and underflow outlets. When construction material for the cone is wetted by the heavy phase, the efficiency of the hydrocyclone can improve [40,75]. The reverse is true for the vortex finder and lighter phase [40]. If preliminary tests demonstrate adequate performance, hydrocyclones can be simple and cost-effective units that do not require any moving parts. Scaling up can be achieved by utilizing multiple smaller units in parallel, as large-diameter units are unable to generate sufficient centrifugal force.

3.4. Other Devices

3.4.1. Ultrafiltration Membranes

Ultrafiltration is a separation process for solid–liquid mixtures where membranes act as filters [44]. Ultrafiltration membranes involve the rejection of macromolecules or particles at the membrane surface. The membrane pore size ranges from 0.001 to 0.1 μm [44]. Membranes are typically made of polymers [150], but other materials, such as zeolite, can also be used for membranes in separation processes [151,152,153]. The feed enters the membrane at low pressure (typically less than 5 bar) [44]. A clarified solution is obtained on the permeate side due to the continuous phase passing through the membrane pores due to a pressure difference. The membrane pores allow liquid passage while the solid particles or macromolecules (bigger than membrane pore size) are rejected at the membrane surface. The rejected particles or molecules continue flowing tangentially along the membrane surface with the remaining continuous phase. The shear at the membrane surface should be high enough to stop particle or molecule aggregation on the membrane’s polymeric surface but sufficiently low to prevent the colloidal particles from breaking [44].
Pores of ultrafiltration membranes are tiny channels that allow only certain molecules or ions to pass through, while blocking others. In industrial applications, feeds may contain suspended particles or impurities that can block membranes by physically obstructing the membrane pores. When the feed containing particles is passed through a membrane, particles can accumulate in the membrane pores, leading to blockage. An example of the feed that contains particles is crude oil extracted from the ground, which can contain a variety of particles such as sand, clay, and other minerals that are mixed with the oil. During processing, oil can also pick up particles from equipment and other sources. Any of these particles within the feed can impede the feed flowing through the membrane and cause membrane fouling. Fouling is the main disadvantage of membranes because it reduces the separation quality [44,45]. Hydrophilic membrane materials or surface treatments with hydrophilic properties can prevent membrane fouling [46,47]. An alternative method for clarifying oil-in-water dispersions is to employ hydrophobic microporous membranes that allows intentional permeation of the oil phase through the membrane [48]. Other limitations of membranes are high capital costs and lower throughput, e.g., compared to hydrocyclones [45].
Ultrafiltration applications for liquid–liquid separation include water treatment, food and beverage processing, biotechnology, oil industry and pharmaceutical production. For example, in the food and beverage industry, ultrafiltration can be used to concentrate milk or fruit juice, while in the biotechnology industry, it can be used to separate proteins or enzymes for use in research or manufacturing processes.

3.4.2. Electrostatic Coalescers

Electrostatic coalescers (electro-coalescers) apply an electric field in liquid phase separation to achieve fast, clean, and efficient separation [49]. These devices can be used in liquid separation, e.g., water and oil, solvent extraction and dispersion, and to fractionate mixed oils [50,51]. An electric field facilitates the merging of small droplets either with each other or with an interface. The larger drops can easily settle by gravity. Therefore, the application of electric fields increases the coalescence rate, enhances the drop migration speed, and facilitates phase separation [49]. Eow et al. [49] reviewed the major mechanisms of electro-coalescence and separation, e.g., chain formation of droplets, dipole coalescence, dielectrophoresis, electrophoresis, random collisions, and film drainage and rupture. The predominant mechanism depends on electrode design and set-up, the type of employed electric fields, and emulsion properties [49]. Phase separation with the use of electrostatic coalescers has been reviewed by Mhatre et al. [154]. The mechanism of electro-coalescence of two drops involves three main stages: drop–drop approach, film drainage, and thin film breakup. Accelerating every stage can make the coalescence faster [154].

4. Recycling of Phase-Forming Components

The recycling of separated liquids depends on the nature of the liquids and the purpose of the separation. If the separated liquids are hazardous or contaminated, they may need to undergo additional treatment or disposal processes before recycling. If the separated liquids are clean and reusable, they can be recycled back into the process or used for other purposes. For example, in a wastewater treatment plant, the separated clean water can be recycled for irrigation or industrial use. In the food and beverage industry, separated fats and oils can be recycled and used for the production of biodiesel or animal feed. The recycling of separated liquids can be an environmentally friendly and cost-effective solution, as it reduces the amount of waste generated and conserves resources. However, it is important to ensure that the recycling process is safe and efficient and complies with environmental regulations [155]. Over the last years, significant research on new separation techniques and recycling of separated phases have been concluded, e.g., recycling of ionic liquids in aqueous two phase system separation [156,157], use of eutectic solvents in different extraction and separation processes [158,159,160,161,162,163,164,165,166], and separation and reuse of rare earths using ionic liquids [167,168,169,170].

5. Conclusions

Over the last decades, with growing interest in environmental and nature resource concerns, the separation of liquid phases has received renewed interest. Various methods for separating liquid phases from mixtures have been in use for decades. New designs or design modifications of existing equipment emerge for novel separation tasks.
Available separation methods for liquid–liquid separation are reviewed. Gravity decanters are the optimal choice for separation processes where time is not a constraint, as they rely solely on gravity to separate phases. Adding coalescing internals, such as granular materials, metal wire meshes, polymer filaments, or fine fibers, can improve the separation process. Coalescers can be integrated into the decanter design or used as a separate device. Centrifugal separators are the most commonly employed separation devices, relying on centrifugal force instead of constant gravity. These devices provide greater control over the separation process, as the centrifugal force can be adjusted using either the rotational speed, in the case of centrifuges, or the equipment dimensions, as with hydrocyclones. Other methods for liquid separation are ultrafiltration and electrostatic coalescence. Membranes separate macromolecules or particles at the membrane surfaces, while electrostatic coalescers use an electric field to facilitate the merging of small droplets.
The centrifugal devices seem to be the most suitable of the investigated devices for liquid–liquid separation. In comparison to the decanters or coalescers, the centrifugal devices can achieve faster separation, and their ability to vary centrifugal force allows better process control. Electrostatic coalescers utilize an electric field to speed up droplet merging and enhance coalescence rates. However, the larger droplets still rely on gravitational settling, making centrifugal devices favorable compared to electrostatic coalescers. In comparison to membranes, centrifugal devices have advantages in terms of being less susceptible to fouling and can achieve higher throughputs.
Open challenges for liquid–liquid separation are optimization of existing separation techniques, exploration of new solvents, development of new separation techniques, and more study of fundamental principles. Work on the optimization of existing techniques would improve separation efficiency and reduce costs. An example would be modifying the membrane structure to improve its performance. The choice of solvent is a critical factor in the success of liquid–liquid extraction. Researchers could explore novel solvents with improved extraction properties or greater environmental sustainability compared to conventional solvents. The development of new techniques could mean innovation that reduces energy consumption or potential miniaturization (advances in microfluidics could lead to smaller and more compact liquid separation systems). Developing sustainable technologies (recycling of components) and automation could also reduce the need for human intervention and provide greater accuracy and efficiency. Understanding the fundamental principles of mixture separation can also lead to new insights. Researchers should investigate the thermodynamics and kinetics of liquid–liquid extraction and other separation techniques to gain a more comprehensive understanding of the separation processes. In general, continued research and enhancement of liquid mixture separation can result in separation techniques that are both more efficient and cost-effective.

Author Contributions

Conceptualization, D.D. and M.B.; methodology, D.D. and M.B.; formal analysis, D.D., M.B. and M.H.; investigation, D.D.; data curation, D.D.; resources, D.D.; writing—original draft preparation, D.D.; writing—review and editing, D.D., M.B. and M.H.; visualization, D.D.; supervision, M.B. and M.H.; project administration, M.H.; funding acquisition, M.H. All authors have read and agreed to the published version of the manuscript.

Funding

D.D. gratefully acknowledges the financial support from the Hydroptics project which has received funding from the European Union’s Horizon 2020 Research and Innovation Programme under grant agreement No 871529. M.B. and M.H. gratefully acknowledge the funding support of K1-MET GmbH, metallurgical competence center. The research program of the competence center K1-MET is supported by COMET (Competence Center for Excellent Technologies), the Austrian program for competence centers. COMET is funded by the Federal Ministry for Transport, Innovation and Technology, the Federal Ministry for Digital and Economic Affairs, the province of Upper Austria, Tyrol, and Styria. Apart from funding, the project activities are financed by the industrial partners Primetals Technologies Austria, voestalpine Stahl and voestalpine Stahl Donawitz.

Data Availability Statement

Not applicable.

Conflicts of Interest

The authors declare no conflict of interest.

References

  1. Diuzheva, A.; Balogh, J.; Jekő, J.; Cziáky, Z. Application of liquid-liquid microextraction for the effective separation and simultaneous determination of 11 pharmaceuticals in wastewater samples using high-performance liquid chromatography with tandem mass spectrometry. J. Sep. Sci. 2018, 41, 2870–2877. [Google Scholar] [CrossRef]
  2. Zhang, Y.; Xue, K.; Li, H.; Lian, S.; Han, C.; Zhu, Z.; Lu, Y.; Qi, J.; Wang, Y. Mechanism analysis and liquid-liquid equilibrium of methyl tert-butyl ether separation from petroleum wastewater azeotrope by green mixed solvent. J. Environ. Chem. Eng. 2023, 11, 109389. [Google Scholar] [CrossRef]
  3. Jiao, T.; Zhuang, X.; He, H.; Li, C.; Chen, H.; Zhang, S. Separation of Phenolic Compounds from Coal Tar via Liquid–Liquid Extraction Using Amide Compounds. Ind. Eng. Chem. Res. 2015, 54, 2573–2579. [Google Scholar] [CrossRef]
  4. Jiao, T.; Li, C.; Zhuang, X.; Cao, S.; Chen, H.; Zhang, S. The new liquid–liquid extraction method for separation of phenolic compounds from coal tar. Chem. Eng. J. 2015, 266, 148–155. [Google Scholar] [CrossRef]
  5. Wilson, A.M.; Bailey, P.J.; Tasker, P.A.; Turkington, J.R.; Grant, R.A.; Love, J.B. Solvent extraction: The coordination chemistry behind extractive metallurgy. Chem. Soc. Rev. 2014, 43, 123–134. [Google Scholar] [CrossRef] [Green Version]
  6. Zimmermann, Y.-S.; Niewersch, C.; Lenz, M.; Kül, Z.Z.; Corvini, P.F.-X.; Schäffer, A.; Wintgens, T. Recycling of indium from CIGS photovoltaic cells: Potential of combining acid-resistant nanofiltration with liquid-liquid extraction. Environ. Sci. Technol. 2014, 48, 13412–13418. [Google Scholar] [CrossRef] [PubMed]
  7. Wongsawa, T.; Traiwongsa, N.; Pancharoen, U.; Nootong, K. A review of the recovery of precious metals using ionic liquid extractants in hydrometallurgical processes. Hydrometallurgy 2020, 198, 105488. [Google Scholar] [CrossRef]
  8. Quijada-Maldonado, E.; Olea, F.; Sepúlveda, R.; Castillo, J.; Cabezas, R.; Merlet, G.; Romero, J. Possibilities and challenges for ionic liquids in hydrometallurgy. Sep. Purif. Technol. 2020, 251, 117289. [Google Scholar] [CrossRef]
  9. Zhang, Y.; Gu, F.; Su, Z.; Liu, S.; Anderson, C.; Jiang, T. Hydrometallurgical Recovery of Rare Earth Elements from NdFeB Permanent Magnet Scrap: A Review. Metals 2020, 10, 841. [Google Scholar] [CrossRef]
  10. Wommer, L.; Meiers, P.; Kockler, I.; Ulber, R.; Kampeis, P. Development of a 3D-printed single-use separation chamber for use in mRNA-based vaccine production with magnetic microparticles. Eng. Life Sci. 2021, 21, 573–588. [Google Scholar] [CrossRef] [PubMed]
  11. Ghanem, A.; Healey, R.; Adly, F.G. Current trends in separation of plasmid DNA vaccines: A review. Anal. Chim. Acta 2013, 760, 1–15. [Google Scholar] [CrossRef] [PubMed]
  12. Shamsipur, M.; Naseri, M.T.; Babri, M. Quantification of candidate prostate cancer metabolite biomarkers in urine using dispersive derivatization liquid-liquid microextraction followed by gas and liquid chromatography-mass spectrometry. J. Pharm. Biomed. Anal. 2013, 81–82, 65–75. [Google Scholar] [CrossRef]
  13. Siddique, A.B.; Ebrahim, H.; Mohyeldin, M.; Qusa, M.; Batarseh, Y.; Fayyad, A.; Tajmim, A.; Nazzal, S.; Kaddoumi, A.; El Sayed, K. Novel liquid-liquid extraction and self-emulsion methods for simplified isolation of extra-virgin olive oil phenolics with emphasis on (-)-oleocanthal and its oral anti-breast cancer activity. PLoS ONE 2019, 14, e0214798. [Google Scholar] [CrossRef] [Green Version]
  14. Gouveia, T.I.A.; Silva, A.M.T.; Ribeiro, A.R.; Alves, A.; Santos, M.S.F. Liquid-liquid extraction as a simple tool to quickly quantify fourteen cytostatics in urban wastewaters and access their impact in aquatic biota. Sci. Total Environ. 2020, 740, 139995. [Google Scholar] [CrossRef] [PubMed]
  15. Xue, Z.; Cao, Y.; Liu, N.; Feng, L.; Jiang, L. Special wettable materials for oil/water separation. J. Mater. Chem. A 2014, 2, 2445–2460. [Google Scholar] [CrossRef]
  16. Gupta, R.K.; Dunderdale, G.J.; England, M.W.; Hozumi, A. Oil/water separation techniques: A review of recent progresses and future directions. J. Mater. Chem. A 2017, 5, 16025–16058. [Google Scholar] [CrossRef]
  17. Chu, Z.; Feng, Y.; Seeger, S. Oil/water separation with selective superantiwetting/superwetting surface materials. Angew. Chem. Int. Ed. 2015, 54, 2328–2338. [Google Scholar] [CrossRef]
  18. Padaki, M.; Surya Murali, R.; Abdullah, M.S.; Misdan, N.; Moslehyani, A.; Kassim, M.A.; Hilal, N.; Ismail, A.F. Membrane technology enhancement in oil–water separation. A review. Desalination 2015, 357, 197–207. [Google Scholar] [CrossRef]
  19. Buarque, F.S.; Barreto, V.S.; Soares, C.M.F.; Souza, R.L.; Pereira, M.M.; Lima, Á.S. Selective extraction of female hormones using aqueous two-phase system composed of double protic ionic liquid + acetonitrile. Fluid Phase Equilibria 2020, 508, 112443. [Google Scholar] [CrossRef]
  20. Albertsson, P.A. Partition of cell particles and macromolecules in polymer two-phase systems. Adv. Protein Chem. 1970, 24, 309–341. [Google Scholar] [CrossRef]
  21. Freire, M.G. Ionic-Liquid-Based Aqueous Biphasic Systems: Fundamentals and Applications; Freire, M.G., Ed.; Springer: Berlin/Heidelberg, Germany, 2016; ISBN 3662528738. [Google Scholar]
  22. Freire, M.G.; Cláudio, A.F.M.; Araújo, J.M.M.; Coutinho, J.A.P.; Marrucho, I.M.; Canongia Lopes, J.N.; Rebelo, L.P.N. Aqueous biphasic systems: A boost brought about by using ionic liquids. Chem. Soc. Rev. 2012, 41, 4966–4995. [Google Scholar] [CrossRef] [PubMed]
  23. Fu, X.; Belwal, T.; Cravotto, G.; Luo, Z. Sono-physical and sono-chemical effects of ultrasound: Primary applications in extraction and freezing operations and influence on food components. Ultrason. Sonochemistry 2020, 60, 104726. [Google Scholar] [CrossRef]
  24. Ekezie, F.-G.C.; Sun, D.-W.; Cheng, J.-H. Acceleration of microwave-assisted extraction processes of food components by integrating technologies and applying emerging solvents: A review of latest developments. Trends Food Sci. Technol. 2017, 67, 160–172. [Google Scholar] [CrossRef]
  25. Deng, Y.; Wang, W.; Zhao, S.; Yang, X.; Xu, W.; Guo, M.; Xu, E.; Ding, T.; Ye, X.; Liu, D. Ultrasound-assisted extraction of lipids as food components: Mechanism, solvent, feedstock, quality evaluation and coupled technologies—A review. Trends Food Sci. Technol. 2022, 122, 83–96. [Google Scholar] [CrossRef]
  26. Luque de Castro, M.D.; Castillo-Peinado, L.S. 3—Microwave-Assisted Extraction of Food Components. In Innovative Food Processing Technologies: Extraction, Separation, Component Modification and Process Intensification; Knoerzer, K., Juliano, P., Smithers, G.W., Eds.; Woodhead Publishing: Duxford, UK, 2016; pp. 57–110. ISBN 978-0-08-100294-0. [Google Scholar]
  27. Antony, F.M.; Pal, D.; Wasewar, K. Separation of bio-products by liquid–liquid extraction. Phys. Sci. Rev. 2021, 6, 20180065. [Google Scholar] [CrossRef]
  28. Aerstin, F.; Street, G. Decanters. In Applied Chemical Process Design; Springer: Boston, MA, USA, 1978; pp. 35–38. [Google Scholar] [CrossRef]
  29. Sinnott, R.K. Coulson & Richardson’s Chemical Engineering: Fourth Edition Coulson & Richardson’s Chemical Engineering Series; Pergamon Press: Oxford, UK; New York, NY, USA, 1993; ISBN 9781483294704. [Google Scholar]
  30. Bai, C.; Park, H.; Wang, L. Modelling solid-liquid separation and particle size classification in decanter centrifuges. Sep. Purif. Technol. 2021, 263, 118408. [Google Scholar] [CrossRef]
  31. Hazlett, R.N. Fibrous Bed Coalescence of Water. Steps in the Coalescence Process. Ind. Eng. Chem. Fundam. 1969, 8, 625–632. [Google Scholar] [CrossRef]
  32. Madia, J.R.; Fruh, S.M.; Miller, C.A.; Beerbower, A. Granular packed bed coalescer: Influence of packing wettability on coalescence. Environ. Sci. Technol. 1976, 10, 1044–1046. [Google Scholar] [CrossRef]
  33. Sokolović, D.; Laminger, T.; Mauschitz, G.; Höflinger, W. Novel coalescer design with bed of waste polymer fibers for liquid aerosol separation. Sep. Purif. Technol. 2021, 263, 118187. [Google Scholar] [CrossRef]
  34. Shi, Y.; Chen, J.; Pan, Z. Experimental Study on the Performance of a Novel Compact Electrostatic Coalescer with Helical Electrodes. Energies 2021, 14, 1733. [Google Scholar] [CrossRef]
  35. Cheremisinoff, N.P. Handbook of Chemical Processing Equipment: Chapter 6. Mechanical Separation Equipment. Elsevier Butterworth-Heinemann: Woburn, MA, USA, 2000; ISBN 0-7506-7126-2. [Google Scholar]
  36. Herivel, J.W. Newton’s Discovery of the Law of Centrifugal Force. Isis 1960, 51, 546–553. [Google Scholar] [CrossRef]
  37. Leung, W.W.-F. Centrifugal Separations in Biotechnology, 2nd ed.; Elsevier Butterworth-Heinemann: San Diego, CA, USA, 2020; ISBN 9780081026359. [Google Scholar]
  38. Bradley, D. The Hydrocyclone, 1st ed.; Pergamon Press: Oxford, UK; New York, NY, USA, 1965; ISBN 9781483155708. [Google Scholar]
  39. Svarovsky, L.; Thew, M.T. Hydrocyclones: Analysis and Applications. In Proceedings of the 4th International Conference: Papers, Southampton, UK, 23–25 September 1992; ISBN 0792318765. [Google Scholar]
  40. Sheng, H.P. Separation of Liquids in a Conventional Hydrocyclone. Sep. Purif. Methods 1977, 6, 89–127. [Google Scholar] [CrossRef]
  41. Ji, L.; Paul, P.; Shanbhag, B.K.; Dixon, I.; Kuang, S.; He, L. Emerging application of hydrocyclone in biotechnology and food processing. Sep. Purif. Technol. 2023, 309, 122992. [Google Scholar] [CrossRef]
  42. He, L.; Ji, L.; Sun, X.; Chen, S.; Kuang, S. Investigation of mini-hydrocyclone performance in removing small-size microplastics. Particuology 2022, 71, 1–10. [Google Scholar] [CrossRef]
  43. Hou, D.; Zhao, Q.; Cui, B.; Wei, D.; Song, Z.; Feng, Y. Geometrical configuration of hydrocyclone for improving the separation performance. Adv. Powder Technol. 2022, 33, 103419. [Google Scholar] [CrossRef]
  44. Ross, W.R.; Barnard, J.P.; Le Roux, J.; de Villiers, H.A. Application of ultrafiltration membranes for solids liquid separation in anaerobic digestion systems: The ADUF process. Water SA 1990, 16, 85–91. [Google Scholar]
  45. Tanudjaja, H.J.; Hejase, C.A.; Tarabara, V.V.; Fane, A.G.; Chew, J.W. Membrane-based separation for oily wastewater: A practical perspective. Water Res. 2019, 156, 347–365. [Google Scholar] [CrossRef]
  46. Munirasu, S.; Haija, M.A.; Banat, F. Use of membrane technology for oil field and refinery produced water treatment—A review. Process Saf. Environ. Prot. 2016, 100, 183–202. [Google Scholar] [CrossRef]
  47. Moslehyani, A.; Mobaraki, M.; Ismail, A.F.; Othman, M.H.D.; Mayahi, A.; Shamsaei, E.; Abdullah, M.S.; Razis, M. PVDF membrane for oil-in-water separation via cross-flow ultrafiltration process. J. Teknol. 2015, 78, 217–222. [Google Scholar] [CrossRef] [Green Version]
  48. Mercelat, A.Y.J. Fundamental Study of Hydrophobic Microporous Membrane Contactors for the Recovery of Insoluble Oil from Oil-Water Mixtures. Ph.D. Dissertation, The University of Texas at Austin, Austin, TX, USA, 2016. [Google Scholar]
  49. Eow, J.S.; Ghadiri, M.; Sharif, A.O.; Williams, T.J. Electrostatic enhancement of coalescence of water droplets in oil a review of current understaning. Chem. Eng. J. 2001, 84, 173–192. [Google Scholar] [CrossRef]
  50. Scott, T.C.; Wham, R.M. An electrically driven multistage countercurrent solvent extraction device: The emulsion-phase contactor. Ind. Eng. Chem. Res. 1989, 28, 94–97. [Google Scholar] [CrossRef]
  51. Xiang, H.; Kadet, V.V.; Evtyuhin, A.V.; Vasneva, G.I. Scientific Base and the Results of Electrotreatment Technology for EOR. In Proceedings of the International Field Exploration and Development Conference, Chengdu, China, 21–22 September 2017; Springer: Singapore, 2019; pp. 908–920. [Google Scholar]
  52. Singh, V.K.; Qureshi, D.; Nayak, S.K.; Pal, K. 10-Bigels. In Polymeric Gels: Characterization, Properties and Biomedical Applications; Pal, K., Banerjee, I., Eds.; Woodhead Publishing: Oxford, UK, 2018; pp. 265–282. ISBN 978-0-08-102179-8. [Google Scholar]
  53. Kooij, S.; Sijs, R.; Denn, M.M.; Villermaux, E.; Bonn, D. What Determines the Drop Size in Sprays? Phys. Rev. X 2018, 8, 31019. [Google Scholar] [CrossRef] [Green Version]
  54. Rossi, C.C.R.S.; Cardozo-Filho, L.; Guirardello, R. Gibbs free energy minimization for the calculation of chemical and phase equilibrium using linear programming. Fluid Phase Equilibria 2009, 278, 117–128. [Google Scholar] [CrossRef]
  55. Luo, Q.; Guo, Y.; Liu, B.; Feng, Y.; Zhang, J.; Li, Q.; Chou, K. Thermodynamics and kinetics of phase transformation in rare earth–magnesium alloys: A critical review. J. Mater. Sci. Technol. 2020, 44, 171–190. [Google Scholar] [CrossRef]
  56. André, A.A.M.; Spruijt, E. Liquid-Liquid Phase Separation in Crowded Environments. Int. J. Mol. Sci. 2020, 21, 5908. [Google Scholar] [CrossRef]
  57. Heidemann, R.A.; Mandhane, J.M. Ternary liquid—Liquid equilibria: The van laar equation. Chem. Eng. Sci. 1975, 30, 425–434. [Google Scholar] [CrossRef]
  58. Zhang, X.; You, J.B.; Arends, G.F.; Qian, J.; Chen, Y.; Lohse, D.; Shaw, J.M. Propelling microdroplets generated and sustained by liquid-liquid phase separation in confined spaces. Soft Matter 2021, 17, 5362–5374. [Google Scholar] [CrossRef] [PubMed]
  59. Zeegers-Huyskens, T.; Huyskens, P. Intermolecular Forces; Springer: Berlin, Heidelberg, 1991. [Google Scholar]
  60. Chatzigiannakis, E.; Jaensson, N.; Vermant, J. Thin liquid films: Where hydrodynamics, capillarity, surface stresses and intermolecular forces meet. Curr. Opin. Colloid Interface Sci. 2021, 53, 101441. [Google Scholar] [CrossRef]
  61. Cinar, H.; Fetahaj, Z.; Cinar, S.; Vernon, R.M.; Chan, H.S.; Winter, R.H.A. Temperature, Hydrostatic Pressure, and Osmolyte Effects on Liquid-Liquid Phase Separation in Protein Condensates: Physical Chemistry and Biological Implications. Chem. A Eur. J. 2019, 25, 13049–13069. [Google Scholar] [CrossRef]
  62. Dignon, G.L.; Zheng, W.; Kim, Y.C.; Mittal, J. Temperature-Controlled Liquid-Liquid Phase Separation of Disordered Proteins. ACS Cent. Sci. 2019, 5, 821–830. [Google Scholar] [CrossRef] [Green Version]
  63. Dignon, G.L.; Best, R.B.; Mittal, J. Biomolecular Phase Separation: From Molecular Driving Forces to Macroscopic Properties. Annu. Rev. Phys. Chem. 2020, 71, 53–75. [Google Scholar] [CrossRef] [PubMed] [Green Version]
  64. Ye, J.; Jiang, C.; Chen, H.; Shen, Y.; Zhang, S.; Wang, L.; Chen, J. Novel Biphasic Solvent with Tunable Phase Separation for CO2 Capture: Role of Water Content in Mechanism, Kinetics, and Energy Penalty. Environ. Sci. Technol. 2019, 53, 4470–4479. [Google Scholar] [CrossRef] [PubMed]
  65. Babinchak, W.M.; Surewicz, W.K. Liquid-Liquid Phase Separation and Its Mechanistic Role in Pathological Protein Aggregation. J. Mol. Biol. 2020, 432, 1910–1925. [Google Scholar] [CrossRef]
  66. Searle, M.S.; Westwell, M.S.; Williams, D.H. Application of a generalised enthalpy–entropy relationship to binding co-operativity and weak associations in solution. J. Chem. Soc. Perkin Trans. 2 1995, 141–151. [Google Scholar] [CrossRef]
  67. Pezzotti, S.; König, B.; Ramos, S.; Schwaab, G.; Havenith, M. Liquid-Liquid Phase Separation? Ask the Water! J. Phys. Chem. Lett. 2023, 14, 1556–1563. [Google Scholar] [CrossRef] [PubMed]
  68. Amigó, J.M.; Balogh, S.G.; Hernández, S. A Brief Review of Generalized Entropies. Entropy 2018, 20, 813. [Google Scholar] [CrossRef] [Green Version]
  69. Derimow, N.; Abbaschian, R. Liquid Phase Separation in High-Entropy Alloys-A Review. Entropy 2018, 20, 890. [Google Scholar] [CrossRef] [Green Version]
  70. Gonzalez-Miquel, M.; Massel, M.; DeSilva, A.; Palomar, J.; Rodriguez, F.; Brennecke, J.F. Excess enthalpy of monoethanolamine + ionic liquid mixtures: How good are COSMO-RS predictions? J. Phys. Chem. B 2014, 118, 11512–11522. [Google Scholar] [CrossRef]
  71. Zobel, N.; Anca-Couce, A. Influence of intraparticle secondary heterogeneous reactions on the reaction enthalpy of wood pyrolysis. J. Anal. Appl. Pyrolysis 2015, 116, 281–286. [Google Scholar] [CrossRef]
  72. Campbell, J.A. Le Chatelier’s Principle, Temperature Effects, and Entropy. J. Chem. Educ. 1985, 62, 231–232. [Google Scholar] [CrossRef]
  73. Thomas, J.M. The existence of endothermic adsorption. J. Chem. Educ. 1961, 38, 138. [Google Scholar] [CrossRef]
  74. Chiban, M.; Carja, G.; Lehutu, G.; Sinan, F. Equilibrium and thermodynamic studies for the removal of As(V) ions from aqueous solution using dried plants as adsorbents. Arab. J. Chem. 2016, 9, S988–S999. [Google Scholar] [CrossRef] [Green Version]
  75. Green, D.W.; Southard, M.Z. (Eds.) Perry’s Chemical Engineers’ Handbook, 9th ed.; 85th anniversary edition; McGraw Hill Education: New York, NY, USA, 2019; ISBN 9780071834094. [Google Scholar]
  76. Mousavi, N.S.; Romero-Martínez, A.; Ramírez-Verduzco, L.F. Predicting the surface tension of mixtures of fatty acid ethyl esters and biodiesel fuels using UNIFAC activity coefficients. Fluid Phase Equilibria 2020, 507, 112430. [Google Scholar] [CrossRef]
  77. Wang, D.; Ji, C.; Wang, S.; Yang, J.; Wang, Z. Numerical study of the premixed ammonia-hydrogen combustion under engine-relevant conditions. Int. J. Hydrog. Energy 2021, 46, 2667–2683. [Google Scholar] [CrossRef]
  78. Gillespie, D.; Giri, J.; Fill, M. Reinterpreting the anomalous mole fraction effect: The ryanodine receptor case study. Biophys. J. 2009, 97, 2212–2221. [Google Scholar] [CrossRef] [Green Version]
  79. Voutsas, E.C.; Tassios, D.P. Prediction of Infinite-Dilution Activity Coefficients in binary Mixtures with UNIFAC. A Critical Evaluation. Ind. Eng. Chem. Res. 1996, 35, 1438–1445. [Google Scholar] [CrossRef]
  80. Kollau, L.J.B.M.; Vis, M.; van den Bruinhorst, A.; de With, G.; Tuinier, R. Activity modelling of the solid–liquid equilibrium of deep eutectic solvents. Pure Appl. Chem. 2019, 91, 1341–1349. [Google Scholar] [CrossRef]
  81. Wilson, G.M. Vapor-Liquid Equilibrium. XI. A New Expression for the Excess Free Energy of Mixing. J. Am. Chem. Soc. 1964, 86, 127–130. [Google Scholar] [CrossRef]
  82. Renon, H.; Prausnitz, J.M. Local compositions in thermodynamic excess functions for liquid mixtures. AIChE J. 1968, 14, 135–144. [Google Scholar] [CrossRef]
  83. Abrams, D.S.; Prausnitz, J.M. Statistical thermodynamics of liquid mixtures: A new expression for the excess Gibbs energy of partly or completely miscible systems. AIChE J. 1975, 21, 116–128. [Google Scholar] [CrossRef]
  84. Fredenslund, A.; Jones, R.L.; Prausnitz, J.M. Group-contribution estimation of activity coefficients in nonideal liquid mixtures. AIChE J. 1975, 21, 1086–1099. [Google Scholar] [CrossRef]
  85. Larsen, B.L.; Rasmussen, P.; Fredenslund, A. A modified UNIFAC group-contribution model for prediction of phase equilibria and heats of mixing. Ind. Eng. Chem. Res. 1987, 26, 2274–2286. [Google Scholar] [CrossRef]
  86. Weidlich, U.; Gmehling, J. A modified UNIFAC model. 1. Prediction of VLE, hE, and.gamma.infin. Ind. Eng. Chem. Res. 1987, 26, 1372–1381. [Google Scholar] [CrossRef]
  87. Kang, J.W.; Diky, V.; Frenkel, M. New modified UNIFAC parameters using critically evaluated phase equilibrium data. Fluid Phase Equilibria 2015, 388, 128–141. [Google Scholar] [CrossRef]
  88. Gambini Pereira, C. Thermodynamics of Phase Equilibria in Food Engineering; Academic Press: London, UK, 2019; ISBN 9780128115572. [Google Scholar]
  89. Zhang, Q.; Dong, S.; Zhang, M.; Huang, F. Supramolecular control over thermo-responsive systems with lower critical solution temperature behavior. Aggregate 2021, 2, 35–47. [Google Scholar] [CrossRef]
  90. Perdomo, F.A.; Khalit, S.H.; Adjiman, C.S.; Galindo, A.; Jackson, G. Description of the thermodynamic properties and fluid-phase behavior of aqueous solutions of linear, branched, and cyclic amines. AIChE J. 2021, 67, e17194. [Google Scholar] [CrossRef]
  91. Xu, W.; Gao, X.; Zheng, L.; Lu, F. Ionic-Liquid-Based Aqueous Two-Phase Systems Induced by Intra- and Intermolecular Hydrogen Bonds. Molecules 2022, 27, 5307. [Google Scholar] [CrossRef] [PubMed]
  92. Christensen, S.P.; Donate, F.A.; Frank, T.C.; LaTulip, R.J.; Wilson, L.C. Mutual Solubility and Lower Critical Solution Temperature for Water + Glycol Ether Systems. J. Chem. Eng. Data 2005, 50, 869–877. [Google Scholar] [CrossRef]
  93. Kuchierskaya, A.A.; Semenov, A.P.; Sayfutdinova, A.R.; Kopitsyn, D.S.; Vinokurov, V.A.; Anisimov, M.A.; Novikov, A.A. Interfacial tension and phase properties of water—Hydrotrope—Oil solutions: Water—2-butoxyethanol—Toluene. J. Mol. Liq. 2021, 344, 117683. [Google Scholar] [CrossRef]
  94. Steltenpohl, P.; Graczová, E. Application of extended NRTL equation for ternary liquid-liquid and vapor-liquid-liquid equilibria description. Chem. Pap. 2010, 64, 310–317. [Google Scholar] [CrossRef]
  95. Perry, R.H.; Green, D.W.; Maloney, J.O. Perry’s Chemical Engineers’ Handbook: Liquid-Liquid Extraction Operations and Equipment, 7th ed.; McGraw-Hill: New York, NY, USA, 1997; ISBN 0070498415. [Google Scholar]
  96. Illner, M.; Esche, E.; Repke, J.-U. Optimal Control of Surfactant Containing Multiphase Systems—Challenges and Solution Strategies for a Stable Mini-Plant Operation. In Proceedings of the 13th International Symposium on Process Systems Engineering (PSE 2018), San Diego, CA, USA, 1–5 July 2018; Elsevier: Amsterdam, The Netherlands, 2018; pp. 739–744, ISBN 9780444642417. [Google Scholar]
  97. Illner, M.; Kozachynskyi, V.; Esche, E.; Repke, J.-U. Fast-track realization of reactive microemulsion systems—Systematic system analysis and tailored application of PSE methods. Chem. Eng. Sci. 2022, 252, 117290. [Google Scholar] [CrossRef]
  98. Merchuk, J.C.; Andrews, B.A.; Asenjo, J.A. Aqueous two-phase systems for protein separation. Studies on phase inversion. J. Chromatogr. B Biomed. Sci. Appl. 1998, 711, 285–293. [Google Scholar] [CrossRef] [PubMed]
  99. Oliveira Filho, M.A.; Caldas, M.C.B.; Vasconcelos, L.T.C.D.P.; Ribeiro, V.T.; de Araújo, J.S.; de Padilha, C.E.; Sousa Junior, F.C.; dos Santos, E.S. Partitioning and recovery of an elongation factor (1-γ) of Leishmania infantum chagasi expressed in E. coli M15 with simultaneous endotoxin removal using aqueous two-phase system. Sep. Sci. Technol. 2020, 55, 1156–1166. [Google Scholar] [CrossRef]
  100. Silva, D.F.C.; Azevedo, A.M.; Fernandes, P.; Chu, V.; Conde, J.P.; Aires-Barros, M.R. Determination of aqueous two phase system binodal curves using a microfluidic device. J. Chromatogr. A 2014, 1370, 115–120. [Google Scholar] [CrossRef]
  101. Pedro, M.d.S.; Oliveira, L.A.F.; Padilha, C.E.d.A.; Santos, E.S.d.; de Oliveira, J.A.; Souza, D.F.d.S. Effect of flow patterns on bovine serum albumin and ampicillin partitioning using aqueous two-phase systems in microdevice. Sep. Purif. Technol. 2021, 254, 117592. [Google Scholar] [CrossRef]
  102. Kurnik, I.S.; Mussagy, C.U.; Pereira, J.F.B.; Lopes, A.M. Amphiphilic copolymer aqueous solutions with cholinium ionic liquids as adjuvants: New insights into determination of binodal curves and phase-separation mechanisms. J. Mol. Liq. 2020, 318, 114245. [Google Scholar] [CrossRef]
  103. Wypych, G. Handbook of Solvents; ChemTec: New York, NY, USA, 2001; ISBN 1895198240. [Google Scholar]
  104. Flick, E.W. Industrial Solvents Handbook, 5th ed.; Noyes Data Corp: Westwood, NJ, USA, 1998; ISBN 0815514131. [Google Scholar]
  105. Poling, B.E.; Prausnitz, J.M.; O’Connell, J.P. Properties of Gases and Liquids, 5th ed.; McGraw-Hill Education; McGraw Hill: New York, NY, USA, 2020; ISBN 9780071499996. [Google Scholar]
  106. Leblanc, G.E.; Secco, R.A.; Kostic, M. Viscosity Measurement: Measurement, Instrumentation, and Sensors Handbook; CRC Press: Boca Raton, FL, USA, 1999. [Google Scholar]
  107. Pina-Martinez, A.; Privat, R.; Jaubert, J.-N.; Peng, D.-Y. Updated versions of the generalized Soave α-function suitable for the Redlich-Kwong and Peng-Robinson equations of state. Fluid Phase Equilibria 2019, 485, 264–269. [Google Scholar] [CrossRef]
  108. Arashiro, E.Y.; Demarquette, N.R. Use of the pendant drop method to measure interfacial tension between molten polymers. Mat. Res. 1999, 2, 23–32. [Google Scholar] [CrossRef]
  109. Berry, J.D.; Neeson, M.J.; Dagastine, R.R.; Chan, D.Y.C.; Tabor, R.F. Measurement of surface and interfacial tension using pendant drop tensiometry. J. Colloid Interface Sci. 2015, 454, 226–237. [Google Scholar] [CrossRef] [PubMed]
  110. Kingery, W.D.; Humenik, M. Surface Tension at Elevated Temperatures. I. Furnace and Method for Use of the Sessile Drop Method; Surface Tension of Silicon, Iron and Nickel. J. Phys. Chem. 1953, 57, 359–363. [Google Scholar] [CrossRef]
  111. Staicopolus, D.N. The computation of surface tension and of contact angle by the sessile-drop method. J. Colloid Sci. 1962, 17, 439–447. [Google Scholar] [CrossRef]
  112. Bachmann, J.; Horton, R.; van der Ploeg, R.R.; Woche, S. Modified sessile drop method for assessing initial soil-water contact angle of sandy soil. Soil Sci. Soc. Am. J. 2000, 64, 564–567. [Google Scholar] [CrossRef]
  113. Zamora, J.M.; Marquez, R.; Forgiarini, A.M.; Langevin, D.; Salager, J.-L. Interfacial rheology of low interfacial tension systems using a new oscillating spinning drop method. J. Colloid Interface Sci. 2018, 519, 27–37. [Google Scholar] [CrossRef] [PubMed]
  114. Drelich, J.; Fang, C.; White, C.L. Measurement of Interfacial Tension in Fluid-Fluid Systems. Encycl. Surf. Colloid Sci. 2002, 3, 3158–3163. [Google Scholar]
  115. Du Noüy, P.L. A new apparatus for measuring surface tension. J. Gen. Physiol. 1919, 1, 521–524. [Google Scholar] [CrossRef] [Green Version]
  116. Della Volpe, C.; Siboni, S. The Wilhelmy method: A critical and practical review. Surf. Innov. 2018, 6, 120–132. [Google Scholar] [CrossRef] [Green Version]
  117. Gaonkar, A.G.; Neuman, R.D. The effect of wettability of wilhelmy plate and du Nou¨y ring on interfacial tension measurements in solvent extraction systems. J. Colloid Interface Sci. 1984, 98, 112–119. [Google Scholar] [CrossRef]
  118. Padday, J.F.; Russell, D.R. The measurement of the surface tension of pure liquids and solutions. J. Colloid Sci. 1960, 15, 503–511. [Google Scholar] [CrossRef]
  119. Bikerman, J.J. Physical Surfaces; Academic Press: New York, NY, USA, 1970; ISBN 9780323163040. [Google Scholar]
  120. Seeto, Y.; Puig, J.E.; Scriven, L.E.; Davis, H.T. Interfacial tensions in systems of three liquid phases. J. Colloid Interface Sci. 1983, 96, 360–372. [Google Scholar] [CrossRef]
  121. Messager, A.; Miracle-Sole, S.; Ruiz, J.; Shlosman, S. Interfaces in the Potts Model II: Antonov’s Rule and Rigidity of the Order Disorder Interface. Commun. Math. Phys. 1991, 140, 275–290. [Google Scholar] [CrossRef]
  122. Tadros, T.F. Emulsion Formation, Stability, and Rheology. In Emulsion Formation and Stability; John Wiley & Sons, Ltd.: Hoboken, NJ, USA, 2013; pp. 1–75. [Google Scholar]
  123. Psillakis, E. Vortex-assisted liquid-liquid microextraction revisited. TrAC Trends Anal. Chem. 2019, 113, 332–339. [Google Scholar] [CrossRef]
  124. Pacek, A.W.; Man, C.C.; Nienow, A.W. On the Sauter mean diameter and size distributions in turbulent liquid/liquid dispersions in a stirred vessel. Chem. Eng. Sci. 1998, 53, 2005–2011. [Google Scholar] [CrossRef]
  125. Hernandez-Alvarado, F.; Kalaga, D.V.; Turney, D.; Banerjee, S.; Joshi, J.B.; Kawaji, M. Void fraction, bubble size and interfacial area measurements in co-current downflow bubble column reactor with microbubble dispersion. Chem. Eng. Sci. 2017, 168, 403–413. [Google Scholar] [CrossRef]
  126. Selker, A.H.; Sleicher, C.A. Factors affecting which phase will disperse when immiscible liquids are stirred together. Can. J. Chem. Eng. 1965, 43, 298–301. [Google Scholar] [CrossRef]
  127. Rousseau, R.W. Handbook of Separation Process Technology; Wiley: New York, NY, USA; Chichester, UK, 1987; ISBN 9780471895589. [Google Scholar]
  128. Zhou, H.; Tang, X.; Zhu, Z.; Li, S. 0D Homogeneous Simulation of Droplet Size Evolution in a Turbulent Stirred Tank. Ind. Eng. Chem. Res. 2022, 61, 5632–5641. [Google Scholar] [CrossRef]
  129. Simmons, M.J.H.; Azzopardi, B.J. Drop size distributions in dispersed liquid-liquid pipe flow. Int. J. Multiph. Flow 2001, 27, 843–859. [Google Scholar] [CrossRef]
  130. Seibert, A.F.; Fair, J.R. Hydrodynamics and mass transfer in spray and packed liquid-liquid extraction columns. Ind. Eng. Chem. Res. 1988, 27, 470–481. [Google Scholar] [CrossRef]
  131. Kowalczuk, P.B.; Drzymala, J. Physical meaning of the Sauter mean diameter of spherical particulate matter. Part. Sci. Technol. 2016, 34, 645–647. [Google Scholar] [CrossRef]
  132. Khakpay, A.; Abolghasemi, H. The effects of impeller speed and holdup on mean drop size in a mixer settler with spiral-type impeller. Can. J. Chem. Eng. 2010, 88, 329–334. [Google Scholar] [CrossRef]
  133. Topuz, H.; Wilkinson, W.L. Droplet Size Correlation Modeling In Agitated Immiscible Liquid Systems. Int. J. Sci. Technol. Res. 2017, 6, 368–382. [Google Scholar]
  134. Hinze, J.O. Fundamentals of the hydrodynamic mechanism of splitting in dispersion processes. AIChE J. 1955, 1, 289–295. [Google Scholar] [CrossRef]
  135. Komogorov, A. On the breakage of drops in a turbulent flow. Dokl. Akad. Navk. SSSR 1949, 66, 825–828. [Google Scholar]
  136. Perry, R.H.; Green, D.W. Perry’s Chemical Engineers’ Handbook: Centrifugal Extractors, 8th ed.; McGraw-Hill: New York, NY, USA, 2008; ISBN 9780071422949. [Google Scholar]
  137. Angeli, P.; Hweitt, G.F. Drop size distributions in horizontal oil-water dispersed flows. Chem. Eng. Sci. 2000, 55, 3133–3143. [Google Scholar] [CrossRef]
  138. Wang, C.Y.; Calabrese, R.V. Drop breakup in turbulent stirred-tank contactors. Part II: Relative influence of viscosity and interfacial tension. AIChE J. 1986, 32, 667–676. [Google Scholar] [CrossRef] [Green Version]
  139. Thomas, J.A.; DeVincentis, B.; Wutz, J.; Ricci, F. Predicting the diameters of droplets produced in turbulent liquid–liquid dispersion. AIChE J. 2022, 68, e17667. [Google Scholar] [CrossRef]
  140. White, F.M. Fluid Mechanics, 7th ed.; McGraw-Hill Education: New York, NY, USA, 2011; ISBN 9780073529349. [Google Scholar]
  141. Komar, P.D.; Reimers, C.E. Grain Shape Effects on Settling Rates. J. Geol. 1978, 86, 193–209. [Google Scholar] [CrossRef]
  142. Jeelani, S.A.K.; Hartland, S. Prediction of steady state dispersion height from batch settling data. AIChE J. 1985, 31, 711–720. [Google Scholar] [CrossRef]
  143. Meon, W.; Rommel, W.; Blass, E. Plate separators for dispersed liquid-liquid systems: Hydrodynamic coalescence model. Chem. Eng. Sci. 1993, 48, 159–168. [Google Scholar] [CrossRef]
  144. Meon, W.; Blass, E. Drop Coalescence on Inclined Plates in Liquids. Chem. Eng. Technol. 1991, 14, 11–19. [Google Scholar] [CrossRef]
  145. Li, J.; Gu, Y. Coalescence of oil-in-water emulsions in fibrous and granular beds. Sep. Purif. Technol. 2005, 42, 1–13. [Google Scholar] [CrossRef]
  146. Shin, C.; Chase, G.G. Water-in-oil coalescence in micro-nanofiber composite filters. AIChE J. 2004, 50, 343–350. [Google Scholar] [CrossRef]
  147. Ergun, S. Fluid Flow Through Packed Columns. Chem. Eng. Prog. 1952, 48, 89–94. [Google Scholar]
  148. Koekemoer, A.; Luckos, A. Effect of material type and particle size distribution on pressure drop in packed beds of large particles: Extending the Ergun equation. Fuel 2015, 158, 232–238. [Google Scholar] [CrossRef]
  149. Bretney, E. Water Purifier. US Patent 453,105, 26 May 1891. [Google Scholar]
  150. Divakar, S.; Padaki, M.; Balakrishna, R.G. Review on Liquid-Liquid Separation by Membrane Filtration. ACS Omega 2022, 7, 44495–44506. [Google Scholar] [CrossRef]
  151. Kyotani, T.; Richter, H. Zeolite Membrane: From Microstructure to Separation Performance. Membranes 2022, 12, 176. [Google Scholar] [CrossRef] [PubMed]
  152. Hasegawa, Y.; Abe, C.; Ikeda, A. Pervaporative Dehydration of Organic Solvents Using High-Silica CHA-Type Zeolite Membrane. Membranes 2021, 11, 229. [Google Scholar] [CrossRef]
  153. Hasegawa, Y.; Matsuura, W.; Abe, C.; Ikeda, A. Influence of Organic Solvent Species on Dehydration Behaviors of NaA-Type Zeolite Membrane. Membranes 2021, 11, 347. [Google Scholar] [CrossRef]
  154. Mhatre, S.; Vivacqua, V.; Ghadiri, M.; Abdullah, A.M.; Al-Marri, M.J.; Hassanpour, A.; Hewakandamby, B.; Azzopardi, B.; Kermani, B. Electrostatic phase separation: A review. Chem. Eng. Res. Des. 2015, 96, 177–195. [Google Scholar] [CrossRef]
  155. Alexander, M. Biodegradation and Biomediation, 2nd ed.; Academic Press: San Diego, CA, USA, 1999; ISBN 9780120498611. [Google Scholar]
  156. Cláudio, A.F.M.; Marques, C.F.C.; Boal-Palheiros, I.; Freire, M.G.; Coutinho, J.A.P. Development of back-extraction and recyclability routes for ionic-liquid-based aqueous two-phase systems. Green Chem 2014, 16, 259–268. [Google Scholar] [CrossRef]
  157. Mai, N.L.; Ahn, K.; Koo, Y.-M. Methods for recovery of ionic liquids—A review. Process Biochem. 2014, 49, 872–881. [Google Scholar] [CrossRef]
  158. Rodríguez-Llorente, D.; Cañada-Barcala, A.; Álvarez-Torrellas, S.; Águeda, V.I.; García, J.; Larriba, M. A Review of the Use of Eutectic Solvents, Terpenes and Terpenoids in Liquid–liquid Extraction Processes. Processes 2020, 8, 1220. [Google Scholar] [CrossRef]
  159. El Achkar, T.; Greige-Gerges, H.; Fourmentin, S. Basics and properties of deep eutectic solvents: A review. Env. Chem. Lett. 2021, 19, 3397–3408. [Google Scholar] [CrossRef]
  160. Verdía Barbará, P.; Abouelela Rafat, A.; Hallett, J.P.; Brandt-Talbot, A. Purifying cellulose from major waste streams using ionic liquids and deep eutectic solvents. Curr. Opin. Green Sustain. Chem. 2023, 41, 100783. [Google Scholar] [CrossRef]
  161. Hooshmand, S.E.; Kumar, S.; Bahadur, I.; Singh, T.; Varma, R.S. Deep eutectic solvents as reusable catalysts and promoter for the greener syntheses of small molecules: Recent advances. J. Mol. Liq. 2023, 371, 121013. [Google Scholar] [CrossRef]
  162. Lee, K.M.; Quek, J.D.; Tey, W.Y.; Lim, S.; Kang, H.-S.; Quen, L.K.; Mahmood, W.A.W.; Jamaludin, S.I.S.; Teng, K.H.; Khoo, K.S. Biomass valorization by integrating ultrasonication and deep eutectic solvents: Delignification, cellulose digestibility and solvent reuse. Biochem. Eng. J. 2022, 187, 108587. [Google Scholar] [CrossRef]
  163. Hanada, T.; Goto, M. Cathode recycling of lithium-ion batteries based on reusable hydrophobic eutectic solvents. Green Chem 2022, 24, 5107–5115. [Google Scholar] [CrossRef]
  164. Panić, M.; Andlar, M.; Tišma, M.; Rezić, T.; Šibalić, D.; Cvjetko Bubalo, M.; Radojčić Redovniković, I. Natural deep eutectic solvent as a unique solvent for valorisation of orange peel waste by the integrated biorefinery approach. Waste Manag. 2021, 120, 340–350. [Google Scholar] [CrossRef] [PubMed]
  165. Stefanovic, R.; Ludwig, M.; Webber, G.B.; Atkin, R.; Page, A.J. Nanostructure, hydrogen bonding and rheology in choline chloride deep eutectic solvents as a function of the hydrogen bond donor. Phys. Chem. Chem. Phys. 2017, 19, 3297–3306. [Google Scholar] [CrossRef]
  166. Del Mar Contreras-Gámez, M.; Galán-Martín, Á.; Seixas, N.; da Costa Lopes, A.M.; Silvestre, A.; Castro, E. Deep eutectic solvents for improved biomass pretreatment: Current status and future prospective towards sustainable processes. Bioresour. Technol. 2023, 369, 128396. [Google Scholar] [CrossRef] [PubMed]
  167. Rout, A.; Wellens, S.; Binnemans, K. Separation of rare earths and nickel by solvent extraction with two mutually immiscible ionic liquids. RSC Adv. 2014, 4, 5753. [Google Scholar] [CrossRef] [Green Version]
  168. Riaño, S.; Binnemans, K. Extraction and separation of neodymium and dysprosium from used NdFeB magnets: An application of ionic liquids in solvent extraction towards the recycling of magnets. Green Chem. 2015, 17, 2931–2942. [Google Scholar] [CrossRef]
  169. Rim, K.T.; Koo, K.H.; Park, J.S. Toxicological Evaluations of Rare Earths and Their Health Impacts to Workers: A Literature Review. Saf. Health Work 2013, 4, 12–26. [Google Scholar] [CrossRef] [PubMed] [Green Version]
  170. Wang, L.; Liang, T. Accumulation and fractionation of rare earth elements in atmospheric particulates around a mine tailing in Baotou, China. Atmos. Environ. 2014, 88, 23–29. [Google Scholar] [CrossRef]
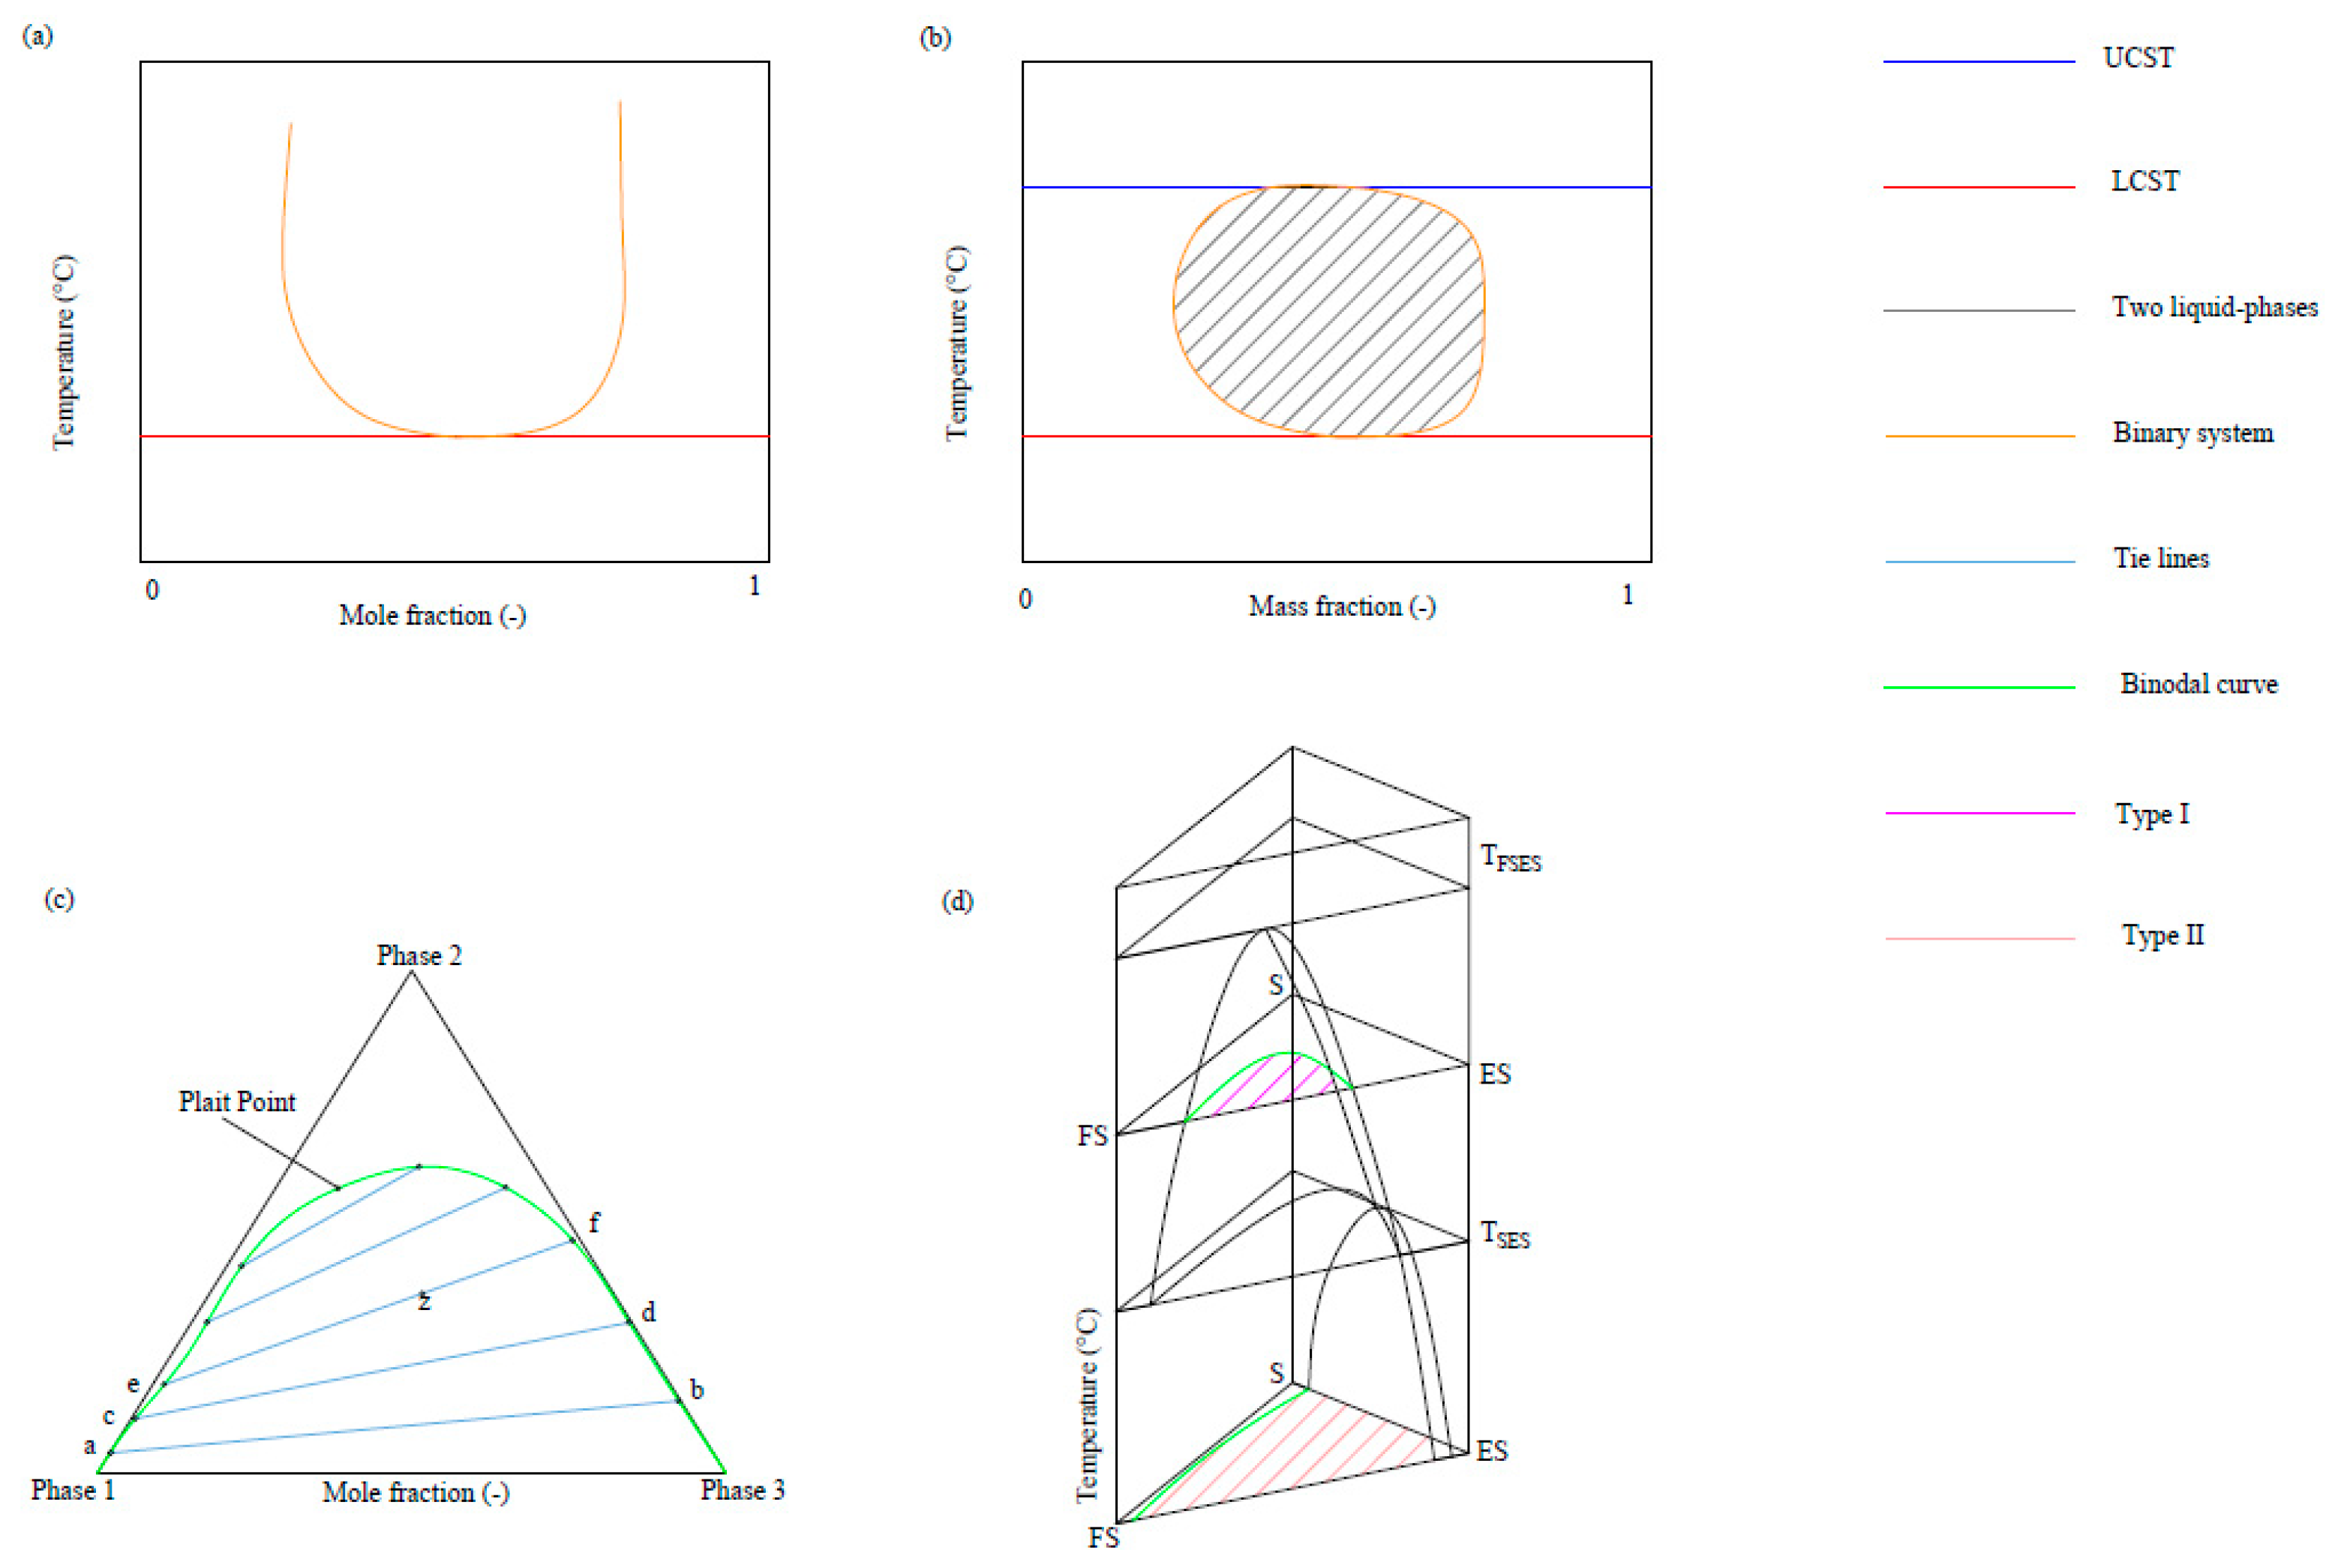
Figure 1. Phase diagrams: (a) a binary system exhibiting lower critical solution temperature (LCST). Adapted from [75]; (b) a binary system exhibiting both upper critical solution temperature (UCST) and lower critical solution temperature (LCST). Adapted from [75]; (c) a triangular plot for a ternary system with only one of the binary pairs exhibiting partial miscibility—type I. Adapted from [94]; (d) effect of temperature on ternary liquid–liquid equilibrium. Adapted from [95]. (FS, S, and ES are feed solvent, solute, and extraction solvent, respectively. TSES is the critical temperature of the solute and extraction-solvent binary, and TFSES is the critical temperature of the feed solvent and extraction-solvent binary.
Processes 11 01145 g001
Figure 2. Typical design of horizontal gravity decanters. The lines and arrows at the outlets and the top of the vessel represent vents to the atmosphere. Adapted from [28].
Processes 11 01145 g002
Figure 3. Vented decanters: (a) Vertical decanter with submerged feed. Adapted from [75]; (b) Horizontal decanter with feed entering from the top and a baffled quiescent zone. Adapted from [29].
Processes 11 01145 g003
Figure 4. Schematic coalescer. Adapted from [29].
Processes 11 01145 g004
Figure 5. Diagrams of (a) centripetal force, and (b) centrifugal force.
Processes 11 01145 g005
Figure 6. Tubular bowl. Adapted from [29].
Processes 11 01145 g006
Figure 7. Disc bowl. Adapted from [29].
Processes 11 01145 g007
Figure 8. Disc bowl. Adapted from [40].
Processes 11 01145 g008
Table 1. Shake test characterization [75].
TypeShake Test ObservationsInterfacial Tension *Density Difference *Viscosity of Each Phase *Presence of Fine Solids or Surfactants *
IDispersion band collapses within 5 min with crystal-clear liquids on top and bottomModerate to high, 10−6 N/m or higherΔρ > 100 kg/m³µ < 0.005 Ns/m2Negligible
IIDispersion band collapses within 10 to 20 min with clear liquids on top and bottomModerate, ~10−6 N/mΔρ > 100 kg/m³µ < 0.02 Ns/m2Negligible
IIIDispersion band collapses within 20 min but one or more phases remain cloudyLow to moderate,
(3–10)·10−7 N/m
Δρ > 50 kg/m³µ < 0.1 Ns/m2Might be present in low concentration
IVaStable dispersion is formed (dispersion band does not collapse within an hour or longer)—high viscosityLow to highΔρ > 100 kg/m³µ > 0.1 Ns/m2 in one of the phasesNegligible
IVbStable dispersion is formed—low interfacial tension<3·10−7 N/mΔρ > 100 kg/m³µ < 0.1 Ns/m2Negligible
IVcStable dispersion is formed—low density differenceLow to highΔρ < 50 kg/m³µ < 0.1 Ns/m2Negligible
IVdStable dispersion is formed—stabilized by surface-active components or solidsLowΔρ > 100 kg/m³µ < 0.1 Ns/m2Enough surfactant/solids to keep emulsion stable
* A sample is described by the shake test result (second column), not its physical properties. Physical properties are listed only as reference data.
Disclaimer/Publisher’s Note: The statements, opinions and data contained in all publications are solely those of the individual author(s) and contributor(s) and not of MDPI and/or the editor(s). MDPI and/or the editor(s) disclaim responsibility for any injury to people or property resulting from any ideas, methods, instructions or products referred to in the content.