Article

Enthalpic Determination of the Interaction of Modified Activated Carbons with Benzene and Hexane as Pure Solvents and Binary Mixtures

by
Diana Hernández-Monje
1,
Liliana Giraldo
1,
Jarosław Serafin
2,* and
Juan Carlos Moreno-Piraján
3,*
1
Departamento de Química, Facultad de Ciencias, Universidad Nacional de Colombia, Sede Bogotá, Carrera 30 No. 45-03, Bogotá 111321, Colombia
2
Department of Inorganic and Organic Chemistry, University of Barcelona, Martí i Franquès, 1-11, 08028 Barcelona, Spain
3
Grupo de Investigación en Sólidos Porosos y Calorimetría, Departamento de Química, Facultad de Cienicas, Universidad de los Andes, Bogotá 111711, Colombia
*
Authors to whom correspondence should be addressed.
Processes 2023, 11(4), 1144; https://doi.org/10.3390/pr11041144
Submission received: 24 February 2023 / Revised: 3 April 2023 / Accepted: 6 April 2023 / Published: 7 April 2023
(This article belongs to the Special Issue Production, Characterisation and Applications of Activated Carbon)

Abstract

:
Three activated carbons with different physicochemical characteristics are prepared and their N2 isotherms at 77 K and CO2 isotherms at 273 K are determined. The energetic interaction between three activated carbons with different physicochemical properties, and two hydrocarbons as pure liquids and as binary mixtures at different concentrations, was characterized by determining the enthalpy of immersion, in order to evaluate the effect of adsorbents and adsorbates, as well as that of the addition of another adsorbate to the system. For the pure solvents, the enthalpy of immersion (ΔHi) is higher for the aromatic compound (−94.98 to −128.80 J g−1) than for the aliphatic compound (−16.36 to −53.35 J g−1); for the mixtures, the values are between −36.39 and −98.37 J g−1, where the interaction increases with the solid that was subjected to thermal treatment and presented the lowest content of surface oxygenated groups, while the energetic parameter decreases with the solid that presents chemical modification with nitric acid, behavior that is evident in the pure solvents and in the mixtures. Activated carbons have a CO2 adsorption between 3.43 and 3.79 mmol g−1.

1. Introduction

Recent years have brought a rapid increase in population and civilization development. The consumer lifestyle, the use of resources, and continuous and dynamic technological developments have resulted in the rapid generation of municipal and industrial waste. Along with technological developments, the types and amounts of pollutants and chemicals introduced into the environment have changed. An increasingly serious problem is the progressive contamination of air, water and soil by compounds containing, i.a., carbon oxides, nitrogen and sulfur [1,2,3]. Heavy metals, plant protection products, fertilizers, organic dyes and surfactants can be found in water and soil environments [4,5,6]. The scale of this phenomenon does not allow for passivity and necessitates the development of better, more effective and environmentally friendly technologies that mitigate the effects of human activities. For this purpose, we are looking for adsorbents that will effectively remove impurities from the liquid and gas phases. One of the most widely used materials in the adsorption of gases and vapors is activated carbon, due to its suitable adsorbent properties and the capacity to modify and/or design its characteristics by pre- and post-preparation treatments. This is in order to obtain materials for increasingly specific uses, considering that activated carbon’s adsorption capacity depends on its surface chemistry and its construction; it has a large specific surface area, which is characterized by a high degree of reactivity, and a microporous structure with a given distribution and pore size [7].
The enthalpy of immersion is a thermodynamic parameter that determines the intensity of the interaction generated by the contact of a porous solid (activated carbon) with a given adsorbate. This interaction depends on the properties of the solid (surface chemistry and porous structure) and the liquid (molecular size and arrangement, affinity to the adsorbent, polarity, etc.). The enthalpy of immersion is determined by immersion calorimetry, which is a highly accurate and sensitive technique (in the order of 10 to 100 mJ), allowing the evaluation of solid–liquid and solid–gas interactions; it is also used to generate complementary information regarding adsorption isotherms from the gas and liquid phase [8,9].
Using the calorimetric technique, it is possible to record the energy exchange between the cell and the surroundings; the process is isothermal in nature, where the cell and the surroundings are at the same constant temperature. An isothermal immersion calorimeter is used to record these effects.
Isothermal calorimeters use a very small thermal resistance RT, and the heat capacity of the surroundings is infinitely large, so that the temperature of the surroundings, TA, and the temperature of the cell, TC, can remain constant over time, but no heat flow occurs. In real cases, there is a flow of energy between the cell and the surroundings, which is detected by thermal sensors located between them. This flow is due to the small temperature difference between TA and TC, the magnitude of which depends on the amount of heat released per unit of time, the thermal conductivities and geometry of the cell, and the type of insulation of the thermal sensors. Even though these temperatures differ, it is considered an isothermal process if each temperature remains constant throughout the process that causes the energy flow. The measurement results in a calorimetric curve containing two peaks: the first one is associated with immersion, cell rupture and sample wetting, and the second one is related to the electrical calibration of the calorimeter, which is performed by heating the system with electrical resistance. Once the calorimetric curves have been determined, the immersion enthalpy can be calculated, which is proportional to the area under the immersion peak curve.
The cell is connected to the surroundings through a thermal resistor RT which relates the heat flux dQ/dt to the temperature difference:
d Q d t = Δ T R T
and by integrating, we obtain
Q = 1 R T Δ T ( t ) d t
for the same amount of heat:
Δ T ( t ) R T = c o n s t a n t
Calculating RT (quantitatively associates the measured temperature difference with the corresponding heat flux) is complicated because of the complexity of heat conduction within the actual instrument, so it is determined by calibration. The reciprocal of the thermal resistance value is the calibration factor K(t):
Q = K Δ T ( t ) d t
Generally, the calibration factor can be assumed to be constant over the temperature range in which the reaction takes place.
In this paper, three granular CG activated carbons with different physiochemical properties, produced via chemical and thermal modifications, are studied. The solids have N2 and CO2 adsorption isotherms determined in order to establish the textural parameters that are subsequently correlated with the values of the enthalpy of immersion of the activated carbons in two nonpolar solvents, whose interaction with the surface of the solid is of a non-specific nature.

2. Materials and Methods

2.1. Activated Carbons

CG—corresponds to the starting sample from a commercial activated carbon prepared from coconut shell (GS50, Carbochem brand—Carbochem Inc., Philadelphia, PA, USA). The CG was sieved to a particle size of 1 mm and washed with distilled water, then dried for 24 h at 363 K and stored under a nitrogen atmosphere in properly sealed containers.
CO—CG chemically modified with a 6 M HNO3 solution for 6 h at boiling temperature (358 K).
COT—CO subjected to heat treatment for 1 h at 1023 K and 1.5 K min−1 in an inert atmosphere (N2).

2.2. Determination of Surface Area

The physical adsorption of nitrogen at 77 K in a commercial semi-automatic Autosorb 3B, Quantachrome sieve was used to determine the apparent surface area by means of the Brunauer-Emmett-Teller (BET) model. The samples were previously degassed at 473 K for 24 h.

2.3. Determination of Total Acidity, Total Basicity, Carboxylic, Lactonic and Phenolic Groups

A total of 100 mg of activated carbon was added to each of the 25 mL solutions of NaOH, Na2CO3, NaHCO3 and HCl 0.1 M. They were stirred for 5 days at 293 K. Later, 10 mL aliquot was taken from each of the solutions and titrated with HCl (NaOH, Na2CO3, NaHCO3) or NaOH (HCl), as previously standardized [10,11]. A Schott Instruments TitroLine alpha plus automatic titrator was used for the determinations.

2.4. Determination of the Enthalpy of Immersion of Activated Carbons in Solvents and Mixtures

A locally constructed heat conduction microcalorimeter was used. A total of 0.100 g of activated carbon was weighed and placed in a glass ampoule with a fragile spout, which was incorporated into the calorimetric system, which already contained 10 mL of the immersion liquid. The electrical potential was captured until a stable baseline was obtained. Then, the sample was immersed, and the increase in potential due to the wetting of the solid was recorded, which continued until it returned to the baseline, in order to perform the electrical calibration [10]. The enthalpy of immersion of the three activated carbons in pure solvents and in binary benzene–hexane mixtures was determined; hexane was the pure solvent, benzene was added so that the mole fraction was increased (0.2; 0.4; 0.6; 0.8, and finally, the enthalpy of immersion of the pure solute (benzene) was determined.

3. Results and Discussion

The adsorption isotherms of N2 at 77 K, respectively, for CG carbon and its modifications, CO and COT, are shown in Figure 1. Table 1 presents the results of the textural characterization obtained from the experimental adsorption data. Surface area (BET Area) was calculated via the BET model; the micropore volume (Vo) was estimated using the DR model; mesopore volume (VMeso) and total volume (VTotal) were calculated at saturation pressure; and the narrow microporosity (Vn) of the materials was evaluated by application of the DR model to the experimental CO2 adsorption data.
Table 1 also presents the characterization data for the acidity and total basicity of the activated carbons, which shows that chemical modification with nitric acid decreases the surface area and total basicity, but increases the acid character of the porous solid, whereas thermal modification increases the surface area and basicity of the carbonaceous material, while decreasing the total acidity. These modifications impact the surface chemistry more than the porous structure.
The activated carbons exhibit type I N2 adsorption isotherms, with a knee at low relative pressures, characteristic of microporous materials, which is in agreement with the pore volume values obtained by applying the Dubinin–Raduskevich model.
When analyzing the results obtained, it is observed that the sample subjected to the oxidation treatment with CO nitric acid shows a decrease in the value of the surface area and micropore volume (Vo), and an increase in the narrow microporosity; this is due to the fact that the oxidation treatment increases the formation of surface oxygenated groups located at the edges of the pore openings, which limits the accessibility of the nitrogen molecule to the porous structures. According to previous studies, acid groups—specifically, carboxylic acid and carbonyl that have been modified with HNO3—also show the collapse of porous structures, which explains the increase in the volume of mesoporosity [12].
The PSD of the three samples was calculated (Table 1). The experimental isotherms were adjusted to the QSDFT model for pores with a combined cylinder-slit geometry (as they had the lowest error percentage, between 0.25% and 0.06%). Figure 2 shows the variation of the pore volume as a function of the pore width obtained by the QSDFT model (slit-cylinder pore geometry) for the activated carbon samples, with a zoomed plot for the micropore area (upper right part).
Figure 2 shows that most of the porosity corresponds to micropores, confirming the information regarding the shapes of the isotherms (Figure 1) and the micropore volume (Table 1) mentioned above. In turn, it is evident that the PSD is similar for the samples, which is also consistent with the previously evaluated textural parameters; however, there are some small variations: the increase in temperature generated a slight widening of the pores of the CO sample, since a band between 1.0 and 1.4 nm is observed for the COT sample. In turn, it is also encouraging that the highest pore volume concentration is smaller than 1.0 nm, since this type of pore has a high adsorption potential that will increase the adsorbent-adsorbate interaction [13].
As the samples are mostly microporous, with pore widths smaller than 1.0 nm, they are also quite useful for CO2 adsorption, since a pore size of less than 1 nm is appropriate for the entrance of carbon dioxide to the porous structure [14,15], whereas a pore size bigger than 1 nm is undesirable for CO2 capture at low pressures, as the densely packed CO2 molecules may not be reached [16].
Since the adsorbate–adsorbent interaction is related to short-range attractive and repulsive forces, the process is strengthened when the adsorption takes place in small pores as the potential fields overlap. In such cases, adsorption is mostly due to volume-filling rather than surface covering; carbon dioxide adsorbed is in a liquid-like state when the interaction between CO2 and the samples is due to van der Waals forces [17,18,19,20].
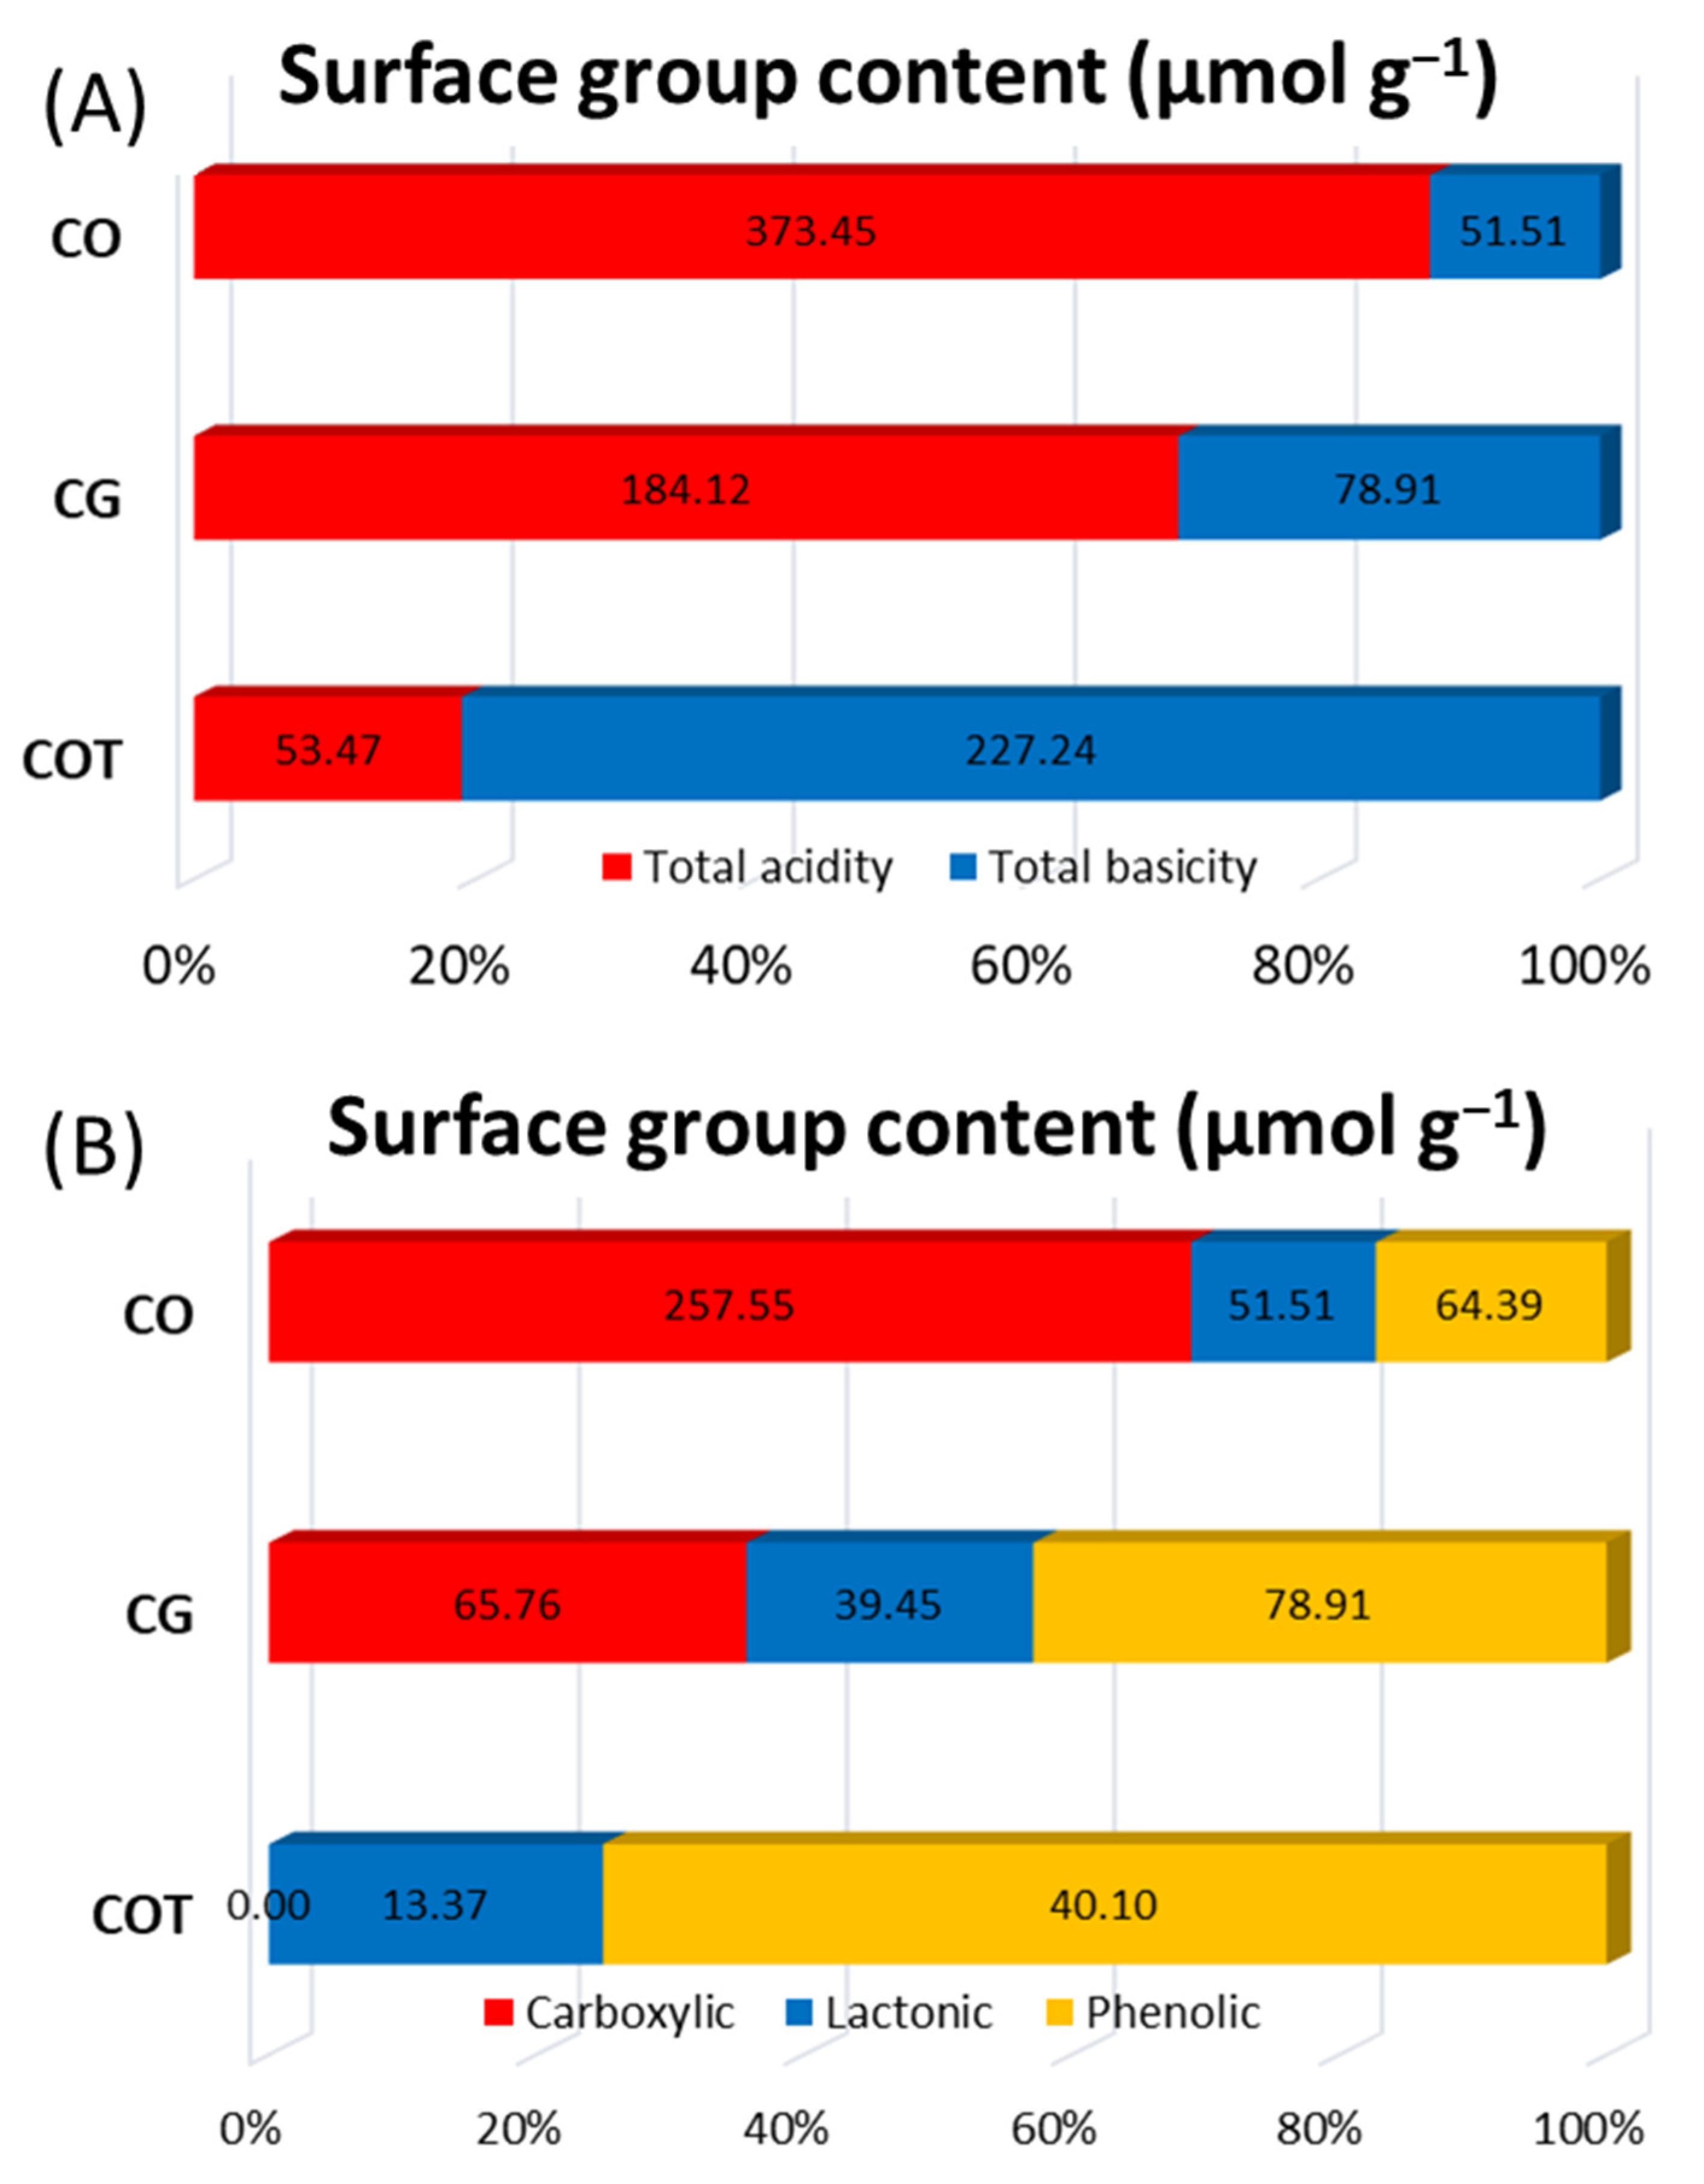
To characterize the surface chemistry of activated carbons, in addition to acidity and basicity, carboxylic, lactonic and phenolic groups were determined, as shown in Figure 3. More marked differences were found in the activated carbons with respect to the physical characterization. Regarding the total acidity, it is shown that the modification with HNO3 doubles the acidity of the starting sample, while the thermal modification decreases this parameter by approximately 71% compared to CG. Regarding the total basicity, when modifying CG with nitric acid, it decreases by approximately 35%, while subjecting the starting sample to heat treatment at 1023 K increases this parameter by almost three times.
Regarding the contents of the carboxylic, lactonic and phenolic groups, a marked difference is shown for the carboxylic groups CO and COT when compared with the CG sample, since for CO it increases nearly four times, while for COT it decreases by nearly four times, a change which is made imperceptible by the technique used. For the COT sample, the concentration of lactonic and phenolic groups decreases.
The above results may be due to the fact that the treatment with nitric acid increases the formation of carboxylic groups, since the oxidation of this type of solid can give rise to the formation of carbonyl groups and, in turn, generate the possibility of breaking the C-C bond of the aliphatic part with a ketone-type substituent in the α position, followed by an oxidation that would give rise to the formation of carboxylic acids [10,21,22,23]. This would explain the increase in acidity and the increase in the content of carboxylic groups. On the other hand, the increase in basicity for the COT sample and the decrease in the concentration of its surface groups is due to the fact that the heat treatment generates the selective removal of functional groups on the surface, making it more hydrophobic. It has also been found that this basic characteristic can be attributed to the presence of delocalized π electrons located in the graphene layers. Accordingly, it is expected that the CO sample would have a greater affinity with carbon dioxide, while the COT sample would increase the interaction with hydrocarbons, which will be evidenced through adsorption isotherms and immersion enthalpies.
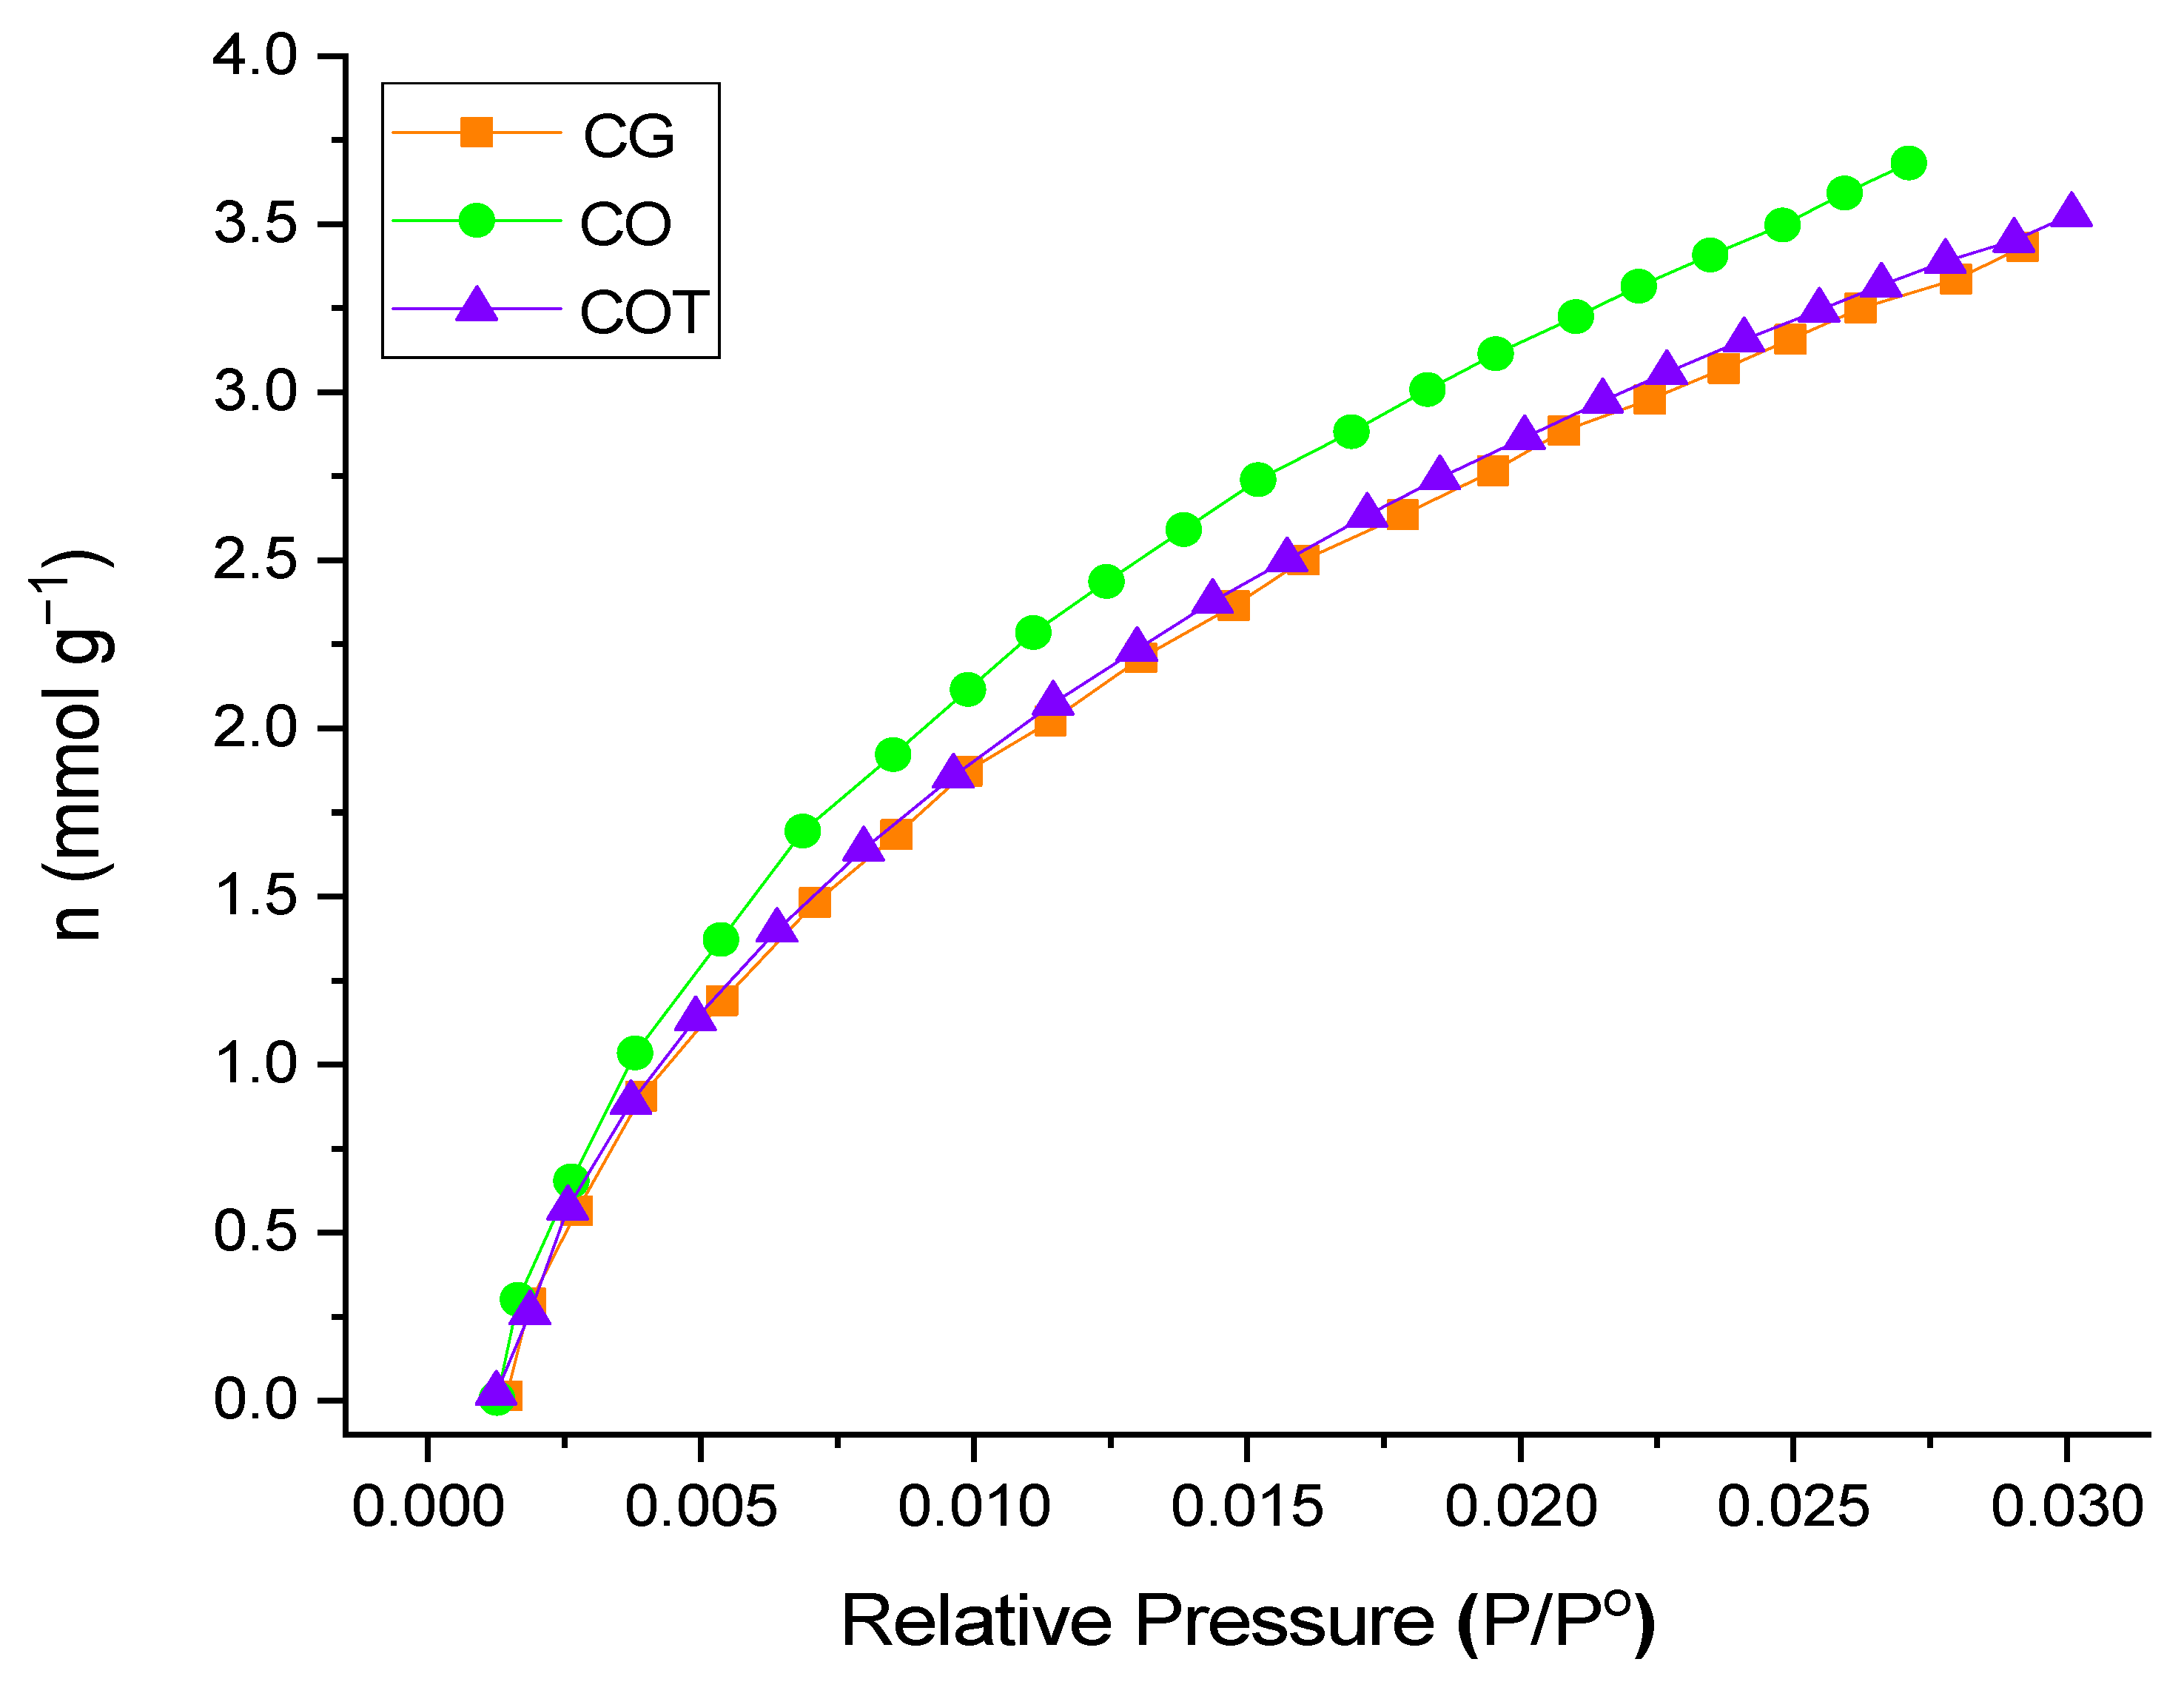
Figure 4 shows the CO2 adsorption isotherms obtained for the carbonaceous materials in this study. The isotherms obtained are Type I according to the IUPAC classification [6]. The CG and COT samples present similar adsorbed volumes; however, the increase in oxygen content increases CO2 adsorption. This behavior is related to the increase in the narrow microporosity (Vn) generated in the CO activated carbon. In the isotherms, it is observed that from a P/P° of 0.02, the adsorption capacity of the starting activated carbon CG and the modified COT present similar values in the adsorption of CO2 in relation to the samples, which can be attributed to the fact that in these samples the specific interactions are reduced [24]. On the other hand, the slight difference in the carbon dioxide adsorption capacity of the CO sample in relation to the other two samples (CG: 3.43 mmol g−1; CO: 3.79 mmolg−1; COT: 3.53 mmolg−1) may be due to the increase in heteroatoms, and, therefore, due to the increase in the hydrophilicity of the solid, which would suggest that this sample has a greater affinity with CO2, which can therefore be adsorbed in a slightly higher proportion on its porous structure.
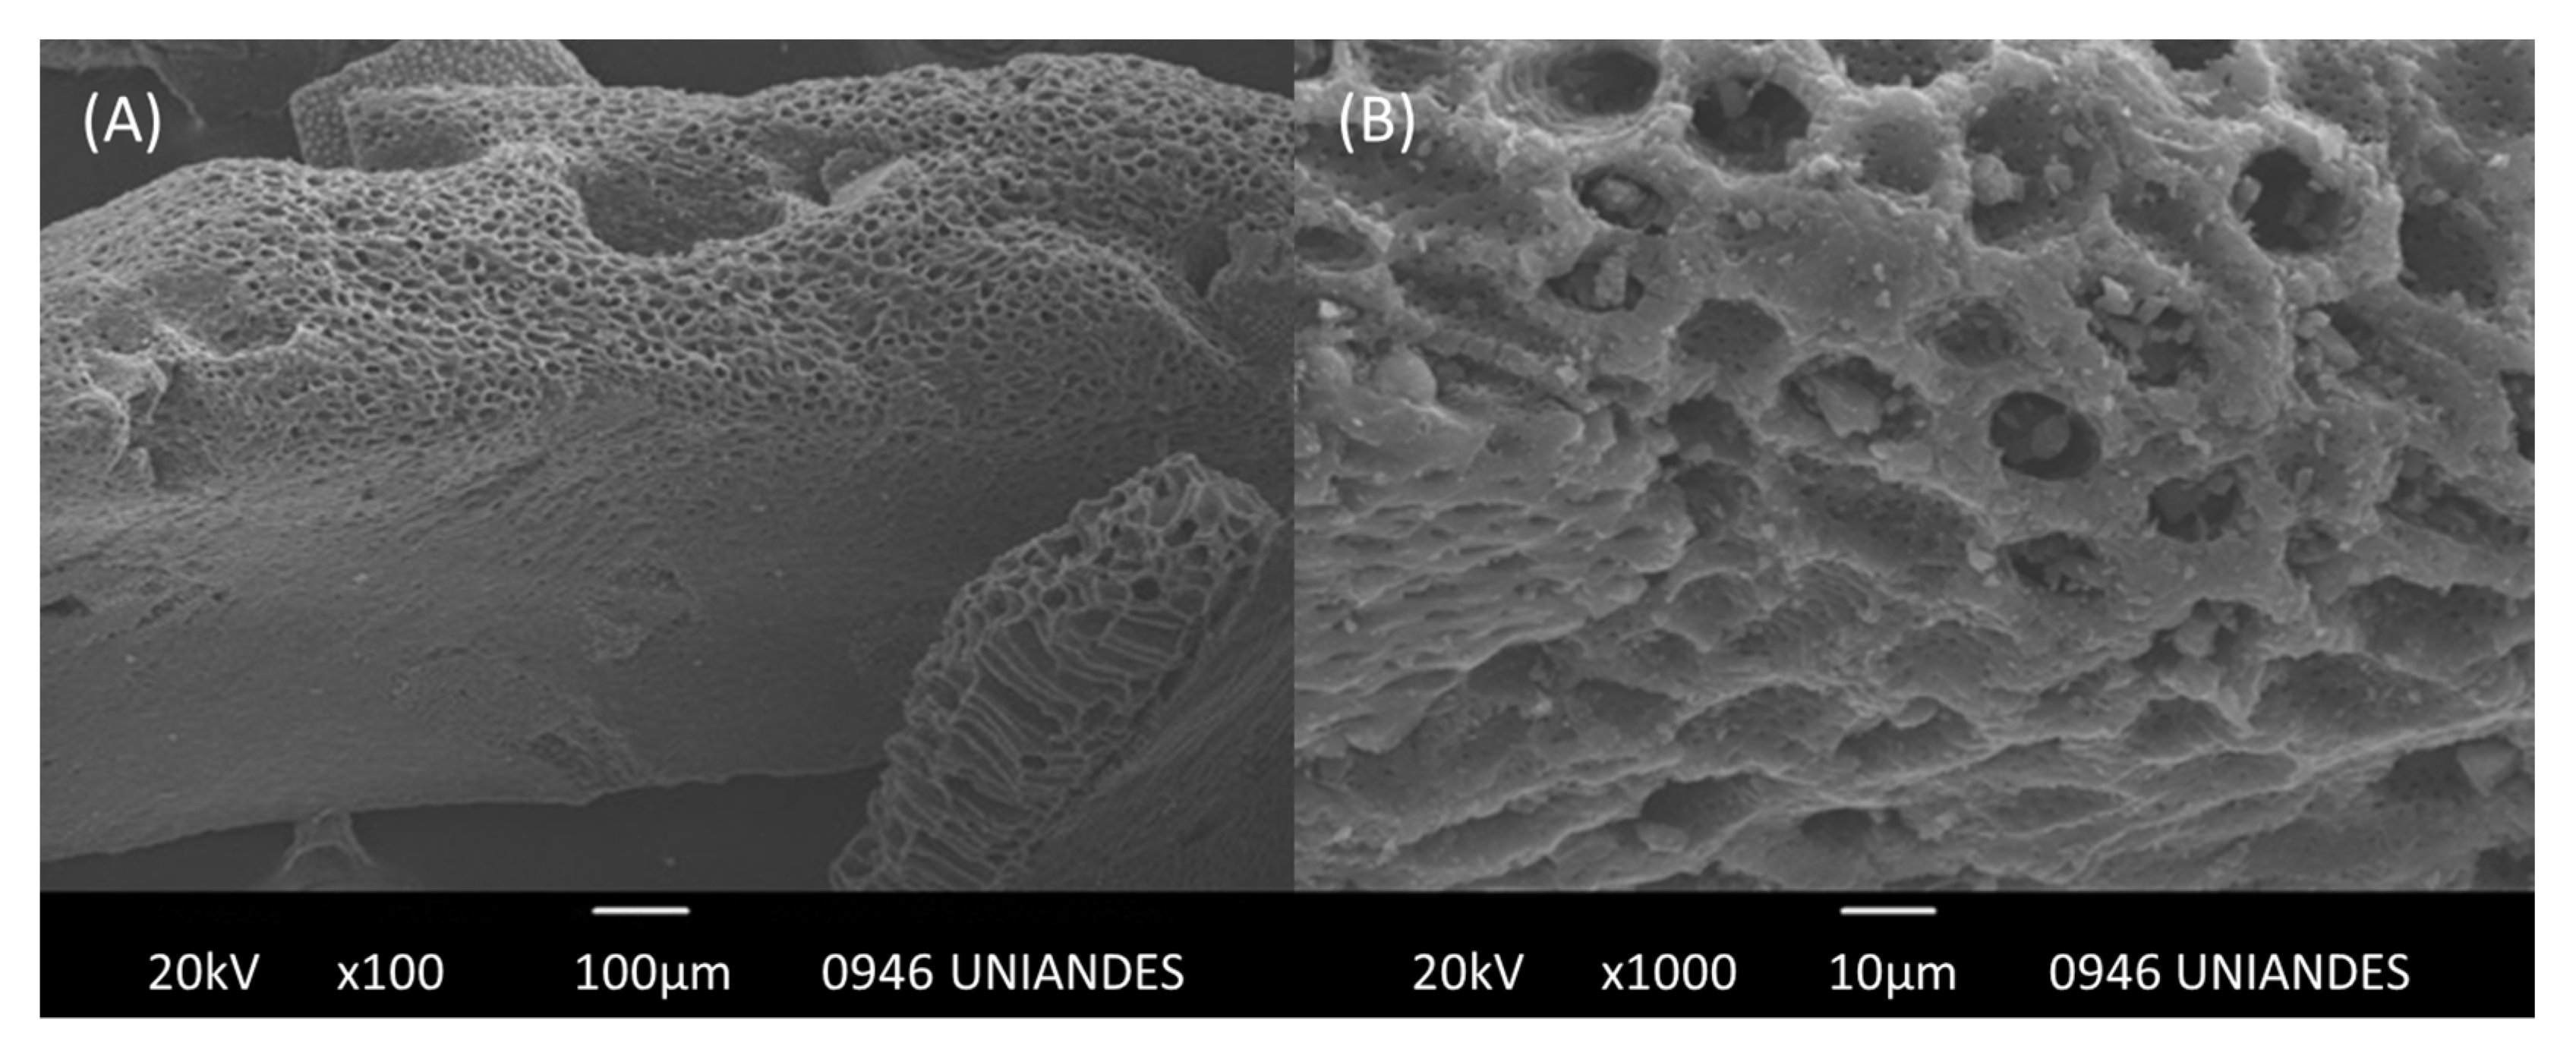
Figure 5 shows the images obtained by scanning electron microscopy (SEM) of the surface of the starting activated carbon (CG), and it can be observed that at a micrometric scale, the morphology of the external surface that presents cavities with a high degree of uniformity and roughness, with spaces of the order of 1 µm [25].
The photographs show the shapes and location of the macropores on the surface of the sample. Macropores are formed during activation by the effect of the oxidation gas, in this case CO2, and the loss of volatile material during pyrolysis, and increases diffusional processes [26].
Figure 6 shows the calorimetric curves of the immersion of activated carbons in pure solvents (benzene and hexane). Regarding the samples, the one that generates the largest area under the curve, and therefore the highest values of immersion enthalpy, is COT, since it has a larger surface area and a lower content of acid groups, which makes this solid more in tune with the apolar molecules under study. With respect to the adsorbates, the intensity of the interaction with all the samples is much higher for benzene, since it has a smaller molecular size (0.37 nm) than hexane (0.67 nm) and can generate interactions of the regions with high electronic density, located in the graphene layers with the π electrons of the molecule [7].
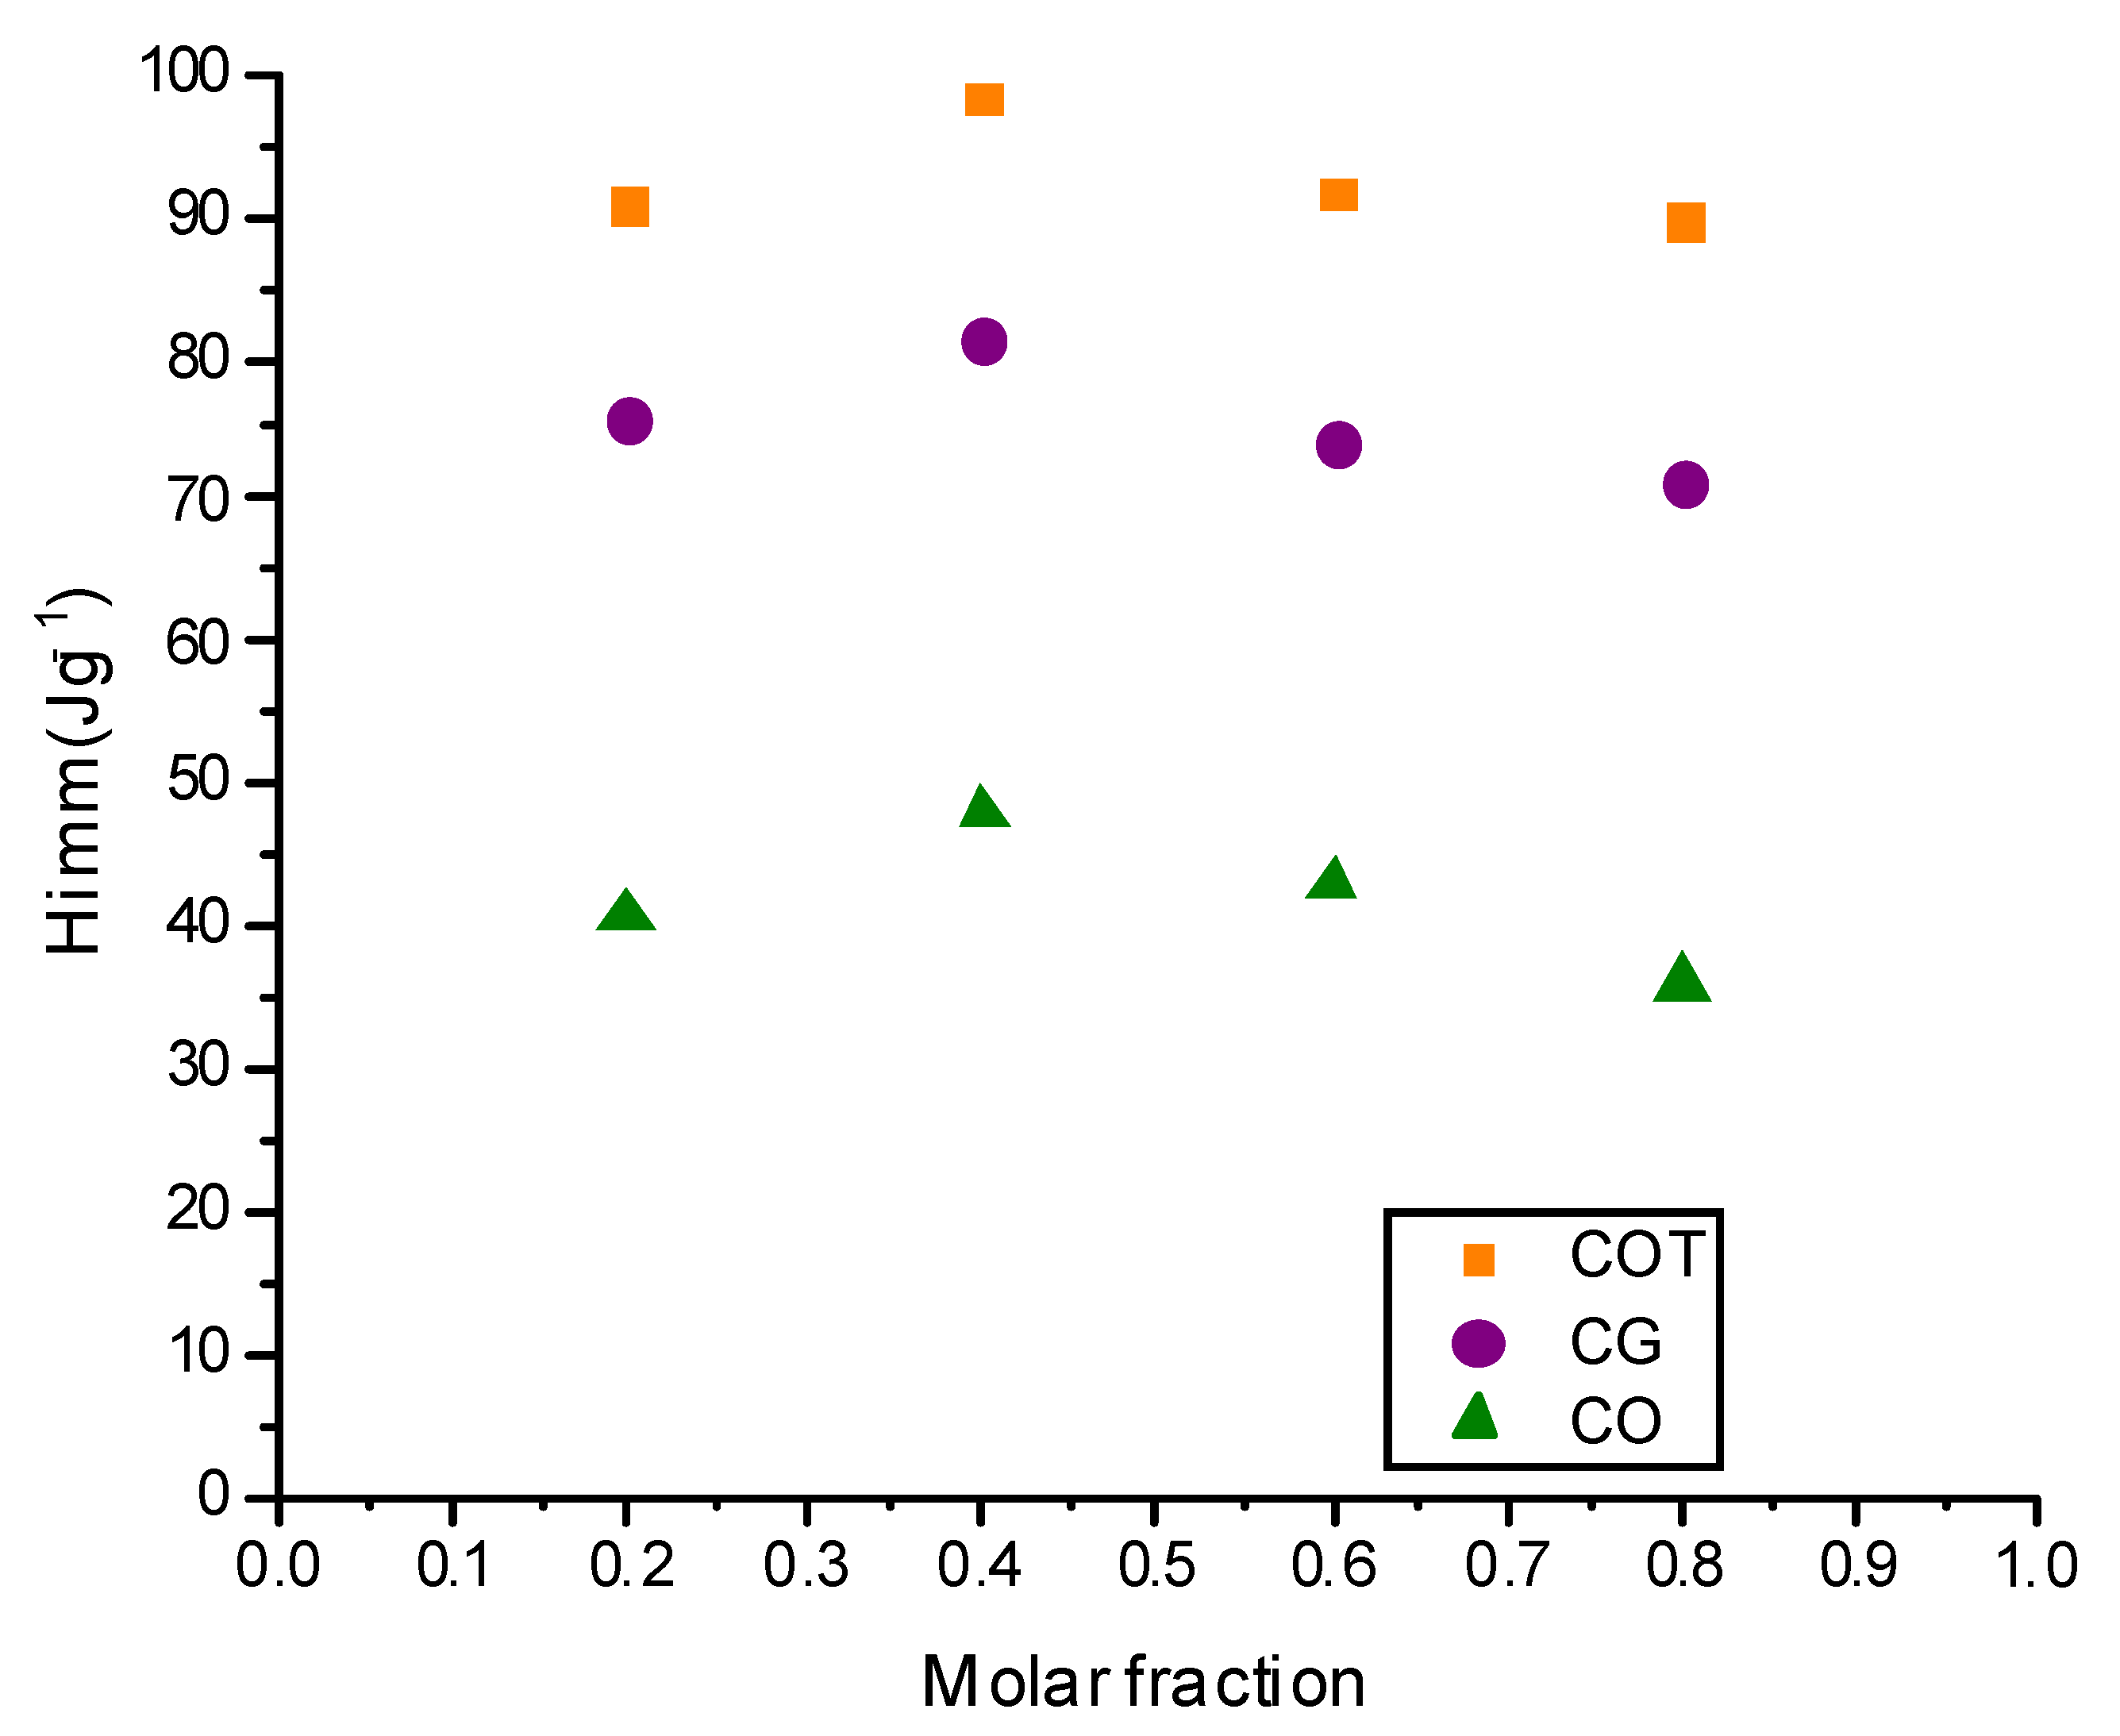
Table 2 and Figure 7 shows the values of the enthalpies of immersion of the three solids studied in benzene and hexane as pure solvents and as binary mixtures at concentrations between 0.2 and 0.8 mole fraction, with C6H14 as the solvent and C6H6 as the solute. For the pure solvents, as mentioned above, benzene presents a greater interaction than hexane; when the mixtures are made, it is evident that in the whole range of concentrations, the enthalpies of immersion increased between 1.7 and 3 times their value when benzene was added. This is in contrast to the enthalpy of immersion of the pure solvent (hexane), where the maximum value is found at a concentration of 0.4 mole fraction. This may be because the addition of a molecule containing π electrons, which can interact with the activated carbon structure, increases the possibility of creating dipole moments, which increases the interaction between the components of the system, especially in the COT sample, since when the activated carbon is treated at high temperatures, the removal of the oxygenated groups increases the specific interactions between such graphene layers with the aromatic rings [27].
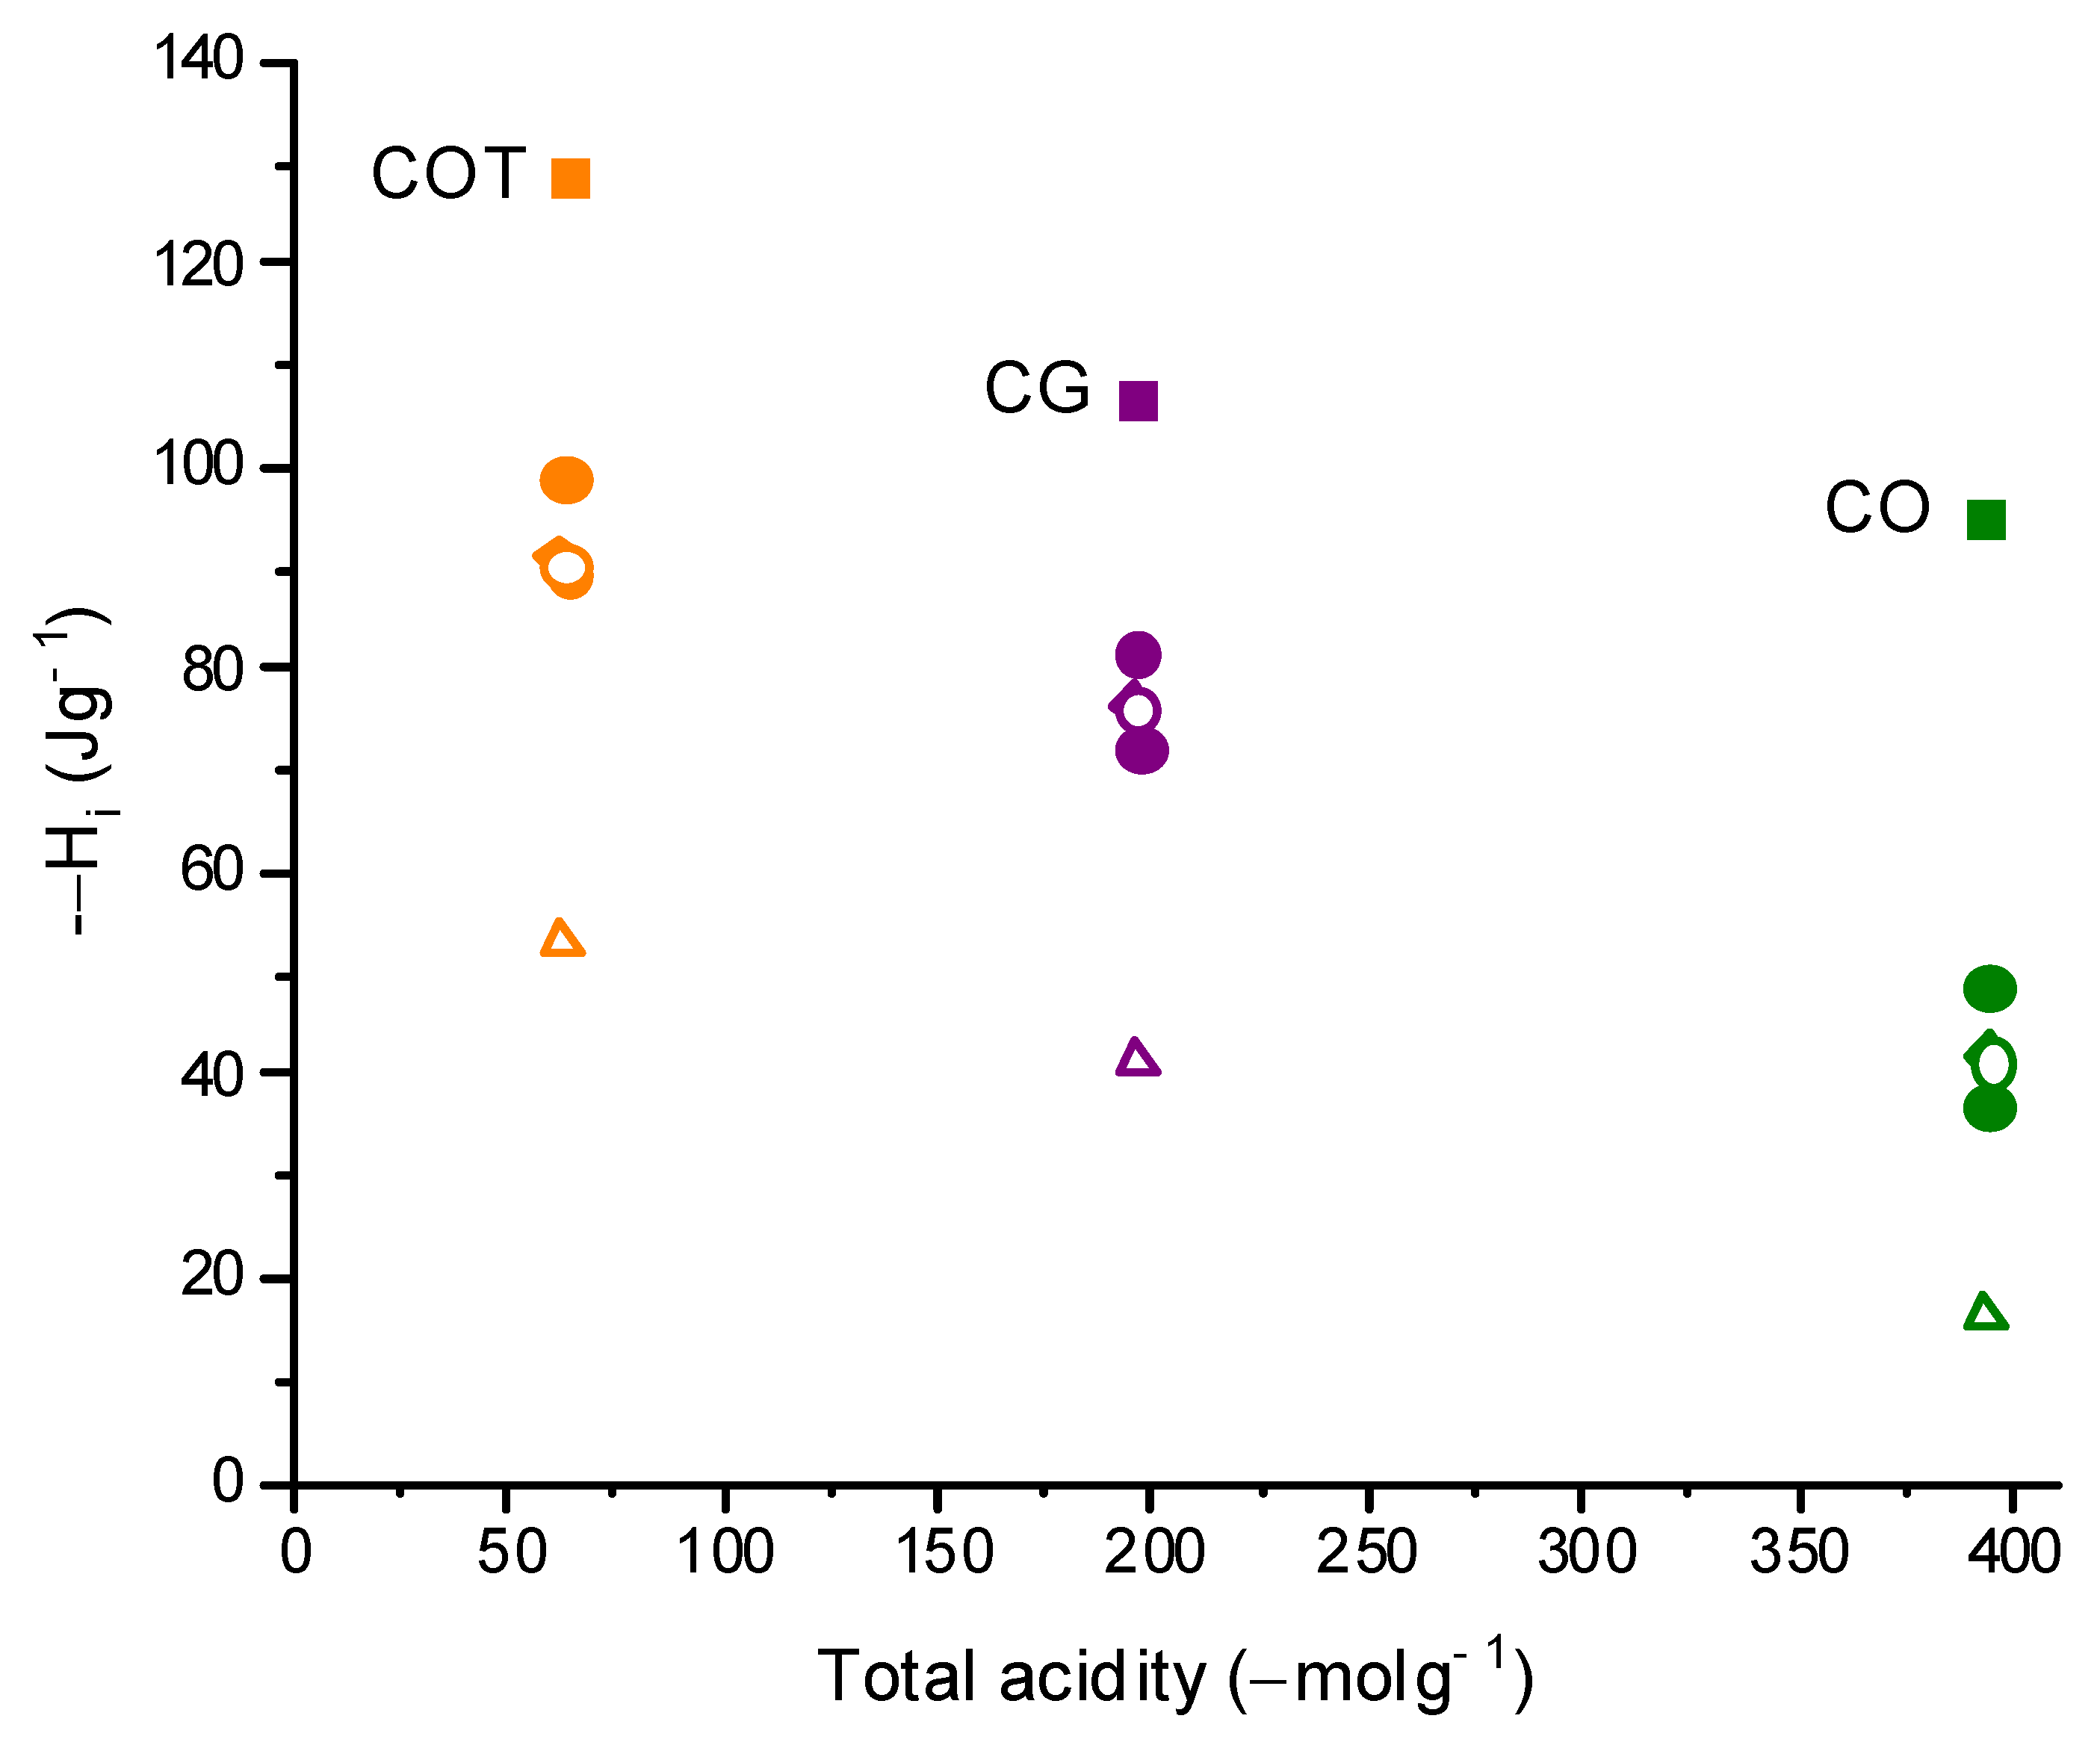
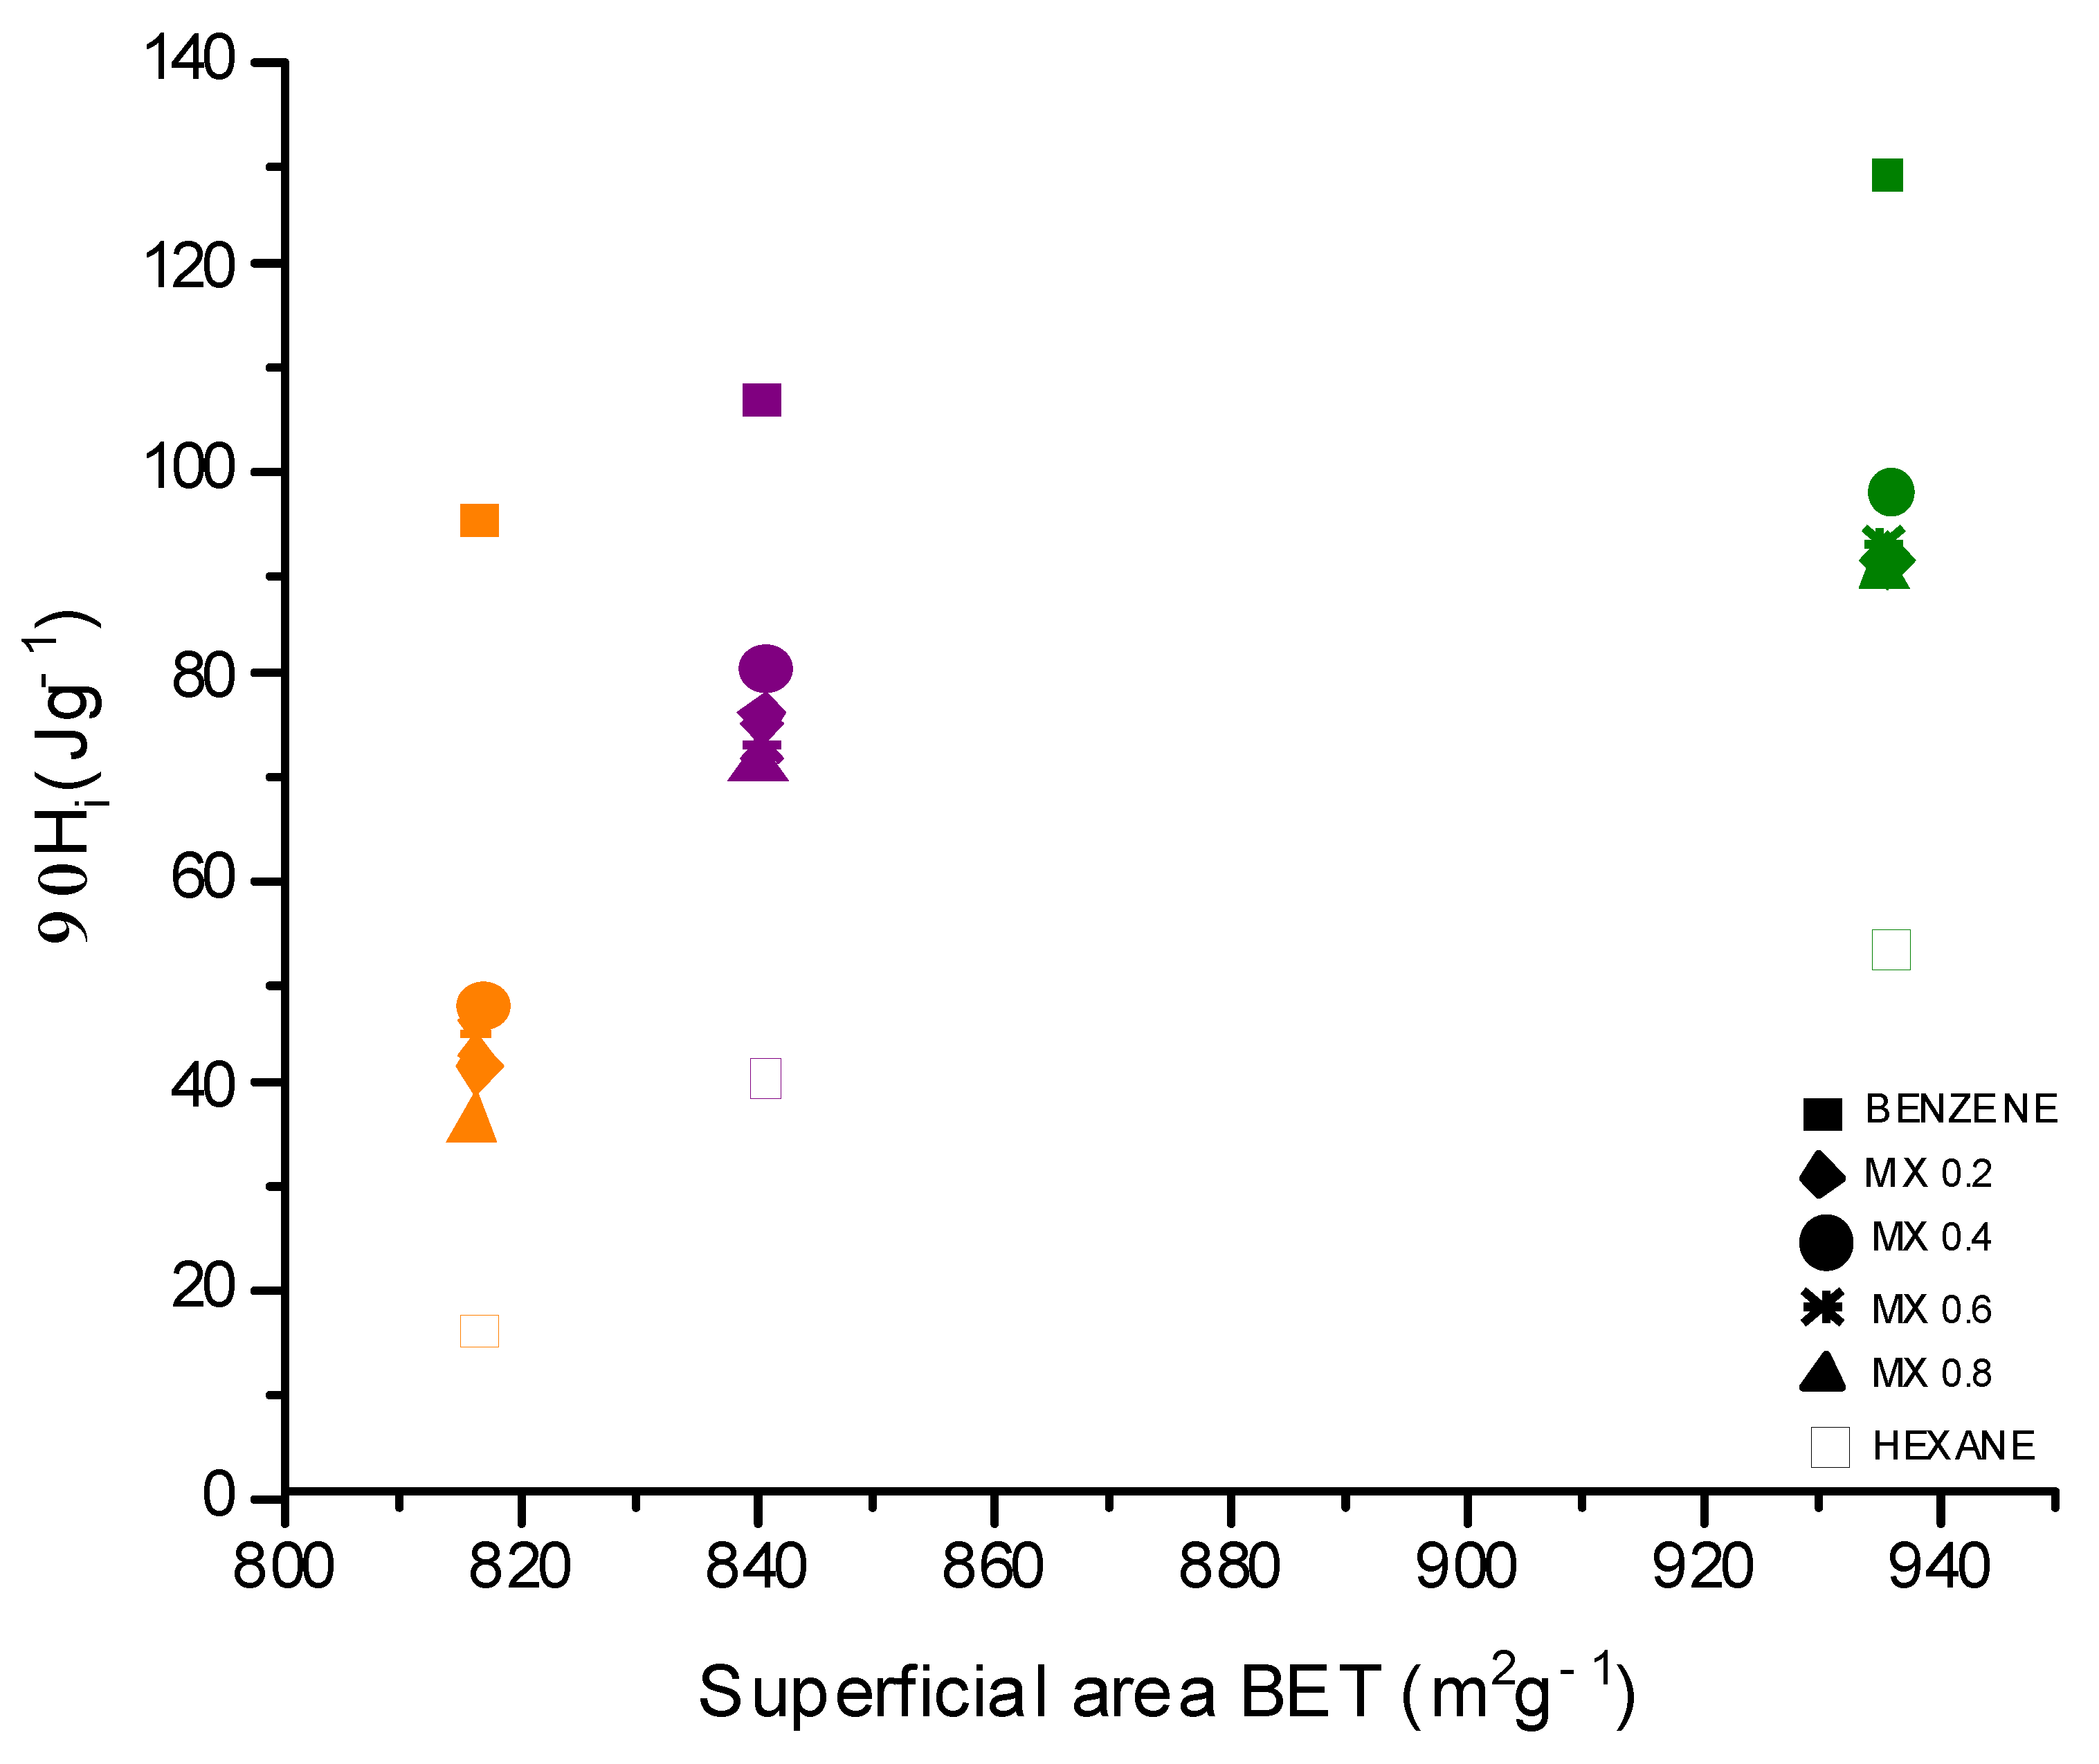
Figure 8 and Figure 9 show the relationship between a property of the surface chemistry (total acidity) and a property of the pore structure (surface area) with the immersion enthalpies. With acidity, an inversely proportional relationship is presented because the presence of this type of group decreases the hydrophobicity of the carbon and, therefore, the dispersive type interactions, while the removal of heteroatoms due to temperature (COT sample) and the increase of π electrons (an increase of benzene concentration) increase the non-specific interactions between the activated carbon and the hydrocarbons evaluated [25]. As for the surface area, a directly proportional relationship is shown as if there is more space available for the adsorbate to enter, the number of molecules entering the porous network will increase and, therefore, the interaction between the activated carbon and the study solvents will increase [28].
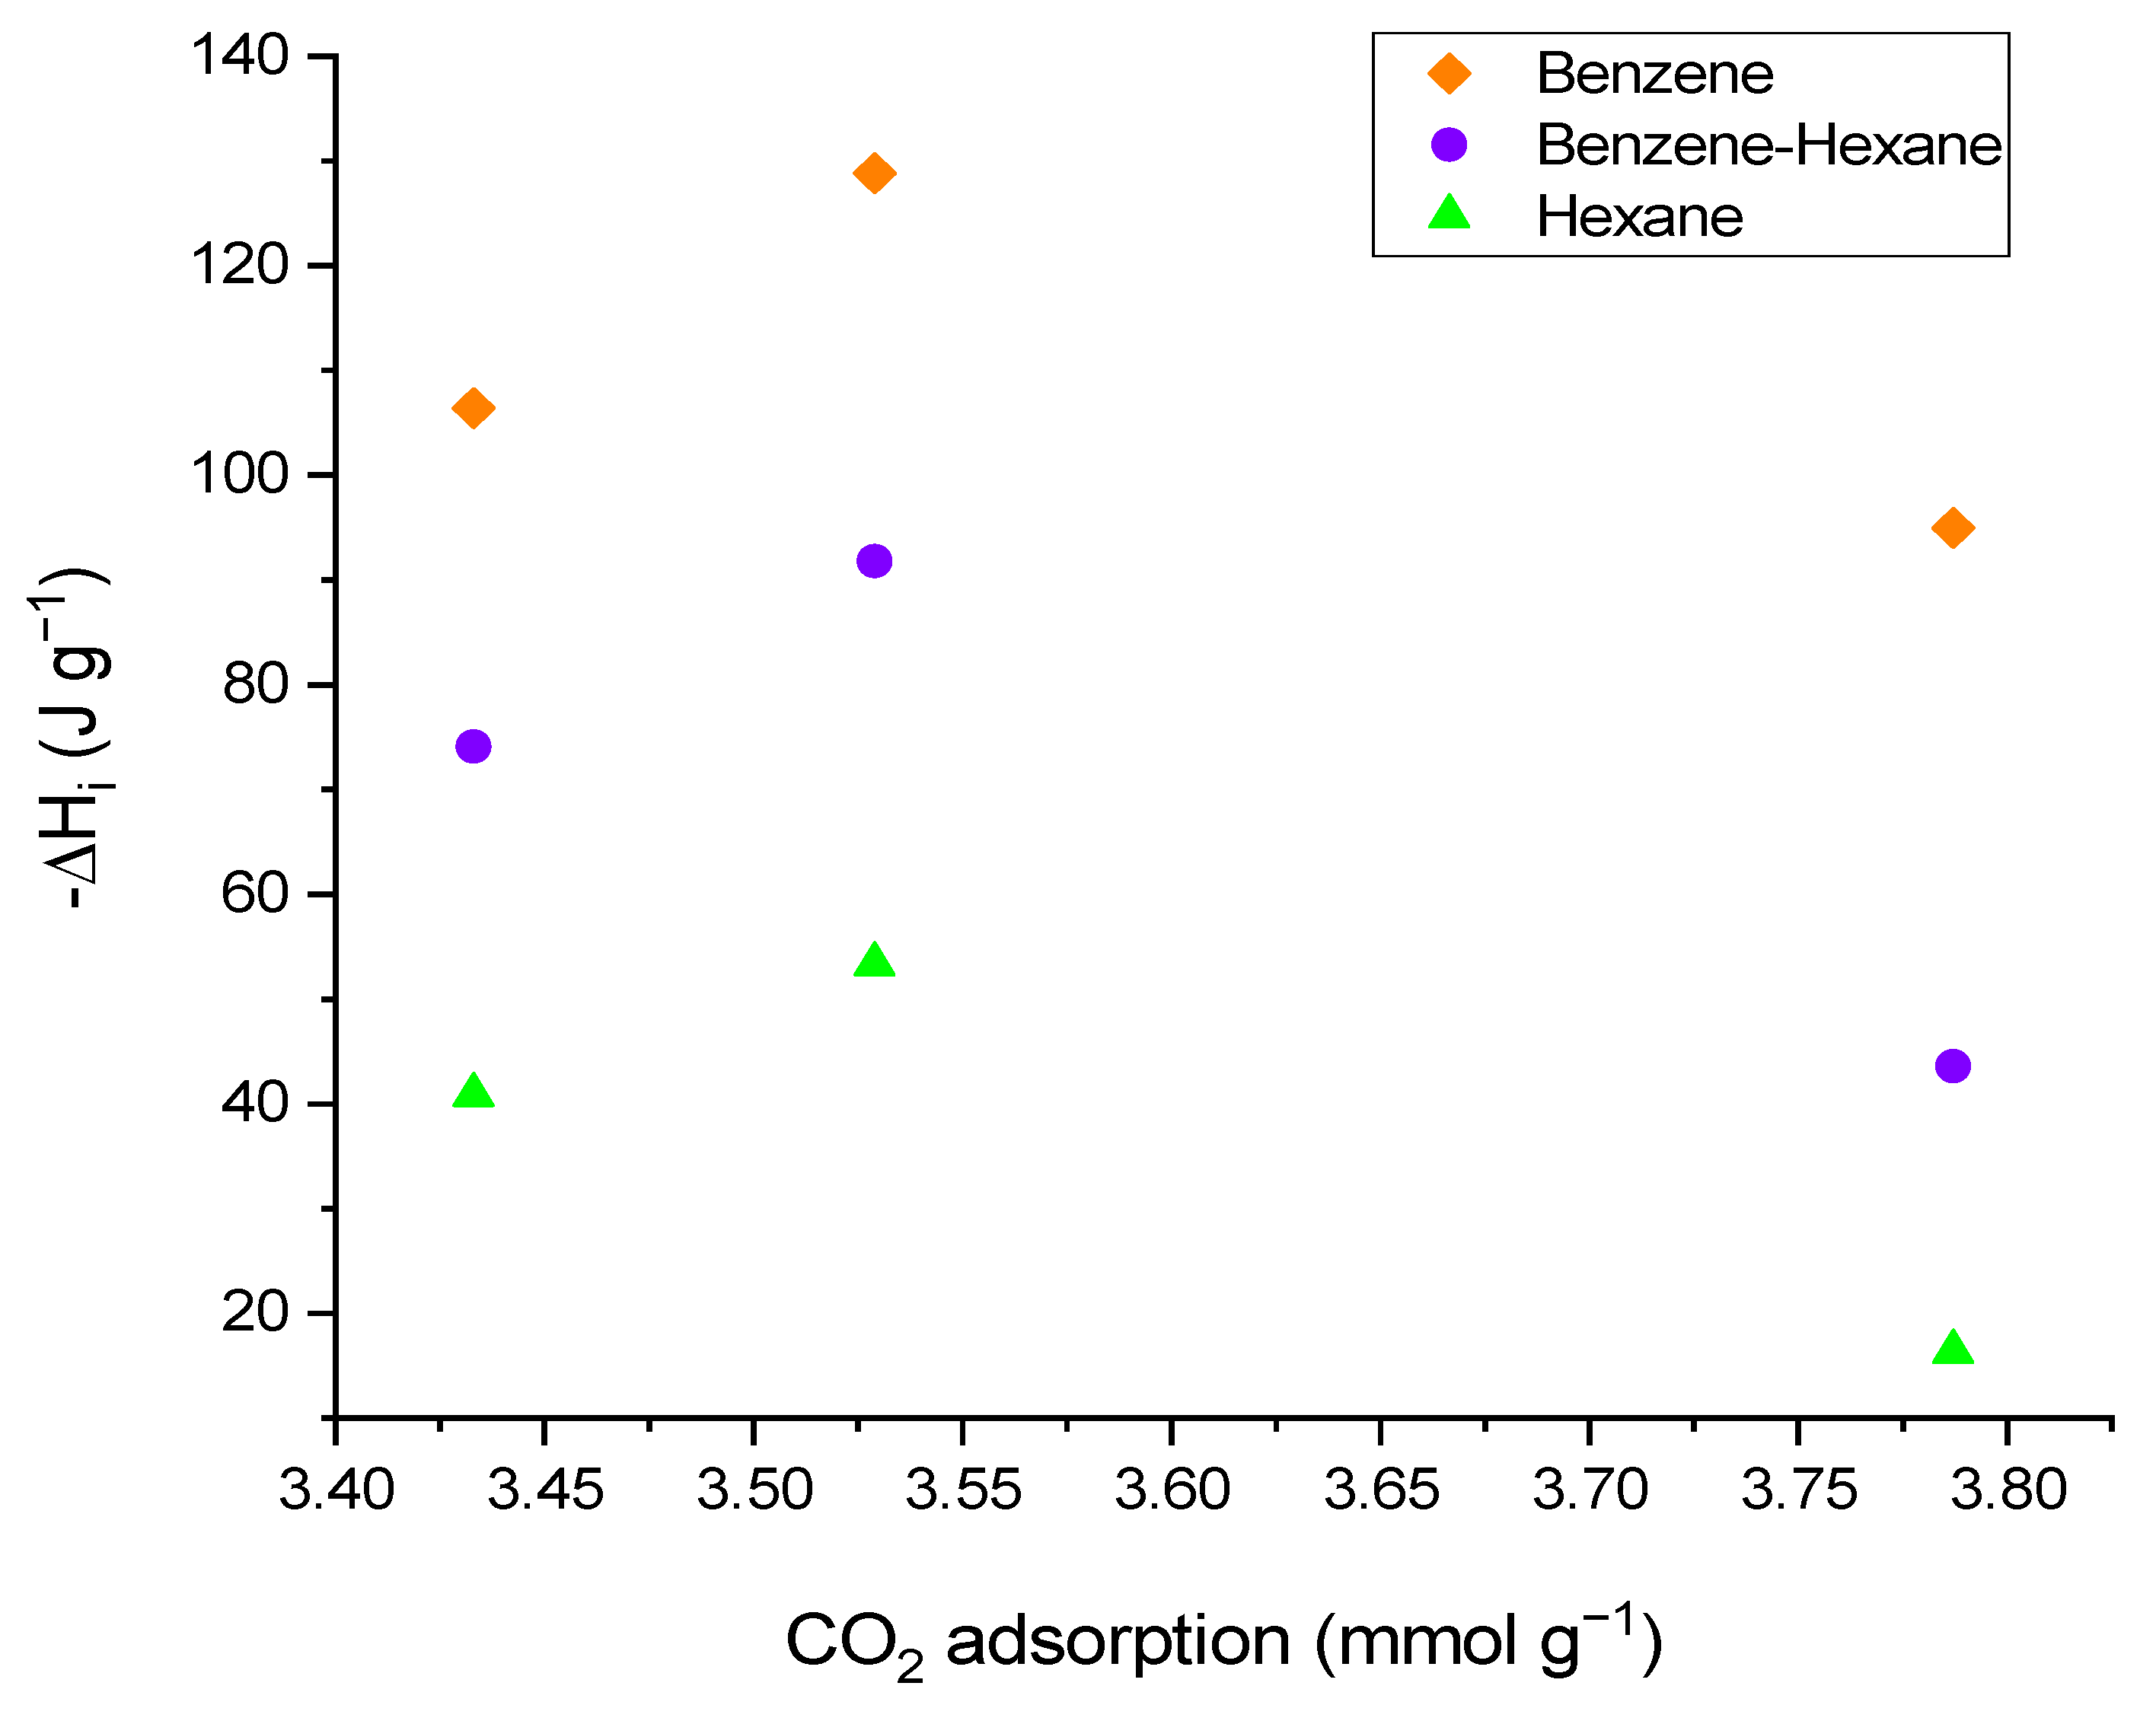
Finally, a relationship is established between the enthalpy of immersion of the activated carbons in the two apolar solvents, benzene and hexane, the intermediate concentration mixture of 0.6 mole fraction of the two solvents, and the CO2 adsorption capacity on the three solids. As the enthalpy of immersion indicates the specific interaction between the solid and the immersion liquid, higher values of this property are observed when the solids come into contact with benzene and, in turn, the property decreases with increasing content of surface groups on the activated carbon [29].
Figure 10 shows the relationship mentioned and demonstrates how the activated carbons CG and COT have the same CO2 adsorption value, as shown in Figure 4. The activated carbon CO in which the oxygen content has the highest value for the three solids has a CO2 adsorption with a value of 3.8 mmol/g, i.e., the interaction with the surface chemical groups increases the adsorption of the gas. This result is interesting because the solid–liquid energy interaction is an indication of how the solid can interact with CO2, which is the molecule to be adsorbed on the gas phase solids [20].

4. Conclusions

The enthalpy of immersion is affected by the properties of the adsorbent and the adsorbate due to the intensity of the interaction in the system. The interaction is increased if the solid has a low content of oxygenated groups and a higher surface area. Concerning pure solvents, the enthalpy of immersion increases if the adsorbate has a smaller molecular size since it can more easily enter the porous structure. If an aromatic compound (benzene) is compared with an open-chain aliphatic compound (hexane), the energy exchange is greater with the former, since the presence of π electrons increases dispersive-type interactions and can help to generate dipole moments in the regions of high electronic density. Thus, the addition of benzene to hexane also increases the values of the enthalpy of immersion, since the contribution of the aromatic compound to the mixture is present in the process of immersion of the solid.
The relationship between the immersion enthalpy and the CO2 adsorption capacity of the solids leads to the fact that the solids with a lower specific interaction with a nonpolar solvent are the ones with higher CO2 adsorption, which increases with the presence of oxygen groups on the surface.
Regarding the amount of CO2 adsorbed in all the samples, similar values were presented with a slight increase for the adsorption on the CO sample, probably due to its higher content of oxygenated groups. In the interactions between the hydrocarbons and the samples, there are more noticeable differences according to the immersion enthalpy values, probably because activated carbons are mainly hydrophobic in nature, therefore, when modifications are made that increase the number of heteroatoms, the adsorbent–adsorbate affinity can be diminished, as well as the interaction between them.

Author Contributions

Conceptualization and methodology: D.H.-M., L.G., J.S. and J.C.M.-P.; validation, D.H.-M., L.G., J.S. and J.C.M.-P.; formal analysis: D.H.-M., L.G., J.S. and J.C.M.-P.; investigation: D.H.-M., and L.G.; writing—original draft preparation: D.H.-M., L.G., J.S. and J.C.M.-P.; writing—review and editing: L.G., J.S. and J.C.M.-P.; project administration: L.G. and J.C.M.-P.; funding acquisition: L.G. and J.C.M.-P. All authors have read and agreed to the published version of the manuscript.

Funding

Prof. Dr. Juan Carlos Moreno-Piraján acknowledges the Facultad de Ciencias of Universidad de los Andes for grant No. INV-2021-128-2257, and the Colciencias Scholarship “Doctorados Nacionales 2016” Convocation 757.

Data Availability Statement

The data sets presented in this study are available upon reasonable request to the corresponding author, indicated on the first page.

Acknowledgments

The authors are grateful to the Framework Agreement between the Universidad de Los Andes and the Universidad Nacional de Colombia, as well as to the agreement established by the departments of chemistry of both universities; also, to the call 757 for National Doctorates of Colciencias. The authors acknowledge the framework agreement between Universidad Nacional de Colombia and Universidad de los Andes (Bogotá, Colombia) under which this work was carried out.

Conflicts of Interest

The authors declare no conflict of interest. The funders had no role in the design of this study; in the collection, analyses or interpretation of data; in the writing of the manuscript; or in the decision to publish the results.

References

  1. Foo, K.Y.; Hameed, B.H. An overview of landfill leachate treatment via activated carbon adsorption process. J. Hazard. Mater. 2009, 171, 54–60. [Google Scholar] [CrossRef] [PubMed]
  2. Friedlingstein, P.; O’Sullivan, M.; Jones, M.W.; Andrew, R.M.; Gregor, L.; Hauck, J.; Le Quéré, C.; Luijkx, I.T.; Olsen, A.; Peters, G.P.; et al. CO₂ and Greenhouse Gas Emissions. Our World Data 2020, 14, 3269–3340. [Google Scholar] [CrossRef]
  3. Cruz, O.F.; Campello-Gómez, I.; Casco, M.E.; Serafin, J.; Silvestre-Albero, J.; Martínez-Escandell, M.; Hotza, D.; Rambo, C.R. Enhanced CO₂ capture by cupuassu shell-derived activated carbon with high microporous volume. Carbon Lett. 2022, 1–9. [Google Scholar] [CrossRef]
  4. Chen, Y.-H.; Huang, P.-J. Sono-assisted rapid dye removal by chromium-based metal organic frameworks derived from waste PET bottles: Characterization, kinetics and adsorption isotherms. J. Environ. Chem. Eng. 2021, 9, 106766. [Google Scholar] [CrossRef]
  5. Kafle, A.; Timilsina, A.; Gautam, A.; Adhikari, K.; Bhattarai, A.; Aryal, N. Phytoremediation: Mechanisms, plant selection and enhancement by natural and synthetic agents. Environ. Adv. 2022, 8, 100203. [Google Scholar] [CrossRef]
  6. Kwiatkowski, M.; Fierro, V.; Celzard, A. Confrontation of various adsorption models for assessing the porous structure of activated carbons. Adsorption 2019, 25, 1673–1682. [Google Scholar] [CrossRef] [Green Version]
  7. Wang, G.; Dou, B.; Zhang, Z.; Wang, J.; Liu, H.; Hao, Z. Adsorption of benzene, cyclohexane and hexane on ordered mesoporous carbon. J. Environ. Sci. 2015, 30, 65–73. [Google Scholar] [CrossRef]
  8. Rouquerol, J.; Rouquerol, F.; Llewellyn, P.; Maurin, G.; Sing, K.S.W. Adsorption by Powders and Porous Solids: Principles, Methodology and Applications, 2nd ed.; Academic Press: Cambridge, MA, USA, 2013. [Google Scholar]
  9. Giraldo, L.; Rodríguez-Estupiñán, P.; Moreno-Piraján, J.C. Calorimetry of Immersion in the Energetic Characterization of Porous Solids. In Calorimetry—Design, Theory and Applications in Porous Solids; Moreno-Piraján, J.C., Ed.; Intech Open Ltda: London, UK, 2018; pp. 35–53. [Google Scholar] [CrossRef] [Green Version]
  10. Boehm, H.P. Some aspects of the surface chemistry of carbon blacks and other carbons. Carbon N. Y. 1994, 32, 759–769. [Google Scholar] [CrossRef]
  11. Kim, Y.S.; Park, C.R. Chapter 13—Titration Method for the Identification of Surface Functional Groups. In Materials Science and Engineering of Carbon; Inagaki, M., Ed.; Tsinghua University Press Limited: Beijing, China, 2016; pp. 273–286. ISBN 9780128052563. [Google Scholar]
  12. Daud, W.M.A.W.; Houshamnd, A.H. Textural characteristics, surface chemistry and oxidation of activated carbon. J. Nat. Gas Chem. 2010, 19, 267–279. [Google Scholar] [CrossRef]
  13. Khaoula, H.; Imen, B.; Foued, M.; Jemni, A. Study of the adsorption interaction potential in a microporous solid. Int. J. Adv. Res. 2016, 4, 60–69. [Google Scholar] [CrossRef] [Green Version]
  14. Chen, Q.; Wang, S.; Rout, K.R.; Chen, D. Development of polyethylenimine (PEI)-impregnated mesoporous carbon spheres for low-concentration CO₂ capture. Catal. Today 2021, 369, 69–76. [Google Scholar] [CrossRef]
  15. Sevilla, M.; Falco, C.; Titirici, M.-M.; Fuertes, A.B. High-performance CO₂ sorbents from algae. RSC Adv. 2012, 2, 12792–12797. [Google Scholar] [CrossRef] [Green Version]
  16. Wei, H.; Deng, S.; Hu, B.; Chen, Z.; Wang, B.; Huang, J.; Yu, G. Granular bamboo-derived activated carbon for high CO₂ adsorption: The dominant role of narrow micropores. Chemsuschem 2012, 5, 2354–2360. [Google Scholar] [CrossRef]
  17. Simmons, J.M.; Wu, H.; Zhou, W.; Yildirim, T. Carbon capture in metal–organic frameworks—A comparative study. Energy Environ. Sci. 2011, 4, 2177–2185. [Google Scholar] [CrossRef]
  18. Czakkel, O.; Nagy, B.; Dobos, G.; Fouquet, P.; Bahn, E.; László, K. Static and dynamic studies of hydrogen adsorption on nanoporous carbon gels. Int. J. Hydrogen Energy 2019, 44, 18169–18178. [Google Scholar] [CrossRef]
  19. Bader, N.; Zacharia, R.; Abdelmottaleb, O.; Cossement, D. How the activation process modifies the hydrogen storage behavior of biomass-derived activated carbons. J. Porous Mater. 2018, 25, 221–234. [Google Scholar] [CrossRef]
  20. Serafin, J.; Dziejarski, B.; Junior, O.F.C.; Sreńscek-Nazzal, J. Design of highly microporous activated carbons based on walnut shell biomass for H₂ and CO₂ storage. Carbon N. Y. 2023, 201, 633–647. [Google Scholar] [CrossRef]
  21. Yang, X.; Yi, H.; Tang, X.; Zhao, S.; Yang, Z.; Ma, Y.; Feng, T.; Cui, X. Behaviors and kinetics of toluene adsorption-desorption on activated carbons with varying pore structure. J. Environ. Sci. 2018, 67, 104–114. [Google Scholar] [CrossRef]
  22. Gallego, E.; Roca, F.J.; Perales, J.F.; Guardino, X. Experimental evaluation of VOC removal efficiency of a coconut shell activated carbon filter for indoor air quality enhancement. Build. Environ. 2013, 67, 14–25. [Google Scholar] [CrossRef]
  23. Li, L.; Liu, S.; Liu, J. Surface modification of coconut shell based activated carbon for the improvement of hydrophobic VOC removal. J. Hazard. Mater. 2011, 192, 683–690. [Google Scholar] [CrossRef]
  24. Thommes, M.; Kaneko, K.; Neimark, A.V.; Olivier, J.P.; Rodriguez-Reinoso, F.; Rouquerol, J.; Sing, K.S.W. Physisorption of gases, with special reference to the evaluation of surface area and pore size distribution (IUPAC Technical Report). Pure Appl. Chem. 2015, 87, 1051–1069. [Google Scholar] [CrossRef] [Green Version]
  25. Prahas, D.; Kartika, Y.; Indraswati, N.; Ismadji, S. Activated carbon from jackfruit peel waste by H3PO4 chemical activation: Pore structure and surface chemistry characterization. Chem. Eng. J. 2008, 140, 32–42. [Google Scholar] [CrossRef]
  26. Phan, N.H.; Rio, S.; Faur, C.; Le Coq, L.; Le Cloirec, P.; Nguyen, T.H. Production of fibrous activated carbons from natural cellulose (jute, coconut) fibers for water treatment applications. Carbon N. Y. 2006, 44, 2569–2577. [Google Scholar] [CrossRef]
  27. Goncharuk, O.V. The heat of immersion of modified silica in polar and nonpolar liquids. J. Therm. Anal. Calorim. 2015, 120, 1365–1373. [Google Scholar] [CrossRef]
  28. Bandosz, T.J.; Ania, C.O. Chapter 4 Surface chemistry of activated carbons and its characterization. Interface Sci. Technol. 2006, 7, 159–229. [Google Scholar]
  29. Rashidi, N.A.; Yusup, S.; Borhan, A. Isotherm and Thermodynamic Analysis of Carbon Dioxide on Activated Carbon. Procedia Eng. 2016, 148, 630–637. [Google Scholar] [CrossRef] [Green Version]
Figure 1. N2 adsorption isotherms at 77 K of the activated carbons.
Processes 11 01144 g001
Figure 2. Pore volume variation as a function of pore width obtained by the QSDFT model (slit-cylinder pore geometry) for activated carbon samples with a zoom plot for the micropore area (upper right).
Processes 11 01144 g002
Figure 3. Surface group content for CO, CG and COT. (A) Total acidity, total basicity; (B) Carboxylic, lactonic and phenolic surface groups.
Processes 11 01144 g003
Figure 4. CO2 adsorption isotherms at 273 K of activated carbons.
Processes 11 01144 g004
Figure 5. SEM photographs at a different magnification of the CG activated carbon. (A) 100× magnification, (B) 1000× magnification.
Processes 11 01144 g005
Figure 6. Calorimetric curves of CG, CO and COT immersion in pure solvents (benzene and hexane).
Processes 11 01144 g006
Figure 7. Enthalpies of immersion of samples in binary mixtures as a function of mole fraction.
Processes 11 01144 g007
Figure 8. Enthalpies of immersion of CG, CO, and COT in the binary mixtures as a function of the total acidity.
Processes 11 01144 g008
Figure 9. Enthalpies of immersion of solids in binary mixtures as a function of surface area BET.
Processes 11 01144 g009
Figure 10. Relationship between the enthalpy of immersion and the amount of adsorbed CO2.
Processes 11 01144 g010
Table 1. Textural and chemical parameters of the activated carbons.
Activated CarbonN2CO2Adsorption
CO2
AcidityBasicity
Area BET
(m2/g)
V0
(cm3/g)
VMeso
(cm3/g)
Vt
(cm3/g)
Vn
(cm3/g)

(mmolg−1)

(μmolg−1)

(μmolg−1)
CG8400.340.040.380.353.4184.1278.91
CO8160.320.050.370.383.8373.4551.51
COT9350.370.050.410.353.453.47227.24
Table 2. Enthalpies of immersion of CG, CO and COT in pure liquids and in binary mixtures (benzene solute, hexane solvent) at concentrations between 0.2 and 0.8 mole fraction.
Sample−ΔHi
C6H6
(Jg−1)
−ΔHi
C6H14
(Jg−1)
−ΔHi
0.2
C6H6/
C6H14
(Jg−1)
−ΔHi
0.4
C6H6/
C6H14
(Jg−1)
−ΔHi
0.6
C6H6/
C6H14
(Jg−1)
−ΔHi
0.8
C6H6/
C6H14
(Jg−1)
CG106.4040.8775.8781.2274.1071.35
CO94.9816.3641.3148.4243.5836.39
COT128.8053.3590.7098.3791.8189.54
Disclaimer/Publisher’s Note: The statements, opinions and data contained in all publications are solely those of the individual author(s) and contributor(s) and not of MDPI and/or the editor(s). MDPI and/or the editor(s) disclaim responsibility for any injury to people or property resulting from any ideas, methods, instructions or products referred to in the content.