Article

Study and Validation of a Novel Grouting Clamp Type Deepwater Oilfield Pipeline Repair Method Based on Computational Fluid Dynamics

1
CNOOC EnerTech-Drilling & Production Co., Shenzhen 518067, China
2
School of Biological and Agricultural Engineering, Jilin University, Changchun 130022, China
*
Authors to whom correspondence should be addressed.
Processes 2023, 11(4), 1142; https://doi.org/10.3390/pr11041142
Submission received: 7 March 2023 / Revised: 30 March 2023 / Accepted: 5 April 2023 / Published: 7 April 2023

Abstract

:
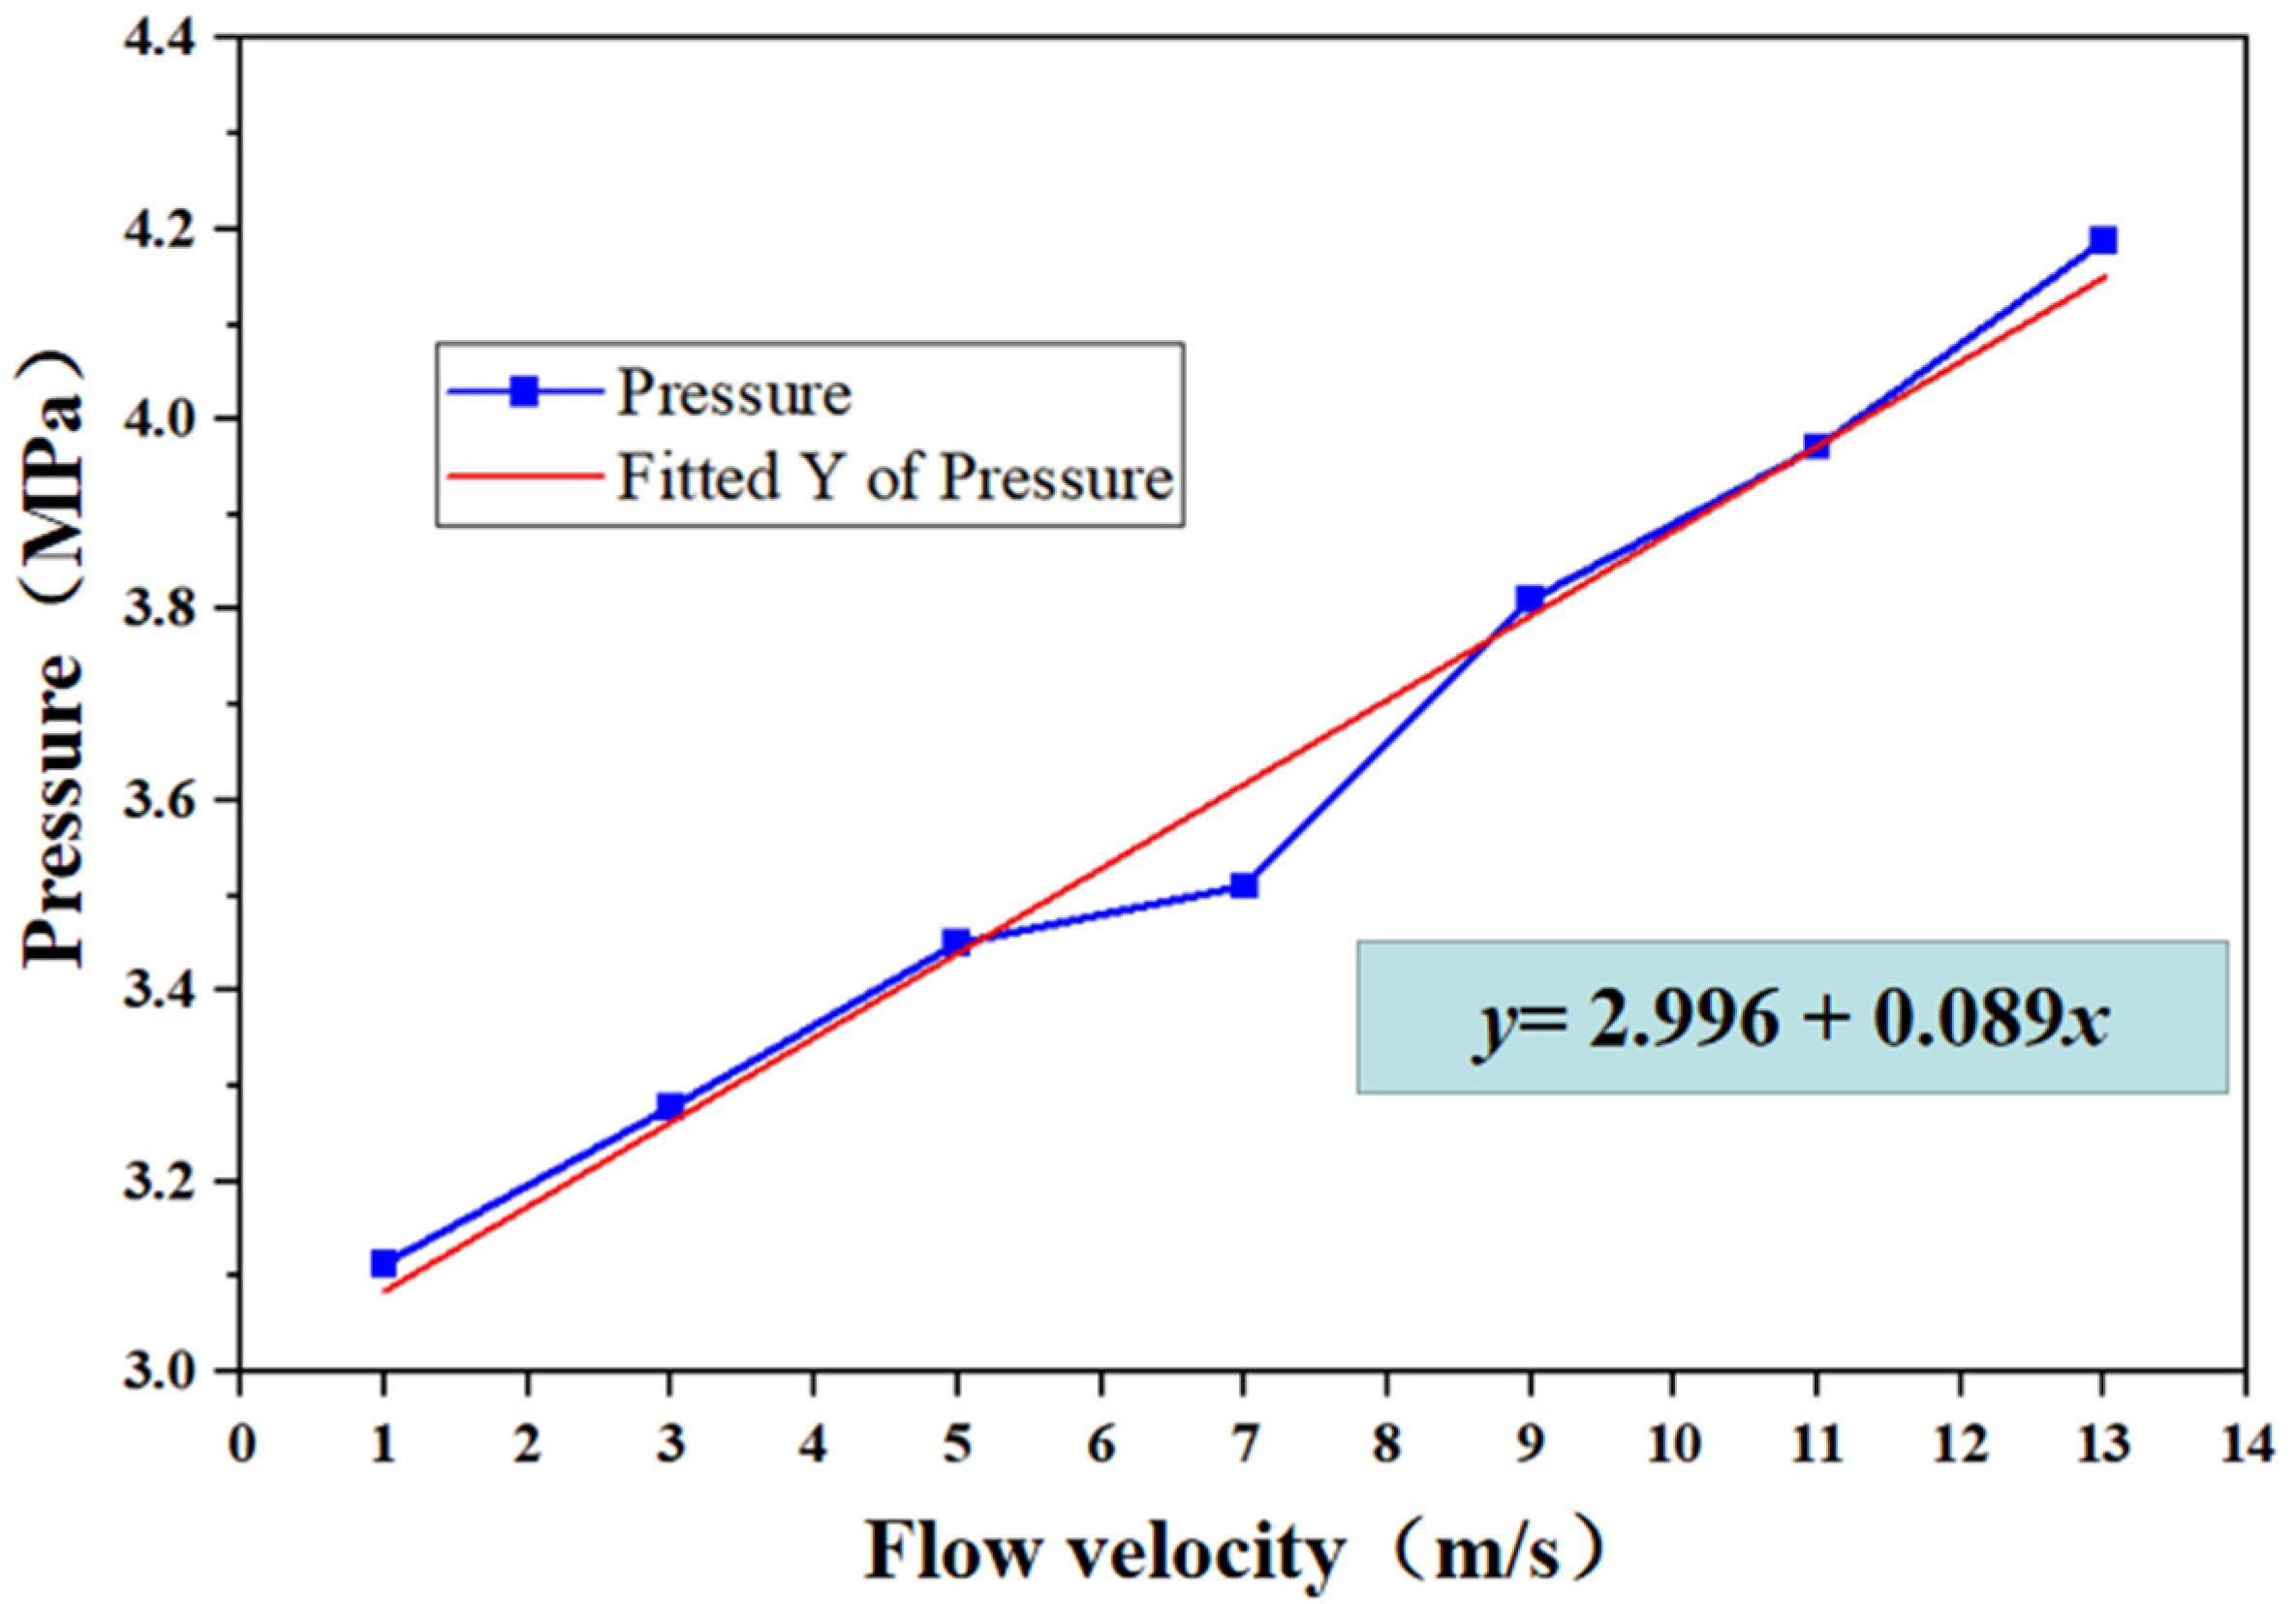
In order to handle the corrosion of underwater production pipe sinks in deepwater oil fields, a non-solid phase silicone plugging agent, an external clamp, and an underwater injection tool are combined in this paper’s innovative pipeline repair technique proposal. The optimal main agent to curing the agent ratio for non-solid phase silicone plugging agents was found to be 100:25, which was achieved through an experimental examination of the curing process. The compressive and cementing strength changes in the curd plugging agent were disclosed by testing and evaluating the mechanical behavior of the plugging agent. In addition, the limits of the compressive and cementing strength were found to be 143 MPa and 11.6 MPa, respectively. Based on this, a computational-fluid-dynamics(CFD)-based analytical approach of the complicated flow field in a deep sea environment on the eroding impact of a plugging agent was developed. Through numerical simulation testing, the mathematical relationship between the plugging agent’s maximum pressure and the flow field’s velocity was established. The limits of saltwater and petroleum oil on the erosion of the plugging agent were found to be 4.19 MPa and 3.29 MPa, respectively, which are values that are far below their strength limits. In this way, the viability and efficacy of this novel pipeline repair technique were confirmed. The study presented in this paper sets the groundwork for an in-depth analysis and optimization of novel corrosion control solutions for deepwater oil field subsea process pipes.

1. Introduction

Submarine pipes are currently widely established and used in industrial production areas across the world. Furthermore, they have high industrialization and economic value, such as oil transfer, waste disposal, and electricity transmission [1,2,3]. China began constructing undersea oil pipelines in deepwater oil fields in the early 1990s. This work was crucial to the growth of the social sector and for building the country’s economy. However, long-term saltwater erosion and crude oil corrosion have resulted in pipeline failures and crude oil leakages becoming serious, concealed threats to environmentally safe production [4,5,6]. As a result, it is imperative to conduct in-depth research and to innovate in order to maximize the corrosion control technology of undersea process pipes in deepwater oil fields.
Pipeline repair technology has a higher influence on the service life of pipelines since it is the primary component of controlling pipeline corrosion. For the repair of underwater pipelines, pipeline replacement, internal repair, external sleeve, and external clamp technologies are currently widely employed, both domestically and internationally, depending on the location of the damage, the depth of operation, and the implementation techniques that are used [7,8,9,10,11]. The pipe replacement method, which may involve hot tapping or pipe cutting, is conducted by removing the damaged pipe portion and replacing it with a new one. However, this method is time- and money-intensive [12].
The internal repair techniques, such as expanded steel patches, live pipe insertion, and pipe robotics, are used to locate the corroded areas and to repair them from inside the pipeline by using sensors and computer vision technologies. However, this technique is constrained by the location of the breakage and by the operating circumstances [13,14,15].
For less severe corrosions or fractures in offshore locations, external sleeve techniques are used to cover the pipe with rigid or flexible materials. However, the effectiveness of these techniques depends on the severity of the damage and the depth of the operation [16].
In deepwater situations, the external clamp technique is utilized to repair big broken pipelines from the outside. Two half cylinders are used in the conventional external clamp device to surround and secure the pipe, but the sealing qualities have a significant impact on how well the device works [17,18]. As a consequence, the enhanced technology for the grouting clamp has advanced to a higher level in terms of sealing performance; nevertheless, the grouting materials are mostly cement and concrete based, which are less resilient and more brittle.
For instance, in the deepwater oilfield, where our firm has a production pipeline sink, there are several issues right now, including a high operational depth, a lengthy service life, and numerous pipeline corrosion breaches. This study integrates the aforementioned techniques and develops a novel grouting clamp-based deepwater oilfield pipeline repair technique that incorporates a non-solid phase silicone plugging agent, an external clamp, and an underwater injection tool. However, the method’s process flow, as well as its suitability and efficacy in a deepwater environment, still require further confirmation as no pertinent research regarding this topic has been recorded thus far.
In this study, experimental methods are used to explore the curing features and process of the plugging agent formulation. Additionally, tests and analyses are performed on the curing plugging agent’s mechanical behavior and strength limit. Using this information as a foundation, a CFD-based analytical approach, regarding the impact of complicated flow fields on plugging agent erosion in deepwater environments, is built. Furthermore, numerical simulation studies are used to analyze how saltwater and crude oil affect plugging agents in terms of erosion, proving the viability and efficiency of the novel pipeline restoration technique. The study presented in this paper sets the groundwork for the comprehensive investigation and optimization of novel corrosion management technologies for subsea production pipeline sinks in deepwater oil fields.

2. Materials and Methods

2.1. Pipeline Repair Method

This research suggests a new technique for oil pipeline surface repair, using the corrosion control of a nearby deepwater oilfield production manifold as an example. It combines a non-solid phase silicone plugging agent, an exterior clamp, and an underwater injection instrument. After curing, the hydrophobic, high-temperature-resistant, pure-liquid silicone polymer employed in the non-solid phase silicone plugging agent can be used to successfully seal the corroded pipeline breaches. The curing efficiency and uniformity of the plugging agent were determined by the structure and material of the external clamp, as illustrated in Figure 1, which was externally fastened to achieve the curing process after the plugging agent was injected. The underwater injection tool was self-developed, and the injection process of solid-phase silicone plugging agent was realized by ROV.
Implementing this deepwater oilfield pipeline restoration technique involves the following steps. First, the corrosion leak’s position was identified. Next, a flexible skin was wrapped around the leak, which was chosen for the size of the leak, and connected to the sleeve’s keel support. Second, an external clamp was inserted to create a closed annular gap between the corroded pipeline and the clamp. A rubbery gasket extrusion was used to seal the clamp’s contact point and the clamp’s end. The outer sleeve was then removed after a non-solid phase silicone plugging agent was injected via an underwater injection tool.
In order to better understand the curing process of the non-solid phase silicone plugging agent and its post-curing performance, this work combines experimental investigation with CFD numerical simulation.

2.2. Non-Solid Phase Silicone Plugging Agent Properties Test

2.2.1. Curing Properties Test

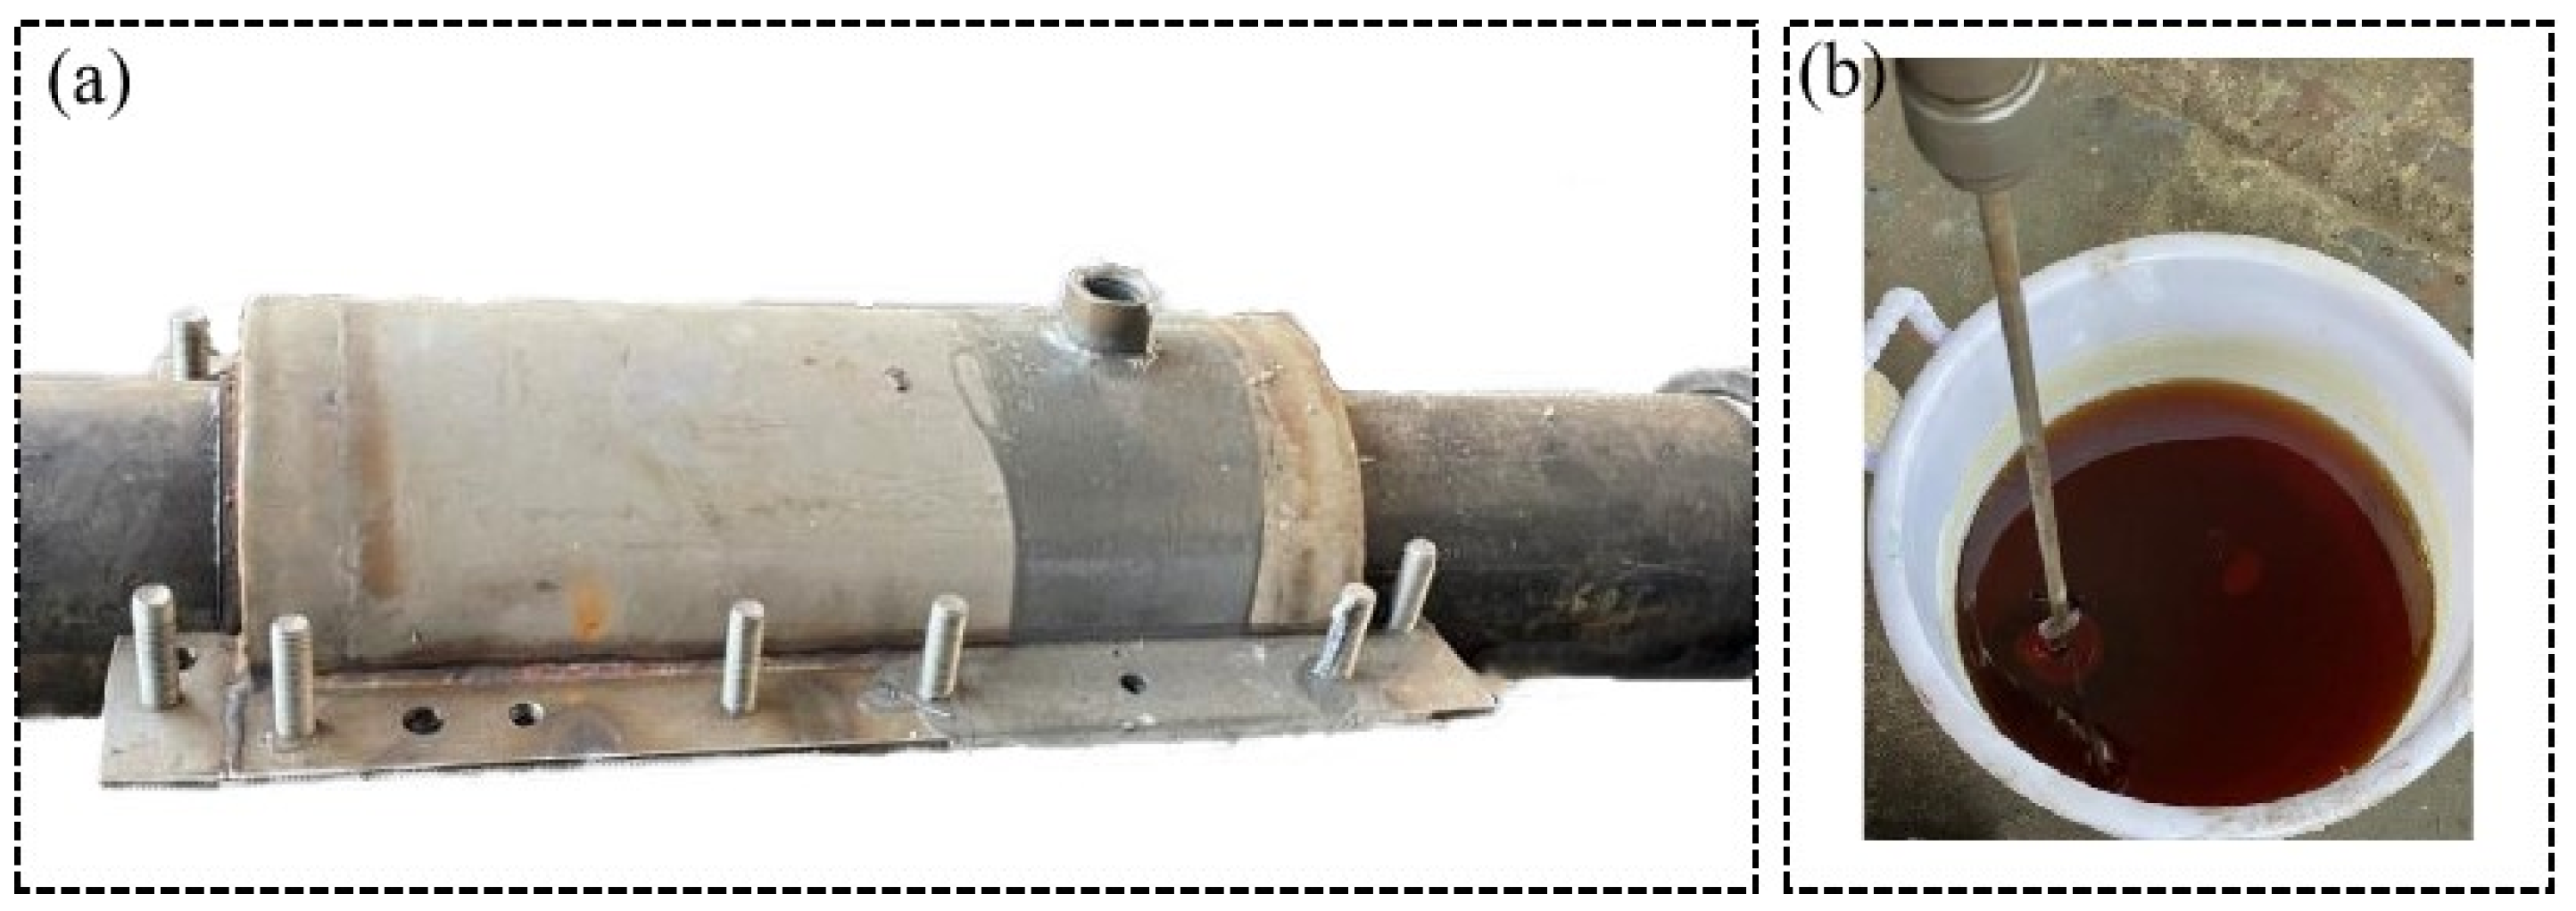
The primary agent, curing agent, density and viscosity adjusters, and other ingredients make up the majority of the non-solid phase silicone plugging agent. The curing duration and strength of the plugging agent are greatly influenced by the quality ratio between the main agent and curing agent, as well as for the various configuration procedures, which, in turn, influence the pipeline repair effect. As a result, the non-solid phase silicone plugging agent was evaluated on the ground, while the deepwater pipeline serves as the study’s object. The pipeline was made of 13Cr-L80 and had two surface leaks that were 13 mm each in diameter. The plugging agent was injected into the pipeline through the junction after the outer clamp was put on the outside of the pipeline, wrapped, and locked with a high-density sponge. Figure 2a depicts the outer sleeve and deepwater oil pipeline structure, and Figure 2b depicts the plugging agent specimen.
The effectiveness of the plugging agent that is evaluated in this study was based on the final solidification state by using four primary agents (I), as well as curing agent (II) mass ratios, two mixing procedures, and two pressurization methods. The test factor levels are displayed in Table 1.

2.2.2. Mechanical Properties Test

Both the viability of a novel way of managing corrosion and the efficacy of pipeline plugging are more strongly influenced by the mechanical qualities of the formulation of the curing plugging agent. In order to test and evaluate the compressive strength of the cured plugging agent, as well as its bonding strength to the pipe wall, this article employs an electronic universal tensile test press.
A cylindrical specimen of a cured plugging agent of 20 mm in diameter and 30 mm in length was made, which was placed between two metal plates for bonding; its compressive strength was assessed via a compression test. As the bonding strength between the plugging agent and the pipe wall was being measured, it is known from the previous study that the tensile strength of the pipe wall and the tensile strength of the plugging agent are both much higher than the bonding strength between the plugging agent and the pipe wall. The pipe wall and the other end of the plugging agent are bonded with the metal plate of the fixture by using F-20NS structural adhesive prior to the bonding strength test, and a cylindrical specimen with a diameter of 20 mm and a length of 30 mm is made. The fixture is mounted on the test bench after curing, and the bonding strength is assessed via a tensile test.
From the early research, it has been determined that the mechanical characteristics are somewhat influenced by the uniformity of the plugging substance after curing. The present paper performed 10 repeated curing tests based on the results of the tests for the performance of the curing plugging agents that were mentioned above. Three arbitrarily chosen examples were produced at each site following a successful curing process for mechanical property testing in order to take the uniformity of the curing process into account.

2.3. Simulation of Erosion Test

This paper uses the CFD method to numerically simulate the pressure on the external sleeve and plugging agent curing material under external seawater and internal crude oil erosion in order to take into account the effects of seawater pressure and erosion on the new method of pipeline repair in a deepwater environment [19,20,21]. In this study, to determine the mechanism of the curing material to plug the internal pipeline leak, as well as the mechanical failure mechanism of the curing material in deepwater environments, the ANSYS 2020 software Fluent module was used as the numerical simulation instrument.

2.3.1. Curing Properties Test

Figure 3a illustrates the study of the 90° and 180° exterior sleeves, as well as the construction of their numerical models, based on the CFD approach [22,23,24,25]. The filled pipe had a diameter of 114.30 mm and a length of 663.50 mm, and Figure 3b illustrates how the geometry of the internal cured plugging agent was extracted in accordance with the exterior mechanical structure.
Figure 4 illustrates the spatial model of the flow field that was built during the numerical simulation in order to examine the erosion impact of the seawater outside the pipe and the crude oil within. To create the seawater flow field spatial model, a positive 8-sided shape with a diameter of 600 mm and a height in the Y direction of 1600 mm was drawn and stretched in the XZ plane. This model was used to examine how seawater eroding the hardened plugging agent affects it from different directions and flow rates. The corroded pipe was used as a prototype to create a crude oil fluid space model, with its Y-axis negative direction serving as the crude oil inflow direction and its Z-axis positive direction serving as the crude oil outflow direction in the common plane with the seawater fluid space model. This model was used to calculate the pressure under various erosion effects and to confirm the sealing efficiency of the cured plugging agent. The internal pressure steadily rises as the depth is increased during the extraction of crude oil. The deepest point was chosen for study in this work in order to guarantee the precision of the simulation test; additionally, the crude oil erosion model was set up at a depth of 310 m.

2.3.2. Boundary Conditions and Meshing

Simplified circumstances are included in the numerical simulation procedure, taking into consideration the seawater erosion and turbulence models: the flowing seawater and crude oil are set up as incompressible fluids with constant viscosity coefficients, and the cured plugging agent model is also set up as an absolutely incompressible solid. The wall surface was thought of as an adiabatic wall surface with no heat exchange with the environment [26,27,28,29].
This work examines the erosion impact of the flow field on the boundary using the standard kε turbulence model in order to correctly represent the pressure situation beneath the seawater and in the complicated scenario of erosion within saltwater.
( ρ k ) t + ( ρ k u i ) x i = x j [ ( μ + μ t σ k ) k x j ] + G k + G b ρ ε Y M + S K
( ρ ε ) t + ( ρ ε u i ) x i = x j [ ( μ + μ t σ k ) k x j ] + C 1 ε ε k ( G k + C 3 ε G b ) C 2 ε ρ ε 2 k + S ε
where Gk is the term for the generation of turbulent energy k due to the change in mean velocity, Gb is the term for the generation of turbulent energy k due to buoyancy, YM is the term for pulsation expansion in compressible turbulence, and C1ε, C2ε, C3ε, σk and σε are constants, taking values of 1.44, 1.92, 0.09, 1.0, and 1.3, respectively [30,31,32].
Standard wall functions (SWF) are used in the kε turbulence model, and the intake and exit turbulence models were set to intensity and hydraulic diameter settings of 5% and 0.01 m, respectively.
The quantity and quality of meshes used in the numerical calculations affect the accuracy of the results and the computational cycle. As the mesh is fine-tuned, the simulation results will gradually stabilize. In this paper, the early stages of the task involved checking the meshing quality for relevance, as illustrated in Figure 5. Numerical computations were conducted using the five meshes that were developed for the crude oil erosion state: 3 mm, 5 mm, 10 mm, 15 mm, and 20 mm. Figure 5a displays the average highest pressures determined for the various grid sizes under the same computation circumstances. As the grid size grows, the average maximum pressure drops, but it never falls below 1% of the maximum pressure number. Four 5 mm, 10 mm, 15 mm, and 20 mm squares were made, and numerical computations were conducted for the seawater erosion conditions. The average maximum pressures found for the various grid sizes under the same calculation circumstances are displayed in Figure 5b. The 5 mm and 10 mm meshes’ average maximum pressures are comparable, with a variance of no more than 1%, which satisfies the simulation’s criteria. The simulation looks scattered and does not satisfy the analytical requirements when the grid size is 15 mm and 20 mm. To increase computation efficiency while maintaining calculation precision and practical efficiency, the grid size of the crude oil erosion and seawater erosion was 5 mm and 10 mm with 626,755 and 3,551,870 grids, respectively.

2.3.3. Simulation Test Setup

The two components of the numerical simulation test are the seawater erosion test and the crude oil erosion test. The ambient pressure was adjusted to 3.1 MPa and the seawater fluid spatial model was configured for the outflow direction and velocity, as is indicated in Table 2, for the seawater erosion test. Using an inlet flow velocity of 1, 2, and 3 m/s, respectively, as well as a pressure outlet setting, the crude oil erosion test uses the spatial model-Y direction of the fluid as the velocity inlet boundary condition. Other components were mounted on a wall.
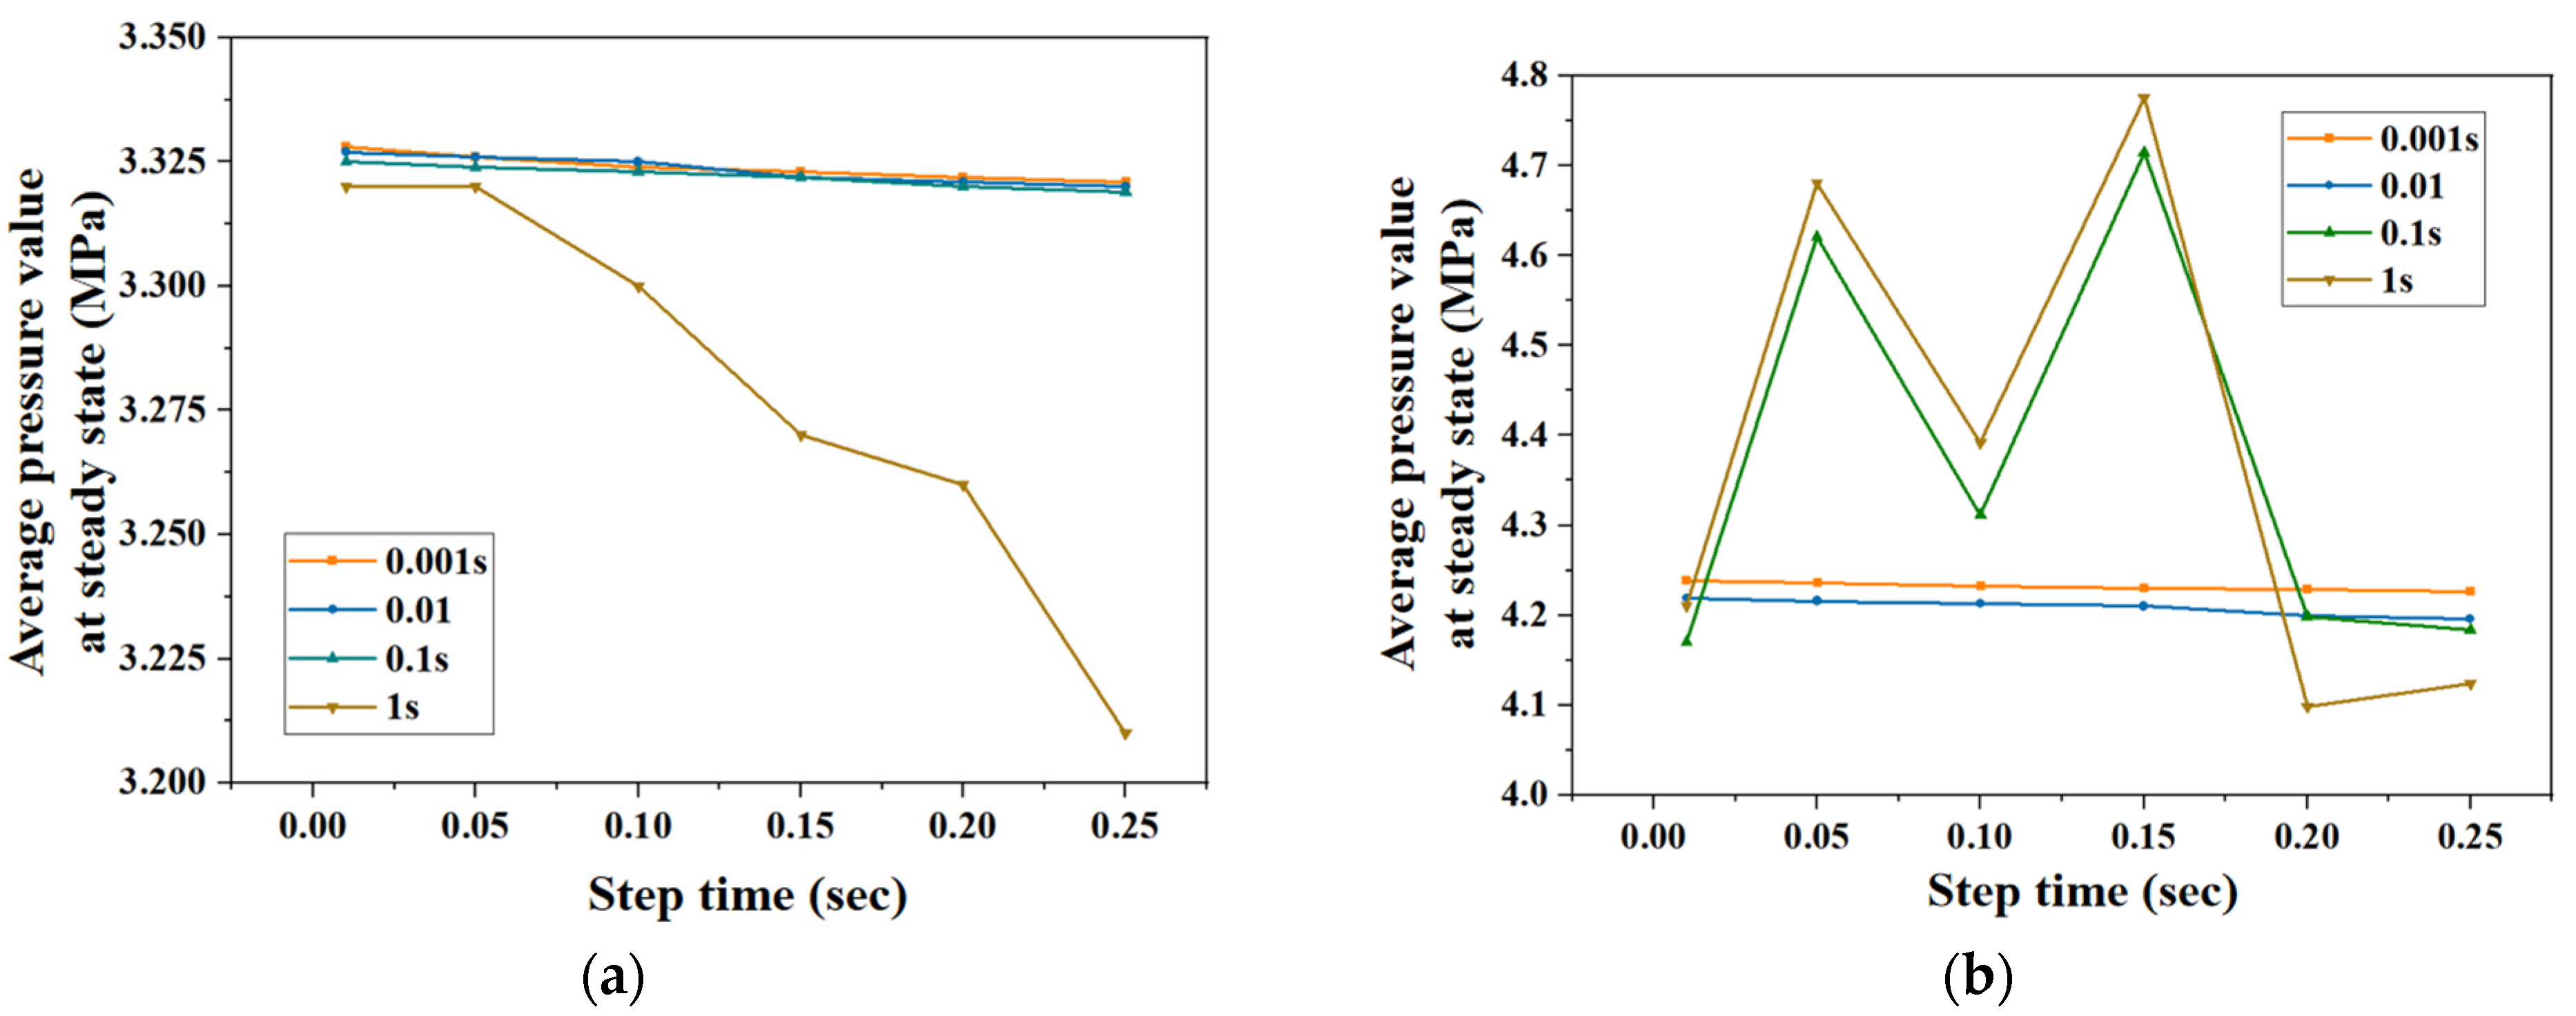
The numerical simulation’s convergence time was correlated with the iteration step size, which can be selected sensibly to produce accurate and consistent computation results because there are fleeting circumstances, such as phase shift and turbulence, in the flow state of the liquid. In order to run numerical calculations for the petroleum oil erosion model, time increments of 0.001, 0.01, 0.1, and 1 s were selected. Figure 6a displays the mean highest pressure as a function of time for various repetitions of the time increment until convergence. The mean maximum pressure values for the steps of 0.001 s, 0.01 s, and 0.1 s are comparable and consistent, but the mean maximum pressure for the step of 1 s greatly decreases, which is inconsistent with the pattern for the other steps. In order to perform numerical simulation computations for the seawater erosion calculation model, the time steps of 0.001, 0.01, 0.1, and 1 s were chosen. Figure 6b illustrates how the mean maximum pressure varies over time as a result of using various time steps to converge. However, it appears that the average highest pressure in the 0.1 and 1 s phases is divergent, which is inconsistent with the pattern of other step durations and does not satisfy the criteria of the simulation analysis. The step duration of the calculations for both crude oil erosion and seawater erosion was chosen to be 0.01 s in order to increase the computation efficiency, guarantee calculation precision, and to ensure computing efficiency.
A transient simulation with a time step of 0.01 s was employed, and the convergence threshold was set to 10−6 for the energy equation and 10−3 for the remaining equations. As the geometry of the model was huge, the number of meshes large, and the memory use significant, a pressure-based solver was utilized, and a second-order discretization approach was used for the pressure, momentum, and energy equations. The turbulent kinetic energy (k equation) and turbulent dissipation rate (ε equation) were discretized using a first-order discretization technique. In addition, the time term was discretized by using a first-order implicit discretization approach. The SIMPLEC technique was used to solve the discrete equations.
Table 3 shows the simulation parameters. A tabletop densitometer was used to determine the density of the curing preparation material. The viscosity of seawater, crude oil, and cured mating liquid material was determined using an NDJ-4 rotational viscometer. To determine the density of the cured blocking agent, the drainage technique was used. The high and low temperature chambers were utilized to test the temperature resistance of the cured plugging agent and to monitor its condensation at various application temperatures. In order to guarantee the accuracy and validity of the simulation model given the challenging test circumstances in the deep sea, this article calculated additional simulation parameters by fusing the previously mentioned measured parameters with a study of the pertinent literature [33,34,35,36].

3. Results and Discussion

3.1. Results and Discussion on Plugging Agent Curing Properties Test

The test steps and their outcomes are listed below for the curing study of a solid-free silicone formulation.
(1)
When the plugging agent curing agent ratio was 100:10 or 100:15, the curing of the plugging agent failed because of the formulation’s comparatively low mass ratio of the curing agent;
(2)
With manual mixing and no pressure, Figure 7a illustrates how the plugging agent failed to completely fill after curing when the ratio of the plugging agent was 100:22. The sleeve was not sufficiently sealed, which is the cause;
(3)
The sleeve was enhanced for sealing; no plugging agent leaked, but after curing, tiny fractures appeared, as illustrated in Figure 7b. This occurred due to two reasons: (a) The gas was not totally expelled during mixing, and when it warmed up during curing, it progressively separated and collected; (b) the plugging agent has to be pressured during curing;
(4)
A 100:22 liquid to plugging agent ratio, electric stirring, and a 300 psi pressured environment indicate a successful plugging of agent curing. The organic–inorganic interfacial cementing force between the plugging agent and the pipeline was harmed and a crack channel developed when the test pressure surpassed 500 psi. The cause was due to the fact that the plugging agent’s interaction with the pipeline was affected by the existence of free gas in the plugging agent, and that the plugging agent’s curing process was not pressured sufficiently;
(5)
A 100:22 liquid to solids ratio plugging agent, vacuum degassing, and pressured 600 psi condition ensured a plugging agent curing success. Unfortunately, the pipeline between the plugging agent and the test pressure caused bonding damage when it surpassed 1000 psi. To explain why this occurred, the force and adhesive strength of the plugging agent after curing were influenced by the plugging agent’s pace and uniformity of curing;
(6)
As shown in Figure 7c, the plugging agent was satisfactorily healed at a 600 psi pressure with electric stirring and vacuum degassing when the plugging agent ratio was 100:25. For the 1500 psi test pressure, a constant pressure for 15 min without decreasing was maintained.
The plugging agent percentage has a stronger influence on the curing process and curing properties, according to the plugging agent curing characteristics test. The curing rate and uniformity of the plugging agent were improved with an increase in the hardener’s specific gravity or when the ratio of the plugging agent to liquid was set at 100:25. As a result, the strength of the plugging agent after curing and its bonding strength with the pipeline achieved the desired effect. Contrarily, the gas that was released from the plugging agent during the curing process influenced the contact between the plugging agent and the pipeline, which, in turn, affected the strength of the cementing at the organic–inorganic interface between the plugging agent and the pipeline. Hence, a vacuum degassing pre-treatment by using electric means is required for the plugging agent. Lastly, pressurization during the plugging agent curing process was also essential to increase the plugging agent’s strength after curing and to increase the success rate of the curing of the plugging agent.

3.2. Results and Discussion on Plugging Agent Mechanical Properties Test

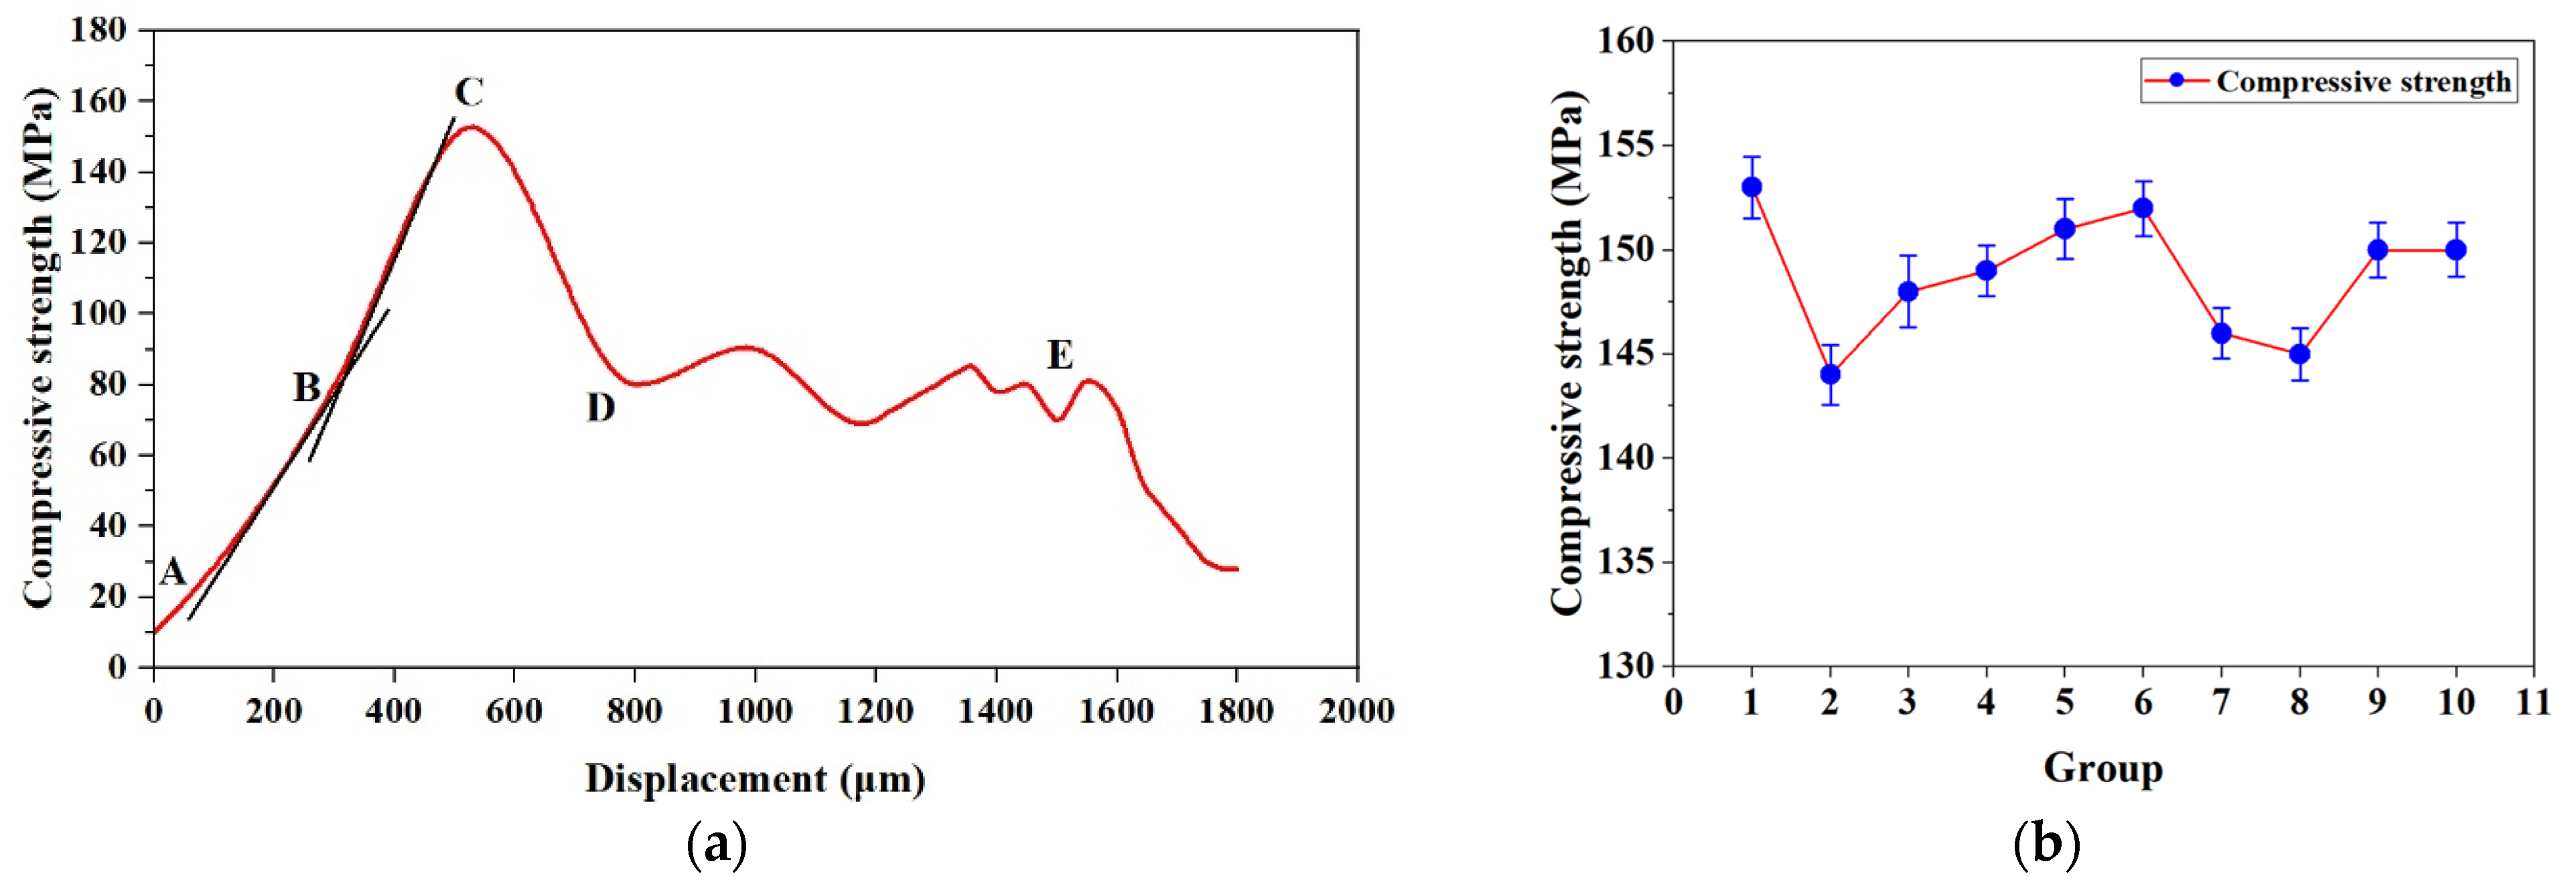
The mechanical characteristics of the plugging agent were evaluated based on the fundamental ratio of the plugging agent (the findings of the compressive strength test of the plugging agent are shown in Figure 8). Figure 8a depicts the average compressive strength of each group and the change in displacement. AC is the elastic zone, whereby the compressive strength and displacement are linear, and where the plugging agent in the state of deformation can be restored to its original state; the slope of the AB section was less than the slope of the BC section, indicating that the recovery effect of the plugging agent in the AB section after pressure is better than the recovery effect in the BC section; and C was the maximum compressive strength. CD is the brittle zone, where pressure causes the interior buildup of energy to be released, causing the specimen to fracture but not break. However, the crucial zone is DE; at this point, the displacement rises, such that the specimen generates a significant strain, resulting in profound cracking; moreover, when the specimen reaches the E point, it fully shatters.
Figure 8b depicts the highest tensile strength of each test group. During the compressive strength test, the specimens’ highest compressive strength varied from 143 MPa to 153.5 MPa. This demonstrates the difference in maximum compressive strength. These are caused by differences in the basic physical properties of the plugging agent’s composition of raw materials and different mixing conditions during the solidification process, which resulted in the phenomenon of poor density uniformity at different locations. It has no effect on the general mechanical characteristics of the plugging agent. To guarantee the plugging agent’s minimal mechanical characteristics, its compressive ultimate strength after solidification was found to be 143 MPa.
Figure 9 depicts the findings of the pipe wall adhesive strength test. Figure 9a depicts the average tensile strength of the specimen as the displacement changes, where AB is the elastic zone—primarily for the elastic change in the plugging agent—and where the two connection status is normal, with no fracture or bonding failure. Point B is the maximum strength of the two connections, with a maximum bonding strength of 12 MPa. Part BC is the connection portion of the local fracture; as displacement rises, so does the internal fracture. Part CD is the pipe wall, and the CD portion is the failure of bonding between the pipe wall and the plugging agent, resulting in progressive separation and, eventually, the total separation and failure of the pipe wall bonding.
The maximum tensile strength of each group is shown in Figure 9b, and the maximum tensile strength of the specimen during the tensile strength test ranges from 11.6 MPa to 12.3 MPa, indicating that during the curing process of plugging agent and pipe wall bonding, the mixing of raw materials and density inhomogeneity inside the plugging agent causes the bonding strength of the plugging agent and pipe wall to differ; however, this does not affect the bonding strength of plugging agent. The final strength of the plugging agent and the pipe wall was found to be 11.6 MPa, which was required in order to guarantee the minimal mechanical characteristics of the connection.

3.3. Results and Discussion on Erosion Test

3.3.1. Results and Discussion on Seawater Erosion

The mathematical model of the relationship between the maximum pressure on the plugging agent and the speed of the seawater was established by the numerical simulation test of the seawater erosion, which examines the pressure change in the plugging agent after curing under the action of seawater impacts in different directions and at different speeds.
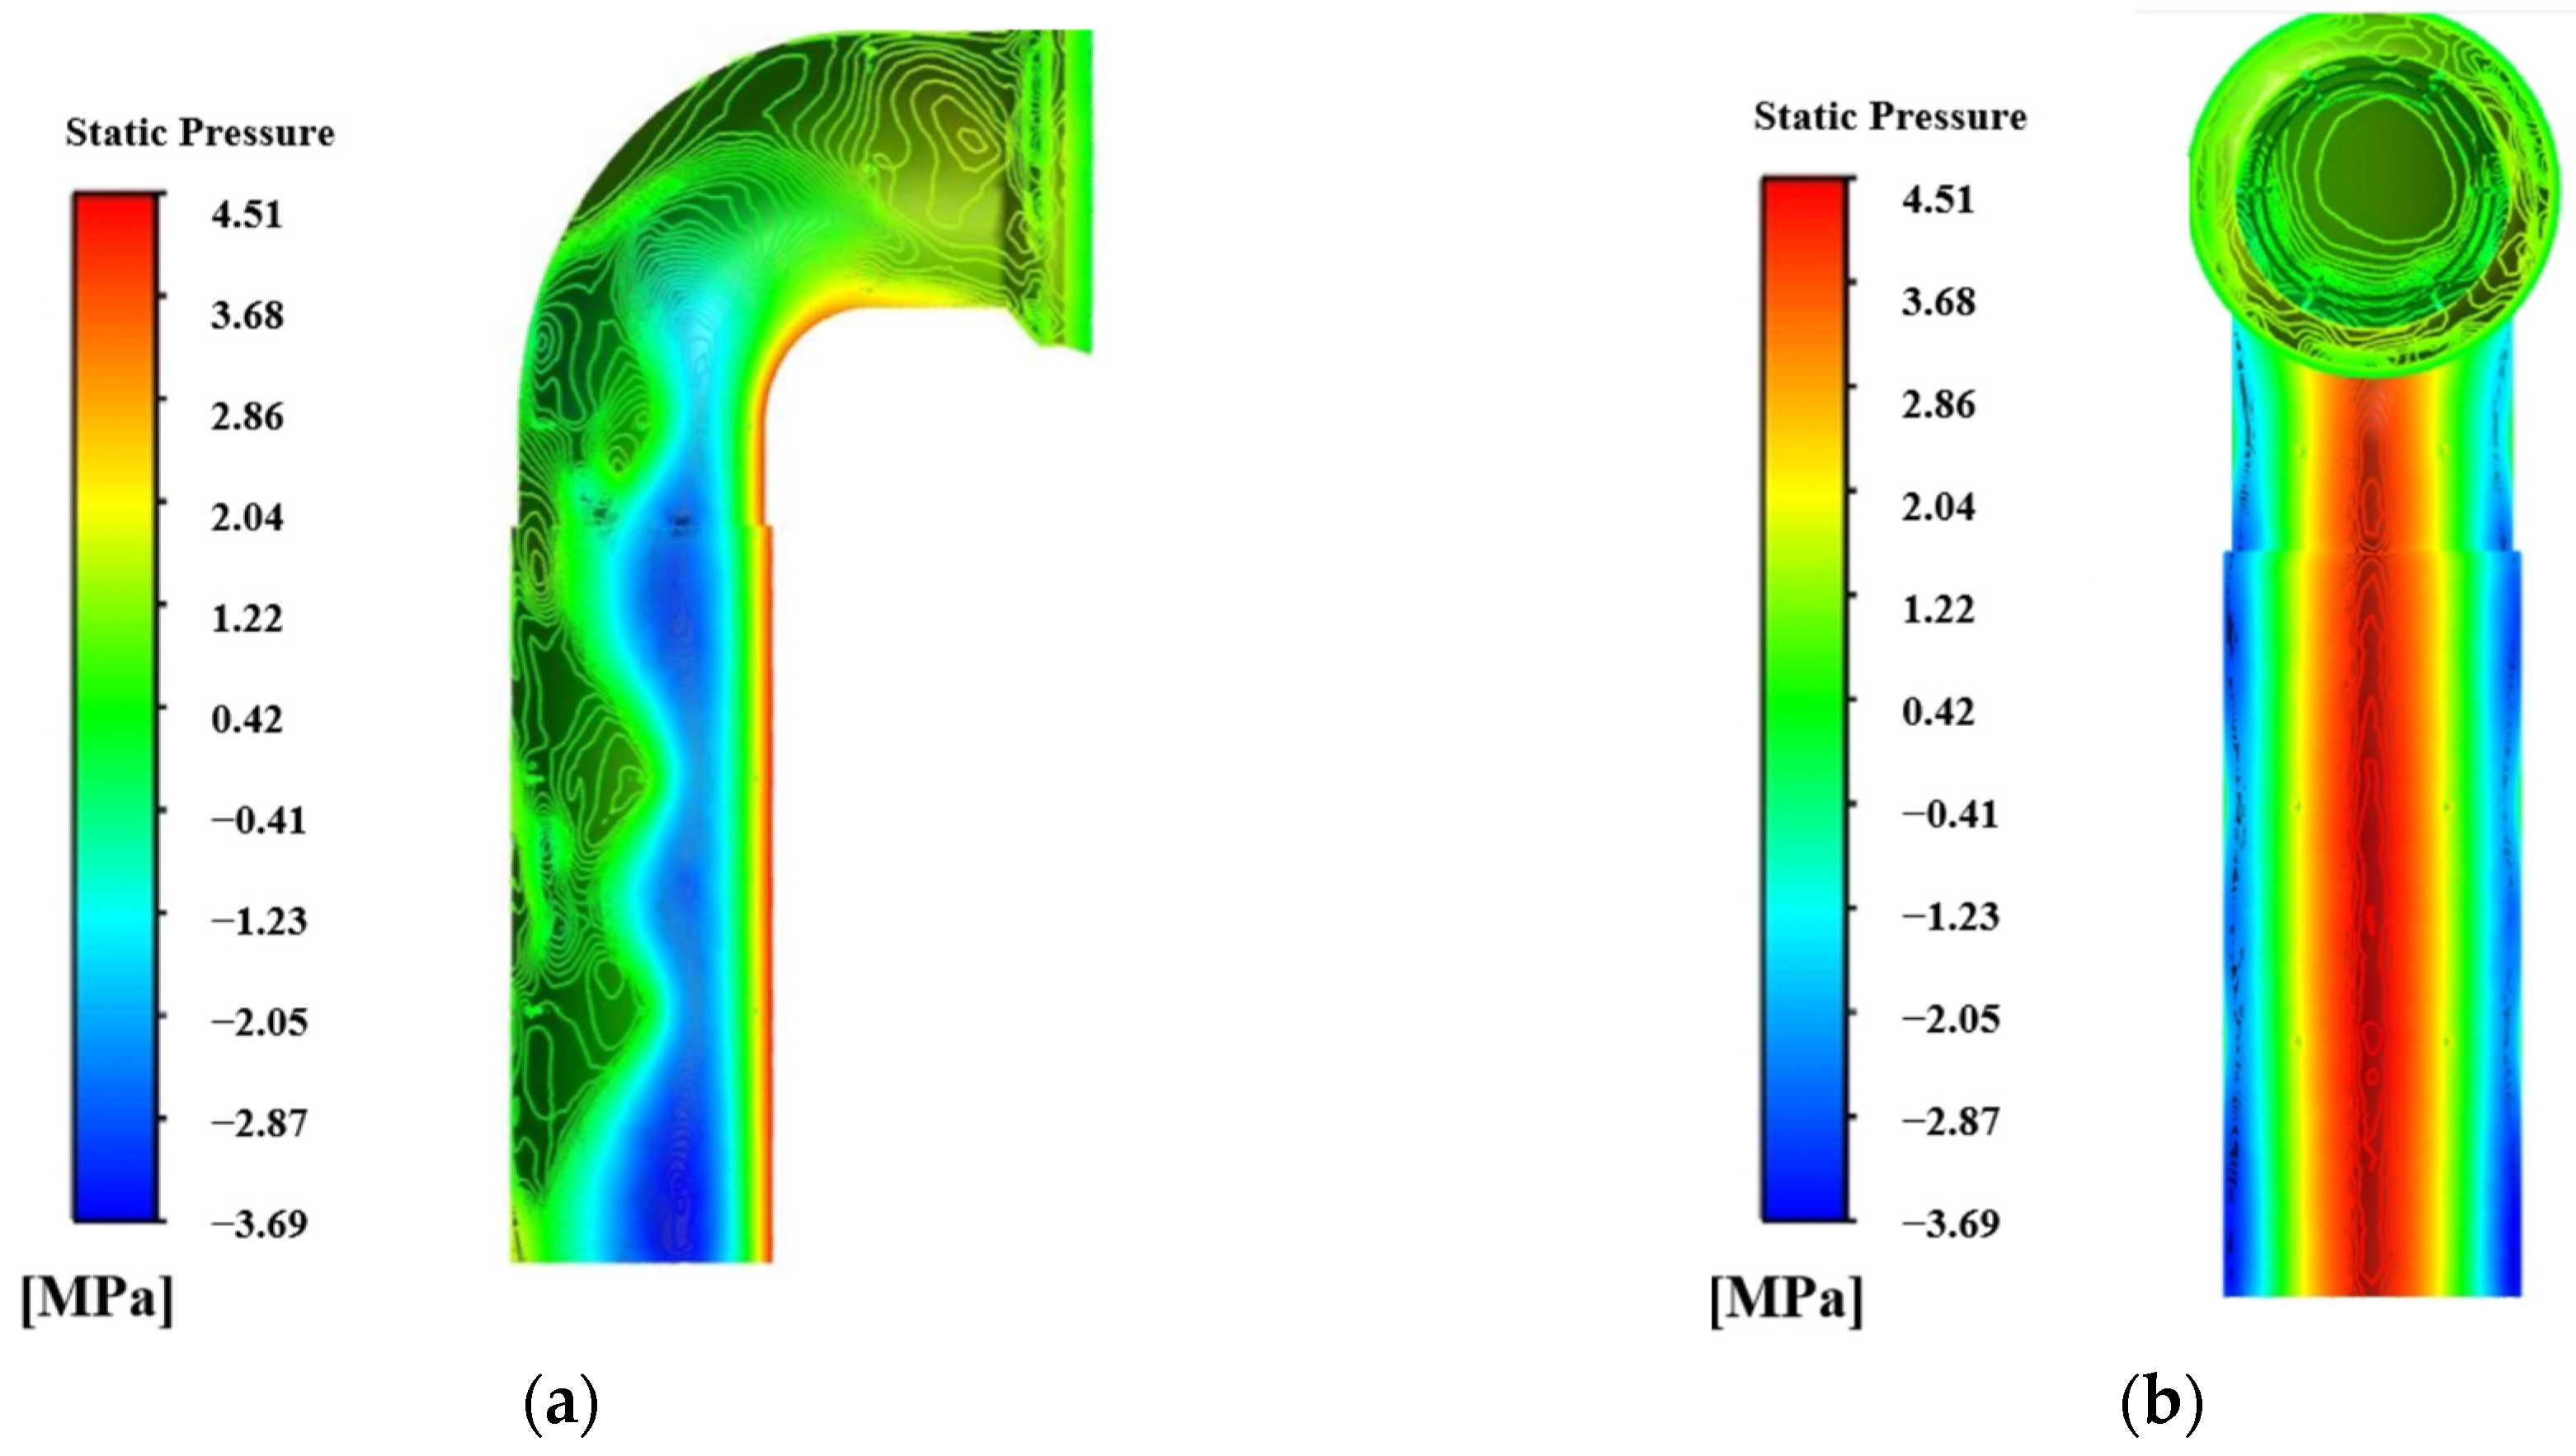
Figure 10 depicts the pressure inside the plugging agent and on its top, at a passage rate of 13 m/s saltwater. Due to the structural characteristics of the 90° elbow, when erosion occurs in various directions, the pressure at the elbow was primarily concentrated in the Z and Y directions, whereby the pressure in the X direction was more evenly distributed, and the pressure equivalence zone was primarily concentrated in the YZ plane. The maximum erosion pressure values in the various erosion directions were comparable, but their pressure contour areas were not. Specifically, the pressure area in the direction of Z to (−Z) was larger, while that in the directions of X to (−Z) and Y to (−Z) was more concentrated and partially exhibited a point-like distribution.
Figure 11 depicts the quantitative model for the maximum pressure of the plugging agent, which changed with the saltwater velocity in the various erosion directions. The highest pressure was 4.19 MPa and as the saltwater velocity rises, the plugging agent pressure also rises and the accumulation of force at the elbow becomes more obvious. The mathematical model is highly correlated, the plugging agent under pressure was linearly correlated with the seawater velocity, where the p-value was less than 0.001 making the result highly significant. Furthermore, the coefficient of determination was 0.984, and the model can be used to calculate the seawater erosion pressure for various flow velocities. The pressure on the plugging agent did not surpass the mechanical parameters of the cured plugging agent, and the highest pressure was significantly lower than the plugging agent’s limit pressure, 143 MPa, which was in accordance with the plugging agent’s sealing requirements.

3.3.2. Results and Discussion on Crude Oil Erosion

A mathematical model of the relationship between the maximum pressure of the plugging agent and the flow rate of crude oil at the leak was established by the numerical simulation test of the crude oil erosion, which examines the pressure variation of the plugging agent at the plugging leak under the influence of various crude oil velocities.
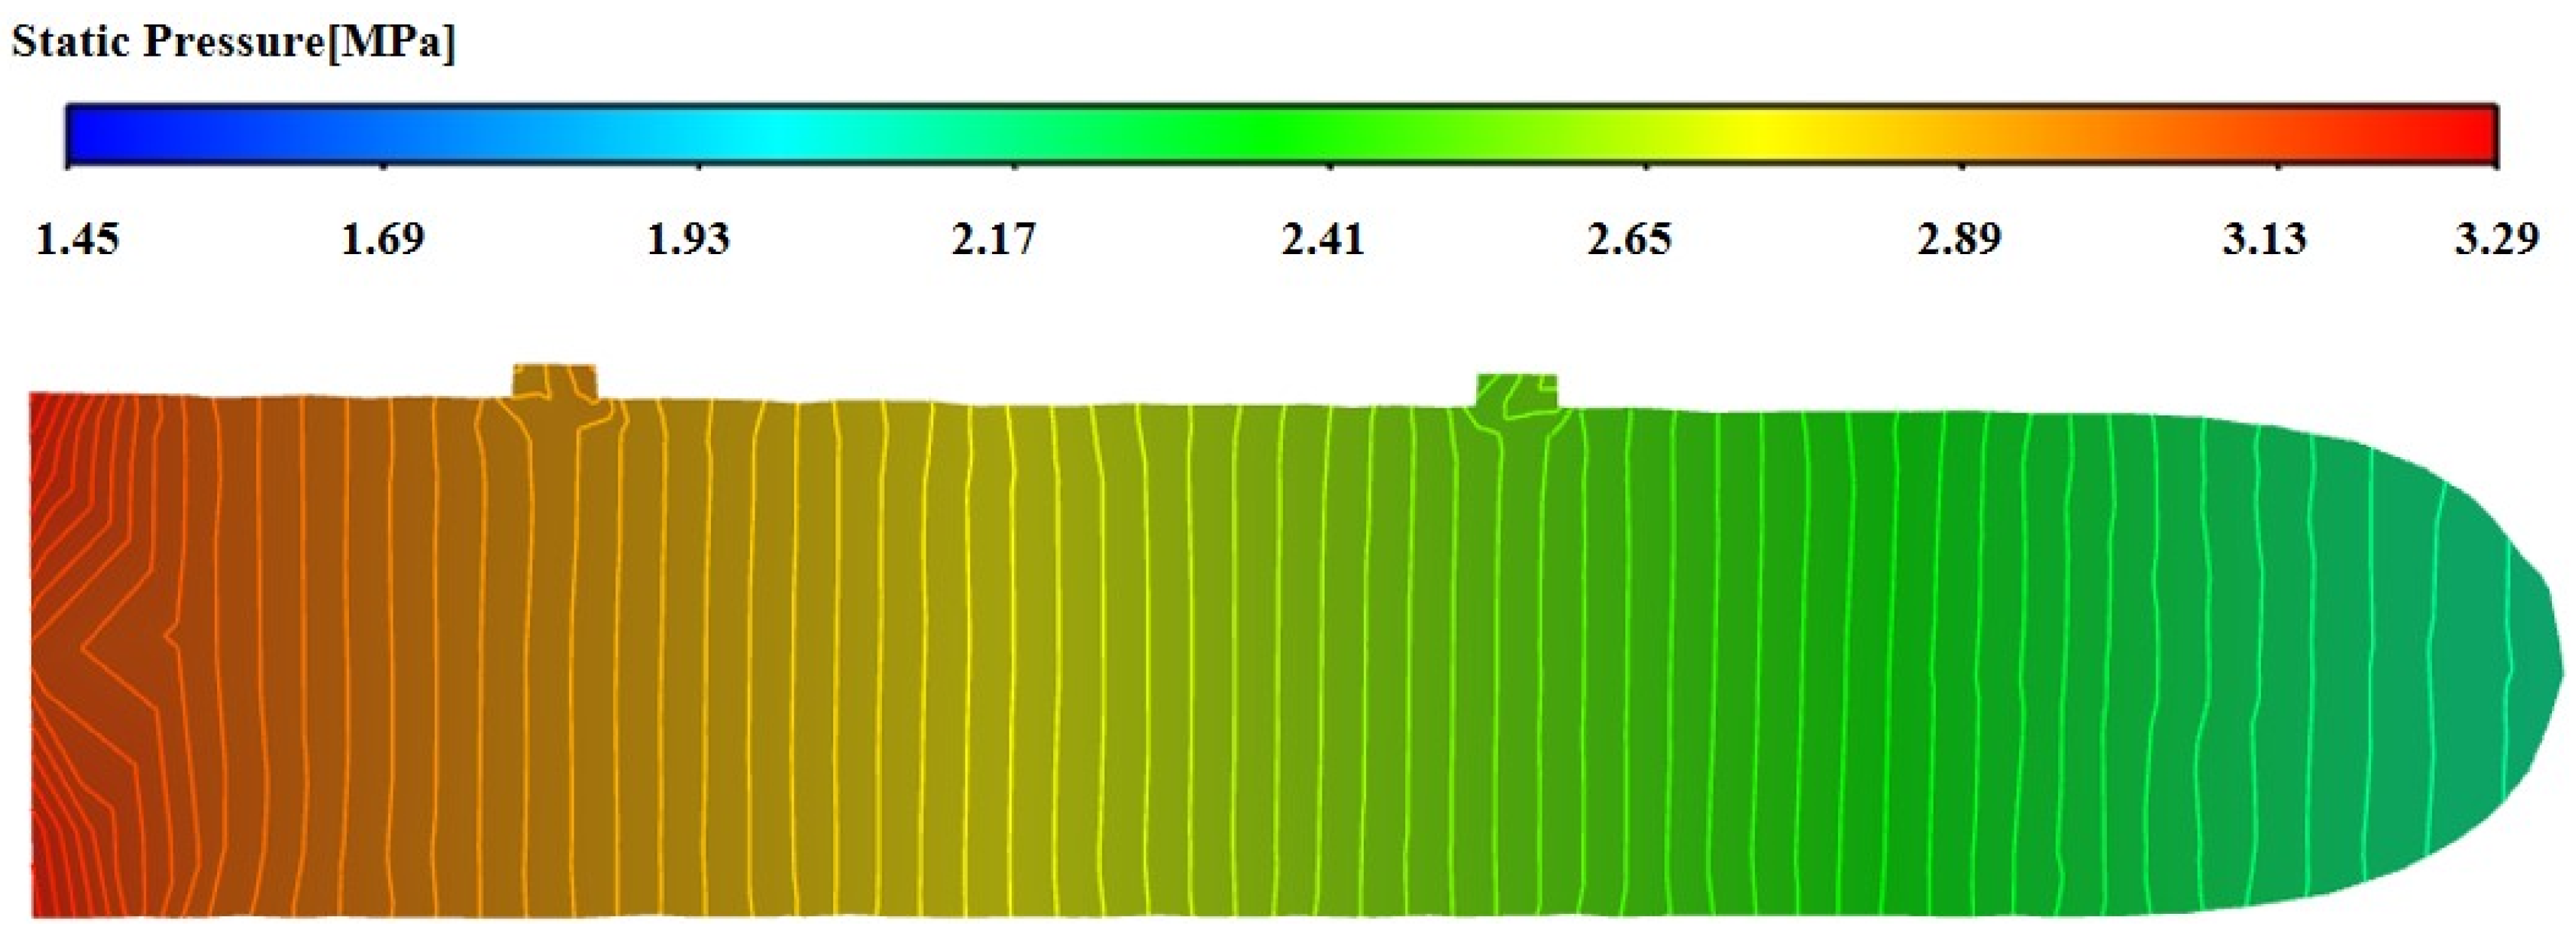
Figure 12 depicts the conduit pressure at a 3 m/s petroleum oil flow rate. The pipeline model’s leak point was exposed to a maximum pressure of 3.29 MPa in the modeling findings of the crude oil erosion on the pipeline sealing impact test, and there was no significant pressure buildup at the pipeline’s elbow. Due to its high viscosity and lower erosion than other liquids during transportation, the petroleum oil exhibited less erosion concentration because the erosion pressure was more consistent.
Figure 13 depicts the quantitative connection between the crude oil flow rate and the highest erosion pressure of the plugging substance at the leak site. With an increase in the flow rate of crude oil, the highest pressure at the leak spot rises, reaching 3.29 Mpa. With a p-value of 0.031, substantial findings were found regarding the erosion pressure being linearly and favorably linked with the flow rate of the petroleum oil, and where the coefficient of determination was 0.997. According to the statistical model, which has a high degree of association, it is possible to determine the erosion pressure of petroleum oil at various flow rates. The cementing limit pressure of 11.6 MPa was much higher than the eroding pressure at the highest velocity, which was much lower than the cementing strength of the plugging agent and the conduit.

4. Conclusions

In this article, in order to handle the rust of undersea production pipeline sinks in offshore oil fields, a novel pipeline repair technique is proposed that combines a non-solid phase silicone plugging agent, an external clamp, and an underwater injection tool. This study examines the non-solid phase silicone plugging agent’s curing features, curing procedure, mechanical properties after curing, and assesses the corrosive effects of internal and exterior crude oil, as well as saltwater on the plugging agent. The following are the study’s major conclusions:
(1)
The optimal quality ratio of the primary agent and curing agent in the plugging agent composition was found to be 100:25. The curing process required the addition of electric stirring, vacuum degassing, and pressurization processes;
(2)
The final compressive and bonding strengths of the plugging agent after solidification were found to be 143 MPa and 11.6 MPa, respectively. The mechanical characteristics of the plugging agent were evaluated to analyze the variation in compressive strength and in cementing strength with displacement;
(3)
The spatial model of the flow field of seawater and crude oil, the numerical model of the outer sleeve and plugging agent, and the analytical method of the complicated flow field of deepwater environment on the erosion impact of plugging agent were all created based on the CFD method;
(4)
Through numerical simulation tests using seawater and crude oil, the mathematical relationships between the maximum pressure of the plugging agent and the velocities of the two fluids were established. The erosion effect of the fluids on the plugging agent was found to be less than their strength limits, thus confirming the viability and efficacy of this new method of pipeline rehabilitation.
The novelty of the grouting clamp type repair method was based on a non-solid phase silicone plugging agent that was originally confirmed by this research as being feasible and successful. The findings indicate that the plugging agent has a greater power and resilience than the conventional approach. By modifying the mechanical model, simulation settings, and the CAD model of the plugging agent and device, the coupled CFD-FEM analysis technique will be used in the subsequent work to evaluate the plugging performance of various structures, materials, and sizes of the plugging agent and device. This will result in the construction plan, size parameters, material parameters, and operational parameters of the new technology being optimized.

Author Contributions

Conceptualization, Y.L. and D.L.; methodology, Y.Y.; validation, Q.X. and J.S.; formal analysis, Q.X.; investigation, Y.L.; resources, X.W.; data curation, Y.Y.; writing—original draft preparation, J.S.; writing—review and editing, D.L. and Y.Y.; supervision, X.W.; project administration, D.L.; funding acquisition, Y.L. All authors have read and agreed to the published version of the manuscript.

Funding

This research received no external funding.

Institutional Review Board Statement

Not applicable.

Informed Consent Statement

Not applicable.

Data Availability Statement

The data that support the findings of this study are available on request from the corresponding author, upon reasonable request.

Conflicts of Interest

The authors declare no conflict of interest.

References

  1. Wei, C. Status and challenges of Chinese deepwater oil and gas development. Pet. Sci. 2011, 8, 477–484. [Google Scholar]
  2. Abbas, M.; Shafiee, M. An overview of maintenance management strategies for corroded steel structures in extreme marine environments. Mar. Struct. 2020, 71, 102718. [Google Scholar] [CrossRef]
  3. Zhu, J.; Li, D.; Chang, W.; Wang, Z.; Hu, L.; Zhang, Y.; Wang, M.; Yang, Z.; Song, J.; Chen, S.; et al. In situ marine exposure study on corrosion behaviors of five alloys in coastal waters of western Pacific Ocean. J. Mater. Res. Technol. 2020, 9, 8104–8116. [Google Scholar] [CrossRef]
  4. Zhao, M.; Liu, M.; Lu, L.; Cheng, L.; An, H.; Draper, S. Local Scour Around Two Subsea Pipelines in An Oscillatory Flow; Taylor & Francis Group: London, UK, 2016; pp. 381–386. [Google Scholar]
  5. Peng, W.; Ma, L.; Wang, P.; Cao, X.; Xu, K.; Miao, Y. Experimental and CFD investigation of flow behavior and sand erosion pattern in a horizontal pipe bend under annular flow. Particuology 2023, 75, 11–25. [Google Scholar] [CrossRef]
  6. Hüsken, G.; Shamsuddoha, M.; Pirskawetz, S.; Hofmann, D.; Baeßler, M.; Kühne, H.-C. Potential of a repair system for grouted connections in offshore structures: Development and experimental verification. Mar. Struct. 2021, 77, 102934. [Google Scholar] [CrossRef]
  7. Igoe, D.; Spagnoli, G.; Doherty, P.; Weixler, L. Design of a novel drilled-and-grouted pile in sand for offshore oil&gas structures. Mar. Struct. 2014, 39, 39–49. [Google Scholar] [CrossRef]
  8. Ju, S.H.; Huang, Y.C. MTMD to increase fatigue life for OWT jacket structures using Powell’s method. Mar. Struct. 2020, 71, 102726. [Google Scholar] [CrossRef]
  9. Foorginezhad, S.; Mohseni-Dargah, M.; Firoozirad, K.; Aryai, V.; Razmjou, A.; Abbassi, R.; Garaniya, V.; Beheshti, A.; Asadnia, M. Recent Advances in Sensing and Assessment of Corrosion in Sewage Pipelines. Process. Saf. Environ. Prot. 2021, 147, 192–213. [Google Scholar] [CrossRef]
  10. Dou, B.; Ding, H.; Mao, X.-Y.; Feng, H.-R.; Chen, L.-Q. Modeling and parametric studies of retaining clips on pipes. Mech. Syst. Signal Process. 2023, 186, 109912. [Google Scholar] [CrossRef]
  11. Yu, J.; Xu, W.; Yu, Y.; Wang, H.; Li, H.; Xu, S.; Han, M. Effectiveness of concrete grouting method for deep-sea pipeline repairs. Thin-Walled Struct. 2021, 169, 108336. [Google Scholar] [CrossRef]
  12. Tziavos, N.I.; Hemida, H.; Dirar, S.; Papaelias, M.; Metje, N.; Baniotopoulos, C.C. Structural health monitoring of grouted connections for offshore wind turbines by means of acoustic emission: An experimental study. Renew. Energy 2020, 147, 130–140. [Google Scholar] [CrossRef]
  13. Tabeshpour, M.R.; Fatemi, M. Optimum arrangement of braces in jacket platform based on strength and ductility. Mar. Struct. 2020, 71, 102734. [Google Scholar] [CrossRef]
  14. Werner, M.; Lohaus, L. Influences of in situ production of grouted joints on aspects of structural safety. Bautechnik 2014, 91, 554–560. [Google Scholar]
  15. Dehghani, A.; Aslani, F. A review on defects in steel offshore structures and developed strengthening techniques. Structures 2019, 20, 635–657. [Google Scholar] [CrossRef]
  16. Dallyn, P.; El-Hamalawi, A.; Palmeri, A.; Knight, R. Prediction of Wear in Grouted Connections for Offshore Wind Turbine Generators. Structures 2017, 10, 117–129. [Google Scholar] [CrossRef] [Green Version]
  17. Chen, T.; Li, Z.; Wang, X.; Yuan, G.; Liu, J. Experimental study on ultimate bending performance of grouted connections in offshore wind turbine support structures. Thin-Walled Struct. 2018, 132, 522–536. [Google Scholar] [CrossRef]
  18. Cao, Y.; Zhang, S. Numerical analysis of cross-section ovalization in the deep-sea pipeline lateral buckling process. Mar. Georesources Geotechnol. 2019, 37, 477–487. [Google Scholar] [CrossRef]
  19. Suleymanov, V.A.; Buznikov, N.A. Multiphase Flow Assurance in an Extentional Subsea Pipeline: Effects of the Transported Fluid Composition and the Pipeline Route Profile. SOCAR Proc. 2021, 92–99. [Google Scholar] [CrossRef]
  20. Li, Y.; Ong, M.C.; Fuhrman, D.R. CFD investigations of scour beneath a submarine pipeline with the effect of upward seepage. Coast. Eng. 2020, 156, 103624. [Google Scholar] [CrossRef]
  21. Hu, D.; Tang, W.; Sun, L.; Li, F.; Ji, X.; Duan, Z. Numerical simulation of local scour around two pipelines in tandem using CFD–DEM method. Appl. Ocean Res. 2019, 93, 101968. [Google Scholar] [CrossRef]
  22. Han, F.; Liu, Y.; Ong, M.C.; Yin, G.; Li, W.; Wang, Z. CFD investigation of blind-tee effects on flow mixing mechanism in subsea pipelines. Eng. Appl. Comput. Fluid Mech. 2022, 16, 1395–1419. [Google Scholar] [CrossRef]
  23. Han, F.; Liu, Y.; Lan, Q.; Li, W.; Wang, Z. CFD Investigation on Secondary Flow Characteristics in Double-Curved Subsea Pipelines with Different Spatial Structures. J. Mar. Sci. Eng. 2022, 10, 1264. [Google Scholar] [CrossRef]
  24. Guo, X.; Stoesser, T.; Zhang, C.; Fu, C.; Nian, T. Effect of opening and wall boundaries on CFD modeling for submarine landslide-ambient water-pipeline interaction. Appl. Ocean Res. 2022, 126, 103266. [Google Scholar] [CrossRef]
  25. Guo, X.; Liu, X.; Luo, Q.; Chen, B.; Zhang, C. Dimensional effect of CFD analysis for submarine landslides interactions with infinite suspension pipelines. Ocean Eng. 2022, 266, 113094. [Google Scholar] [CrossRef]
  26. Fraga, V.S.; Yin, G.; Ong, M.C.; Myrhaug, D. CFD investigation on scour beneath different configurations of piggyback pipelines under steady current flow. Coast. Eng. 2021, 172, 104060. [Google Scholar] [CrossRef]
  27. Zhao, X.; Cao, X.; Zhang, J.; Cao, H.; Zhang, J.; Peng, W.; Bian, J. Experimental and numerical investigation of erosion in plugged tees for liquid-solid flow. Int. J. Multiph. Flow 2023, 160, 104348. [Google Scholar] [CrossRef]
  28. Yin, G.; Ong, M.C.; Zhang, P. Numerical investigations of pipe flow downstream a flow conditioner with bundle of tubes. Eng. Appl. Comput. Fluid Mech. 2023, 17, e2154850. [Google Scholar] [CrossRef]
  29. Umuteme, O.M.; Islam, S.Z.; Hossain, M.; Karnik, A. An improved computational fluid dynamics (CFD) model for predicting hydrate deposition rate and wall shear stress in offshore gas-dominated pipeline. J. Nat. Gas Sci. Eng. 2022, 107, 104800. [Google Scholar] [CrossRef]
  30. Rossiello, G.; Uzair, M.A.; Ahmadpanah, S.B.; Rogora, M.; Saponaro, A.; Torresi, M. Integrated use of CFD and field data for accurate thermal analyses of oil/gas boilers. Fuel 2023, 335, 126931. [Google Scholar] [CrossRef]
  31. Silva, M.C.F.; Campos, J.B.L.M.; Araújo, J.D.P. 3D numerical study of a single Taylor bubble rising along an inclined tube through Newtonian and non-Newtonian liquids. Chem. Eng. Process.-Process Intensif. 2023, 183, 109219. [Google Scholar] [CrossRef]
  32. Chen, J.; Anastasiou, C.; Cheng, S.; Basha, N.M.; Kahouadji, L.; Arcucci, R.; Angeli, P.; Matar, O.K. Computational fluid dynamics simulations of phase separation in dispersed oil-water pipe flows. Chem. Eng. Sci. 2023, 267, 118310. [Google Scholar] [CrossRef]
  33. Kazemzadeh, H.; Amani, H.; Kariminezhad, H. Evaluation of pipeline networks to predict an increase in crude oil flow rate. Int. J. Press. Vessel. Pip. 2021, 191, 104374. [Google Scholar] [CrossRef]
  34. Xia, J.; Li, Z.; Jiang, J.; Wang, X.; Zhang, X. Effect of Flow Rates on erosion corrosion behavior of hull steel in real seawater. Int. J. Electrochem. Sci. 2021, 16, 210532. [Google Scholar] [CrossRef]
  35. Yuan, Q.; Wu, C.; Yu, B.; Han, D.; Zhang, X.; Cai, L.; Sun, D. Study on the thermal characteristics of crude oil batch pipelining with differential outlet temperature and inconstant flow rate. J. Pet. Sci. Eng. 2018, 160, 519–530. [Google Scholar] [CrossRef]
  36. Zhu, H.; Lei, Y.; Li, C.; Yao, B.; Yang, F.; Li, S.; Peng, H.; Yu, P. Experimental and mechanism investigation on flowability and wax deposition of waxy crude oil with dissolved CH4 by pressurized laboratory apparatus. Fuel 2023, 343, 127907. [Google Scholar] [CrossRef]
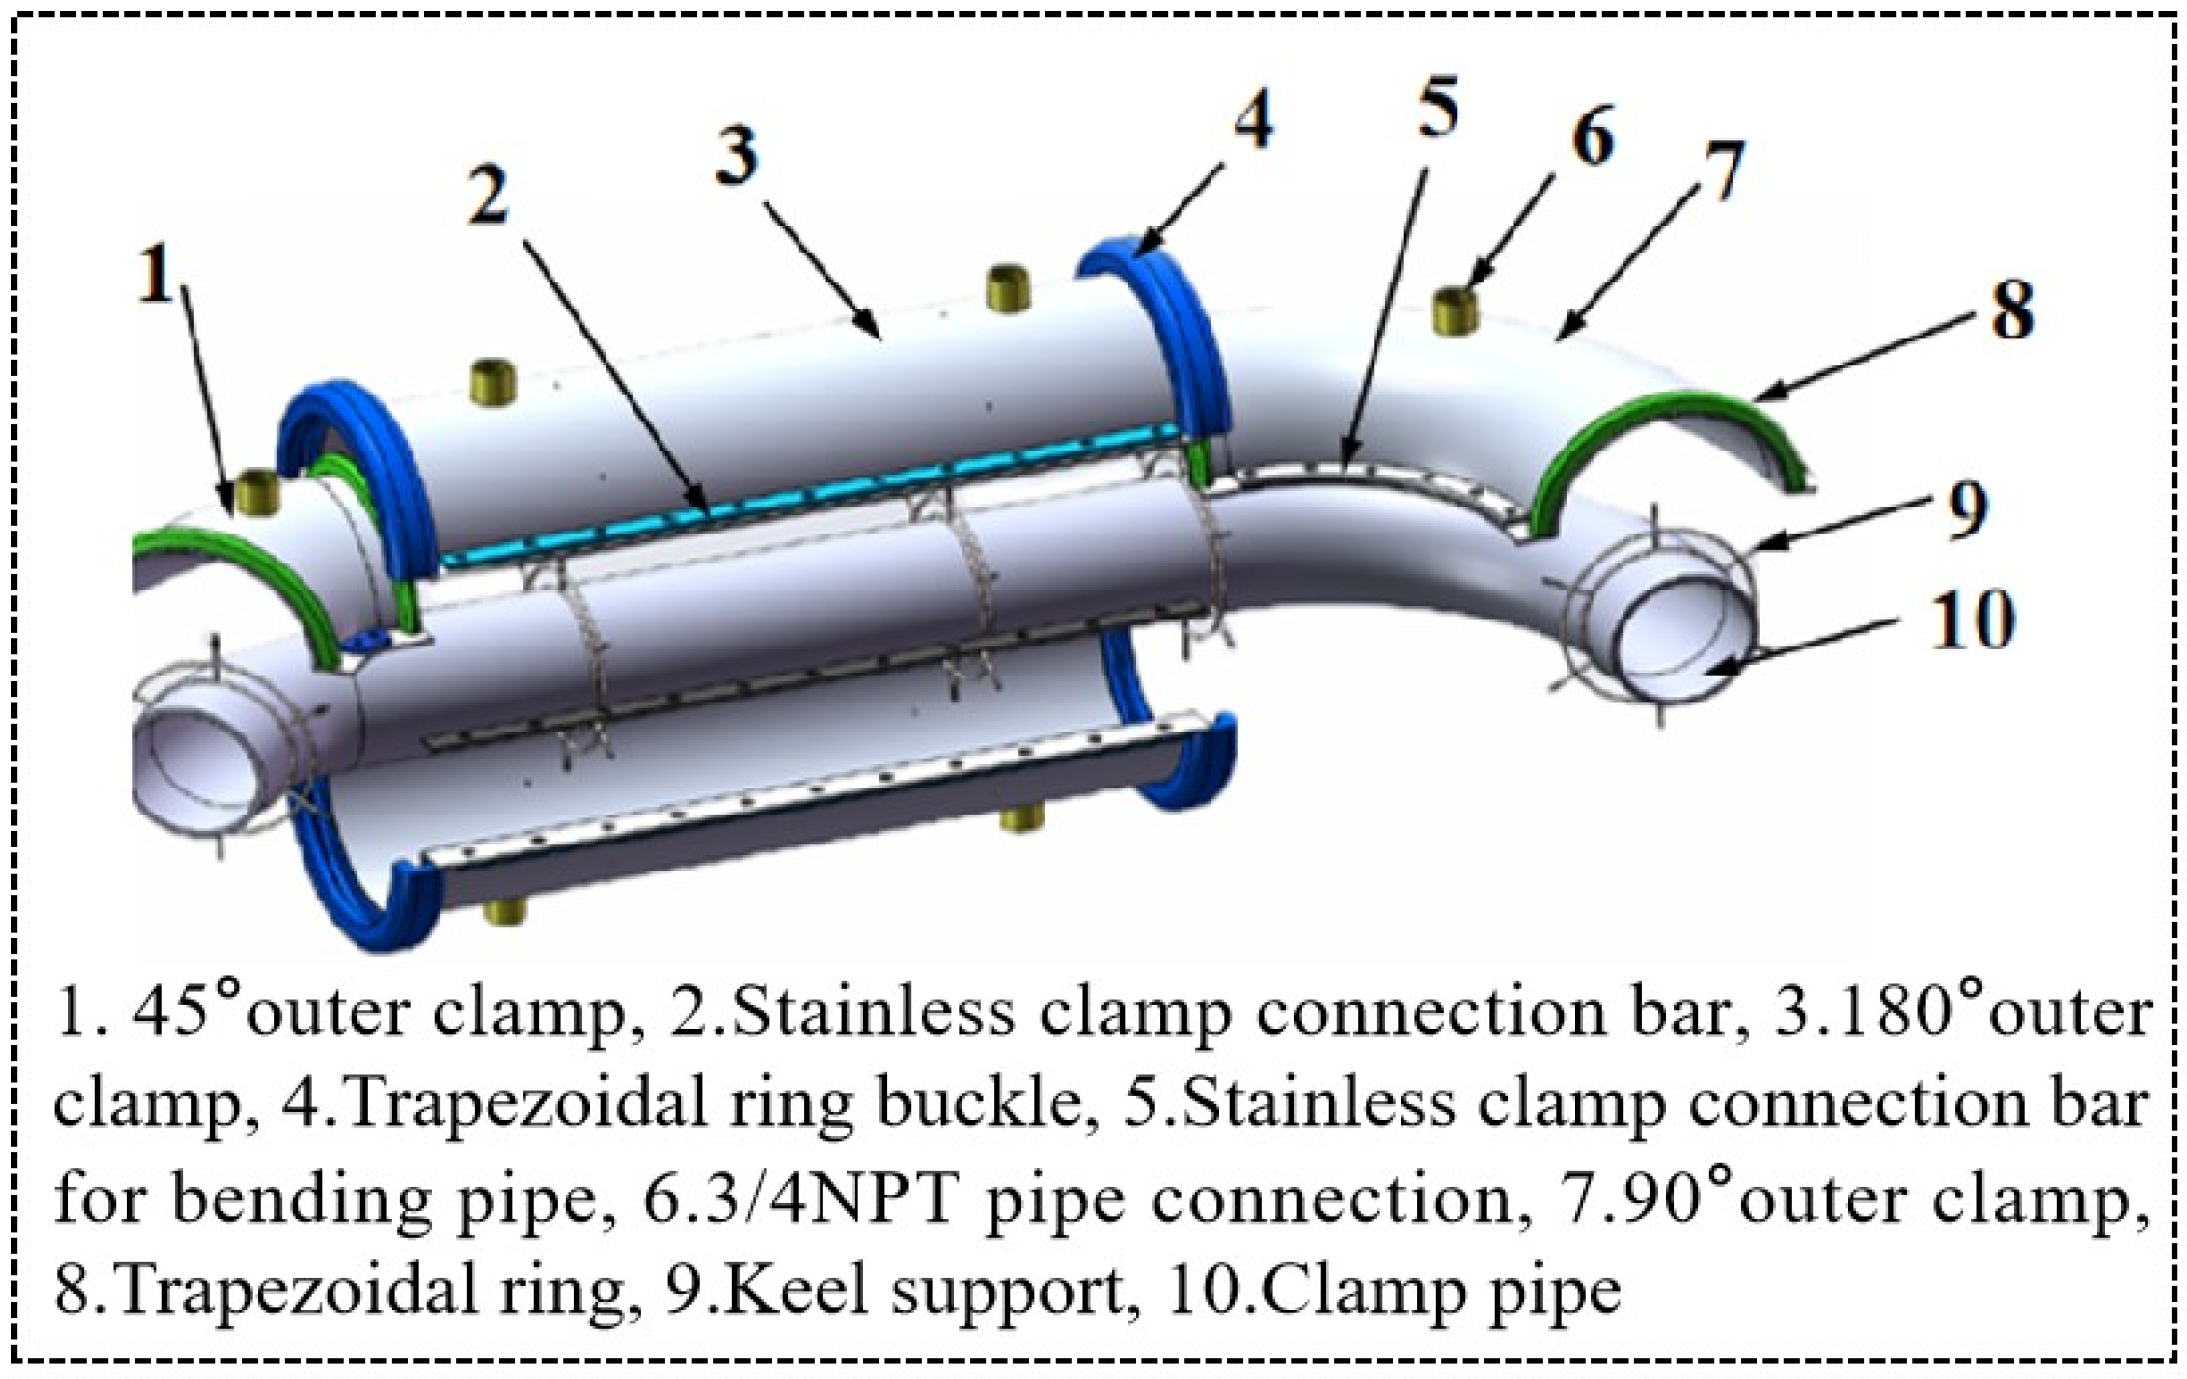
Figure 1. The external clamp’s structure and components.
Processes 11 01142 g001
Figure 2. Test materials and setup: (a) offshore oil transfer conduit and exterior sleeve construction; (b) dispensing condition for plugging agents.
Processes 11 01142 g002
Figure 3. A numerical model of the exterior clamp and the plugging substance: (a) models of the exterior clamp; (b) models of the plugging agent substance.
Processes 11 01142 g003
Figure 4. Seawater and petroleum oil flow field spatial model.
Processes 11 01142 g004
Figure 5. The grid delineation quality independent study: (a) relationship between maximum pressure and mesh size for oil erosion; (b) relationship between maximum pressure and mesh size for seawater erosion.
Processes 11 01142 g005
Figure 6. The time step sensitivity study: (a) relationship between maximum pressure and step time for oil erosion; (b) relationship between maximum pressure and step time for seawater erosion.
Processes 11 01142 g006
Figure 7. Plugging agent dispensing test: (a) the plugging agent leaking and not being in a fully filled state after curing; (b) the improved sleeve closure and plugging agent micro-crack state; and (c) the plugging agent curing success state.
Processes 11 01142 g007
Figure 8. Test findings for the compressive strength of plugging agents: (a) the compressive strength displacement variant; (b) each group’s greatest compressive strength.
Processes 11 01142 g008
Figure 9. Test findings for the pipe wall bonding strength of the plugging agents: (a) the tensile displacement variant; (b) each group’s greatest tensile strength.
Processes 11 01142 g009
Figure 10. Examples of the test findings for seawater erosion: (a) YZ plane pressure cloud; (b) XY plane pressure cloud.
Processes 11 01142 g010
Figure 11. Relationship between maximum pressure of plugging agent and seawater flow velocity and mathematical model.
Processes 11 01142 g011
Figure 12. The interior pressure condition caused by crude oil erosion.
Processes 11 01142 g012
Figure 13. Relationship between maximum pressure of plugging agent and crude oil flow velocity and mathematical model.
Processes 11 01142 g013
Table 1. Plugging substance curing test amounts based on various variables.
LabelLiquid Mass Ratio (I:II)Method of StirringCondition of Pressure
1100:10Hand stirring before pouringArtificial pressure
2100:15Electric stirring before pouringNo pressure
3100:22
4100:25
Table 2. Parameter settings for the seawater fluid space model.
LabelFlow DirectionFlow Velocity
1X~(−X)1 m/s
2X~(−Y)3 m/s
3X~(−Z)5 m/s
4Y~(−Z)7 m/s
5Y~(−Y)11 m/s
6Z~(−Z)13 m/s
Table 3. Simulation parameters of the turbulence model.
ParametersValue
Seawater viscosity, cP1.03
Seawater density, kg/m31300
Seawater velocity, m/s0~13
Crude oil viscosity, cP180
Crude oil density, kg/m3950
Crude oil velocity, m/s0~3
Plugging agent density, kg/m3700~2400
Temperature, °C−20~240
Liquid plugging agent viscosity, cP30~60
Environmental pressure, MPa3.1
Disclaimer/Publisher’s Note: The statements, opinions and data contained in all publications are solely those of the individual author(s) and contributor(s) and not of MDPI and/or the editor(s). MDPI and/or the editor(s) disclaim responsibility for any injury to people or property resulting from any ideas, methods, instructions or products referred to in the content.